
Introduction
Thermo-acoustic instabilities are frequently observed in various combustion systems, including aero engines and gas turbines. Thermo-acoustic instabilities occur when the heat release and acoustic pressure are in phase. Heat release rate fluctuations give rise to pressure fluctuations and reversely pressure fluctuations influence the unsteady heat release. Thermo-acoustic instabilities are also called combustion oscillation. The Rayleigh criterion states that combustion oscillation occurs when the heat release pulsation of the flame provides more energy to the sound field than the inherent acoustic dissipation of the system. When combustion oscillation occurs, huge noise and system resonance will happen, which may do harm to the life of the combustion system. Studies (Schuller et al., 2003; Huang and Yang, 2004; Weigand et al., 2006) show that there are many factors that may induce combustion oscillations, including vortex shedding, swirling, inlet temperature, insufficient gas supply and flow fluctuation. For premixed combustion, the vortex can not only influence the flame front, but also generate noise and interact with the combustion process. Study (Selle et al., 2006) shows that combustion oscillations usually occur usually in the corresponding acoustic mode of the combustion chamber, but also sometimes a coupled mode of acoustic and gas convection (Pankiewitz and Sattelmayer, 2003).
It is well known that swirling flames are quite sensitive to acoustic waves. The interaction between heat release and acoustic waves might lead to the self-sustained thermo-acoustic oscillations. There are many experimental and numerical investigations about combustion oscillations of swirling flames. The flame dynamics under external-force excitation was studied by using ICCD, which states unsteady heat release is due to the velocity pulsation (Palies et al., 2010). In a recent study, Li et al. (2015) investigated the effect of acoustic perturbation on the hear release pulsation. Kim et al. (2010) studied the dynamics of flame by OH*, CH* and CO2* chemiluminescence for different synthesis gas. Weigand et al. (2006) studied the reaction zone structure of the swirling flame by using OH* PLIF and PIV techniques, and pointed out that the Proceeding Vortex Core influenced the unstable combustion mode. Min et al. (2015) used high-speed OH* chemiluminescence intensity of different synthesis gas, and obtained instability mode by using Proper Orthogonal Decomposition. Huang et al. (2012) studied the combustion dynamics in a premixed swirl-stabilized combustor with numerical and showed that the inlet temperature influences the stability characteristic. Guo et al. (2009) studied the flame structure of the lean premixed swirling flame and pointed out that coupling between the flow pulsation and the heat release pulsation was the main reason for combustion instability.
Generally, the swirling flames are the main focus during previous investigations. The behaviour of the downstream hot gas is rarely studied. However, in aero-engines, the hot burnt gases from the combustion chamber have important effects to the downstream turbine vanes, which may induce hot spot. Thus, diagnostic studies on the downstream hot gas of the swirling flame is interesting and also with practical value. In the present work, the characteristic modes of unstable combustion are experimentally investigated. Especially, the features of the downstream hot burnt gas under unstable combustion are discussed.
This paper is structured as follows. The experimental configuration and condition are briefly described in Experimental configurations. Experimental results are presented and discussed in Experimental results and discussion. Finally, the conclusions are drawn in the last section.
Experimental configurations
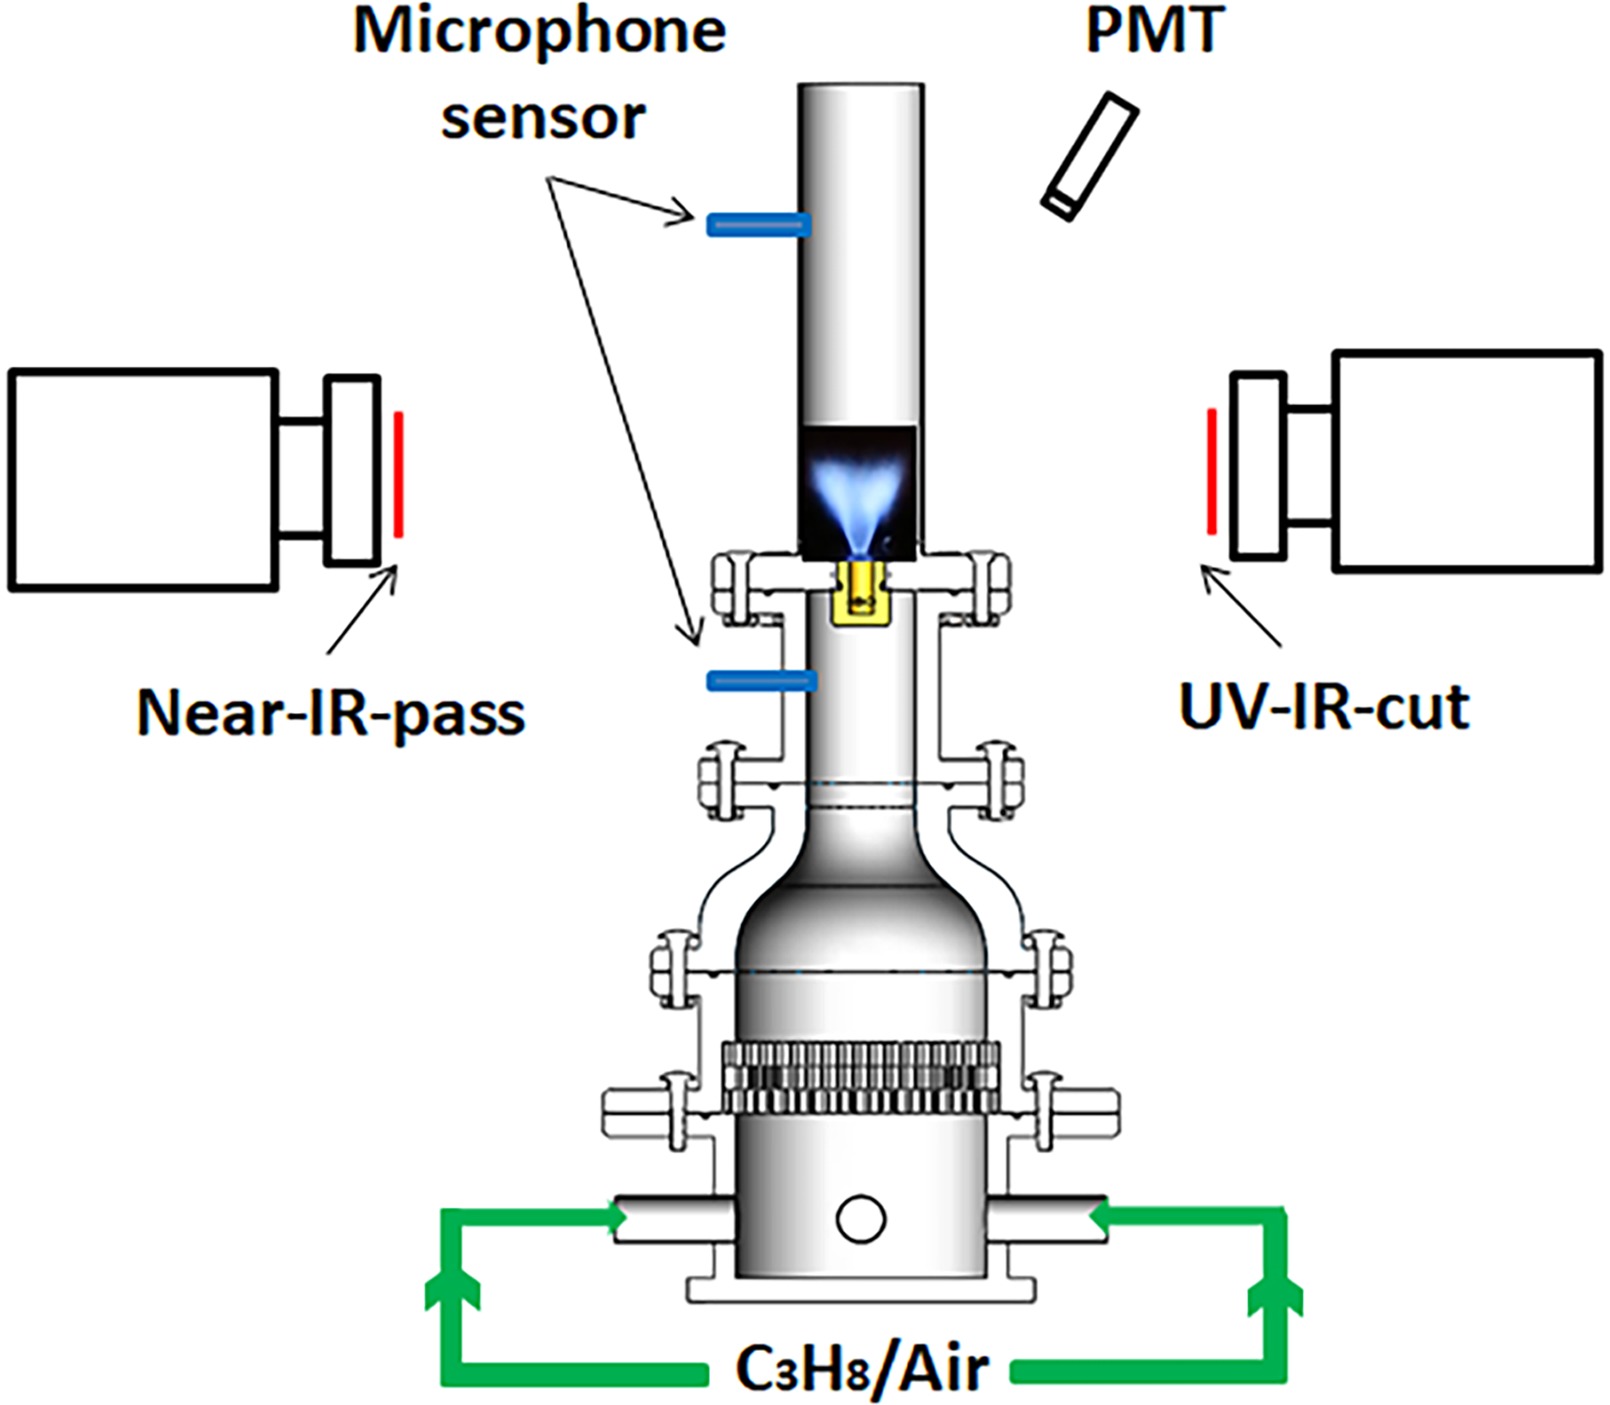
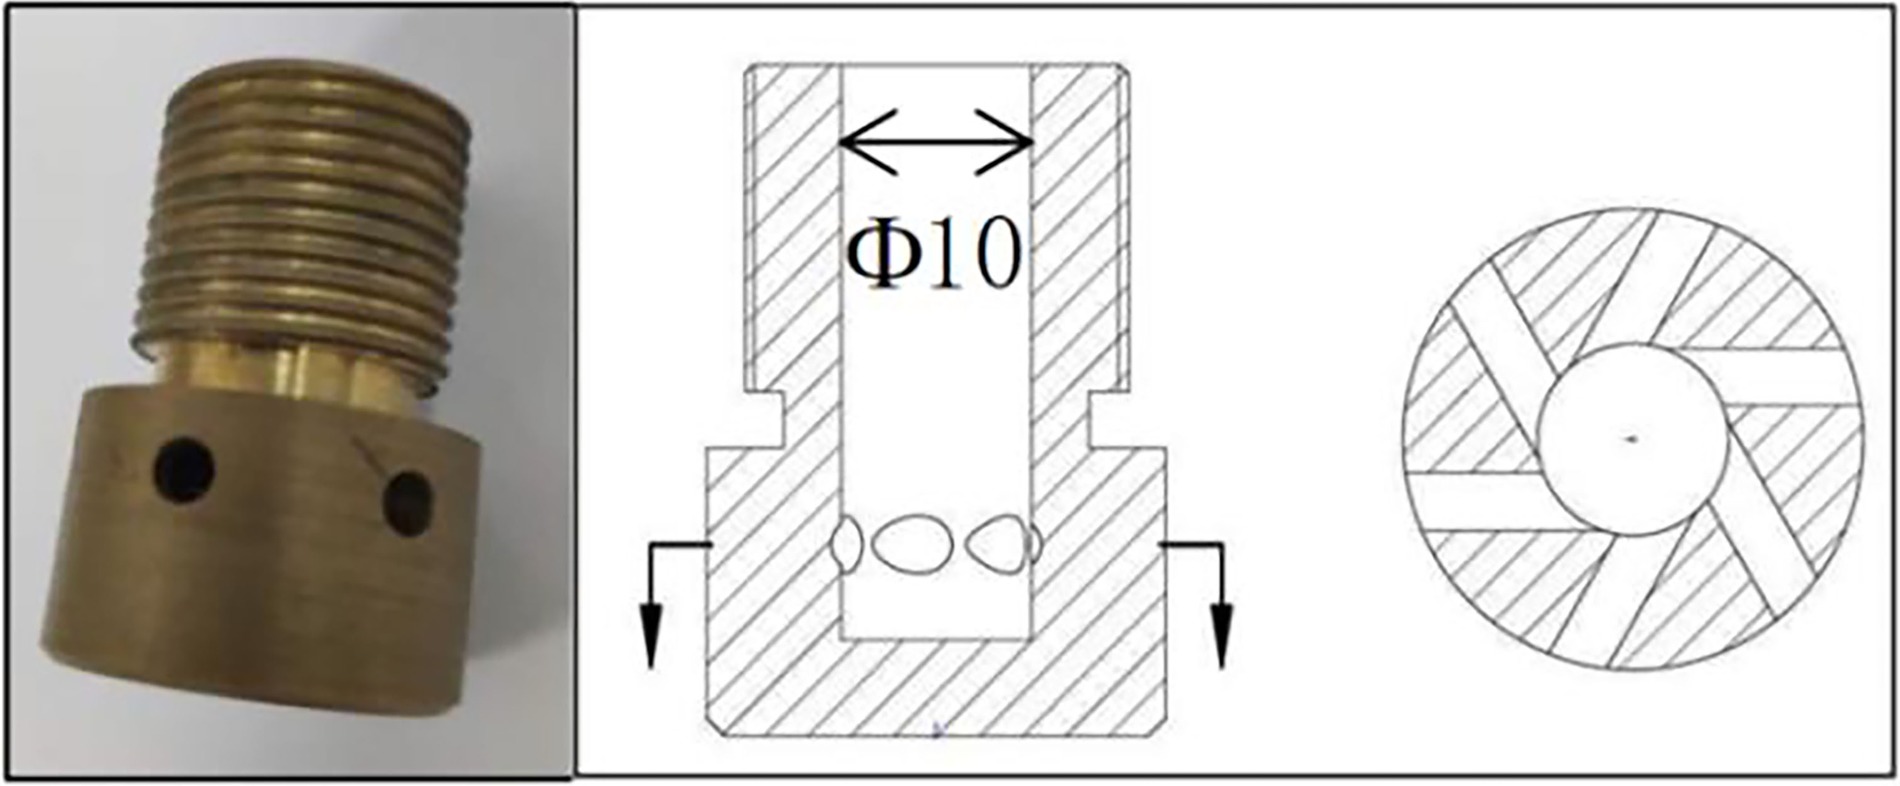
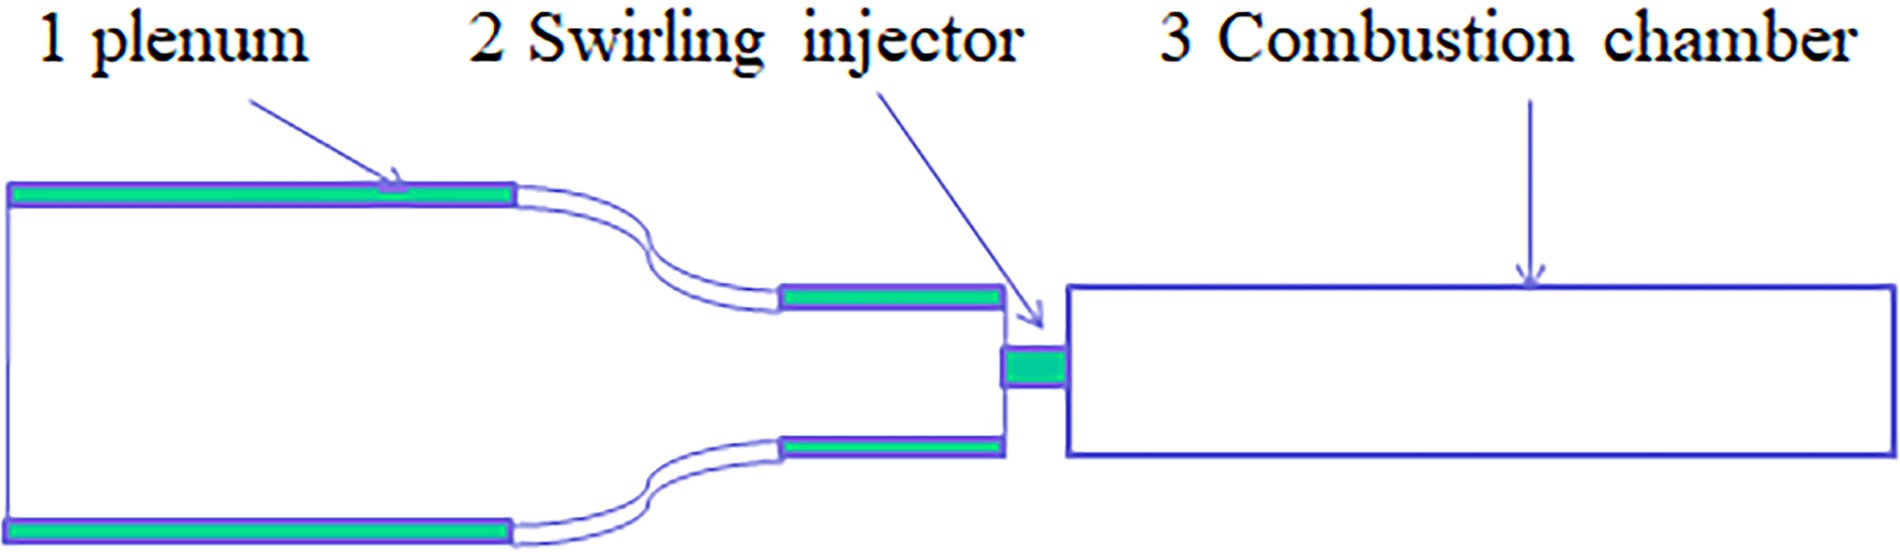
The single-burner combustor is displayed in Figure 1. The combustor is made of plenum, swirling injector and combustion chamber. The propane and air are delivered through a Venturi-tube to perfectly mixed and then conveyed into the plenum by four supplying pipes to avoid equivalence ratio fluctuations. The premixed mixtures flow through a set of grids to obtain a roughly uniform distribution of axial velocity over the whole cross-section. The convergent nozzle takes the similar role as the girds. Finally, the premixed gas is fed to the combustion chamber through a swirling injector. The parameter of the swirling injector is shown in Figure 2. The diameter of the swirling injector tube is 10 mm, and the swirl number is 0.82. The combustion chamber is made of cylindrical quartz tube with 50 mm inner diameter and 200 mm height. The sequences are recorded by fast speed camera PCO dimax-HD and Phantom M110. The frame rate and shutter time were set at 2000 Hz and 500 µs for both cameras, respectively. A UV-IR-cut filter (400–680 nm) is adopted on one lens to capture chemiluminesence intensity from the CH*, C2* and CO2* in the flame fronts. A Near-IR-pass filter (780–2000 nm) is mounted on the other camera's lens to record the hot burnt gas on the downstream of swirling flame. The Photomultiplier (PMT), equipped with 293–323 nm filter, is located at a distance of 500 mm from the swirling burner axis. The PMT is used to record the OH* chemiluminescence intensity. It has been demonstrated that the intensity of OH* signal is nearly proportional to heat release rate by Schuller et al. (2002). Two microphone sensors are adopted to record the acoustic pressure signals in both combustion chamber and plenum. The positions of microphone sensors are presented in Figure 1, One is 20 mm far from the bottom of the swirling injector, the other is 150 mm away from the swirling injector outlet plane. Simultaneous acquisitions of all instruments are controlled by DG535 in the experiment.
All the experiments are carried out at ambient conditions (T = 293 K, P0 = 1 bar), and all the measurements presented in this study are carried out in steady thermal state.
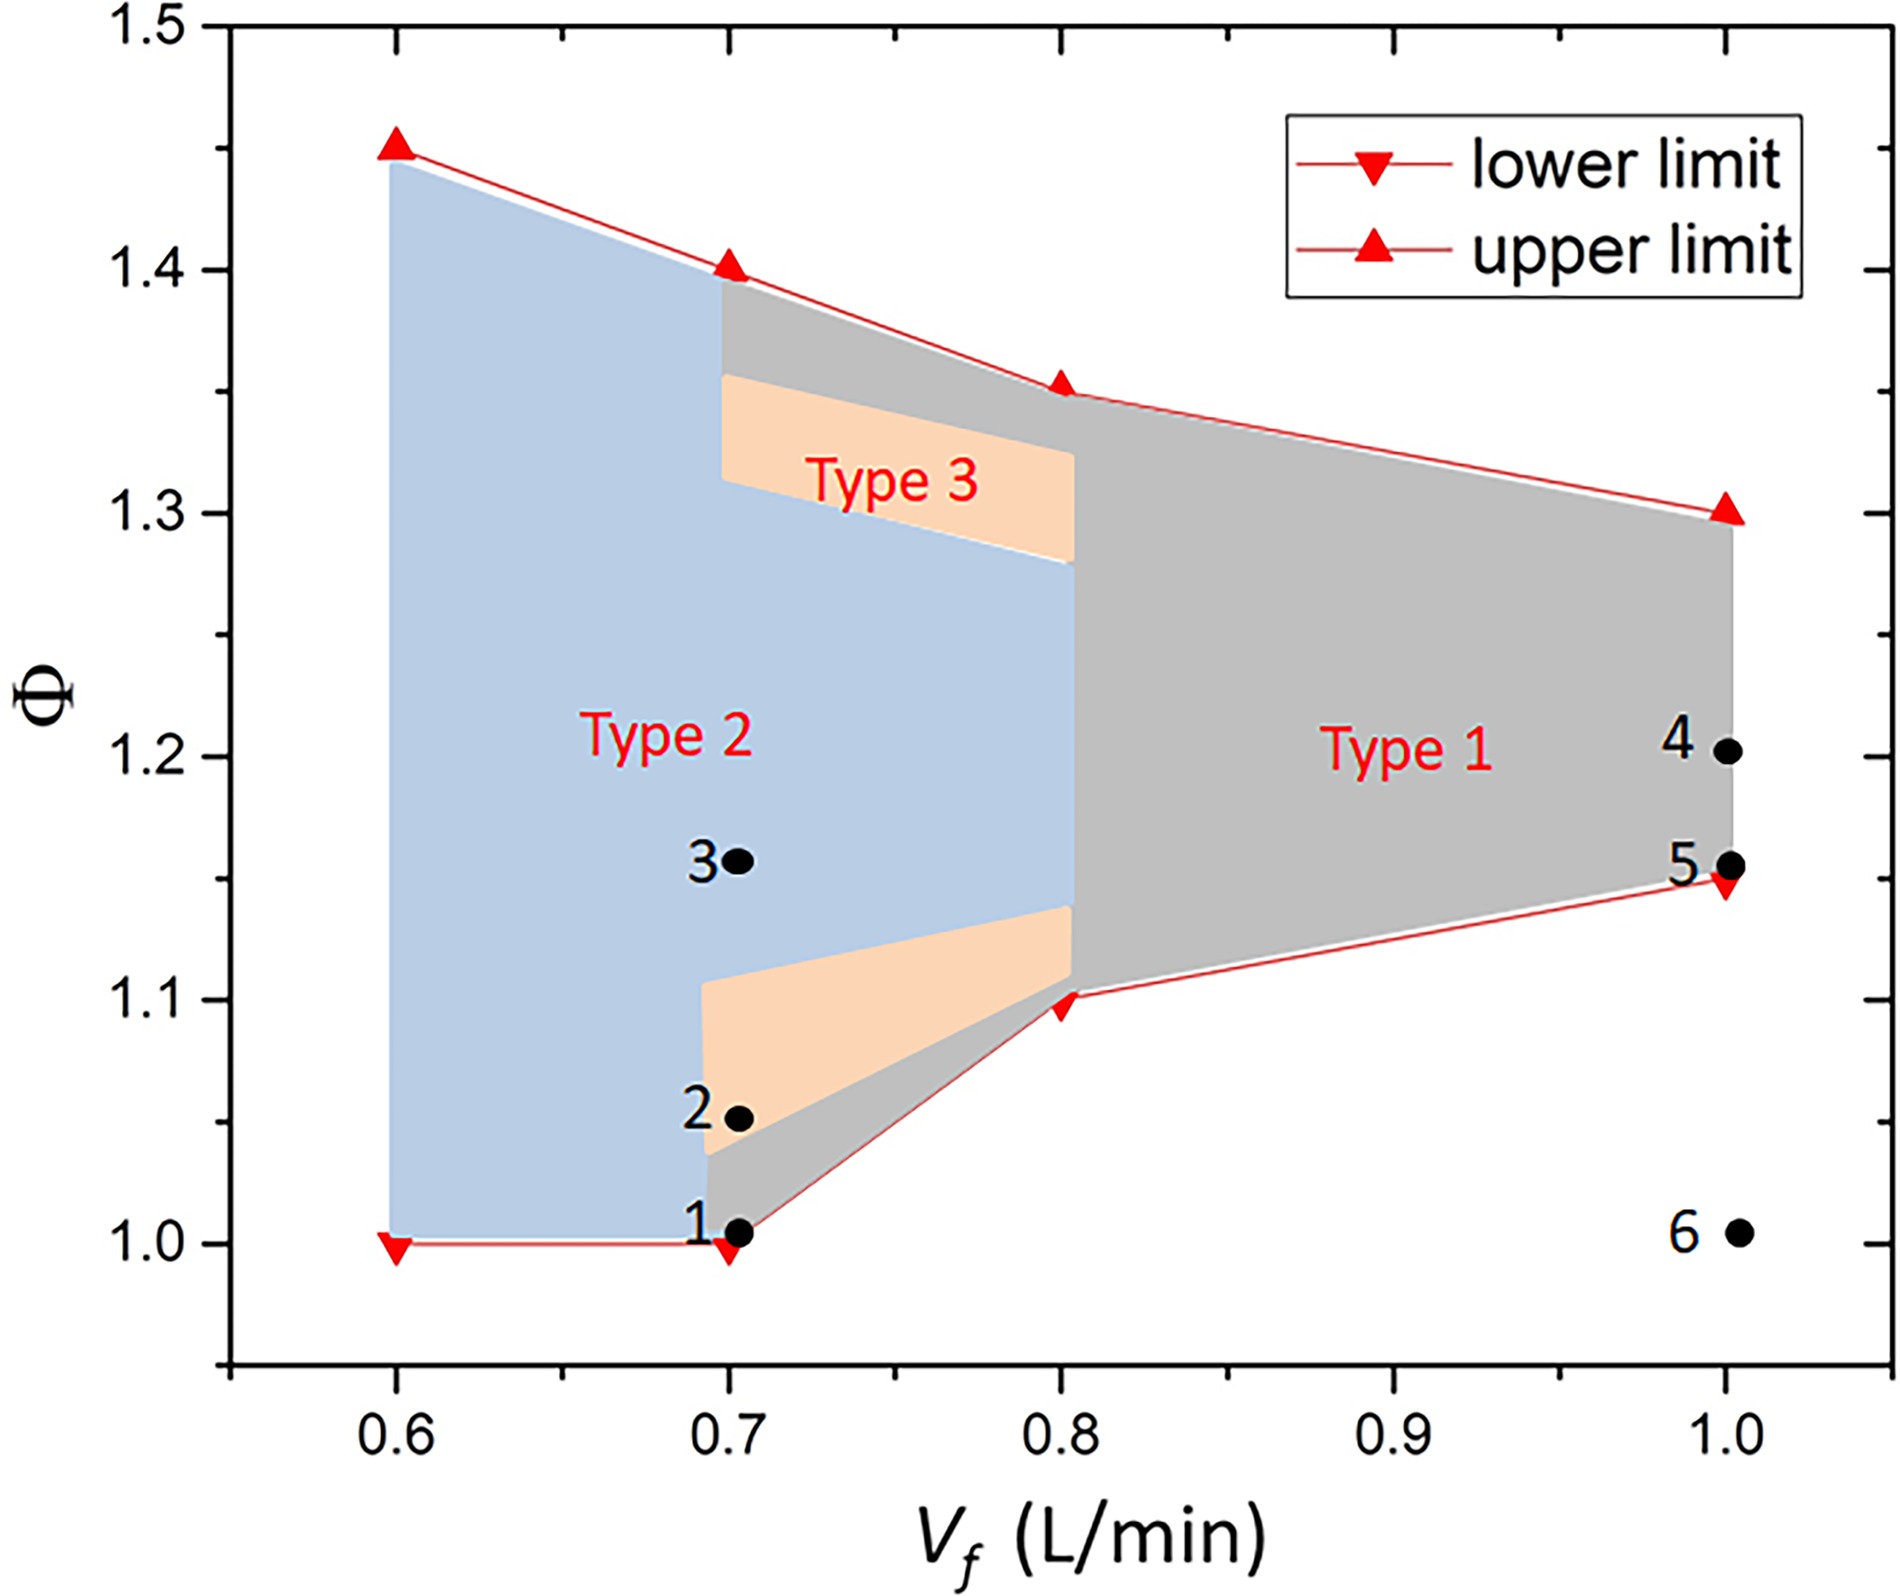
The working conditions of six chosen cases are listed in Table 1, which are also marked out in Figure 3. All chosen cases are in unstable combustion except for Case 6.
Experimental results and discussion
Stability map
The Reynolds number of experiments ranges from Re = 1543 to 3666, which corresponds to the bulk velocity ranging from Ub = 2.32 to 5.52 m/s. The stability map is plotted in Figure 4. It can be observed that unstable combustion occurs in rich-fuel zone (Φ equivalence is over 1.0). Three types of combustion instability were found in the experiments, which are named as Type-1, Type-2 and Type-3, respectively. The partition of the three types is based on the frequency of the unstable mode.
As the flow rate of fuel decreases, combustion instability occurs in a wider range. When the flow rate of propane is in the range of Vf = 0.8–1.0 L/min, unstable combustion is in Type-1. When the flow rate of propane is in the range of Vf = 0.6–0.7 L/min, unstable combustion is in Type-2. When the flow rate of propane is in the range of Vf = 0.7–0.8 L/min, these three types of combustion instability may occur as the equivalence ratio changes.
Unstable modes
The combustor in present work shown in Figure 4 is a typical three-duct system. According to the acoustic analysis, there may be several typical acoustic resonant modes in this kind of combustor. When the coupled factor
The DMD method developed by Schmid and Sesterhenn (2010) was adopted to study the snapshot sequences taken by the high-speed camera with UV-IR-cut filter. The frame rate of the camera is 2000 Hz. Meanwhile, one thousand consecutive sequences were adopted for DMD analysis. The DMD spectrums for Case 1, Case 2 and Case 3 are shown in Figure 5. Meanwhile, Figures 6 and 7 shows the FFT spectrums of OH* chemiluminesence intensity and acoustic pressure, respectively. The OH* chemiluminesence intensity is obtained by PMT. The acoustic pressure is obtained by two microphone sensors, shown in Figure 1.
Figure 5.
DMD spectrums for flame (the red line is for Case 1, the blue line is for Case 2 and the black line is for Case 3).
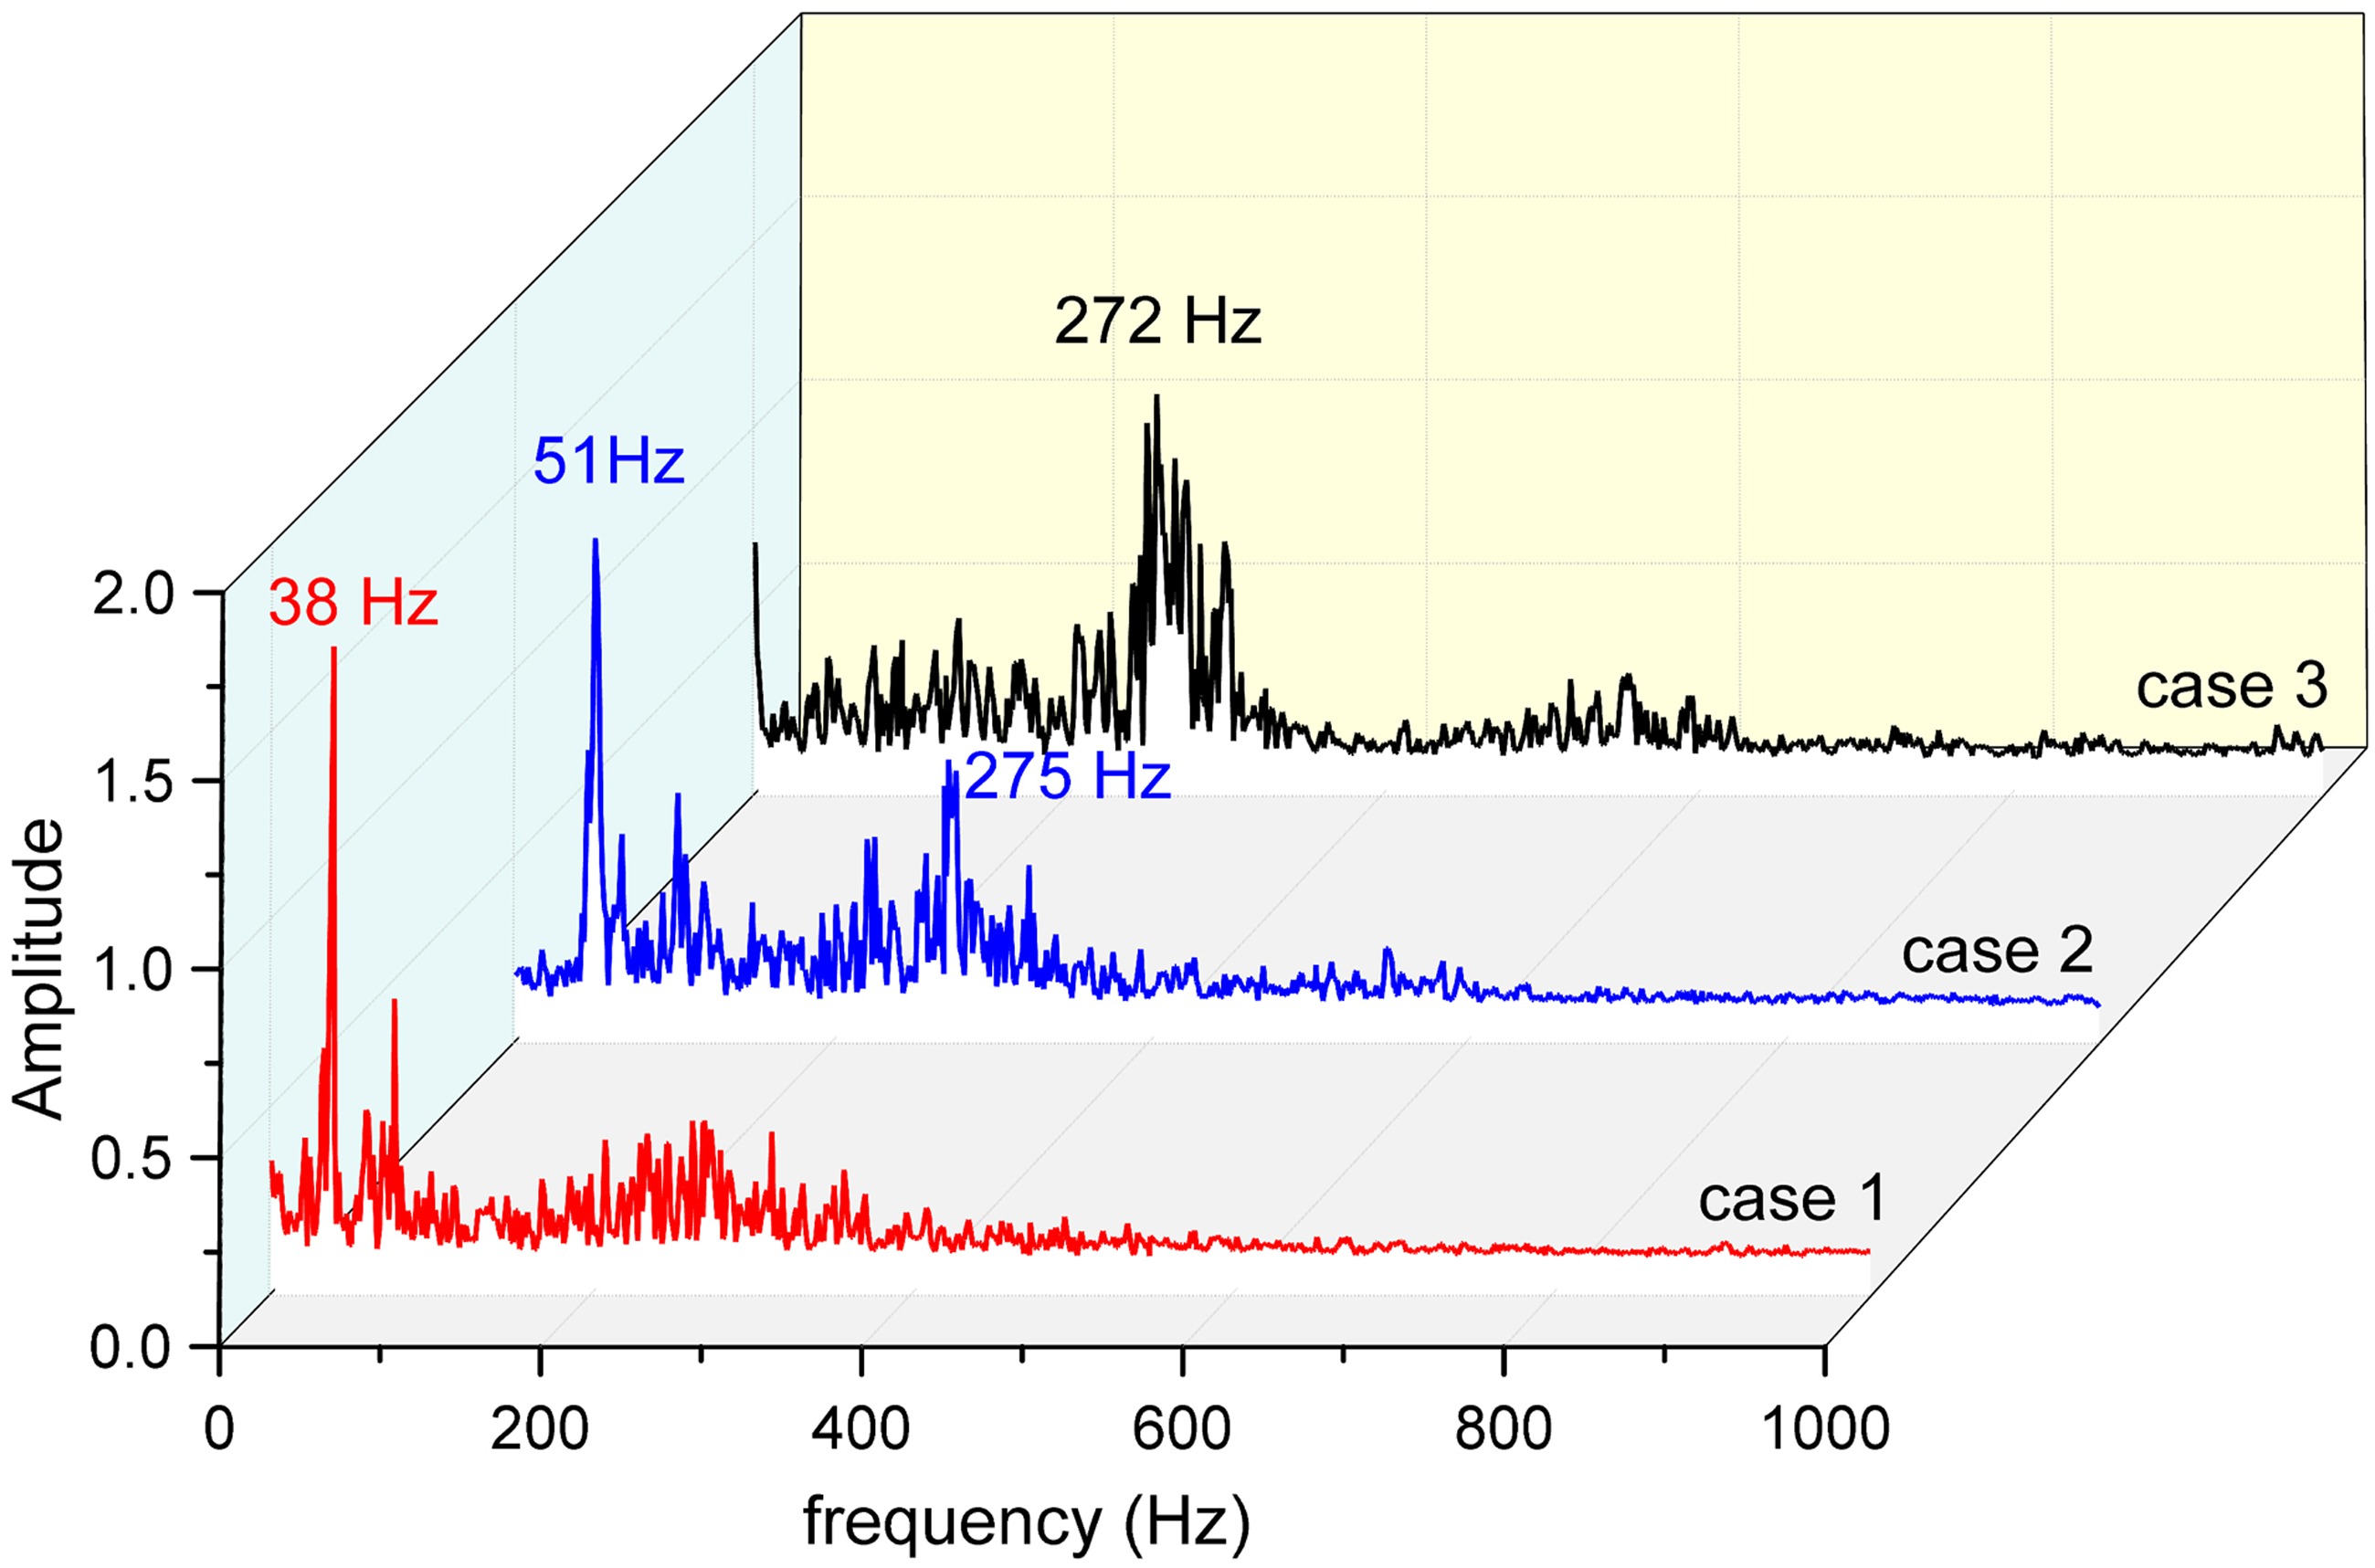
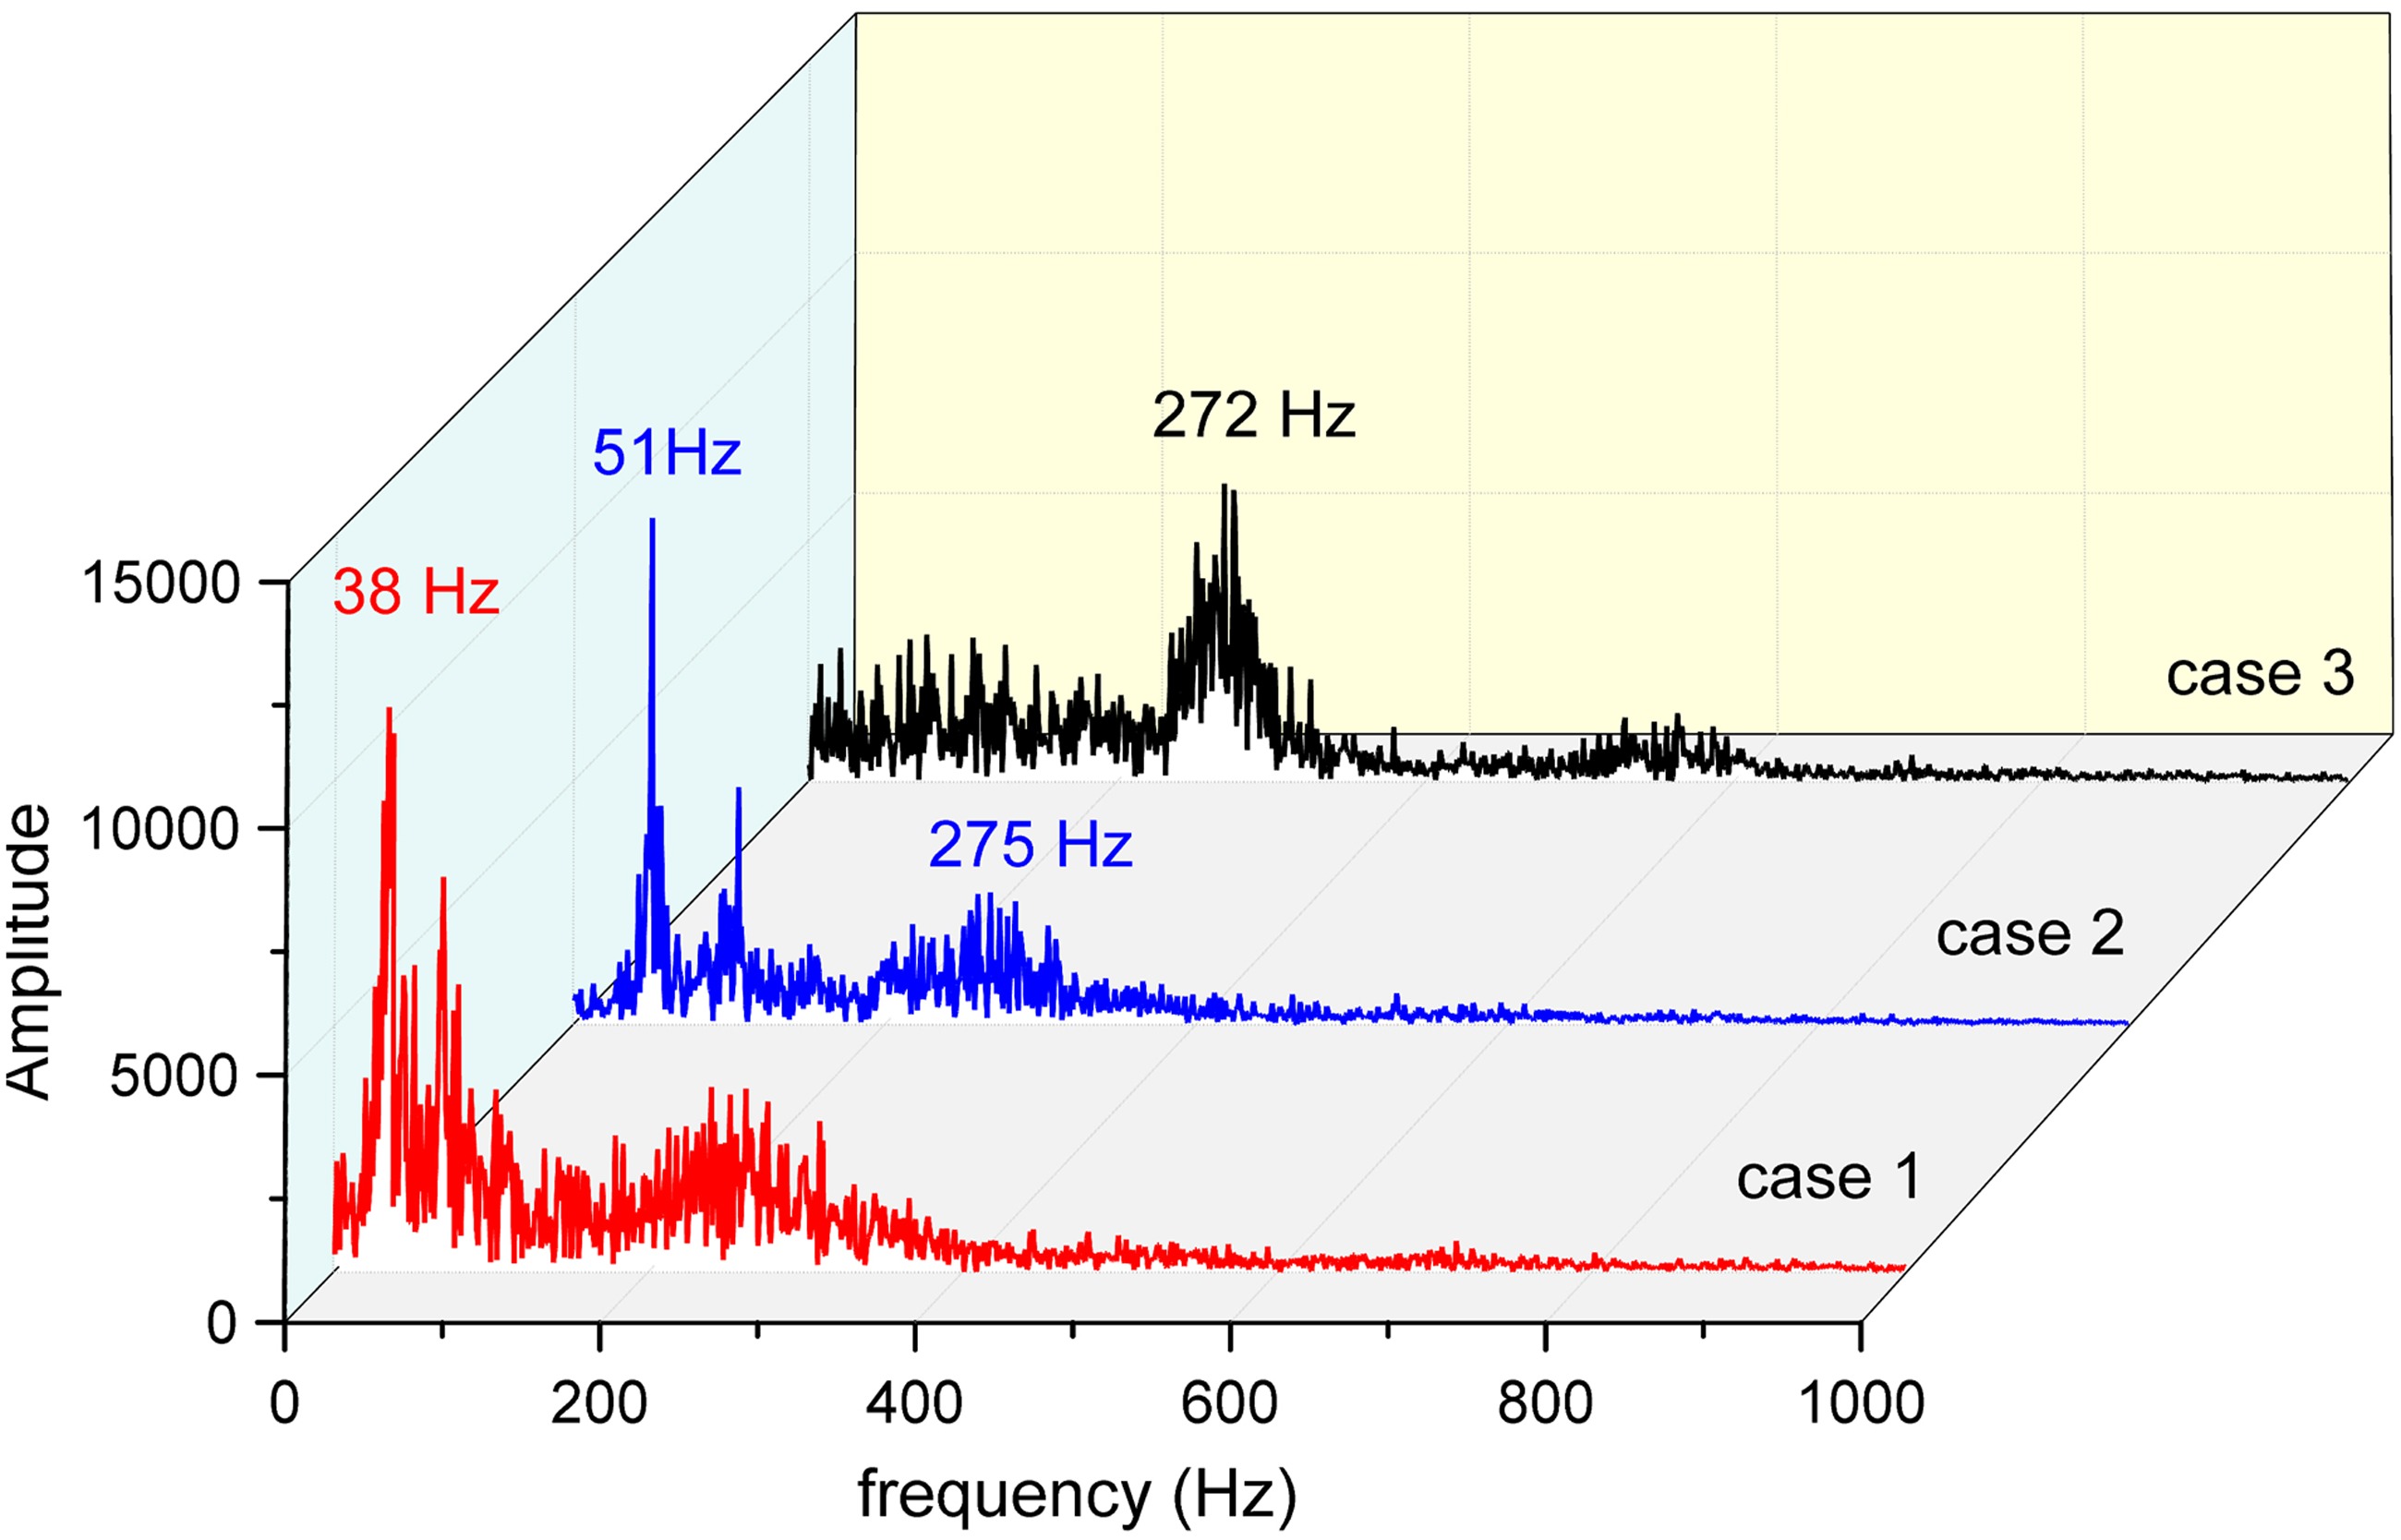
Figure 7.
FFT spectrums of the acoustic pressure in combustion chamber and plenum. (a) Case 1. (b) Case 2. (c) Case 3.
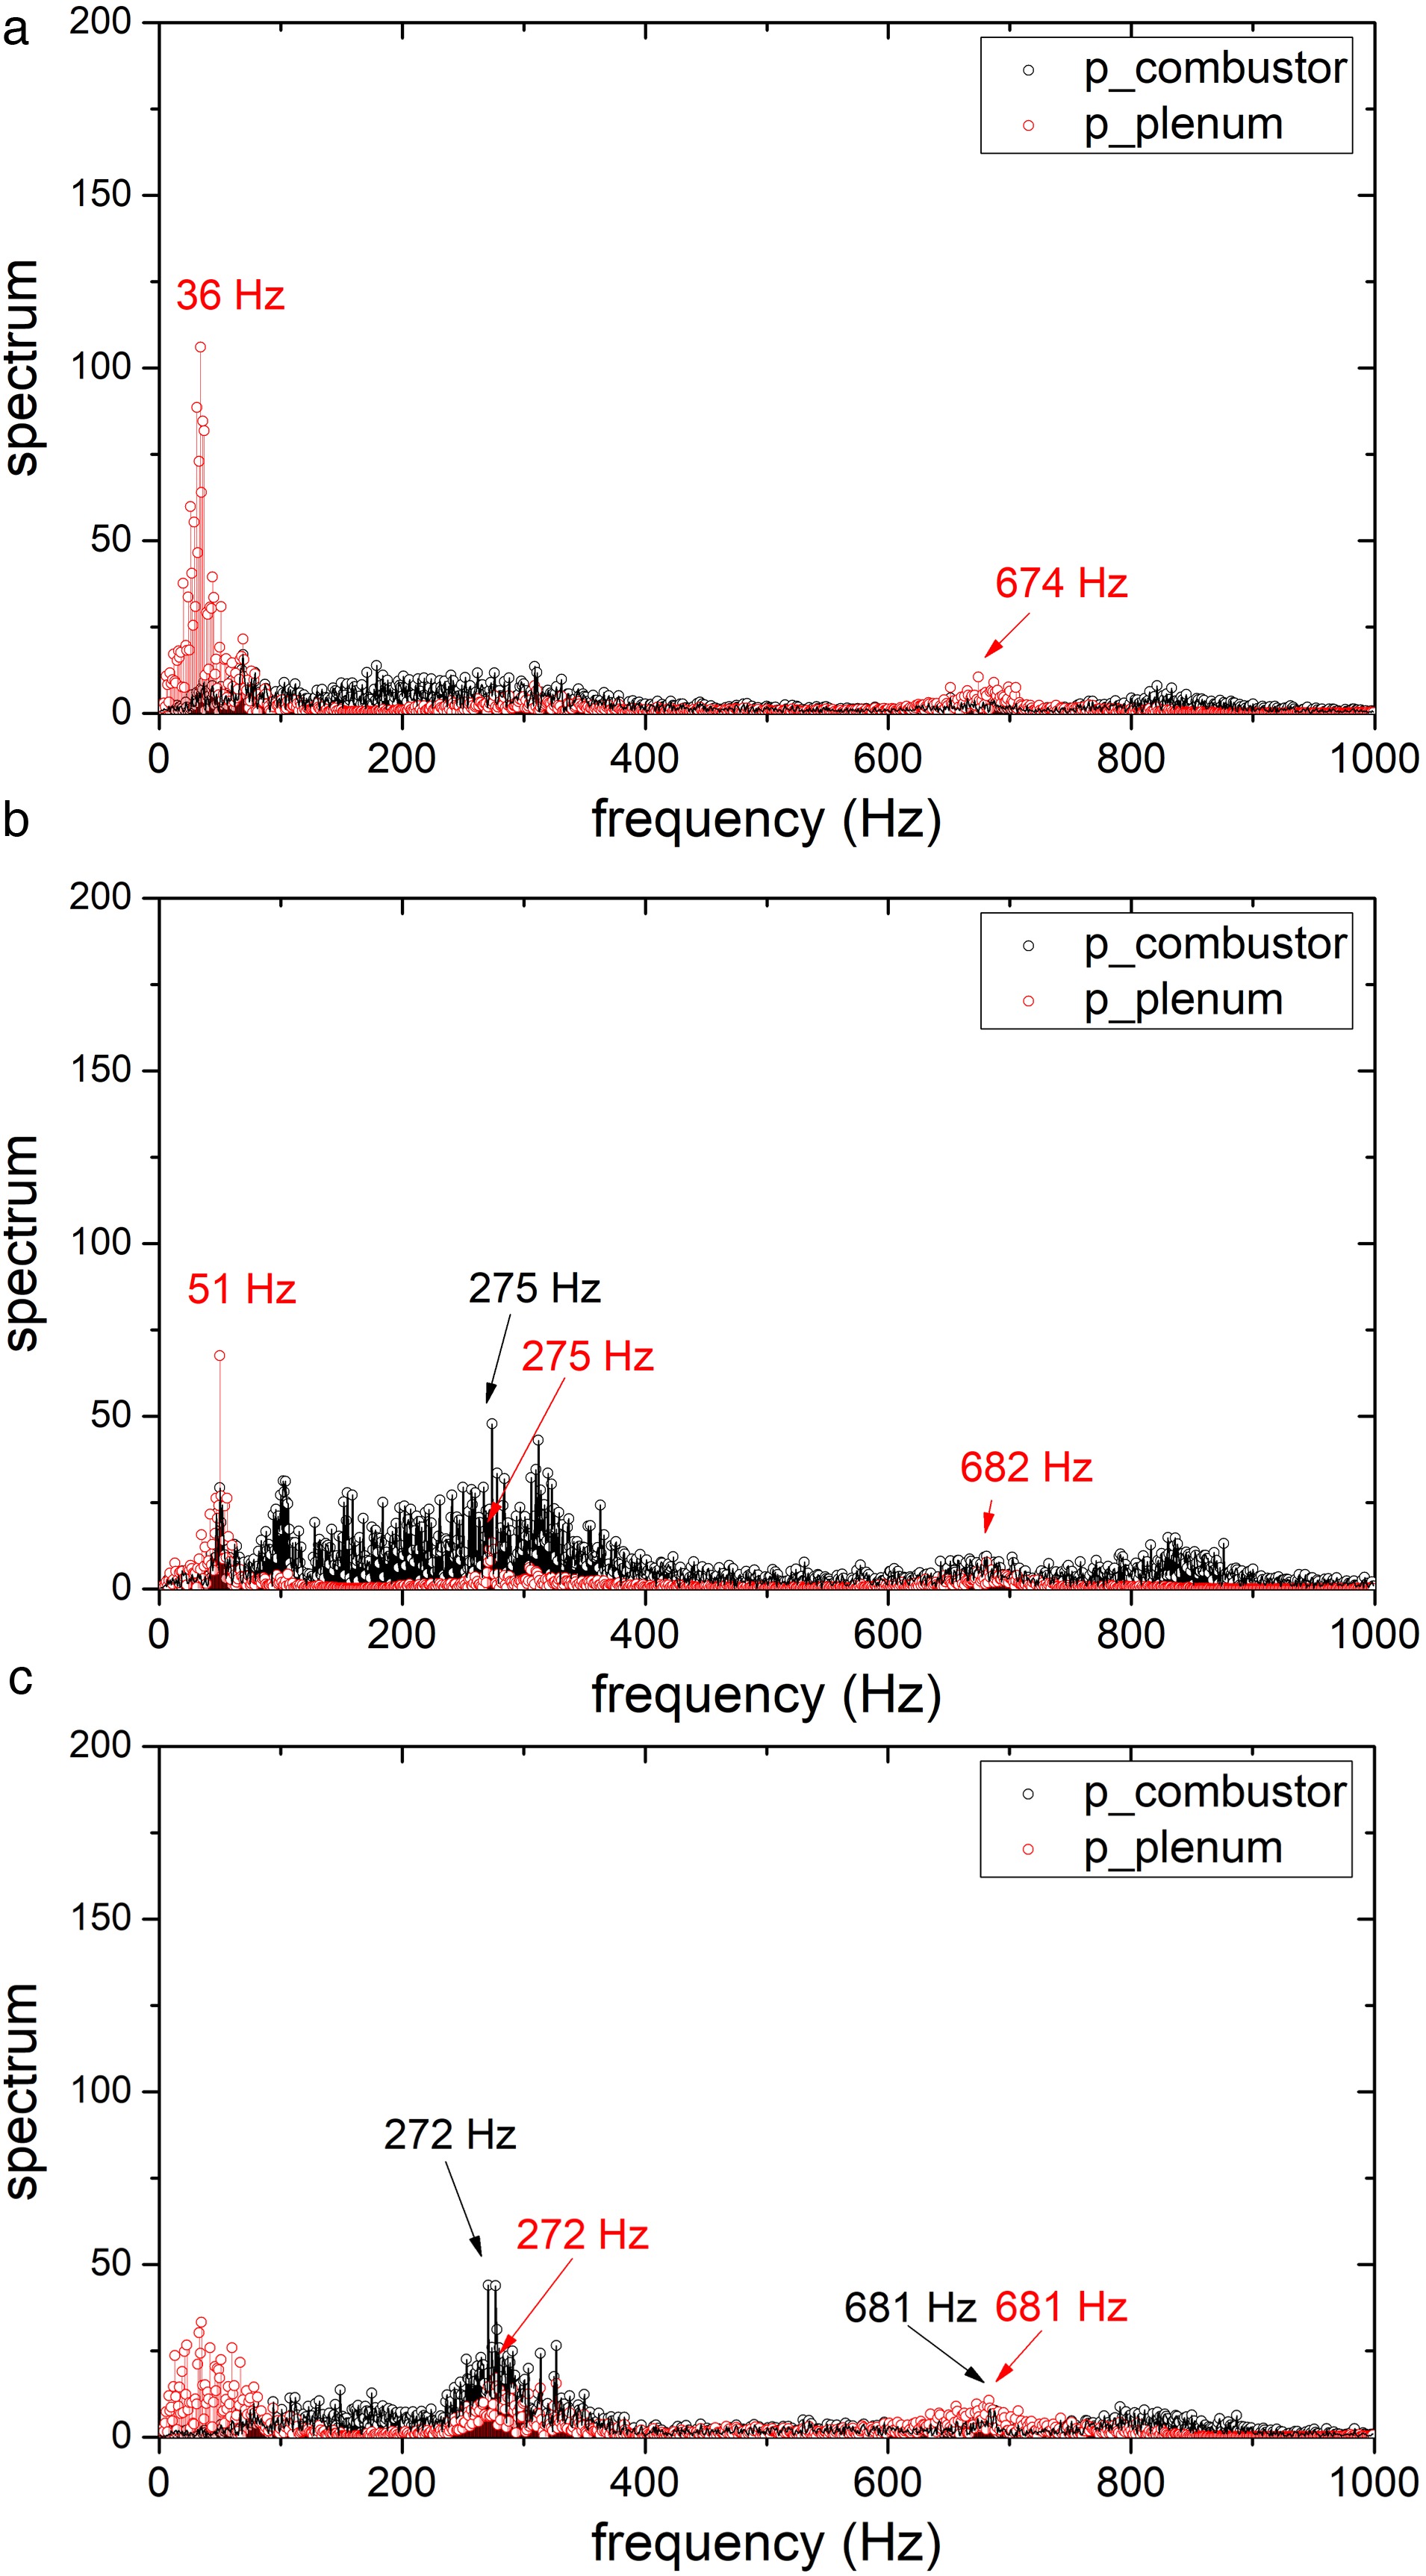
DMD spectrums for flame are shown in Figure 5, PSD spectrums of OH* chemiluminesence intensity are shown in Figure 6 and PSD spectrums of the acoustic pressure are shown in Figure 7. For Case 1, the intrinsic frequency of DMD spectrums is 38 Hz, and there are two main intrinsic frequencies (38 Hz and 674 Hz) occur in the acoustic signal of plenum and no intrinsic frequency in the acoustic signal of combustion chamber, which proves that the mode of 38 Hz is the resonant mode of plenum and injector. Thus, the mode of 38 Hz is corresponding to LF (Low Frequency) mode. Besides, 76 Hz and 114 Hz also can be observed in DMD spectra of flame for case 1. These intrinsic frequencies are the double and triple frequency of the 38 Hz, which could be regarded as double-frequency resonant mode. The amplitude of double-frequency resonant mode is weaker than the basic intrinsic frequency. The LF mode is a typical resonant mode for the plenum resonator. It is also found in the experiments that combustion instability in the LF mode can occur without combustion chamber, which proves that LF mode is a coupled mode of injector tube and plenum instead of combustion chamber.
For Case 3, the DMD spectrums show one intrinsic frequency (272 Hz). Meanwhile, this frequency is observed in the acoustic signals of the combustion chamber, as well as the plenum. This frequency is also observed in the FFT spectrums of OH* signal. Obviously, this is the resonant mode (C1/4 mode) corresponding to the whole combustor system. Similarly, a double-frequency resonant mode (545 Hz) is observed in both the DMD spectrums of flame and the FFT spectrums of OH* signal.
For Case 2, two intrinsic frequencies (51 Hz and 275 Hz) are observed in the DMD spectrums. They are also found in the FFT spectrums of OH* signal. Meanwhile, these two main intrinsic frequencies also exist in the acoustic signal of plenum. But, only one intrinsic frequency (275 Hz) is presented in the acoustic signal of combustor chamber. In other word, this unstable mode is mixed by LF mode and C1/4 mode.
Interestingly, one special intrinsic frequency exists in the acoustic signal of plenum for all three cases, (674 Hz for Case 1, 682 Hz for Case 2 and 681 Hz for Case 3). This frequency is in absence of the acoustic signal in combustor chamber. This is a resonant mode in plenum only, which is corresponding to the P1/2 mode. Though, this mode is weak. It can be found in the FFT spectrums of OH* signal indeed. But it is not detected in the DMD spectrums of flame. The reason for this phenomenon is as following: The frame rate of imaging is 2000 Hz, which is smaller than the sampling rate of OH* signal and acoustic signal. It might be not enough for DMD method to distinguish such a weak and relatively high frequency P1/2 mode due to the noise effects, such as turbulence.
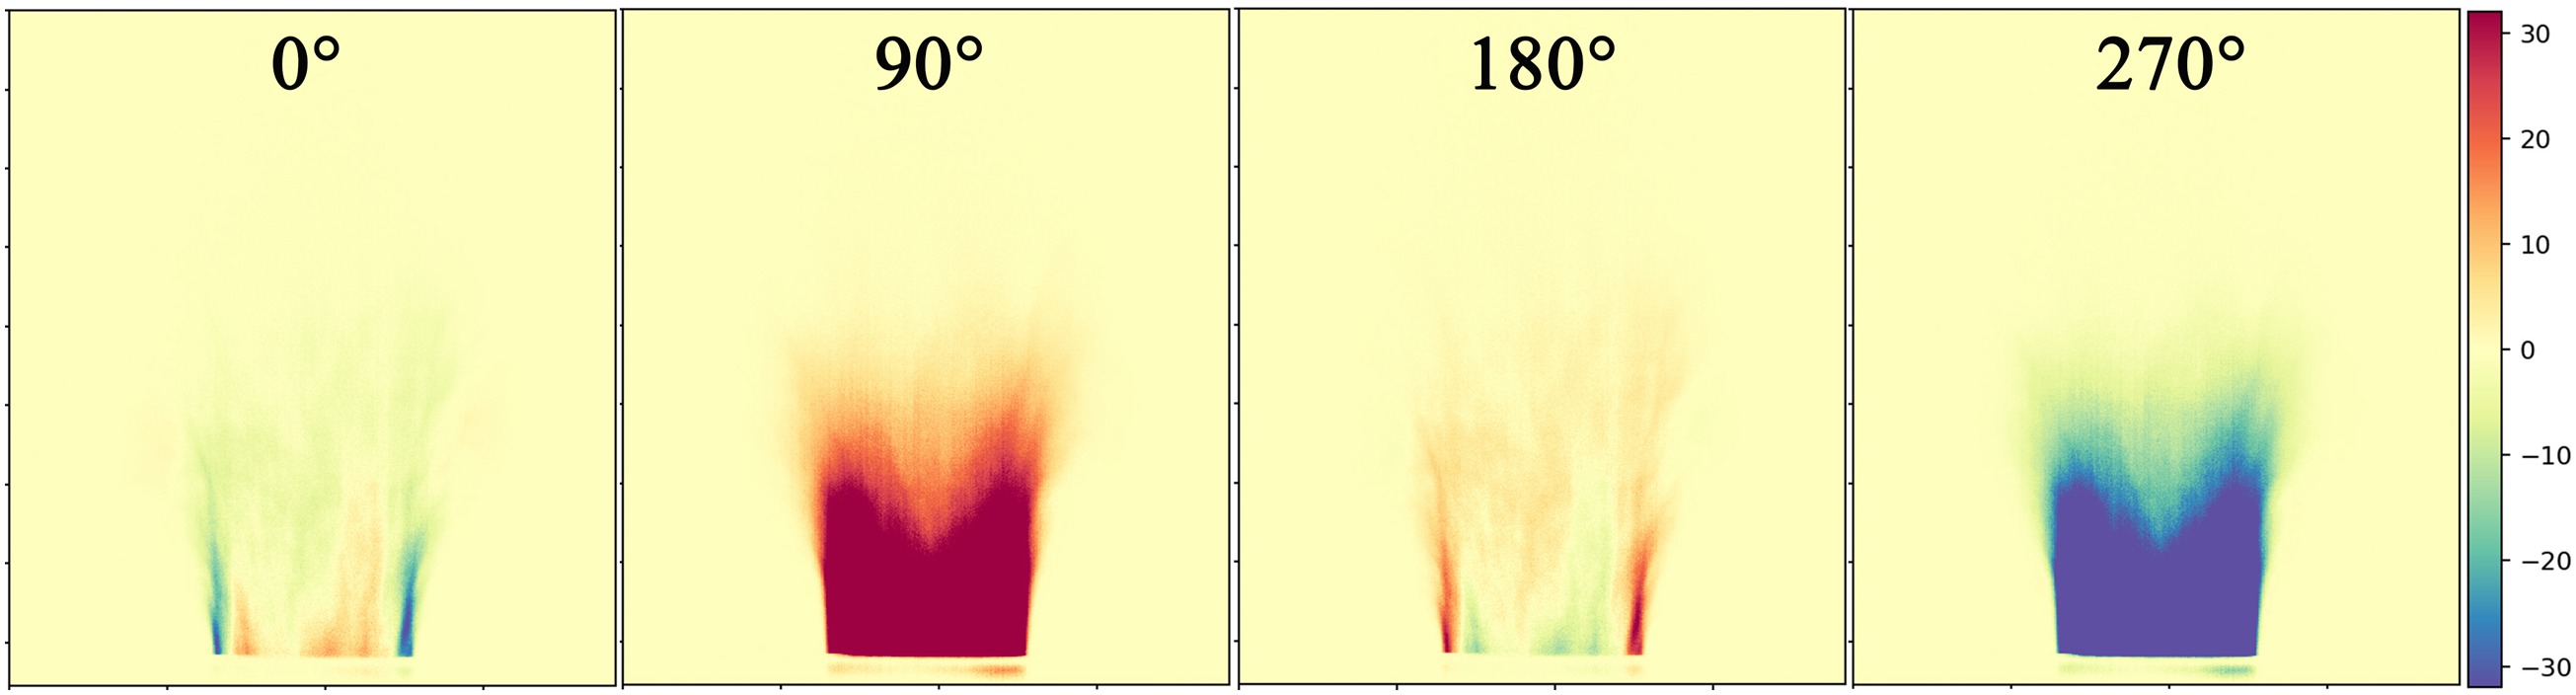
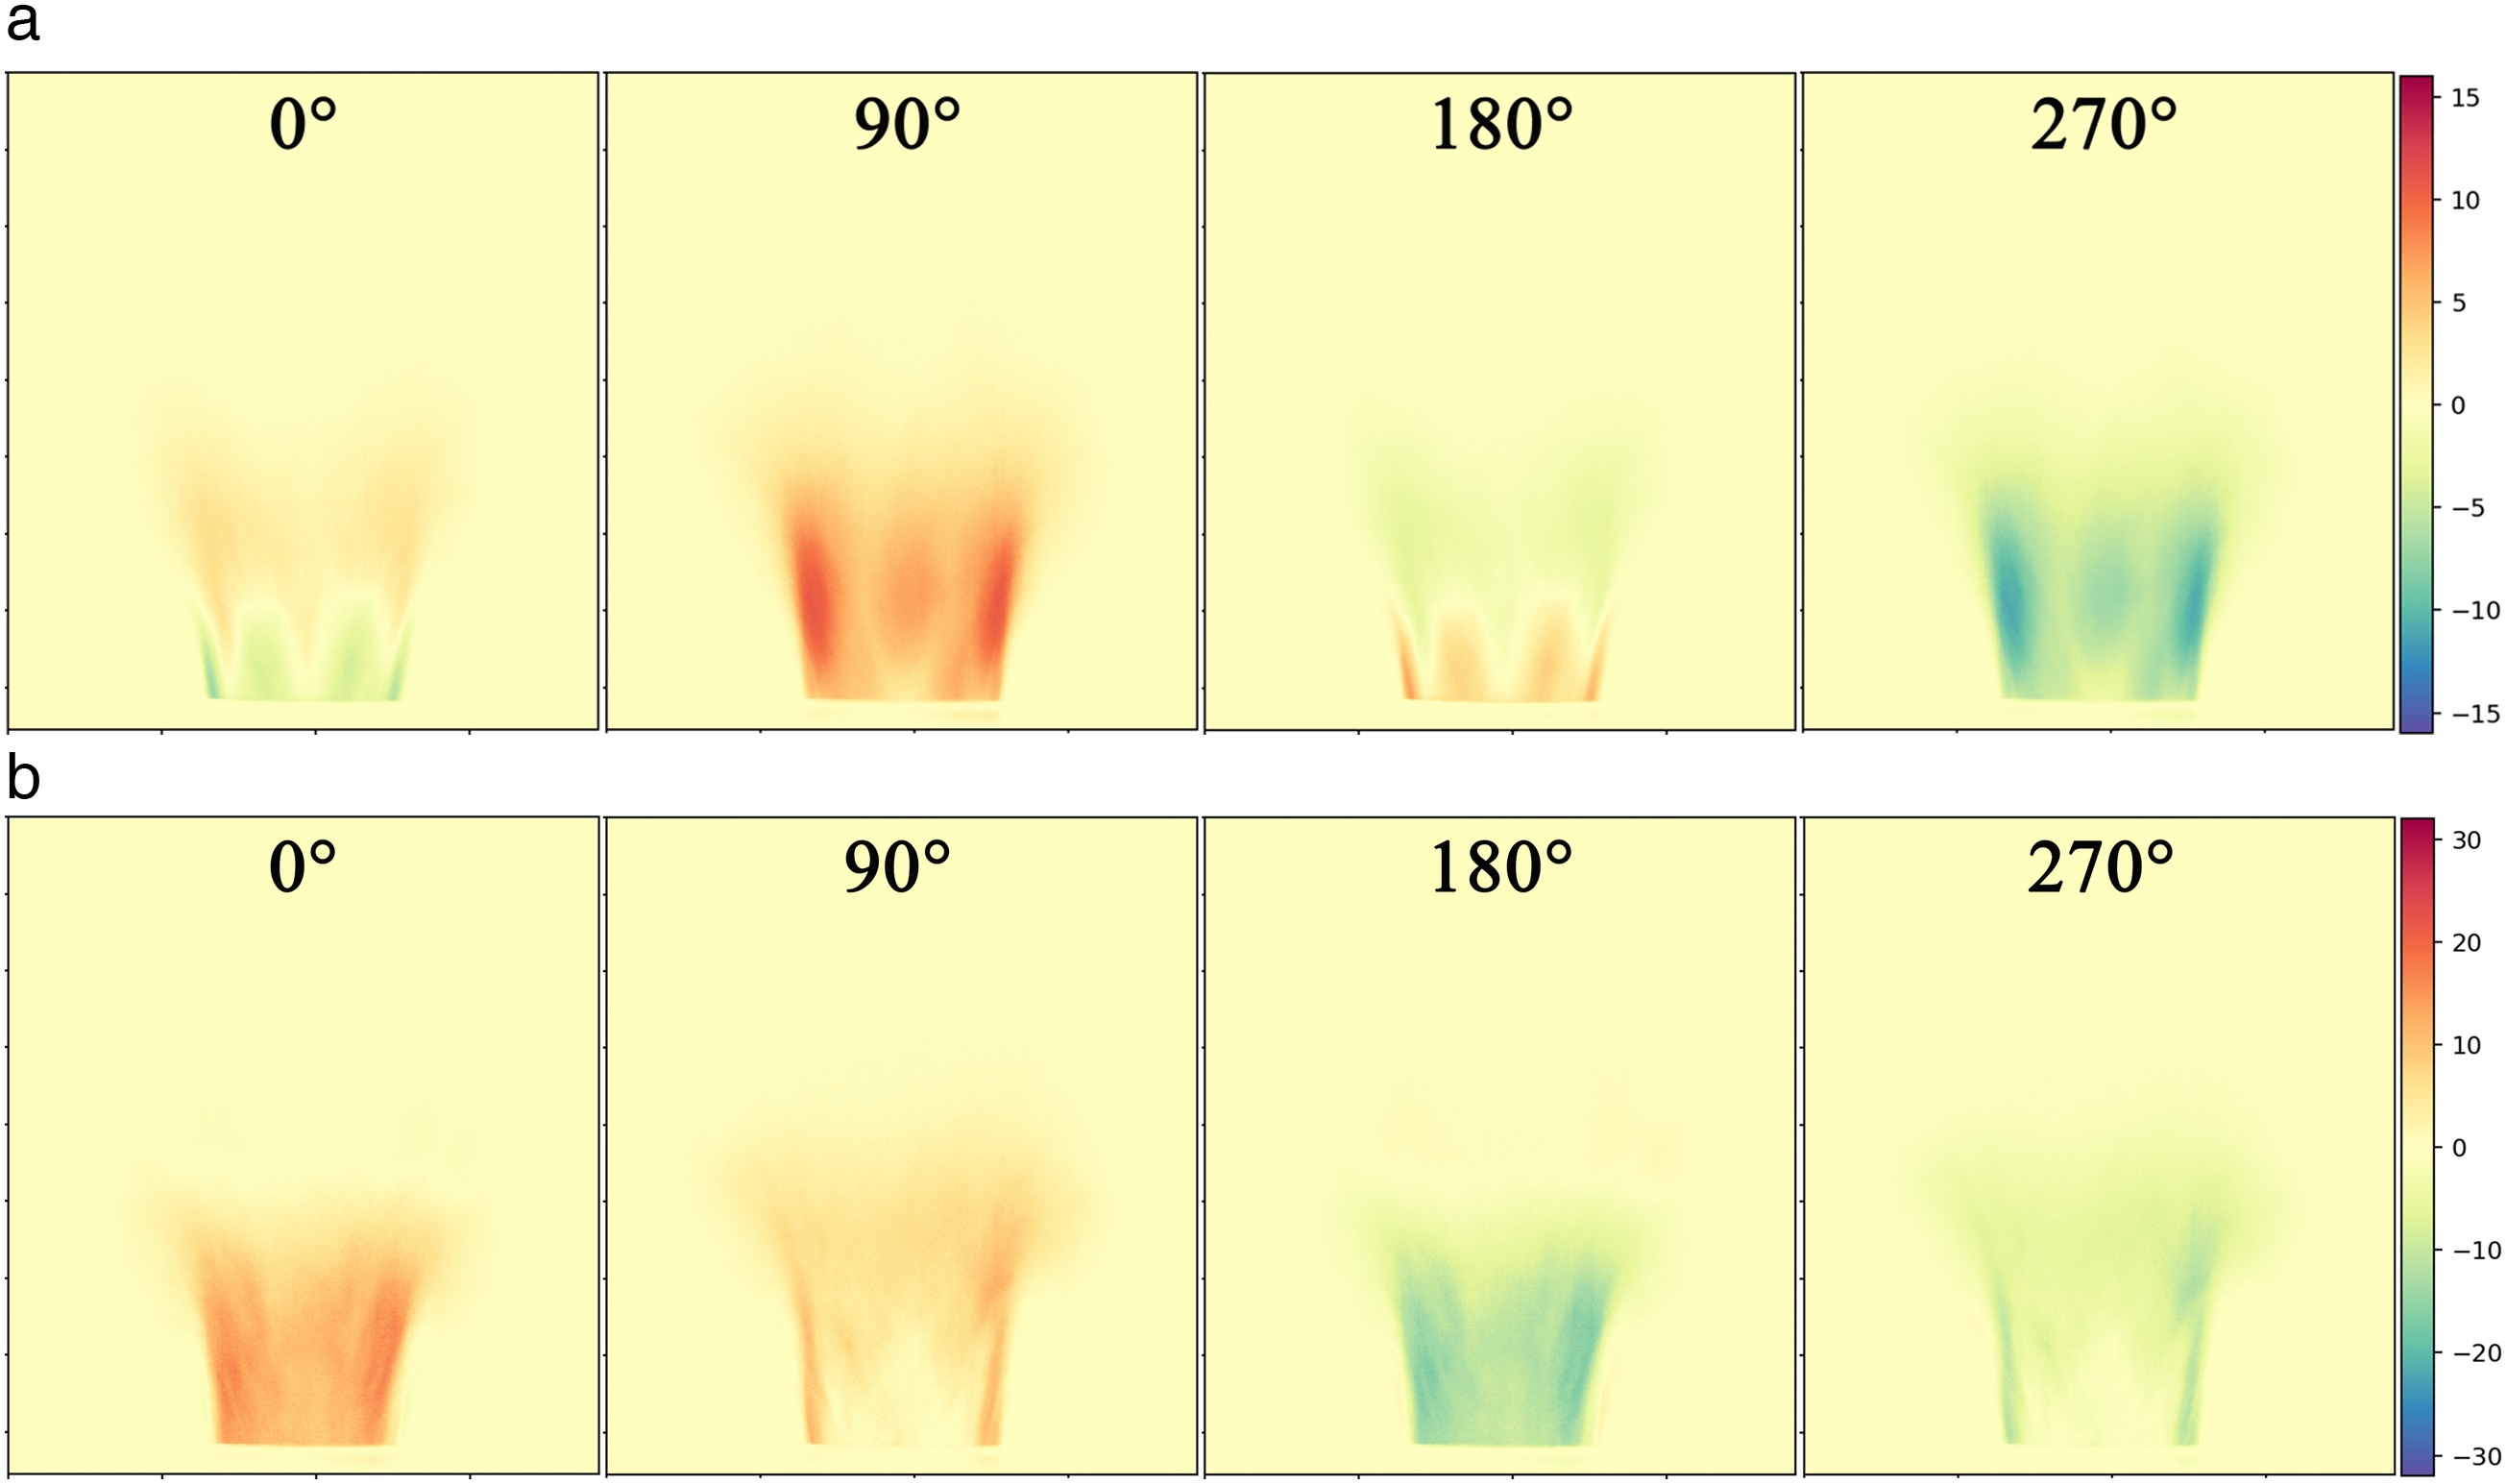
The mode phases of Case 1 and Case 3 are shown in Figures 8 and 9, respectively. It can be observed that combustion instability is in longitudinal mode. For Case 2, both LF and C1/4 modes are observed in Figure 10. Though, both modes are longitudinal, there is difference in the phase map. It can be observed that LF mode presents a process of change from downstream to upstream, while the C1/4 mode is in an opposite process.

As discussed, Case 1 (Φ = 1.0) is in LF mode. As the equivalence ration increases, Case 2 (Φ = 1.05) is in a mixed mode of LF mode and C1/4 mode. The amplitude of LF mode in Case 2 is weaker than that in Case 1. When the equivalence ratio increases to Case 3 (Φ = 1.10), the LF mode disappeared and C1/4 mode is the dominant mode. Recalling the stability map given in Figure 3, Type-1 is a region where LF mode occurs; Type-2 is a region in which C1/4 mode occurs; and Type-3 is a region belonging to transition mode between Type-1 and Type-2. Meanwhile, it can be observed that LF mode occurs in the region of relatively high combustion power. C1/4 mode occurs in the region of relatively low combustion power. Mixed mode is more likely to a transition mode between LF mode and C1/4 mode.
The unstable modes and intrinsic frequencies of all cases are listed in Table 2. The intrinsic frequency corresponding to LF mode varies from 32 Hz to 51 Hz in all cases studied. The intrinsic frequency corresponding to C1/4 mode for two cases is almost the same. The intrinsic frequency corresponding to P1/2 mode for three cases (Case 1, Case 2, and Case 3) is also in a narrow band. There is a little shift in the frequency for each resonant mode. It may be explained as following. The adiabatic flame temperature of cases in each resonant mode is roughly close. When the equivalence ratio changes, the flow rate of air is change. This leads to changing of temperature in combustion chamber wall, thereby influencing the intrinsic frequency of thermo-acoustic instability. Because the experiments are operated under rich-fuel situations, the change of temperature is mainly due to the flow rate of air. Actually, the effect of wall temperature on unstable intrinsic frequency is quite complex. These discussions may be further investigated by the thermo-acoustic model with Flame transfer function in future works.
Diagnosis of downstream hot burnt gas
In order to study the effect of the downstream flow field on the swirling flame, simultaneous imaging acquisition of swirling flame and downstream hot burnt gas was adopted.
The consecutive imaging of flame and hot burnt gas for Case 6 is shown in Figure 11. Figures are in the same scale by referring to the nozzle size in the two different imaging pictures. Combustion for Case 6 is in steady situation. The V-shape flame is clear. Meanwhile, the structure of hot burnt gas is also in V-shape. There is no local peak region of heat release in hot burnt gas, which means that the heat release distribution is relatively uniform. The sequences of flame and hot burnt gas of Case 5 are presented in Figure 12. Case 5 is in unstable situation. The flame shape changes greatly in unstable combustion compared to stable one.
Figure 11.
Imaging of flame and hot burnt gas for Case 6(The left of each picture is hot burnt gas, the right one is flame; The above colorbar is for hot burnt gas, the bottom colorbar is for flame).
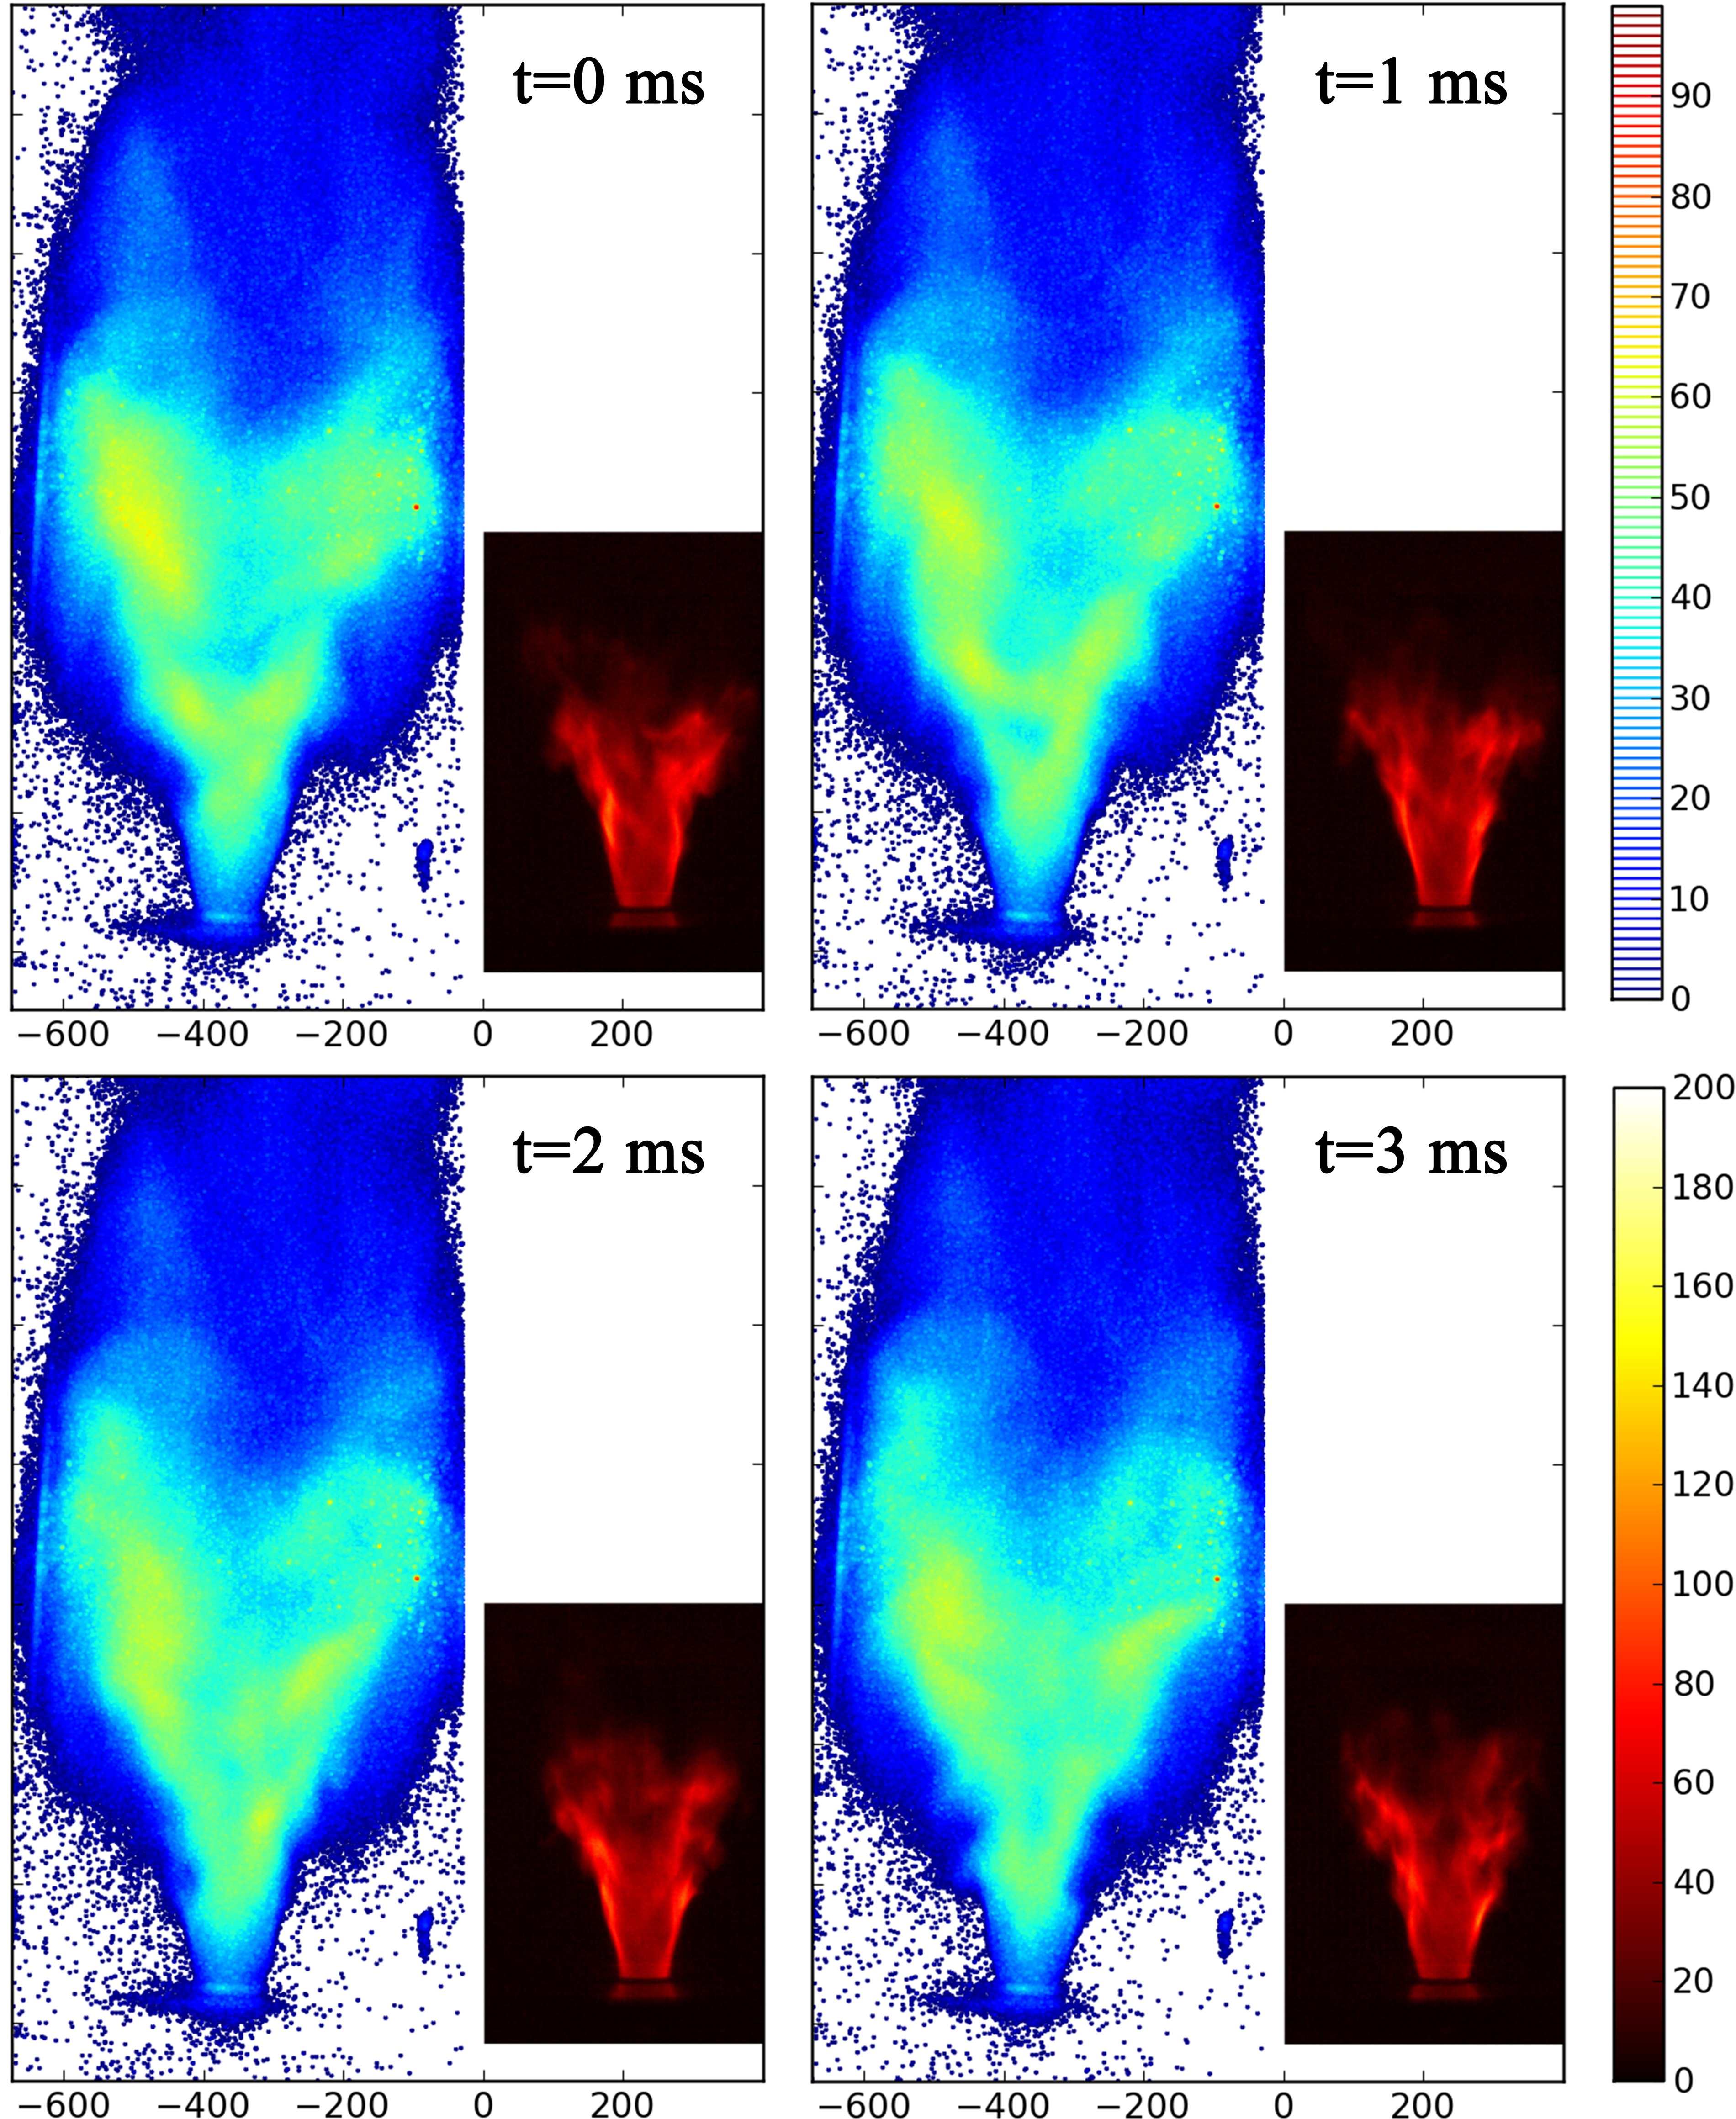
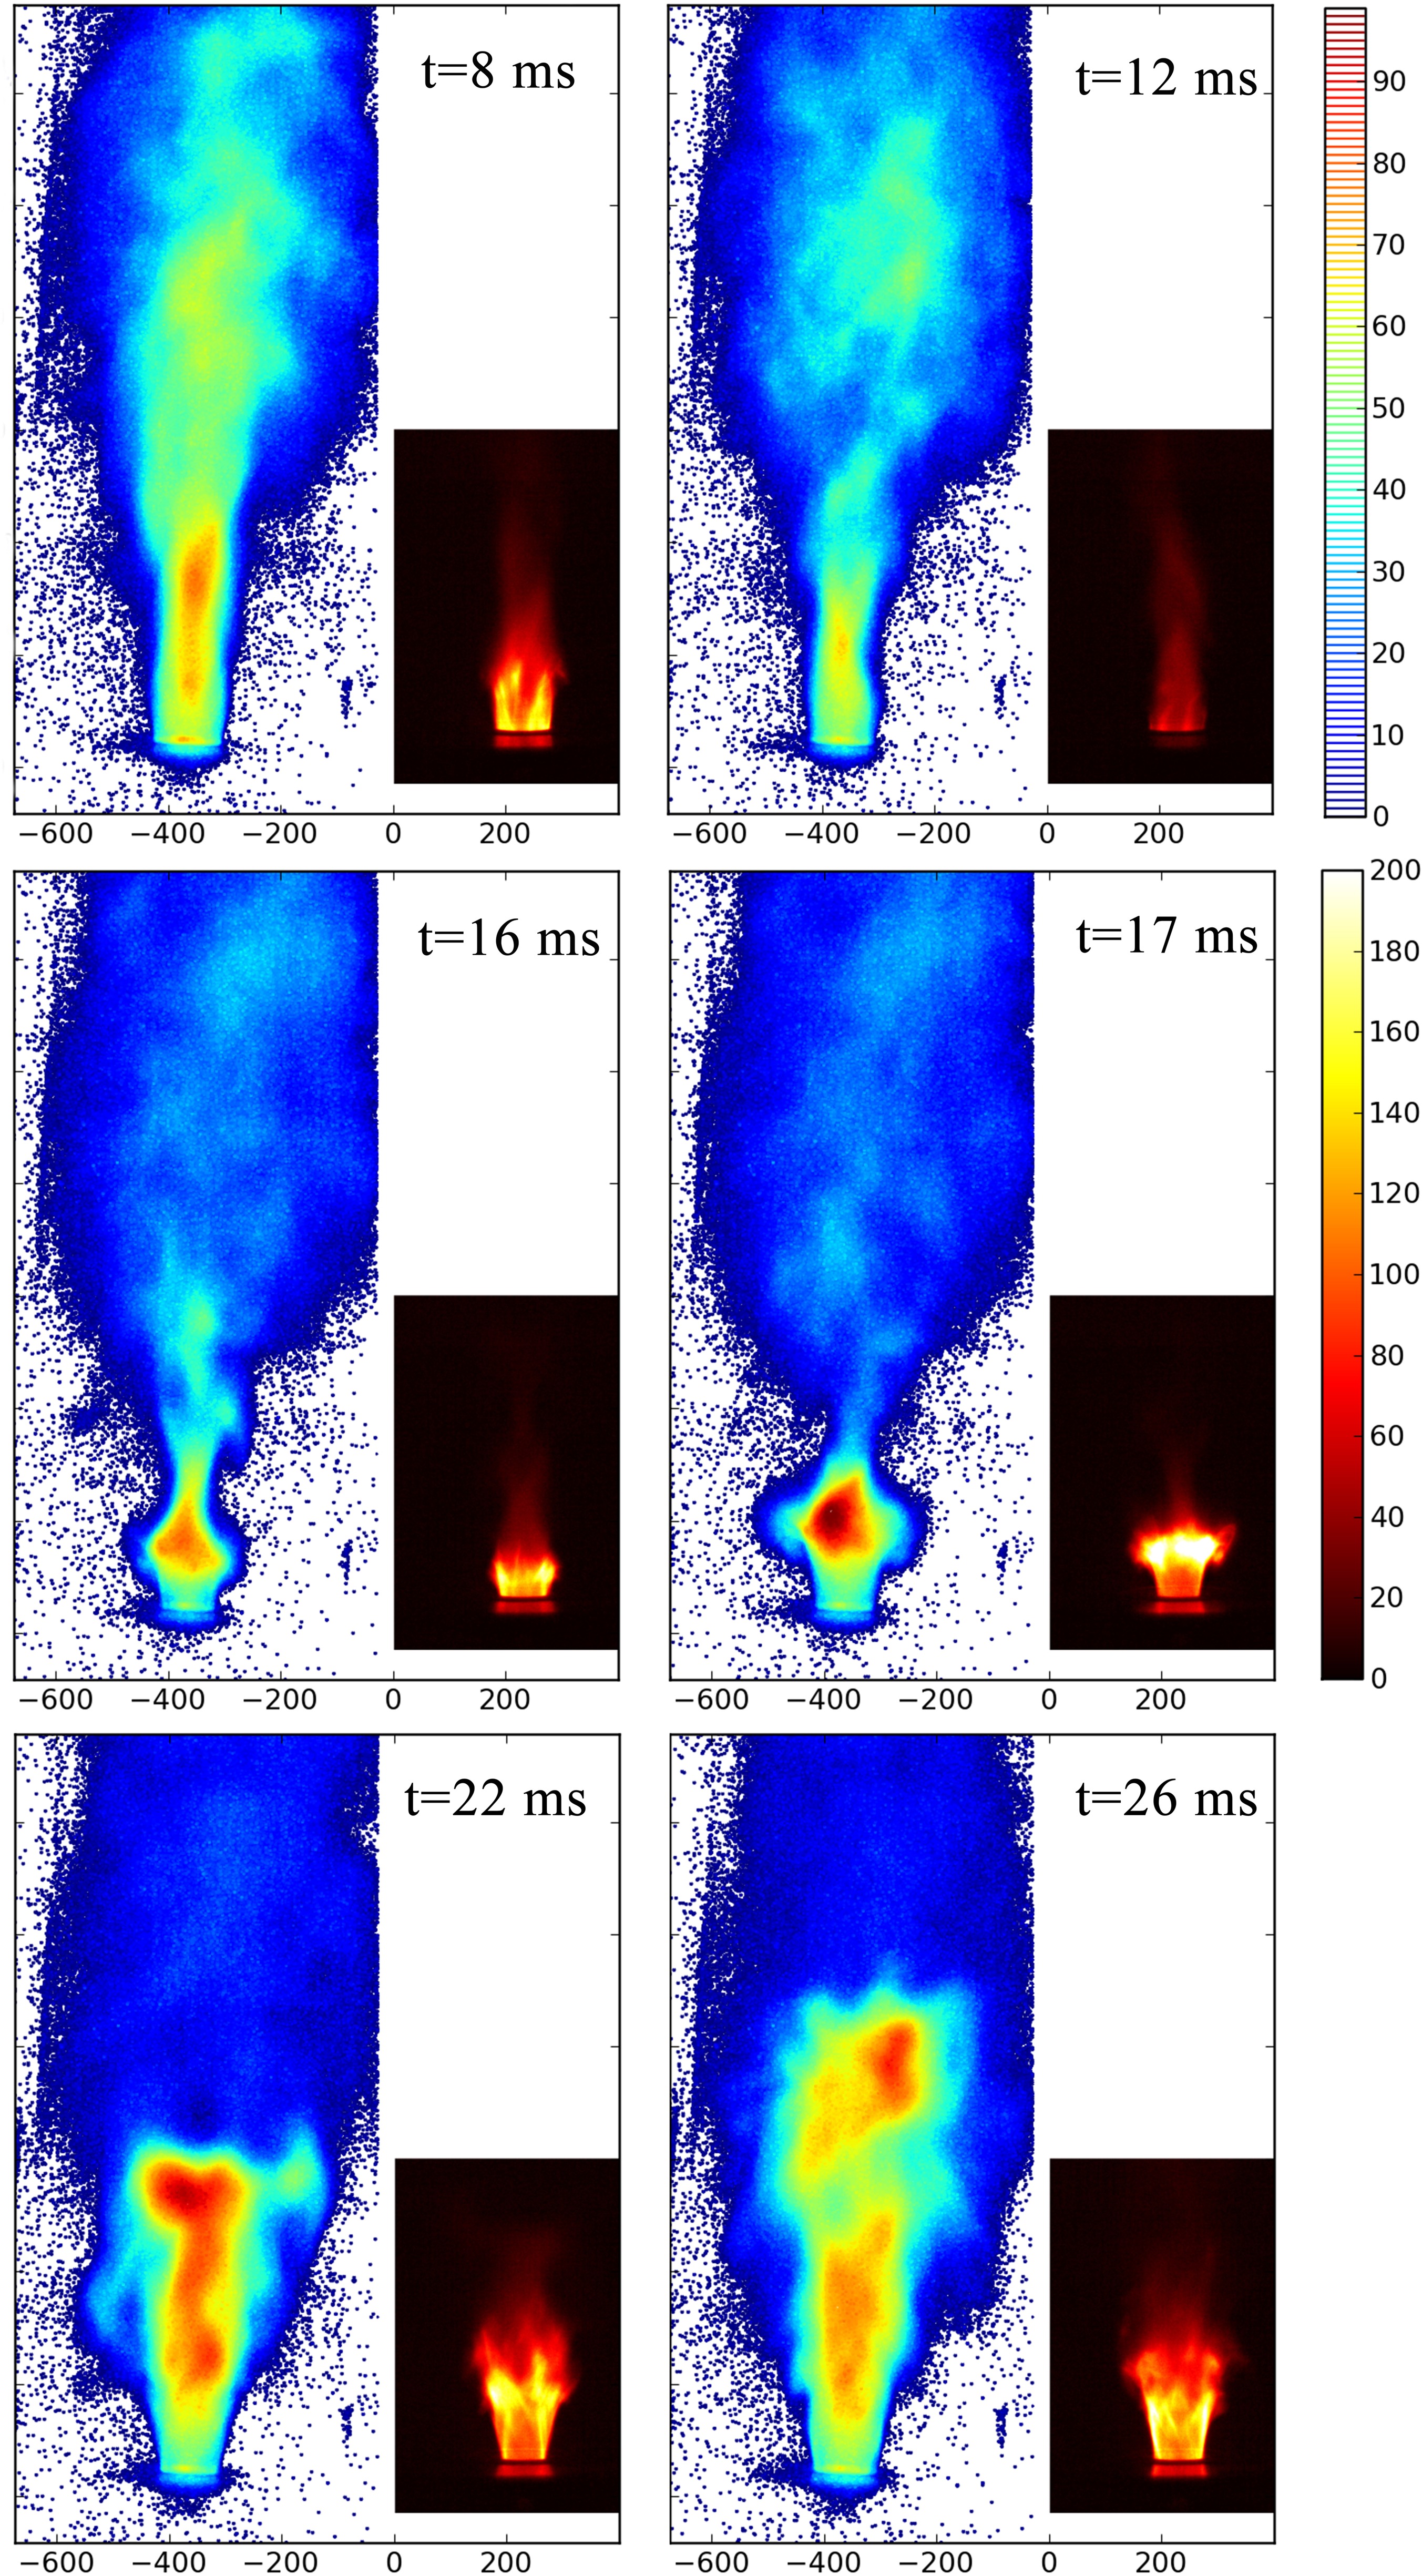
Although the experimental condition is rich-fuel, there is no flame fragment found in the hot burnt gas. In the imaging sequences, the camera with UV-IR-cut filter could record the visible flame but not the hot burnt gas, which proves that the hot burnt gas is the product of unstable combustion instead of the flame fragment. Compared to the imaging of stable combustion in Case 6, large-scale oscillations are observed in the swirling flame for Case 5. At t = 8 ms, both the flame and hot burnt gas have strong luminescence intensity, the hot burnt gas is mainly confined to the vicinity of the central axis of the chamber. At t = 12 ms, the flame shape becomes conical. The flame is nearly quenching because of the insufficient local gas supply caused by velocity fluctuation, and the luminescence intensity of the hot burnt gas is also weakened. At t = 16 ms, the flame shape changes significantly compared to steady combustion situation. The luminous intensity begins to re-enhance and the heat release is mainly gathered in the upper end of the flame. By imaging of hot burnt gas, it can be observed that a large-scale bot burnt gas mass formed at the downstream of flame. Meanwhile, a knot appears between the flame and hot burnt gas due to sucking. At t = 17 ms, the luminous intensity of the hot burnt gas mainly occurs in the area where the heat release of flame is larger. The luminous intensity of flame and hot burnt gas continues to increase. There is a structure of the outer coil at the upper end of the flame and a nearly broken interface appears at the junction of the flame and hot burnt gas at this moment. At t = 22 ms, the hot burnt gas develops downstream further. The length of flame becomes longer and the opening angle of flame becomes smaller compared with the structure of previous sequence (t = 17 ms). At t = 26 ms, the flame shape becomes relatively uniform with some small-scale irregular structures. When the hot burnt gas is fully developed downstream, a large-scale package of hot burnt gas breaks down. Then, the broken-down package develops downstream and dissipates eventually. After that, the flame is going into the next unstable periodic oscillation.
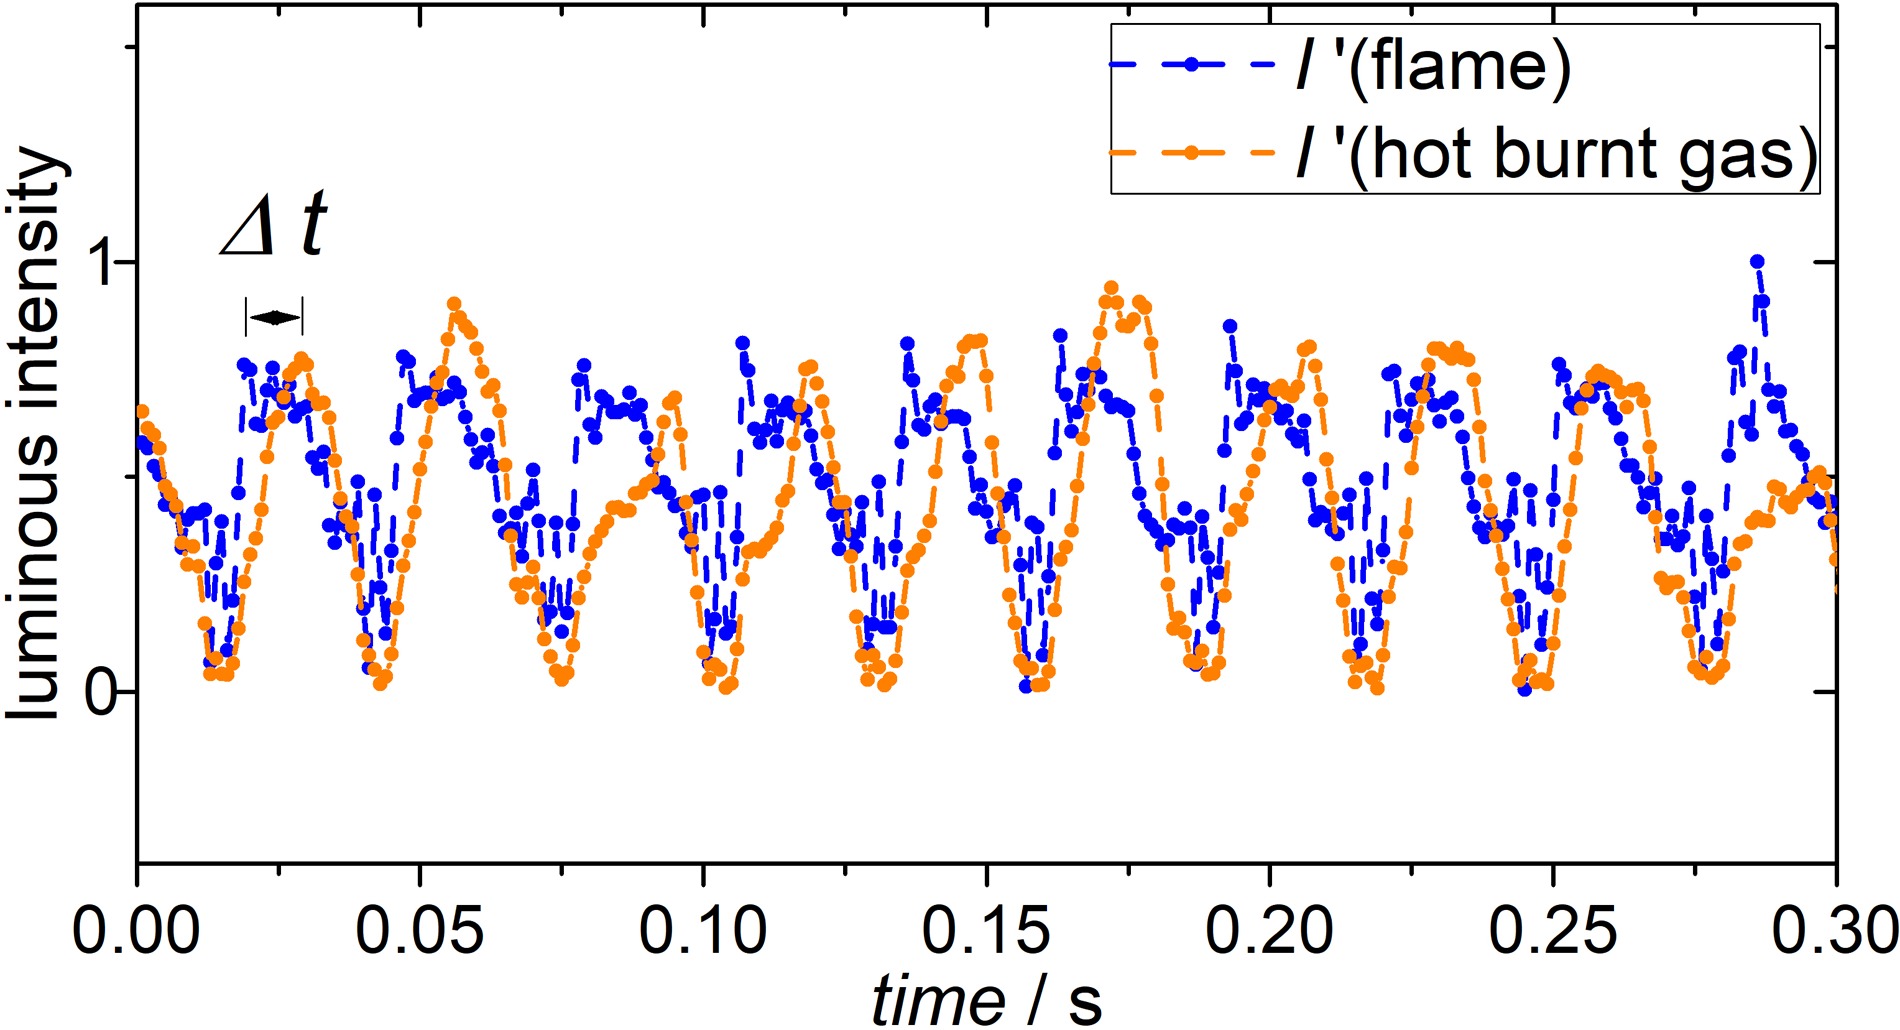
The relationship between normalized integrated luminescence intensity of flame and hot burnt gas for Case 5 is shown in Figure 13. These two signals are within the same frequency. However, there is an apparent time lag in peak point between the flame and hot burnt gas with good repeatability. The peak value of the hot burnt gas signal is always behind the peak value of the flame signal. This can be well explained by the sequences in Figure 12. The hot burnt gas is the burning product, which is at downstream of the flame. It could not be detected by UV-IR-cut imaging. A certain period of time is needed for the package of hot burnt gas generated by the unstable combustion to gather and break down from the flame.
The snapshots of flame and hot burnt gas are also analysed by DMD method. The frame rate of camera is 2000 Hz and 500 consecutive frames are adopted in Case 4 and Case 5. The DMD spectrums of flame and hot burnt gas for Case 5 are shown in Figure 14, together with the FFT results of OH* signal. The intrinsic frequency (32 Hz) is obtained from all three signals for Case 5. Besides, two intrinsic frequencies (64 Hz and 96 Hz) can be observed in the spectrums of all three signals, which are the double-frequency resonant mode of the basic intrinsic frequency. Similar results can be found in the spectrums for Case 4, shown in Figure 15. The intrinsic frequency of Case 4 is 46 Hz, which is a little bit higher than that of Case 5. Though, these two cases are in the same unstable mode (LF mode). A little shift of intrinsic frequency may do happen, which have been discussed in previous comments. Apart from the LF mode, a special frequency (fb) is found only in the spectrums of hot burnt gas, which is not detected in spectrums of other signals.

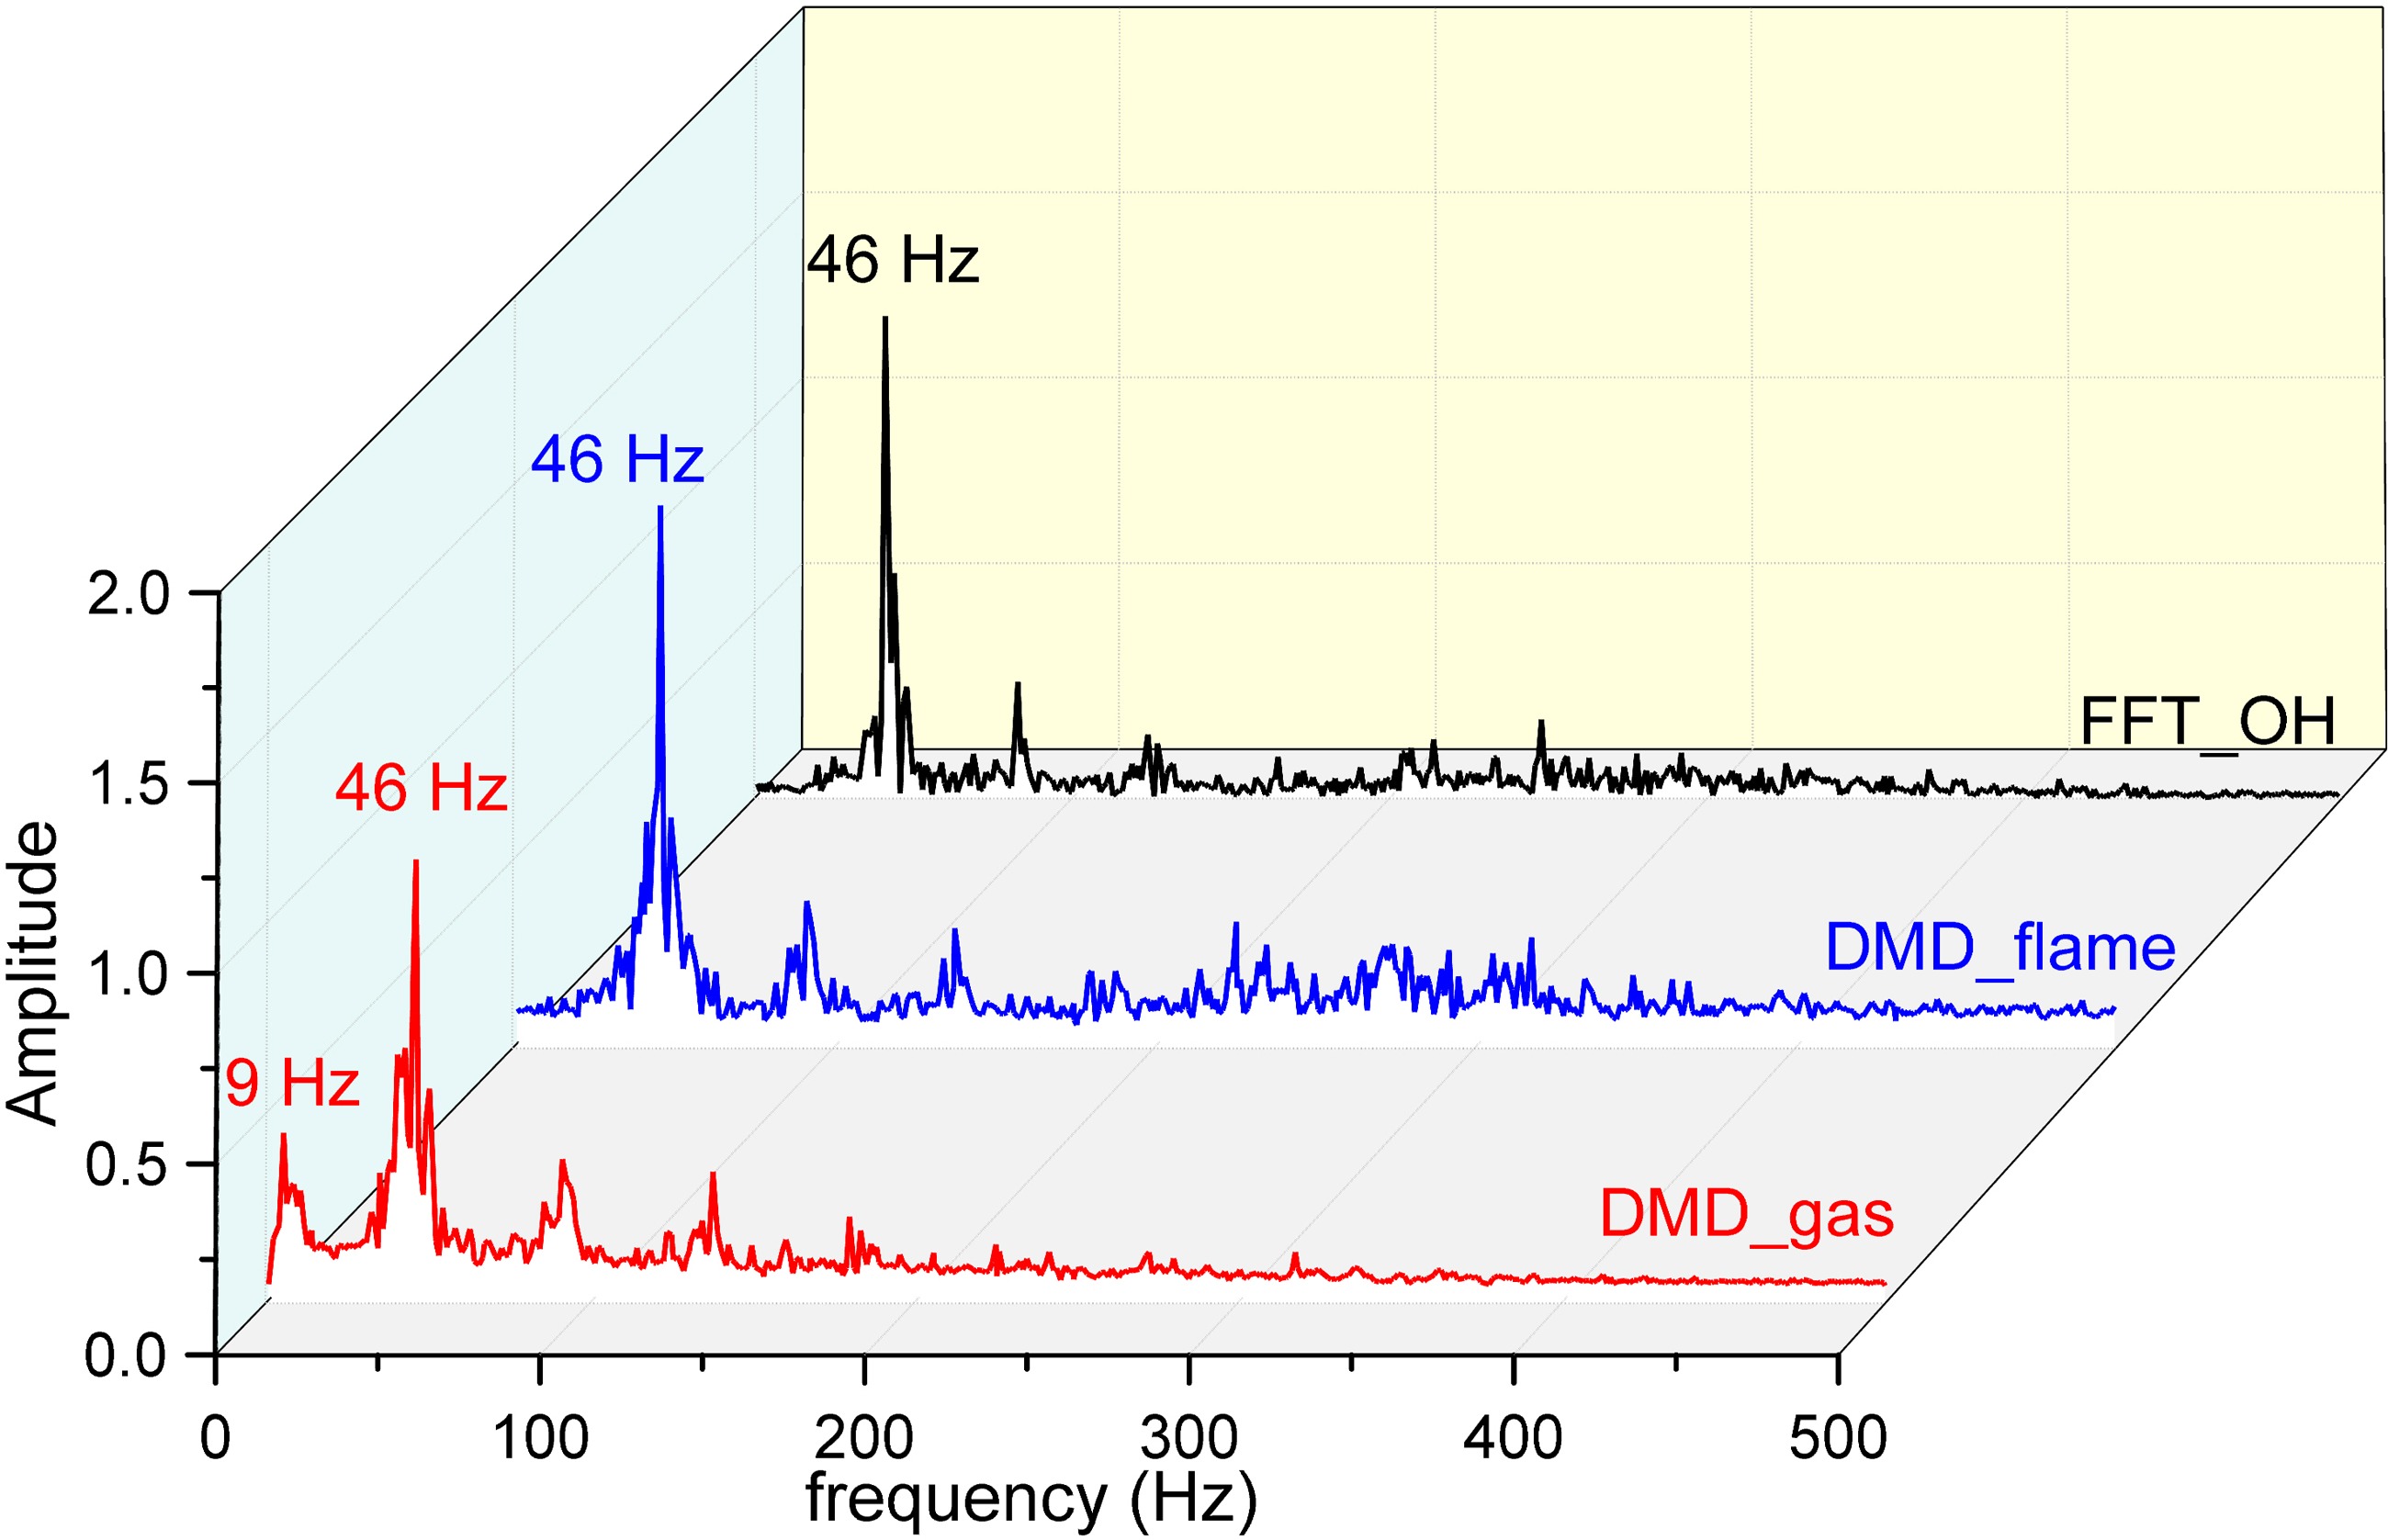
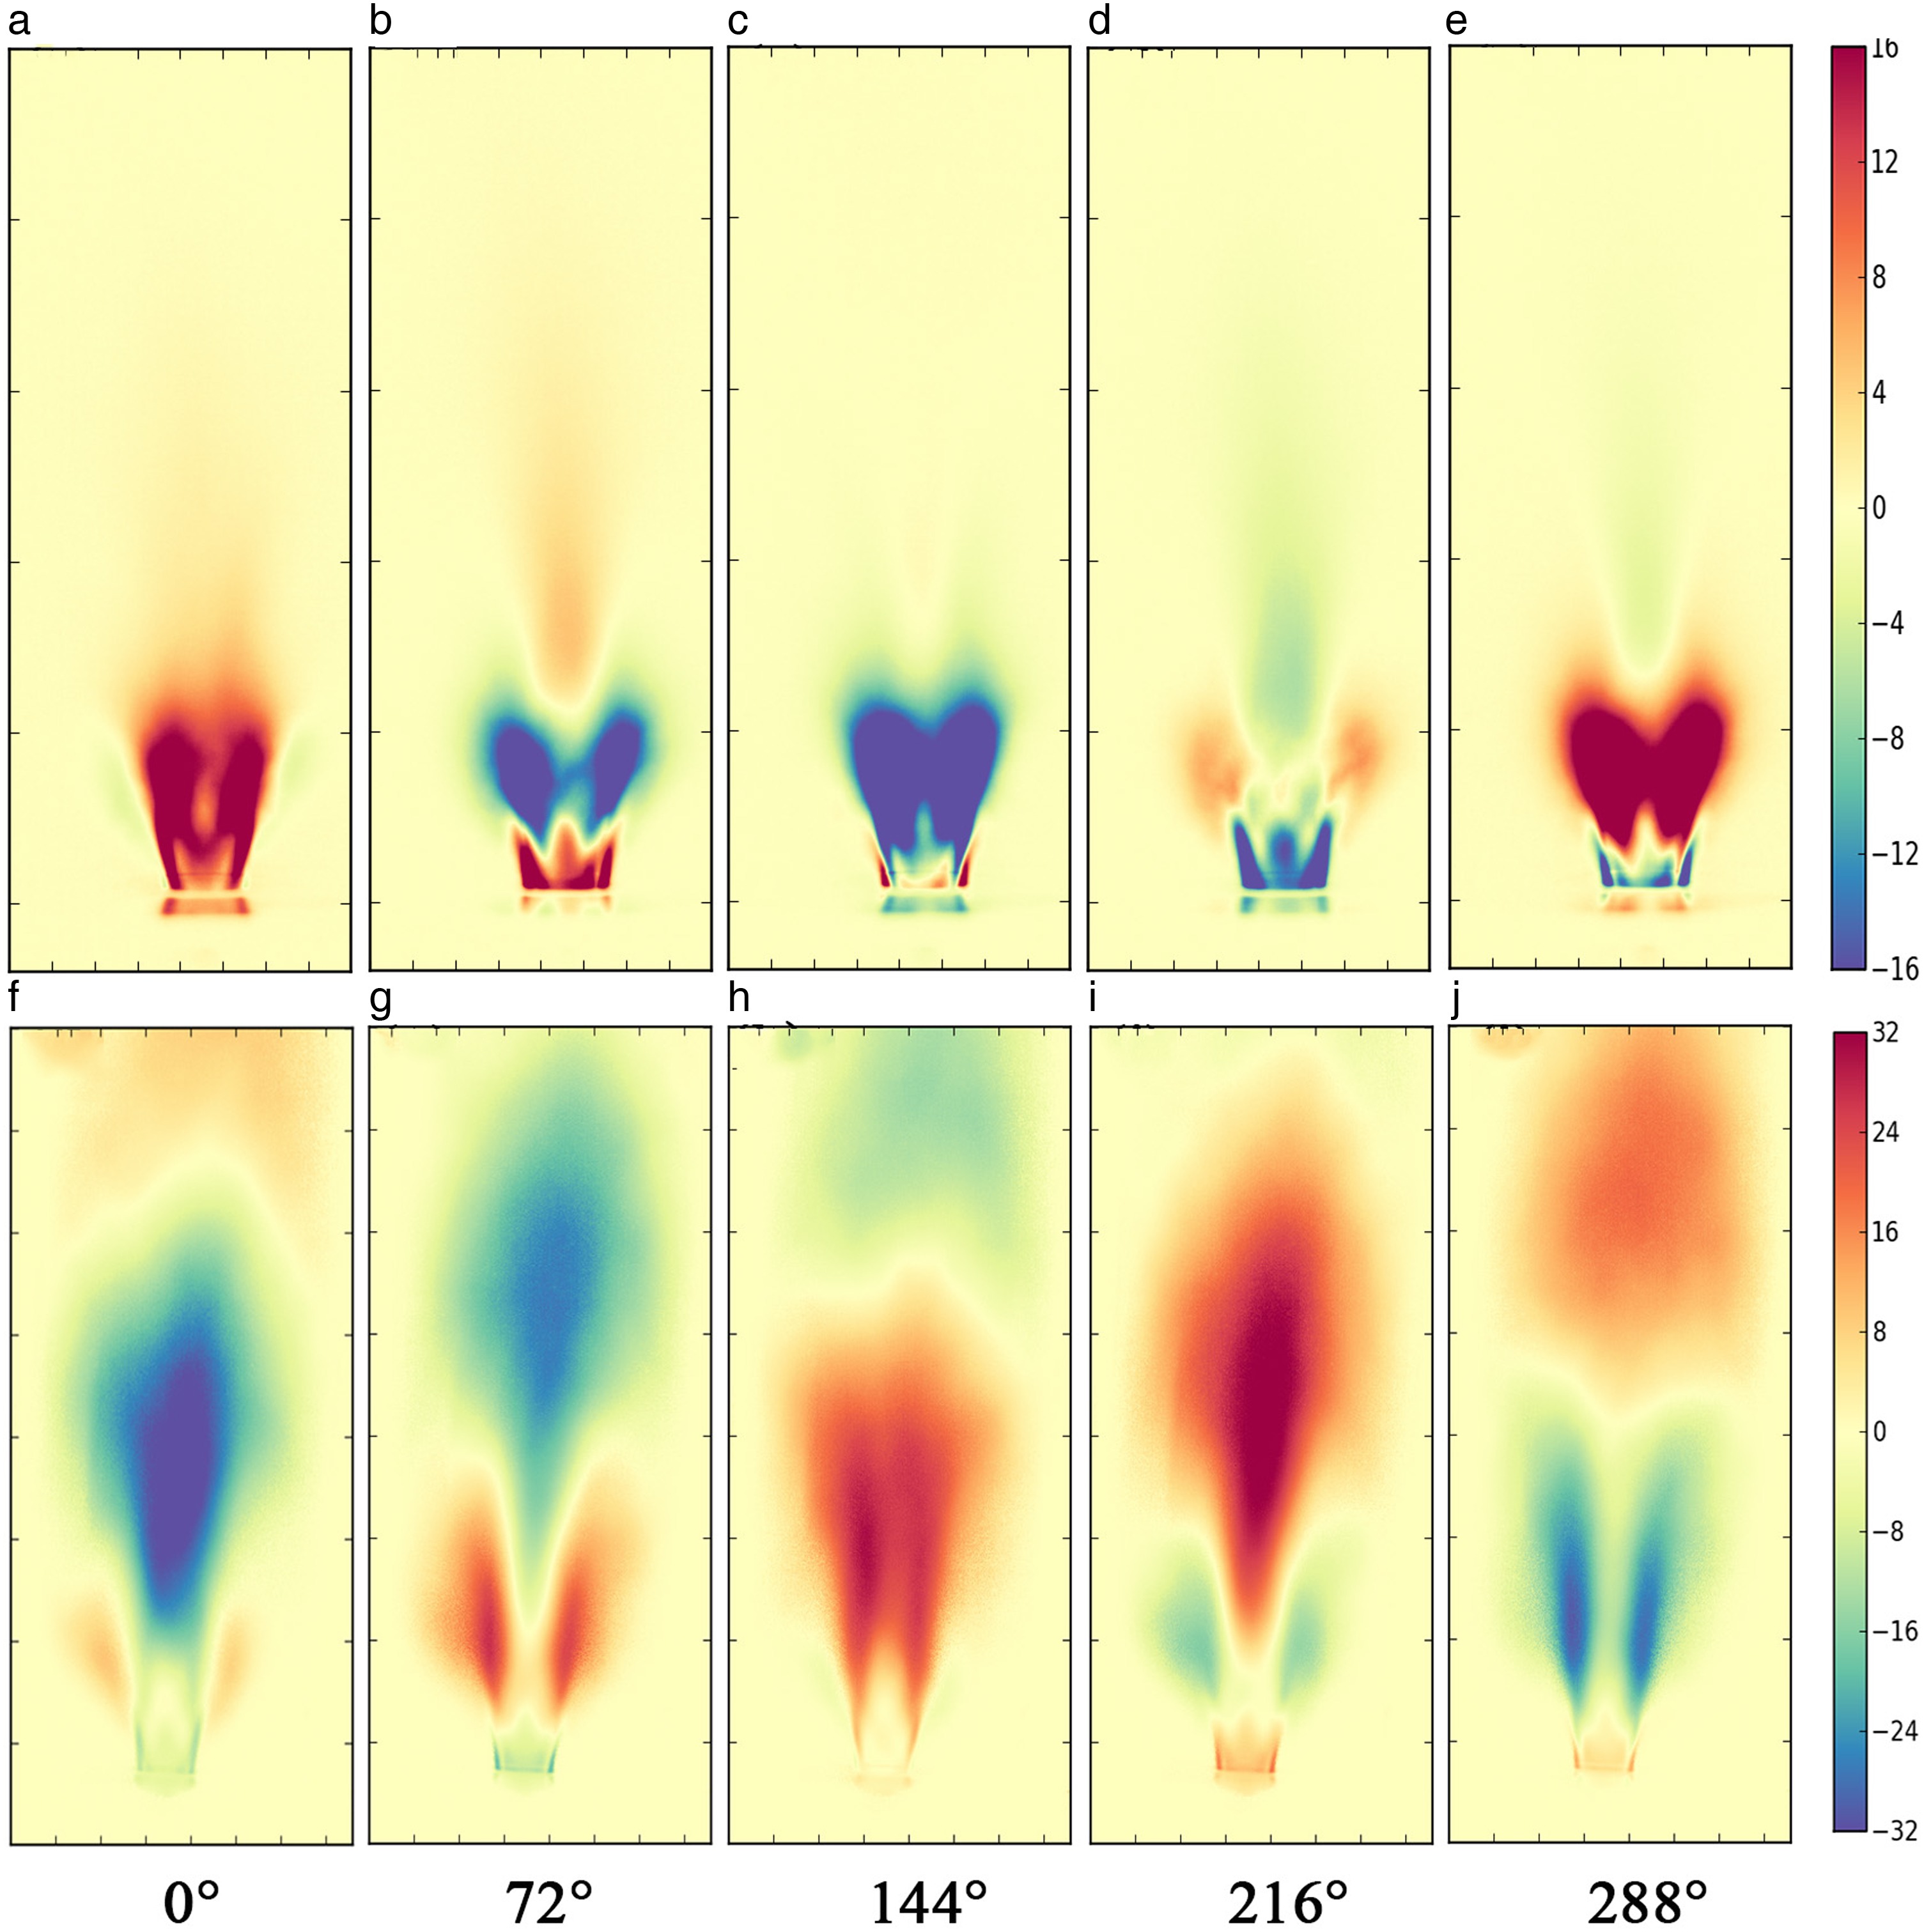
Figure 16 presents the DMD mode phases of flame and hot burnt gas for Case 5. The mode phases of flame present a process of downstream to upstream development, which is the typical feature of LF mode. Meanwhile, the mode phases of hot burnt gas present a process of upstream to downstream development. The combustion instability is in LF mode, which is corresponding to the longitudinal mode. Meanwhile, Figure 17 is the mode phases of the special frequency (f b). This special frequency is 6 Hz and 7 Hz for Case 4 and Case 5, respectively. This mode is different from the longitudinal mode presented in Figure 17. This special mode may be due to the flicker of the hot burnt gas caused by buoyancy.

Conclusions
An experimental platform of propane/air premixed swirling combustion was developed. Dynamical characteristics of combustion instability were investigated experimentally, mainly focusing on the unstable modes and the features of downstream hot burnt gas. The imaging sequences of swirling flame were investigated by DMD method. The main conclusions are summarized below:
The stability map is obtained through experiments. Three typical unstable modes (LF mode, C1/4 mode and P1/2 mode) are detected, which are well consistent with the resonant acoustic mode of combustor system. A mixed mode is found as a transition between LF mode and C1/4 mode. The transition is mainly related to the combustion power and equivalence ratio.
DMD method can decompose complex combustion oscillation modes effectively and distinguish various unstable mode features. The LF mode and C1/4 mode are both longitudinal modes, which exhibit different process in mode phase. The DMD spectrums of flame are consistent with the FFT spectrums of OH* and acoustic signals in frequency domain. Thus, there is a coupling between heat release and acoustic pressure.
Simultaneous imaging in the UV-IR-cut and Near-IR-pass bands has been successfully applied to the diagnosis of combustion oscillation. The downstream hot burnt gas in stable and unstable combustion show significant different behaviour. For unstable modes, the intrinsic frequencies of the hot burnt gas are similar to the flame. Though there is strong coupling, a time lag is found in time space. Meanwhile, a special mode (7 Hz) is discovered in the hot burnt gas, suggesting the dynamics of hot burnt gas is different from the flame. The specific coupling process between flame and hot burnt gas may need further study. However, the simultaneous imaging in the visible and near-infrared bands provides a new idea for the investigation of combustion instability.