
Introduction
Nowadays the main use of energy is to convert heat energy into mechanical energy. Even though the heat source may come from nuclear reactor, solar energy, geothermal energy, industrial waste heat, chemical fuel combustion and so on, the conversion system is mainly the closed Brayton cycle with special working fluids. Among the numerous alternative cycling mediums, the supercritical carbon dioxide (SCO2) is becoming more and more popular due to its high critical temperature which is close to normal temperature and high density which considerably reduced the machine size (Feher, 1968; Dostál et al., 2011; Deng et al., 2017; Yao and Zou, 2020).
It is the compressor that works near the critical point of CO2 in the closed Brayton cycle system, so the application advantage of CO2 as the working medium in Brayton cycle system is mainly reflected in CO2 compressor (Wright et al., 2010; Lettieri et al., 2015; Lee et al., 2016). However, there are few studies which theoretically analyze how the physical properties of CO2 near the critical point affect the compressor performance. The main difficulty lies in the lack of a set of specifications to restrict other variables so that only the real gas effect is considered. Baltadjiev (Baltadjiev, 2012) avoided the above problem by comparing the one-dimensional nozzle flow of real gas and ideal gas. The results indicated a reduction of 9% in the choke margin compared to its performance at ideal gas conditions. Although it is difficult to directly extend the conclusion of one-dimensional nozzle flow to three-dimensional rotating compressor flow, lessons can be drawn from the application of the isentropic pressure exponent
One possible method is to obtain a series of dimensionless parameters that affect the compressor performance through dimensional analysis (Simon et al., 2017). By remaining these dimensionless parameters unchanged, the performance comparison will be meaningful. This solution, which is called similitude method, is widely adopted in the field of air compressor experiments. In fact, for two similar air compressors, the performance of the two compressors is identical because the physical properties of the working fluids remain unchanged (Dixon and Hall, 2014). In condition that the fluid properties are changed, some researchers have studied the similitude method between different ideal gas compressors. There are several ways to deduced the similarity criteria, including dimensional analysis (Roberts and Sjolander, 2005; Chen et al., 2019b), kinematic similarity derivation (Zou and Ding, 2018) and differential equation method (Zhu et al., 2008). However, when it comes to the near-critical CO2, the ideal gas assumption can not be satisfied, so the above methods are no longer applicable. Pham (Pham et al., 2016) proposed a set of similitude parameters by introducing the isentropic pressure exponent
In this paper, a set of nondimensional parameters which determine the compressor performance are firstly deduced by dimensional analysis. Since physical properties of CO2 vary with different compressor inlet conditions, it is hardly possible to keep all the physical property parameters unchanged. Thus, this paper proposed a set of new similitude parameters which may ensure approximate similarity between real gas compressors by combining the physical property parameters and the deduced nondimensional parameters. Then keeping these similitude parameters unchanged, the variation of a SCO2 compressor performance is studied when its inlet condition changes along an isotherm line and an isobar line near the critical point. Numerical simulations are also adopted for validation. Finally, using this similitude method, the performance distribution of a SCO2 compressor in a certain range of inlet pressure and temperature is given. The influence of the real-gas effect on the compressor performance is summarized, and some suggestions on the designed inlet flow condition of the SCO2 compressor are given.
Methodology
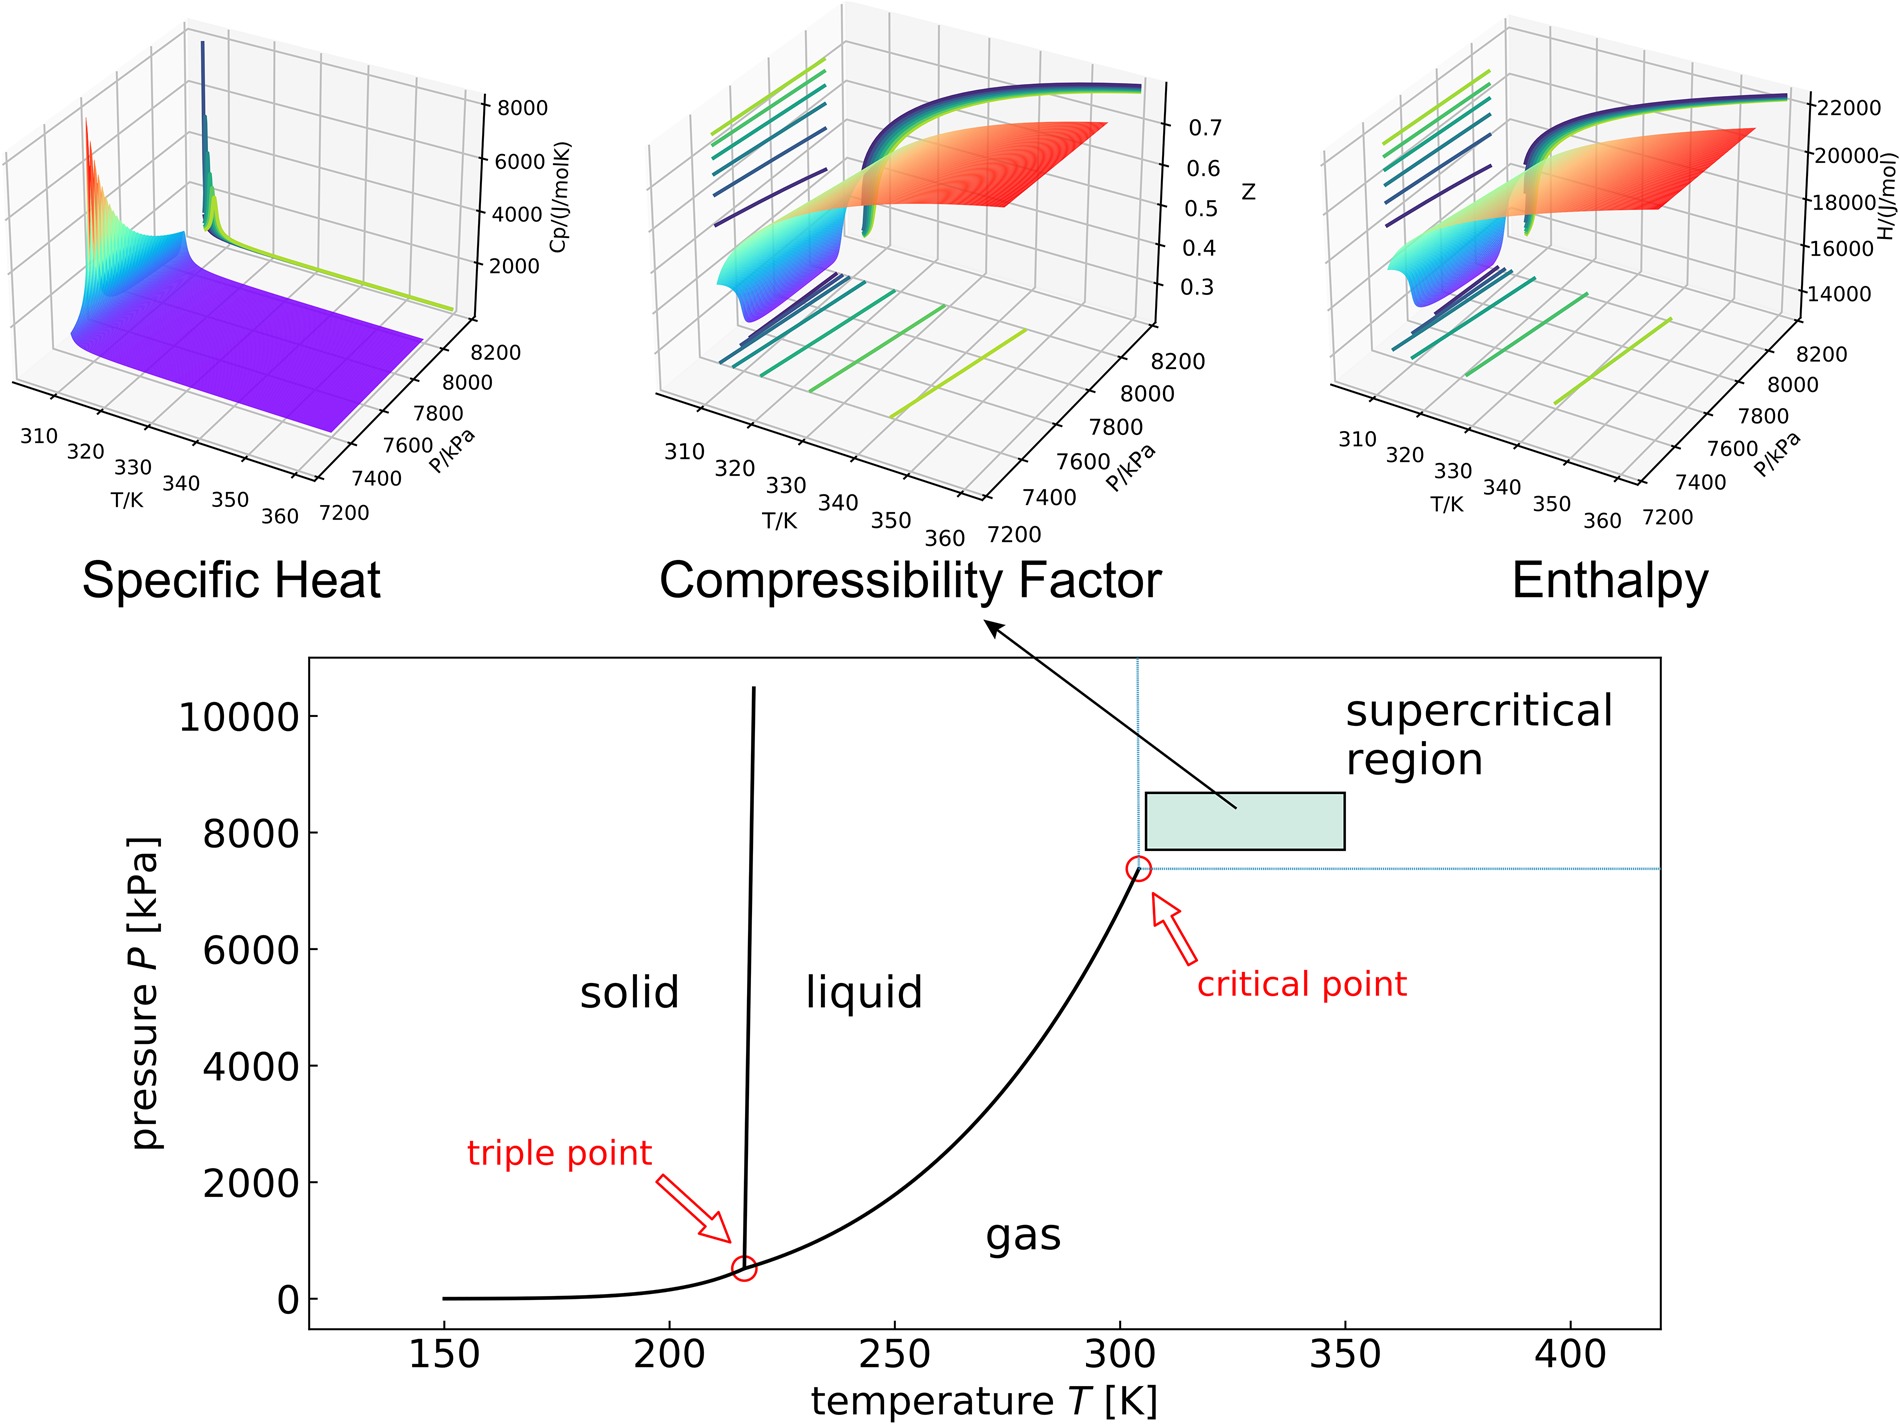
Physical properties of carbon dioxide
The specific heat
Dimensional analysis
The performance of a compressor can be expressed in terms of the control variables, geometric variables, and fluid properties. The geometric variables are characterized by the impeller diameter
Due to the strong nonlinear characteristics of the physical properties near the critical point for CO2, the state equation of ideal gas is no longer applicable. In addition, the specific heat ratio cannot reflect the isentropic change process of working fluid alone. Hence, the compressibility factor Z and the isentropic pressure exponent
where
Now it is convenient to write the two functional relationships as
Choosing the parameters
where
Obviously, full similarity can only be achieved when the above six nondimensional parameters are all identical. However, no matter for the similarity between the real gas and the ideal gas compressor, or for the similarity between the real gas compressors with different inlet conditions, it is impossible to ensure that all physical parameters are equal. Therefore, refer to Chen’s work (Chen et al., 2019b), we derived a set of new similitude parameters to achieve approximate similarity by combining those nondimensional parameters and fluid property parameters. The forms are as follows:
In the Equations 7 and 8, the bracket represents a new parameter composed of its internal parameters. Its specific expression will be derived in the next section.
Similitude parameters
In this section, the specific expressions for the mass flow similitude parameter, the compressibility similitude parameter, the pressure ratio similitude parameter and the efficiency similitude parameter are deduced based on some similarity assumptions.
According to the real gas thermodynamics, the mass flow and critical mass flow are
Therefore, the similitude parameter for the mass flow is
Since it is much more popular to use isentropic efficiency
For similar velocity triangles, there is
Above all, the final similitude parameters are as follows
Approximate similarity
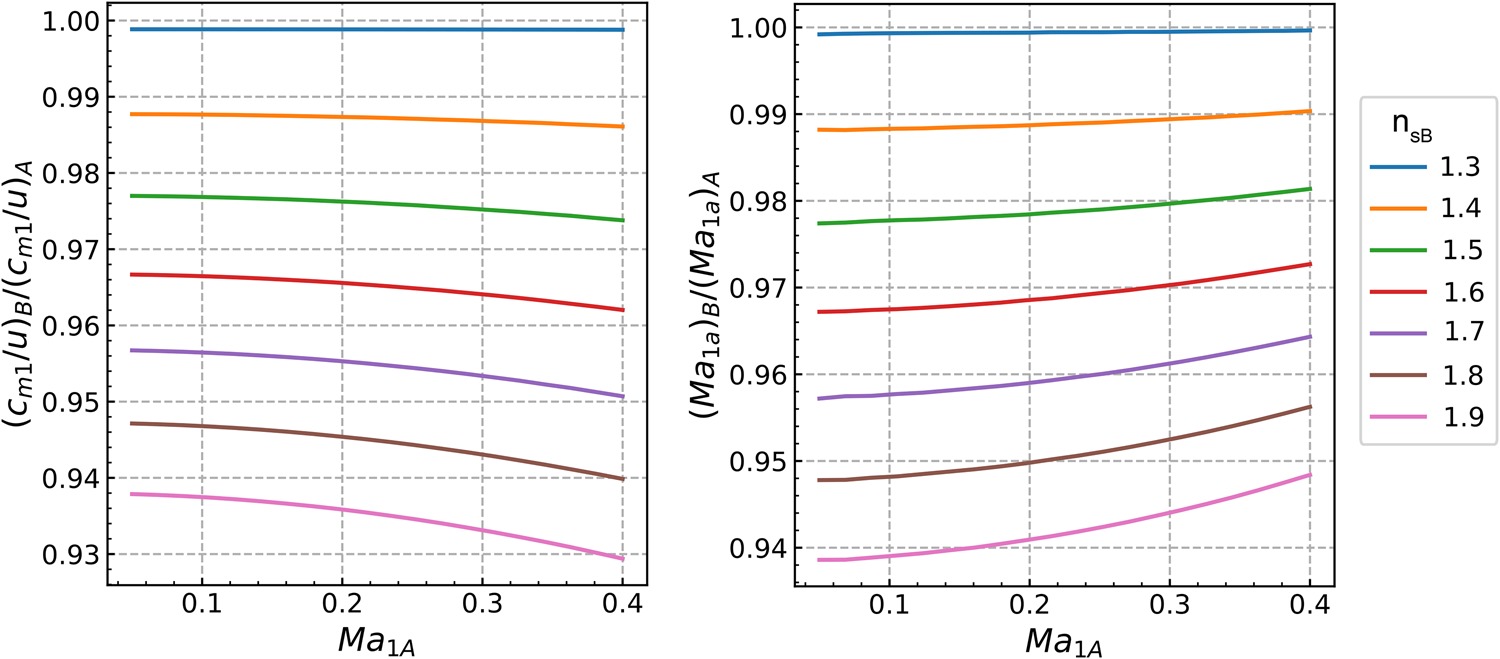
While the fluid properties are not completely identical, only approximate similarity can be achieved using the above similarity criterion. Thus, it is necessary to evaluate the degree of similarity. The similarity of compressor can be evaluated from two aspects, namely, kinematics similarity and dynamic similarity. The kinematics similarity means that the inlet and outlet velocity triangles of the compressor are proportional respectively, which can be quantified by
For two compressors with the identical geometry but different working media, assuming that the working fluids are A and B respectively, the following two equations can be derived when
(19)
(20)
Setting
Results and discussion
Validation of the similitude method
A typical SCO2 centrifugal compressor with near-critical designed inlet condition is selected for further validation. Detailed dimensions and the operation conditions of this compressor at the design point are listed in Table 1. With identical geometry, numerical simulations are performed with ideal CO2 gas and real CO2 gas. The commercial software ANSYS CFX 19.0 is used to solve steady viscous Reynolds Averaged Navier-Stokes equations with a time marching finite volume method. The spatial discretization adopts a second-order upwind scheme and the temporal discretization adopts a second-order backward Euler scheme. The shear stress transport (SST) turbulence model is used. In the numerical calculation, only one passage is simulated so that surfaces at circumferential side are set as periodic boundary conditions. Total temperature, total pressure, and inflow angle are used as the inlet boundary conditions, and static pressure is used as the outlet boundary condition. All the wall faces are set as adiabatic with no slip.
Table 1.
Informations of the simulated compressor.
| 320 K | 7,600 kPa | 30 mm | 68 mm | 152 mm | −33° |
Fully structured grids were generated using Autogrid5. An H-type grid topology is used in the mainstream passage, and an O-type topology is adopted near the blade wall and inside the tip gap. The mesh around the leading edge and trailing edge is locally refined. Mesh dependency test was done by computing the total to total isentropic efficiency and total to total pressure ratio changes for different grid sizes. It was found that grids with around 1.1 million nodes are dense enough to provide grid-independent results. Sufficiently fine cells near the walls were generated to ensure the values of y+ close to unity. Figure 3 demonstrates the studied centrifugal compressor and the structured grid.

The CFX bulit-in ideal gas model for CO2 is selected for the ideal CO2 compressor simulation. As for the real gas CO2 compressor, an external real gas properties (RGP) look-up table is used to define the properties of CO2 such as enthalpy, entropy, pressure, temperature, density, sound speed, specific heat in constant pressure and viscosity. The abovementioned properties are taken from the widely used NIST REFPROP 9.0 database (Lemmon et al., 2002). RGP table resolution is gradually increased when getting closer to the critical point and the minimum interval of the pressure and the temperature are 10 kPa and 0.1 K respectively. The table covers sufficient wide ranges of temperature and pressure to prevent clipping or extrapolating of the properties. To validate the accuracy of the fluid thermodynamic property interpolation, the simulated properties at a point near the critical point and a point away from the critical point are compared with the REFPROP database. Results are showed in Table 2 and it is found that the error is less than 0.2%, indicating that the look-up table is suitable for CFD simulations.
Table 2.
Validation of the RGP look-up table.
| Point1 | Point2 | |||||
|---|---|---|---|---|---|---|
| T = 307.93 K, P = 6.48 MPa | T = 368.85 K, P = 13.62 MPa | |||||
| RGP | NIST | error | RGP | NIST | error | |
| 184.69 | 184.91 | 0.119% | 302.00 | 302.07 | 0.023% | |
| 2,556.33 | 2,561.40 | 0.198% | 2,055.89 | 2,056.31 | 0.021% | |
A real gas SCO2 compressor and an ideal gas CO2 compressor with identical
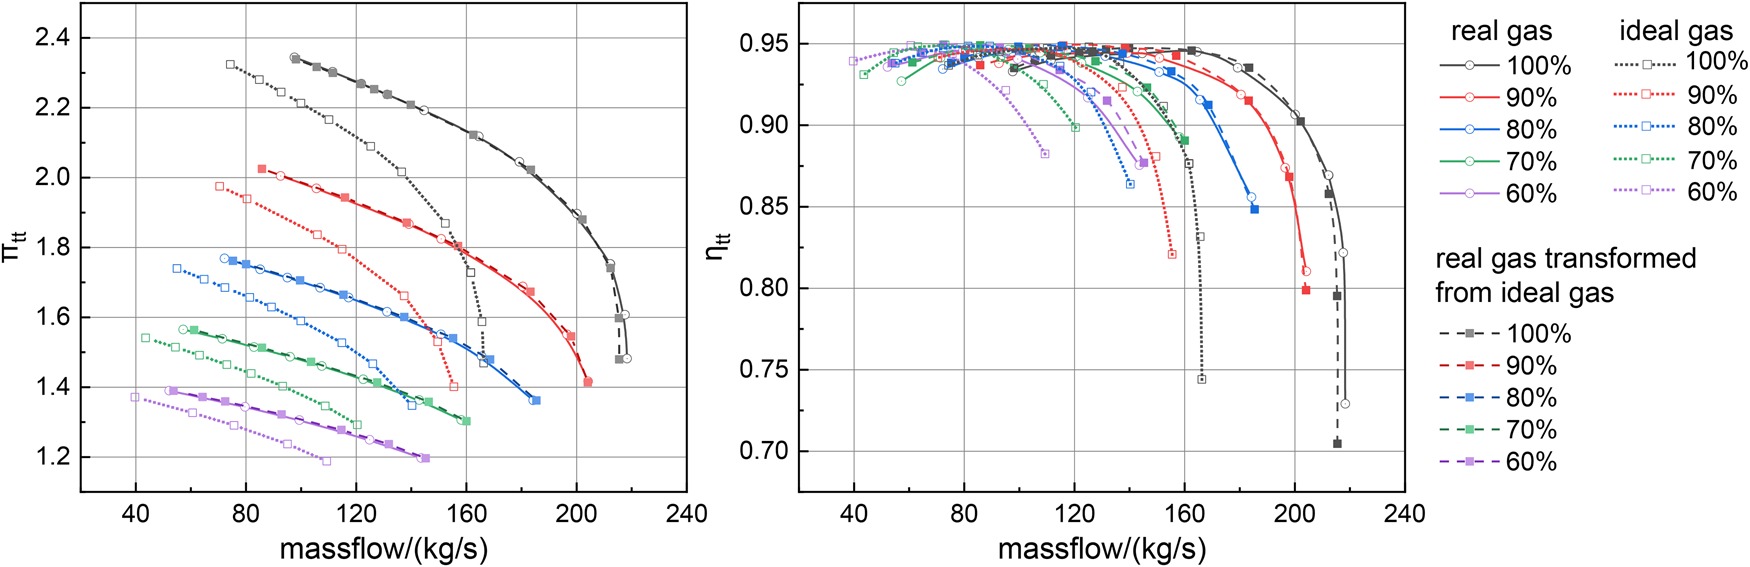
The performance parameters at design point are listed in Table 3 for each compressor. It can be observed that the relative deviation of performance prediction via the similitude method is no more than 1%, which demonstrates the high accuracy of the similitude method at the design point.
Table 3.
Comparison of the performance at design point.
| Real gas CO2 | 14,000 | 131.51 | 2.237 | 0.9472 |
| Ideal gas CO2 | 17,522 | 99.95 | 2.213 | 0.9463 |
| Transformed | 14,000 | 131.27 | 2.238 | 0.9464 |
| Error | – | – | 0.045% | 0.084% |
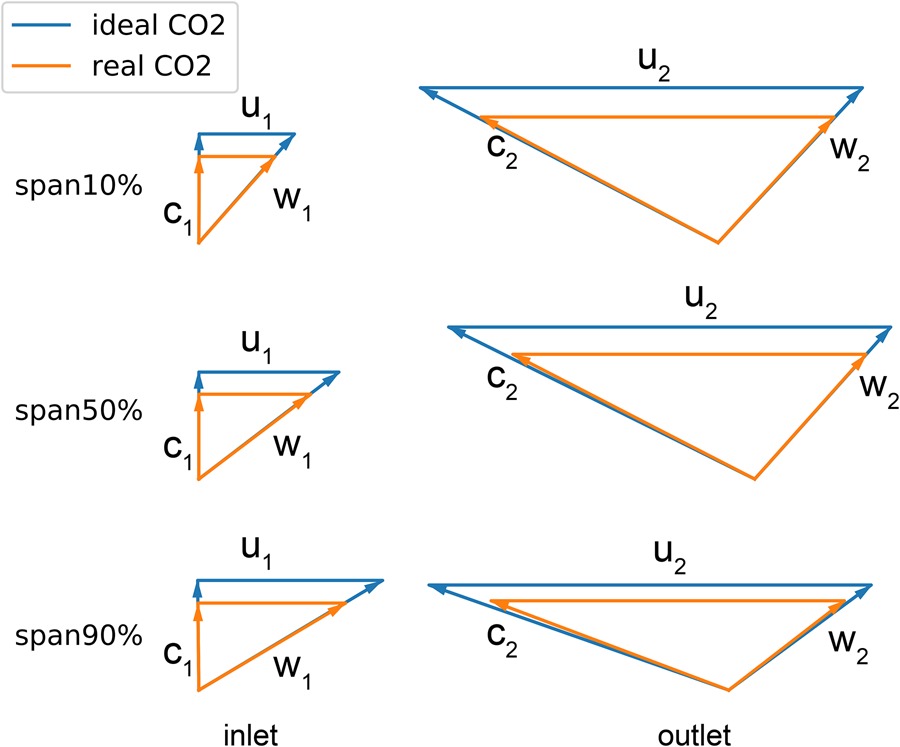
Velocity triangles at 10%, 50%, 90% span are given in Figure 5, in which the red arrows refer to real gas and the blue arrows refer to ideal gas. It can be observed that the velocity triangles of the ideal gas compressor are highly similar to those of the real gas compressor at identical locations except for the shroud region. Due to the existence of the low speed region near the impeller shroud, the mass flow through this region accounts for only a small proportion, so the deviation of the velocity triangle in this region has little effect on the prediction of the pressure ratio. Generally speaking, the assumption that the velocity triangle is similar in deriving the performance similitude parameters is reasonable.
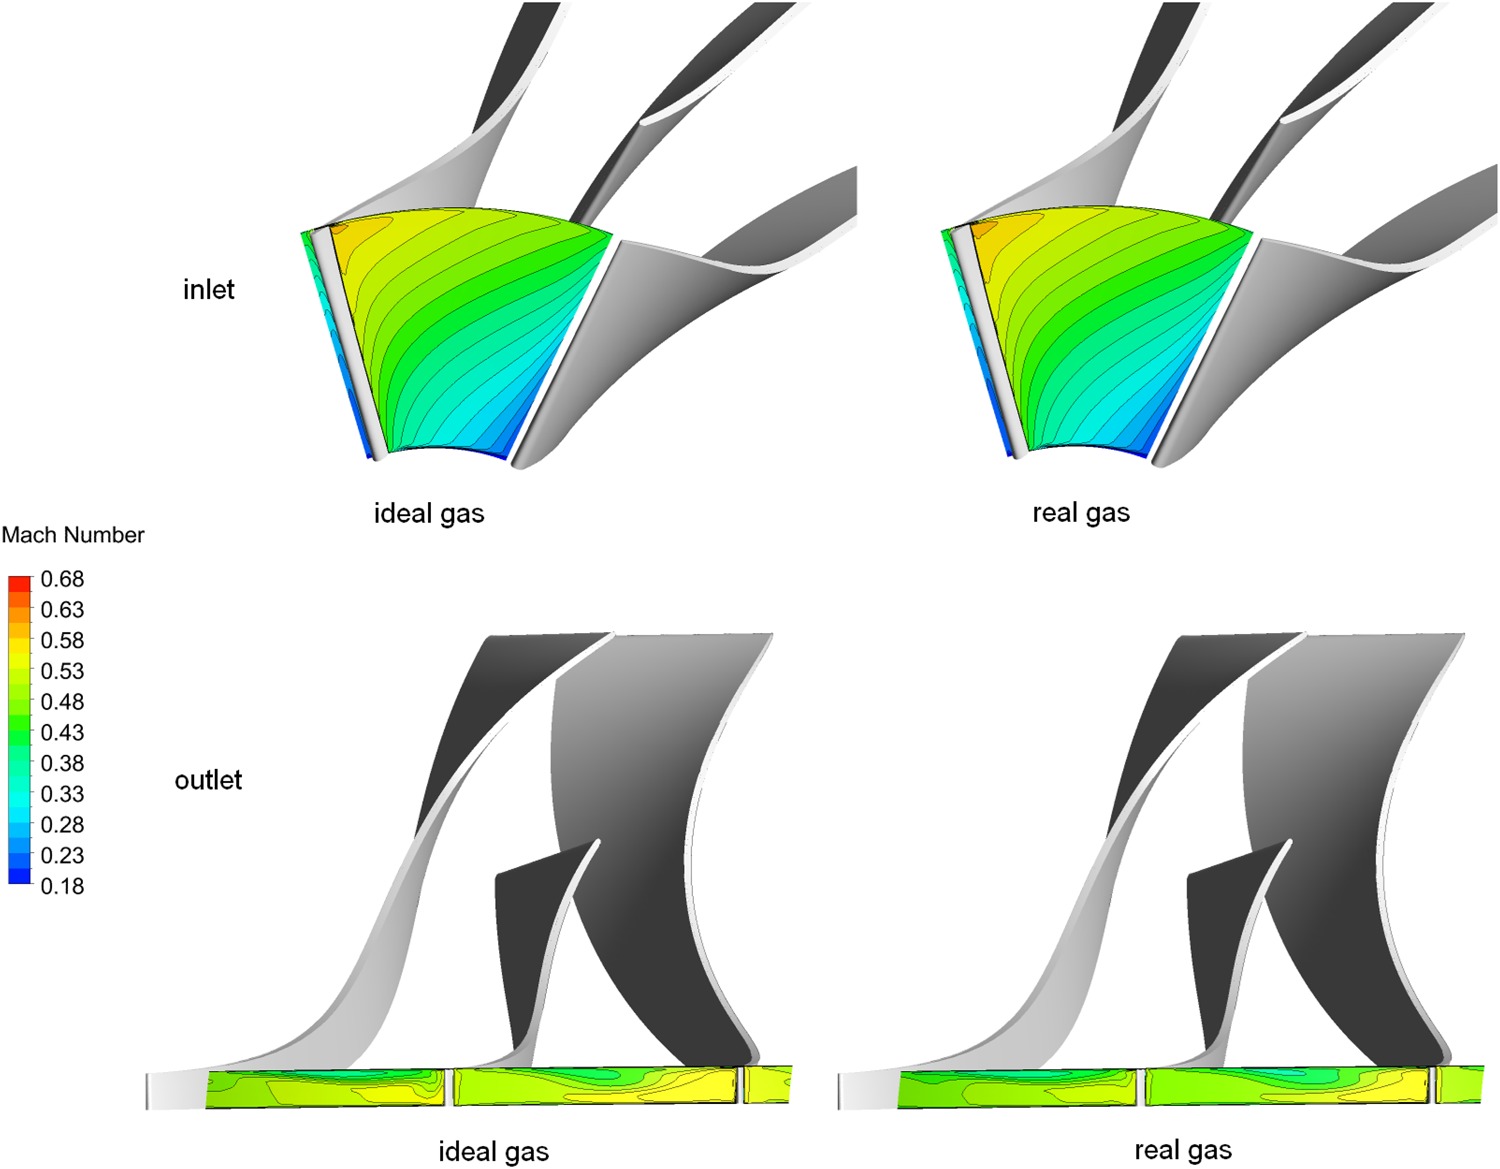
Comparison of relative Mach number contours at inlet and outlet is presented in Figure 6. It is showed that the distribution of relative Mach number at these planes in the ideal gas compressor is in good accordance with that in real gas compressor. There are only some differences in numerical values, which further proves that the proposed similitude method can guarantee the dynamic approximate similarity.
Real-gas effect on the SCO2 compressor performance
In this section, the ideal gas CO2 compressor above is transformed to real gas SCO2 compressor with different inlet conditions, and the real-gas effect of CO2 on compressor performance is studied on that basis.
Figure 7 shows the variation of compressor performance with the inlet total temperature along the isobar line
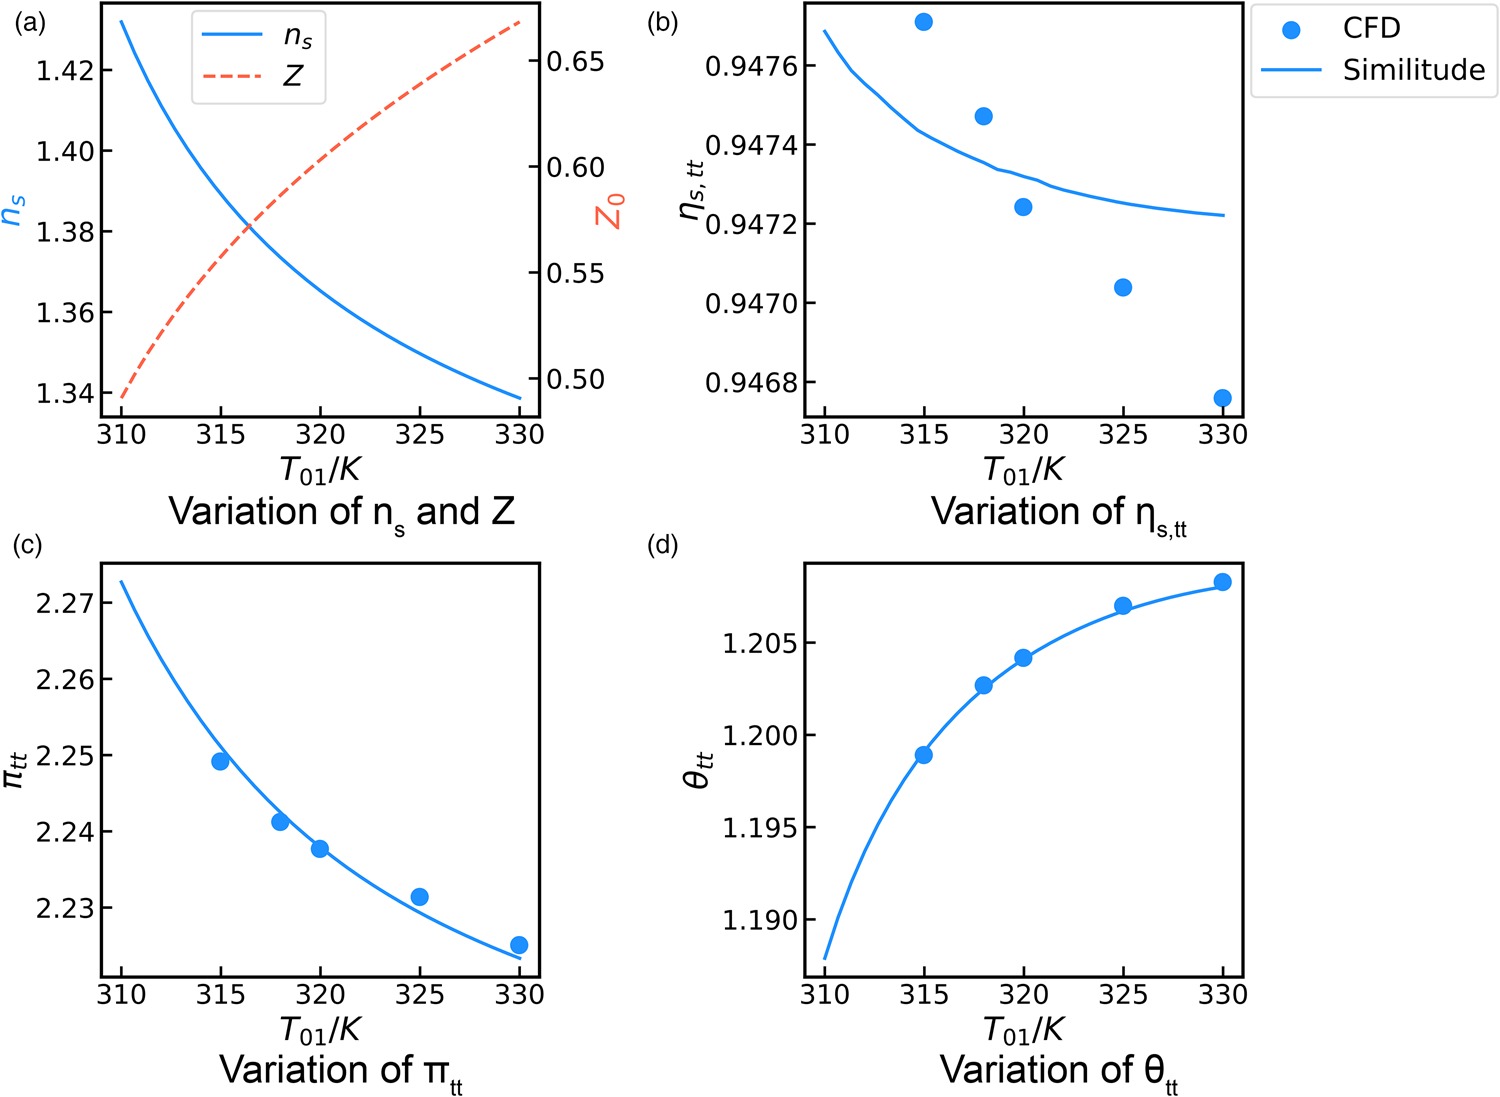
Figure 8 shows the variation of compressor performance with the inlet total pressure along the isotherm line

In the same way, the contour of compressor performance parameters in a larger temperature and pressure range can be drawn, as shown in Figure 9. The pseudo-critical line is also drawn as a reference. The pseudo-critical line in this paper is defined as the path where the gradient of
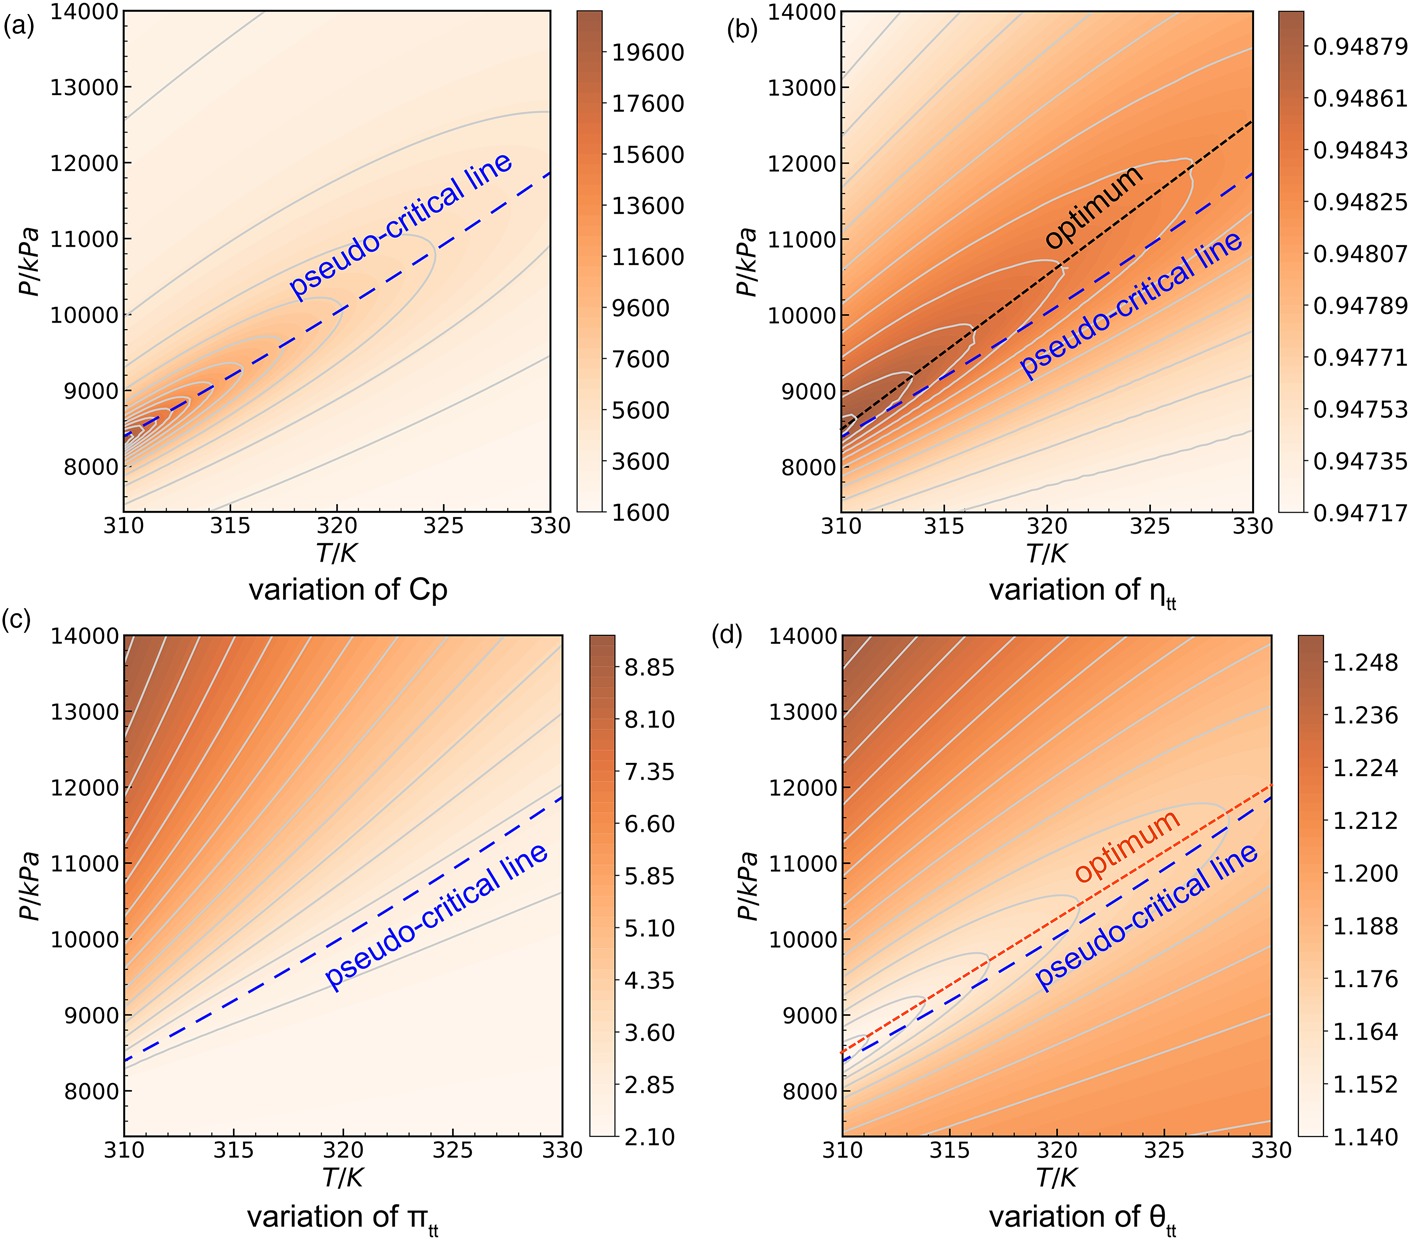
where
It can be seen that for similar SCO2 compressors, with the increase of inlet pressure or decrease of inlet temperature, the compressor’s pressure ratio gradually increases. When the inlet condition moves across the pseudo-critical line, the change rate of pressure ratio increases sharply. As for the temperature ratio and the efficiency, there is an optimal T-P relationship which makes the temperature ratio lowest and the efficiency highest. The optimal pressure is about 150 kPa higher than the pseudo-critical pressure near the critical point. In sum, the real-gas effect enables the compressor to obtain higher pressure ratio with a lower temperature rise and a bit higher efficiency, which is the advantage of the SCO2 as the working fluid. This advantage will be enhanced when the inlet temperature gets close to the critical temperature and when the inlet pressure gets close to the optimal pressure. Therefore, it is recommended that the designed inlet condition of SCO2 compressors should be taken near the critical temperature and about 150 kPa higher than the pseudo-critical line.
Conclusion
Several conclusions are drawn as follow:
Based on the dimensional analysis method and the real gas thermodynamics, a set of approximate similarity criteria for real gases is established, which consists of similitude parameters for mass flow
When the similitude parameters remain unchanged, the pressure ratio of SCO2 compressor decreases with the increase of inlet temperature and increases with the increase of inlet pressure. As for the temperature ratio and the efficiency, at a specific inlet temperature, there is always an optimal inlet pressure which can minimize the compressor temperature ratio and maximize the efficiency. The optimal pressure is about 150 kPa higher than the pseudo-critical pressure.
The real-gas effect enables the SCO2 compressor to obtain higher pressure ratio with lower temperature rise, which is the advantage of SCO2 as a working fluid. It is recommended that the inlet temperature of SCO2 compressor should be as close to the critical temperature as possible, and inlet pressure should be about 150 kPa higher than the pseudo-critical pressure.
Nomenclature
Latin letters
Mass flow (kg/s)
c
Absolute velocity (m/s)
Cp
Specific heat at constant pressure [J/(kg·K)]
D
Impeller diameter (m)
H
Enthalpy (J/kg)
Ma
Mach number (−)
Mu
Impeller tip-speed Mach number (−)
n
Rotational speed (rpm)
ns
Isentropic pressure exponent (−)
P
Pressure (kPa)
r
Radius (mm)
Rg
Gas constant (J/(kg·K))
T
Temperature (K)
u
Impeller blade tip speed (m/s)
Z
Compressibility factor (−)