
Introduction
Flow and heat transfer within the rotating cavities that are formed between successive rotor discs in axial compressors is an important topic of research concerning gas turbine engines. The radial growth of these discs control the running tip clearance of the compressor blades which in turn determine the range and the aerodynamic performance of the compressor. With the regulatory bodies tightening the emission standards there is a quest for ultra-high bypass ratio engines with smaller core diameters that provide higher propulsive efficiency. The tip clearance control is more important than ever in these smaller core engines and there is a need to better understand and model the complicated aerothermal mechanisms that control the flow structure and the heat transfer in these cavities. The coupled nature of the buoyancy driven cavity internal flow development and the disc heat transfer, its interaction with the colder throughflow air along the shaft bore, all make it highly inaccessible for experimentation and even less amenable to numerical simulation employing modelled turbulence.
A number of researchers have contributed to our current understanding of the flow physics associated to rotating cavities within axial compressors. A set of dimensionless parameters have been traditionally used by such researchers for characterising the conditions within a rotating cavity with axial throughflow. These parameters are also used to describe the flow regimes in the current work and are therefore presented first in Table 1.
Table 1.
Governing dimensionless parameters for cavity flows.
| Axial Reynolds number | |
| Rotational Reynolds number | |
| Rossby Number | |
| Grashof Number | |
| Buoyancy parameter |
Flow visualisation and LDA measurements in three different flow geometries were reported by Pincombe (1983). These included a cavity with a central axial throughflow, a cavity with a radial outflow and a cavity with radial inflow. Two modes of breakdown were observed for both laminar and turbulent flow in a cavity with axial throughflow. An asymmetric spiral breakdown was observed where the axial jet departed from the central axis and proceeded violently inside the cavity. An axisymmetric breakdown was observed when the axial jet extended inside the cavity. It was also found that the boundaries between the different breakdown modes were dependent upon the Rossby number. Firouzian et al. (1985) conducted flow visualisation in a rotating cavity with a radial inflow. The rotational Reynolds number tested was up to
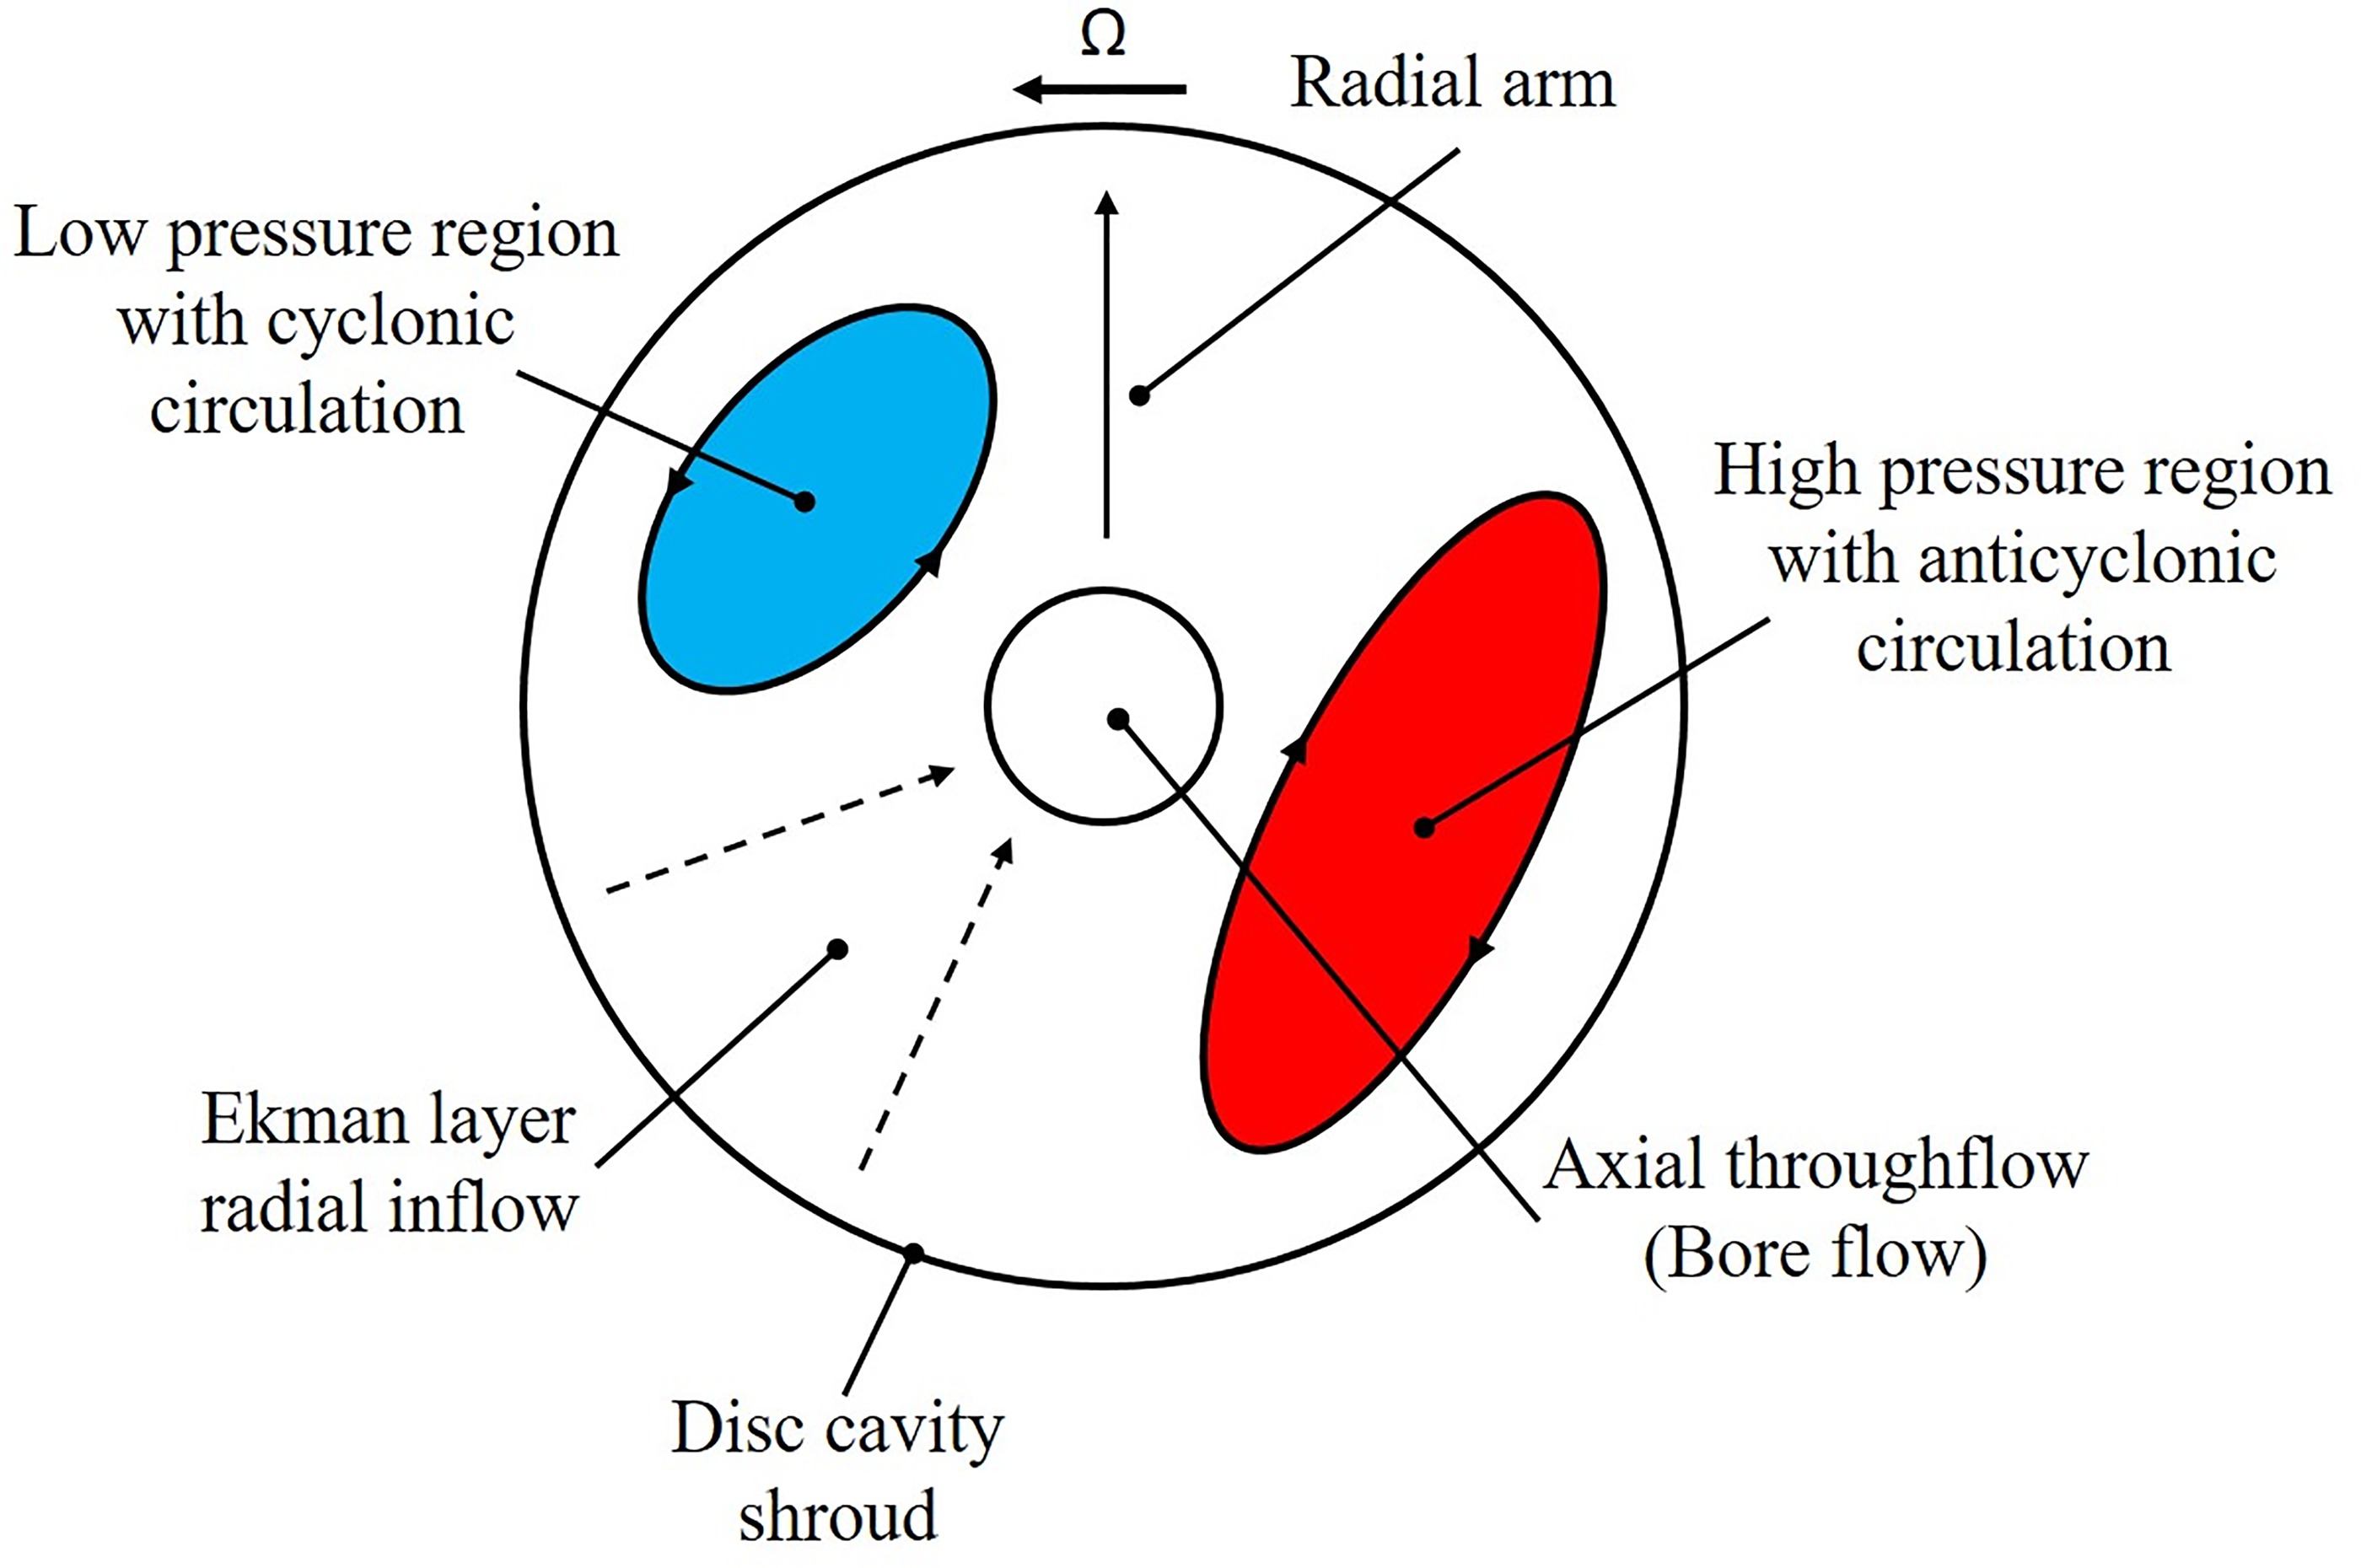
Figure 1.
Schematic of flow structure in heated rotating cavity with axial throughflow of cooling air (Based on the model proposed in Farthing et al., 1992a).
Bohn et al. (2000) conducted flow visualisation within a rotating cavity and reported a similar flow structure as Farthing et al. (1992a). The role of buoyancy on heat transfer in rotating cavities was the focus of Alexiou (2000) whose measurements revealed that the flow in rotating cavities can be dominated by free convection, forced convection or both (Alexiou et al., 2000; Long et al., 2003). Owen and Powell (2004) carried out LDA and heat transfer measurements in a single cavity rig, with a/b ≈ 0.4 and
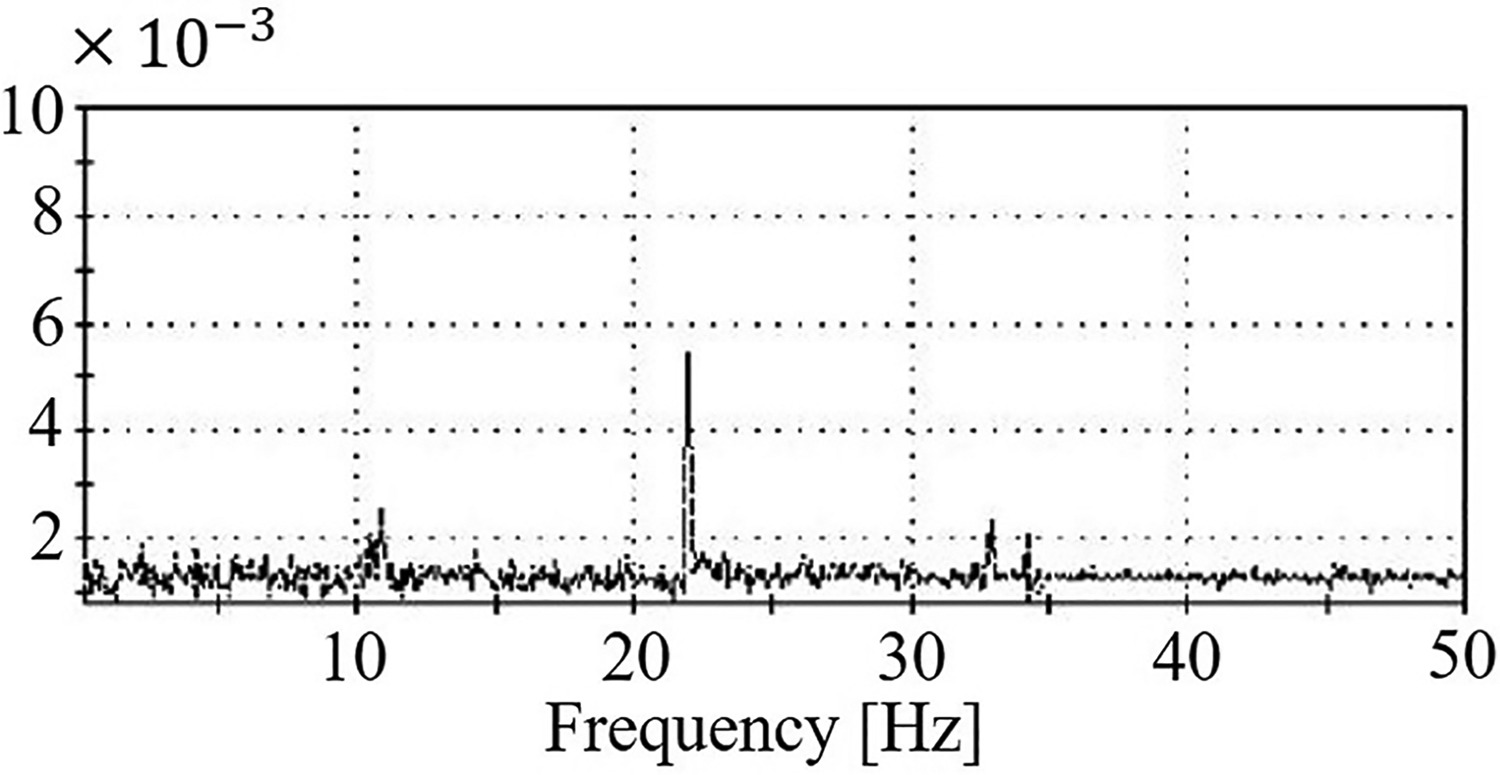
Figure 2.
Spectral analysis of the tangential component of velocity, (rotational speed of cavity = 10.92 Hz), from (Long et al., 2007).
Dweik et al. (2009b) conducted a total of fifteen unsteady computational case studies for an open rotating cavity for idle, high-power and shutdown conditions. The test rig conditions in Owen and Powell (2004) was imitated to develop a numerical test case. The data showed a temporal evolution in flow structure eventually resulting in the formation of the radial arms. The results from the test cases showed a consistent agreement with the data from Johnson et al. (2006). The above authors also showed that despite the unstable and evolutionary nature of the complicated flow pattern, the free convection correlations for a vertical flat plate with constant temperature gives an encouraging prediction for the global Nusselt number values for the buoyancy-induced flow (Dweik et al., 2009a). Atkins and Kanjirakkad (2014) conducted measurements in the same multiple cavity rig as (Alexiou, 2000; Long et al., 2007) but this time with a stationary shaft and the direction of flow through the rig reversed compared to the previous builds. Additionally, in these experiments the shroud was radiantly heated. They measured the steady state temperatures on both sides of the disc separating cavities 2 and 3 that was instrumented by embedded surface thermocouples. The results demonstrated the sensitivity of the radial temperature distributions along the disc with the variation of Grashof number, axial throughflow and rotational Reynolds number for approximately constant Rossby number. For instance, for
In this paper, the authors present experimental data obtained from the Sussex Multiple Cavity Rig (MCR) for a fixed rotational Reynolds number
where, β is the coefficient of volume expansion such that
Research methodology
The Sussex Multiple Cavity Rig (MCR) is used to study the heat transfer dominated flow structure within the multiple rotating cavities that are typical of an aero-engine high pressure compressor. The current rig is a 70% scaled replica of a typical high pressure compressor internal air system.
Experimental set up
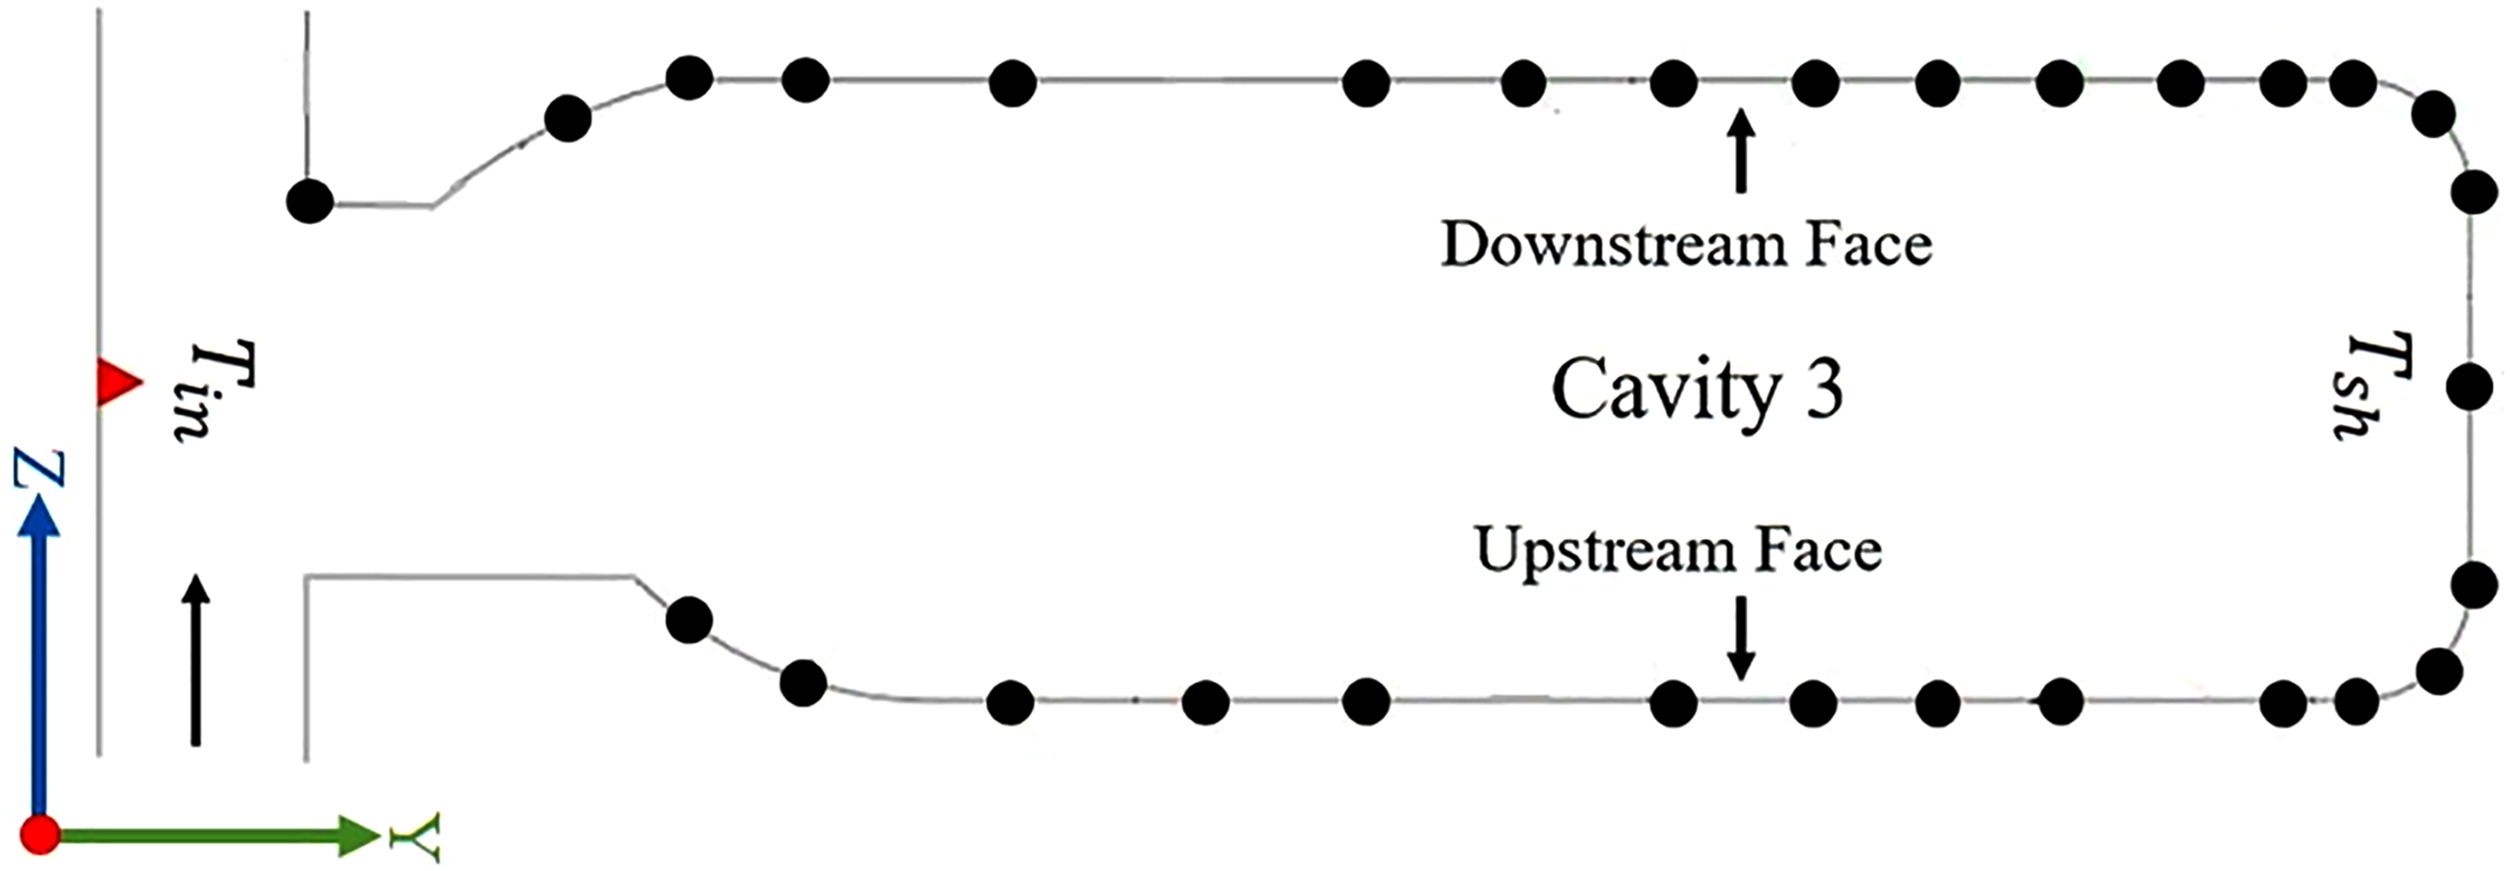
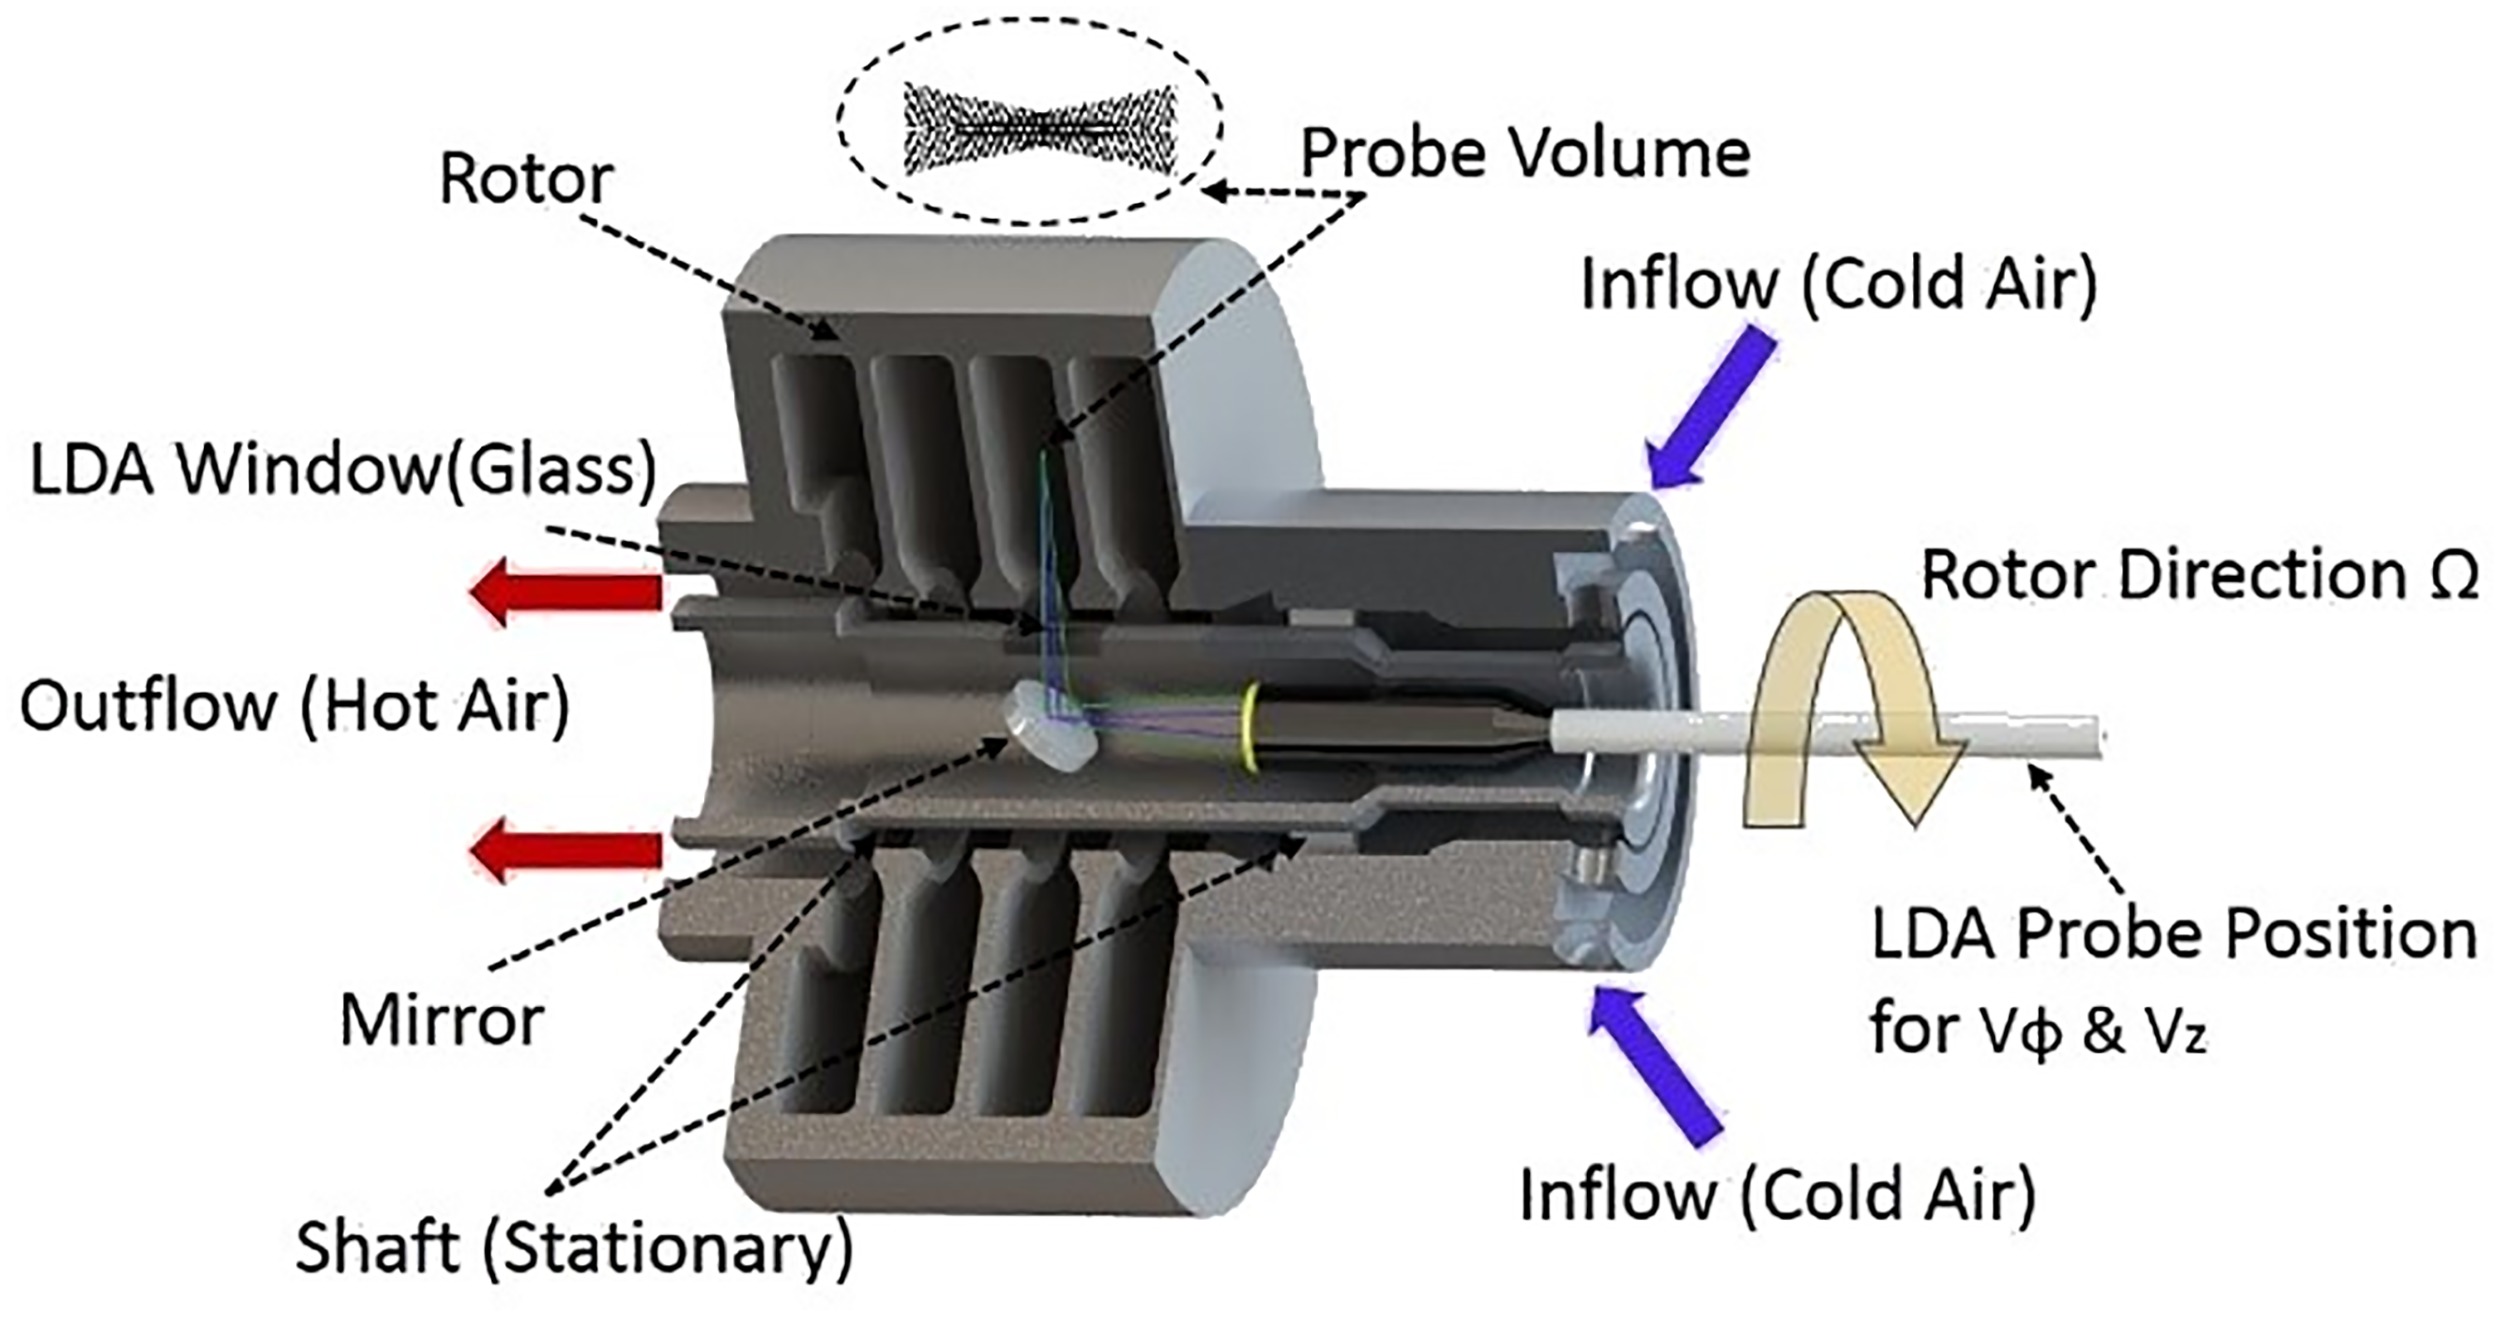
There have been several modification on the MCR over the years. Figure 4 illustrates the cross-sectional view of the rig in its current configuration. The pink sections illustrates the new stationary shaft where the LDA window is located. The grey region indicates the outer drum and other stationary components. The orange section is the rotating assembly and the red part represents the radiant heater array. The shaft telemetry that is stationary is shown in the purple region while the rotating rotor telemetry is presented in the orange region and located at the end of the rig. It is worth noting that the direction of the axial throughflow (cold air) is in the opposite direction to the disc and cavity numbering. The cavity discussed in this paper is the cavity 3 that is located between discs 3 and 4 (dashed black rectangle).
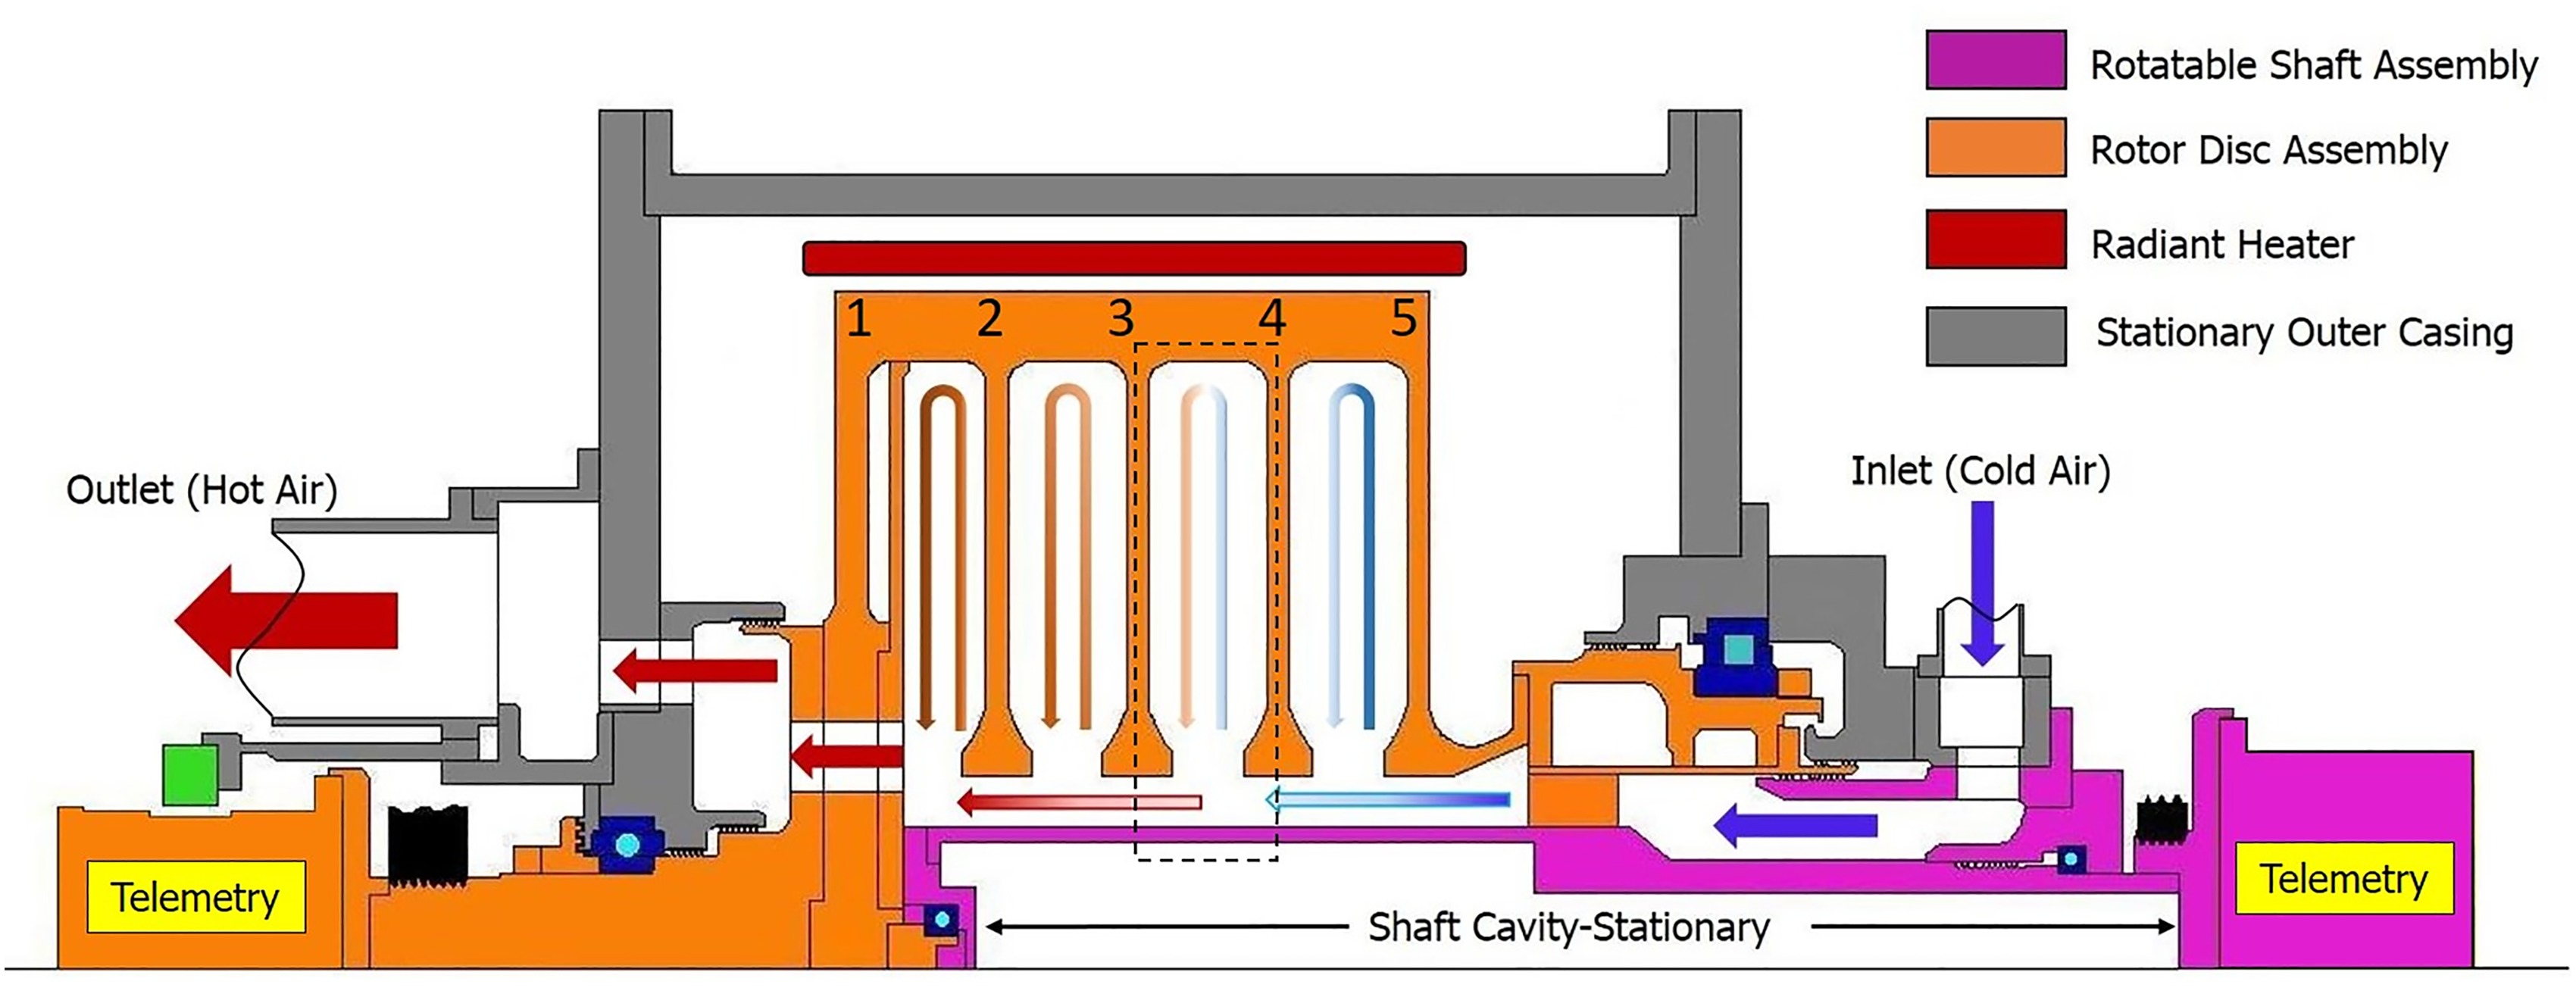
The rotating assembly is manufactured from Ti-6Al-4V titanium alloy. The inner radius (a) and the outer radius (b) of the cavities are 70.1 and 220 mm respectively, hence the radius ratio (a/b) is 0.318. The disc spacing (s) is 42.9 mm and the gap ratio (G) is 0.195. The central shaft radius (rs) is 52 mm and the hydraulic diameter (dh) is 36.2 mm. The shaft is held stationary for all runs. The air passes between six rotating blocks (rectangular, 10 mm wide) before entering the bore region in order to form a similar flow restriction to the rotor endplate. A two stage, screw type, Atlas Copco ZT250 compressor was used to supply the throughflow air. The mass flow rate was measured by a calibrated venturi meter installed in the inlet pipe work upstream of the rig. An array of radiant heaters (red section) is positioned circumferentially around the outer casing to simulate the hot flow in the annulus of the high pressure compressor. The rotational speed is measured by a magnetic pickup probe. Glass fibre insulated K-type thermocouples with wire dimeter of 0.25 mm were used to measure the temperature in the rotating frame of reference. The thermocouples are embedded circumferentially along a line for at least ten wire diameters to reduce the conduction errors. The nominal diameter of the thermocouple beads is 0.4 mm. The installation procedure is described in Atkins and Kanjirakkad (2014). The shaft air thermocouples are positioned at r/b = 0.25. The distribution of the thermocouples in the cavity was shown earlier in Figure 3. A comprehensive discussion of the experimental apparatus and measuring technique is provided by Fazeli et al. (2020).
LDA information
Laser Doppler Anemometry (LDA) was used to measure velocity components in the cavities and the bore region within the Multiple Cavity Rig. LDA has the advantage that the output burst signal is a function of velocity that does not need calibration. It can also detect reverse flows regions with a suitable frequency shifting technique. Figure 5 shows a cut-away of the LDA arrangement. The LDA systems uses a green colour beam with 514.3 nm wavelength and a blue colour beam with 488.3 nm wavelength each at power output of up to 1 Watt. The front optics (lens) has a choice of either a 100 mm or a 250 mm focal length to enable access to various radial measurement locations. As the lens with 250 mm focal length produces a 4 mm long probe volume its spatial resolution is unsuitable for near wall measurements in the shroud and particularly in the bore region. To overcome this, a lens with 100 mm focal length is used to measure in these regions. A Dantec 9010 six-jet atomiser using olive oil is employed to produce 1 µm diameter seeding particles. The optical access window is made of BK7 optical grade glass treated with an anti-reflection coating for the 480–520 nm wavelength range. As seen in Figure 5, the incident laser beams and reflected signals are diverted onto the probe using a 45° mirror located on the centre line of the rig. A traverse system consisting of two concentric tubes is used to move the probe volume inside the rig, one for moving the laser probe axially in relation the mirror and the other to move the mirror itself. The lens with the shorter focal length is used for measurements in the bore and the lower radius regions of the cavity whereas the longer focal length lens is employed for measurements in the outer cavity. The accuracy of placement of the axial and radial locations is considered to be ±0.5 mm.
Numerical set up
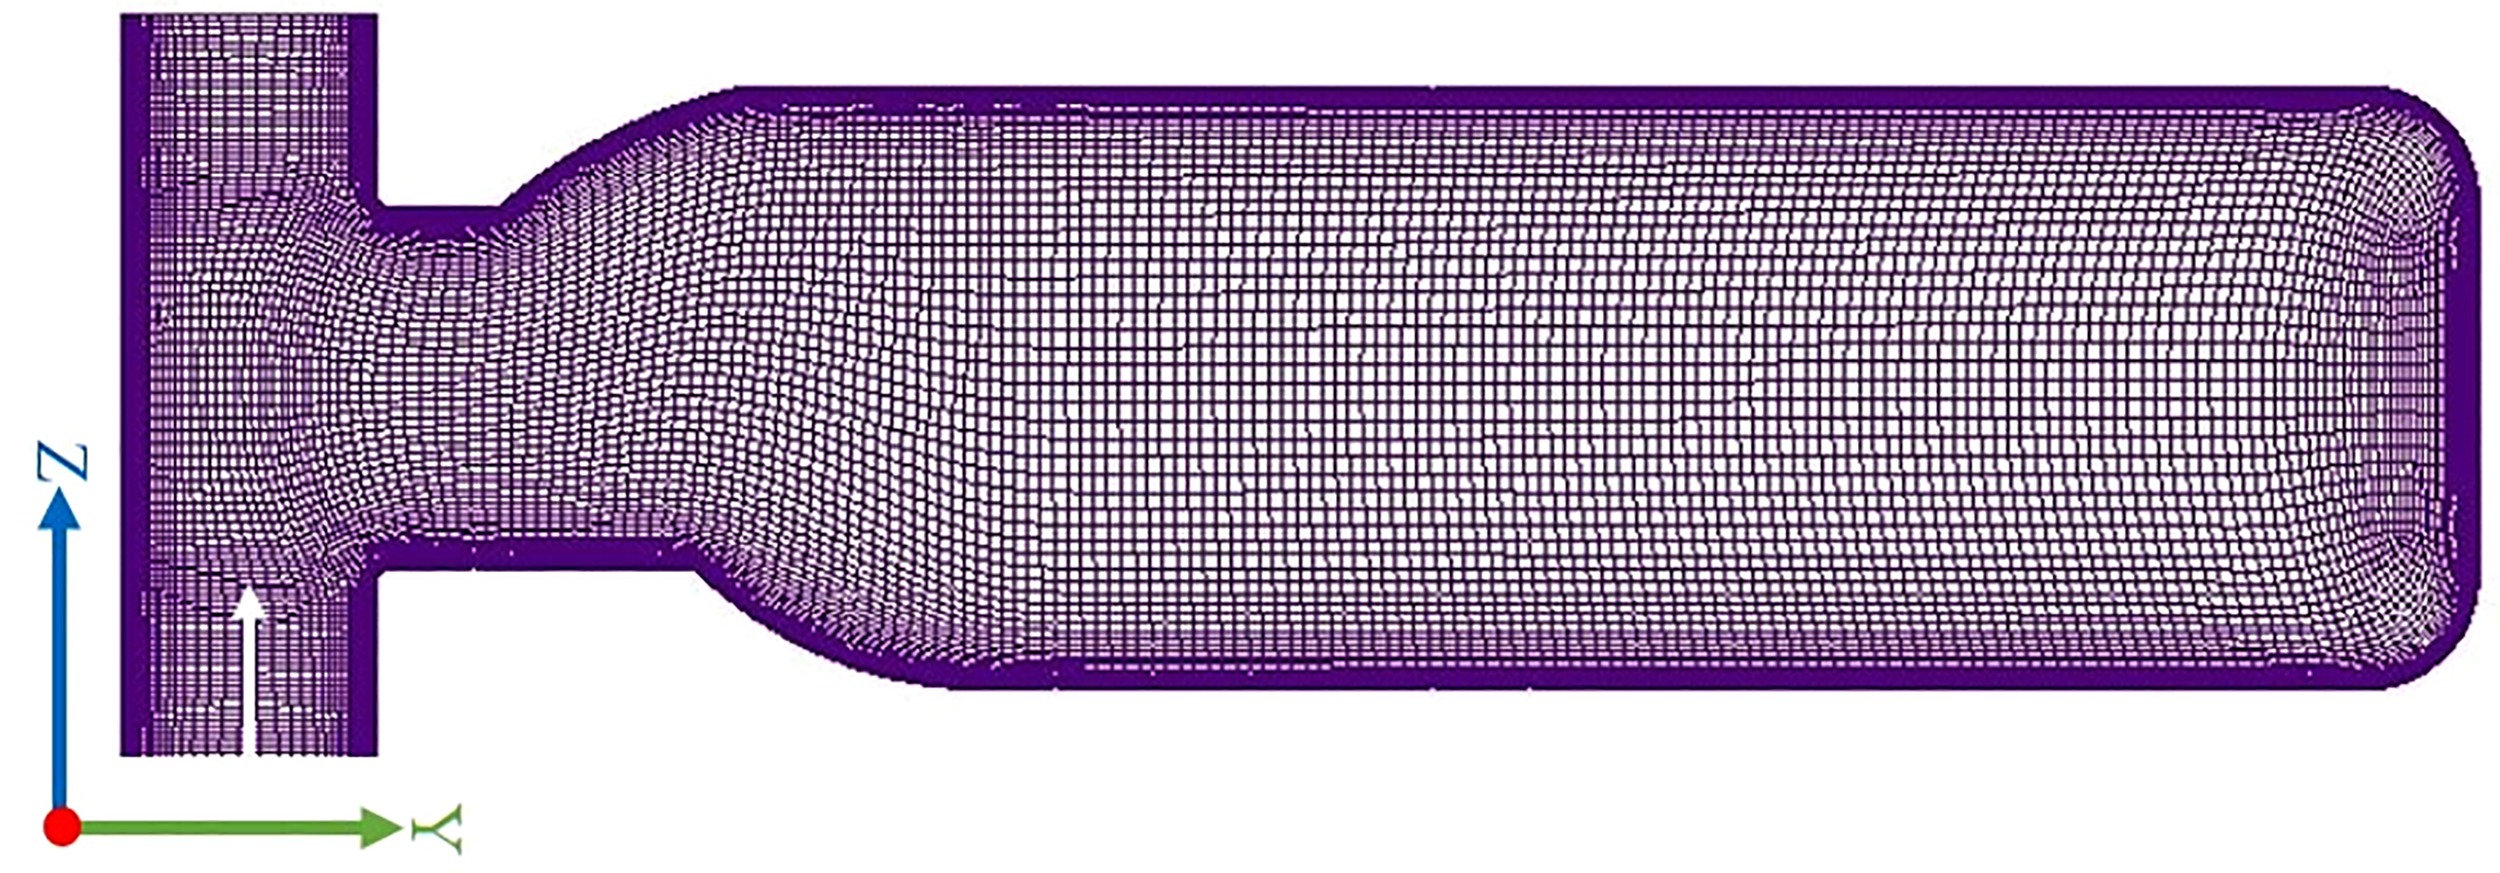
Unsteady Reynolds Averaged Navier-Stokes (URANS) simulation of the flow filed in the rotating cavities is carried out using Ansys Fluent 19.1 in order to help the understanding of the cavity flow structure. The entire upstream flow domain with the first two successive cavities were simulated. ICEM-CFD 17.1 was used to generate a high resolution 2D multi-block mesh. A complete 3D domain for each cavity was made by revolving the 2D grid over 360 degrees in the circumferential direction around the rig axis. Each cavity domain includes around 9 million nodes. In order to have a high resolution within the boundary layers the method employed by Dweik et al. (2009b) is used to create 25 points in the first 2 mm normal to the wall with the first point located 0.005 mm away from the walls. A logarithmic bunching algorithm with a growth ratio of 1.1 is then used to reach a high resolution boundary layer resulting in a y+ < 1 on the cavity walls and shroud region. The meridional view of the computational domain within a cavity is shown in Figure 6. The turbulence model used was the
Results and discussion
As mentioned previously, this paper focuses on data acquired at a constant rotational Reynolds number
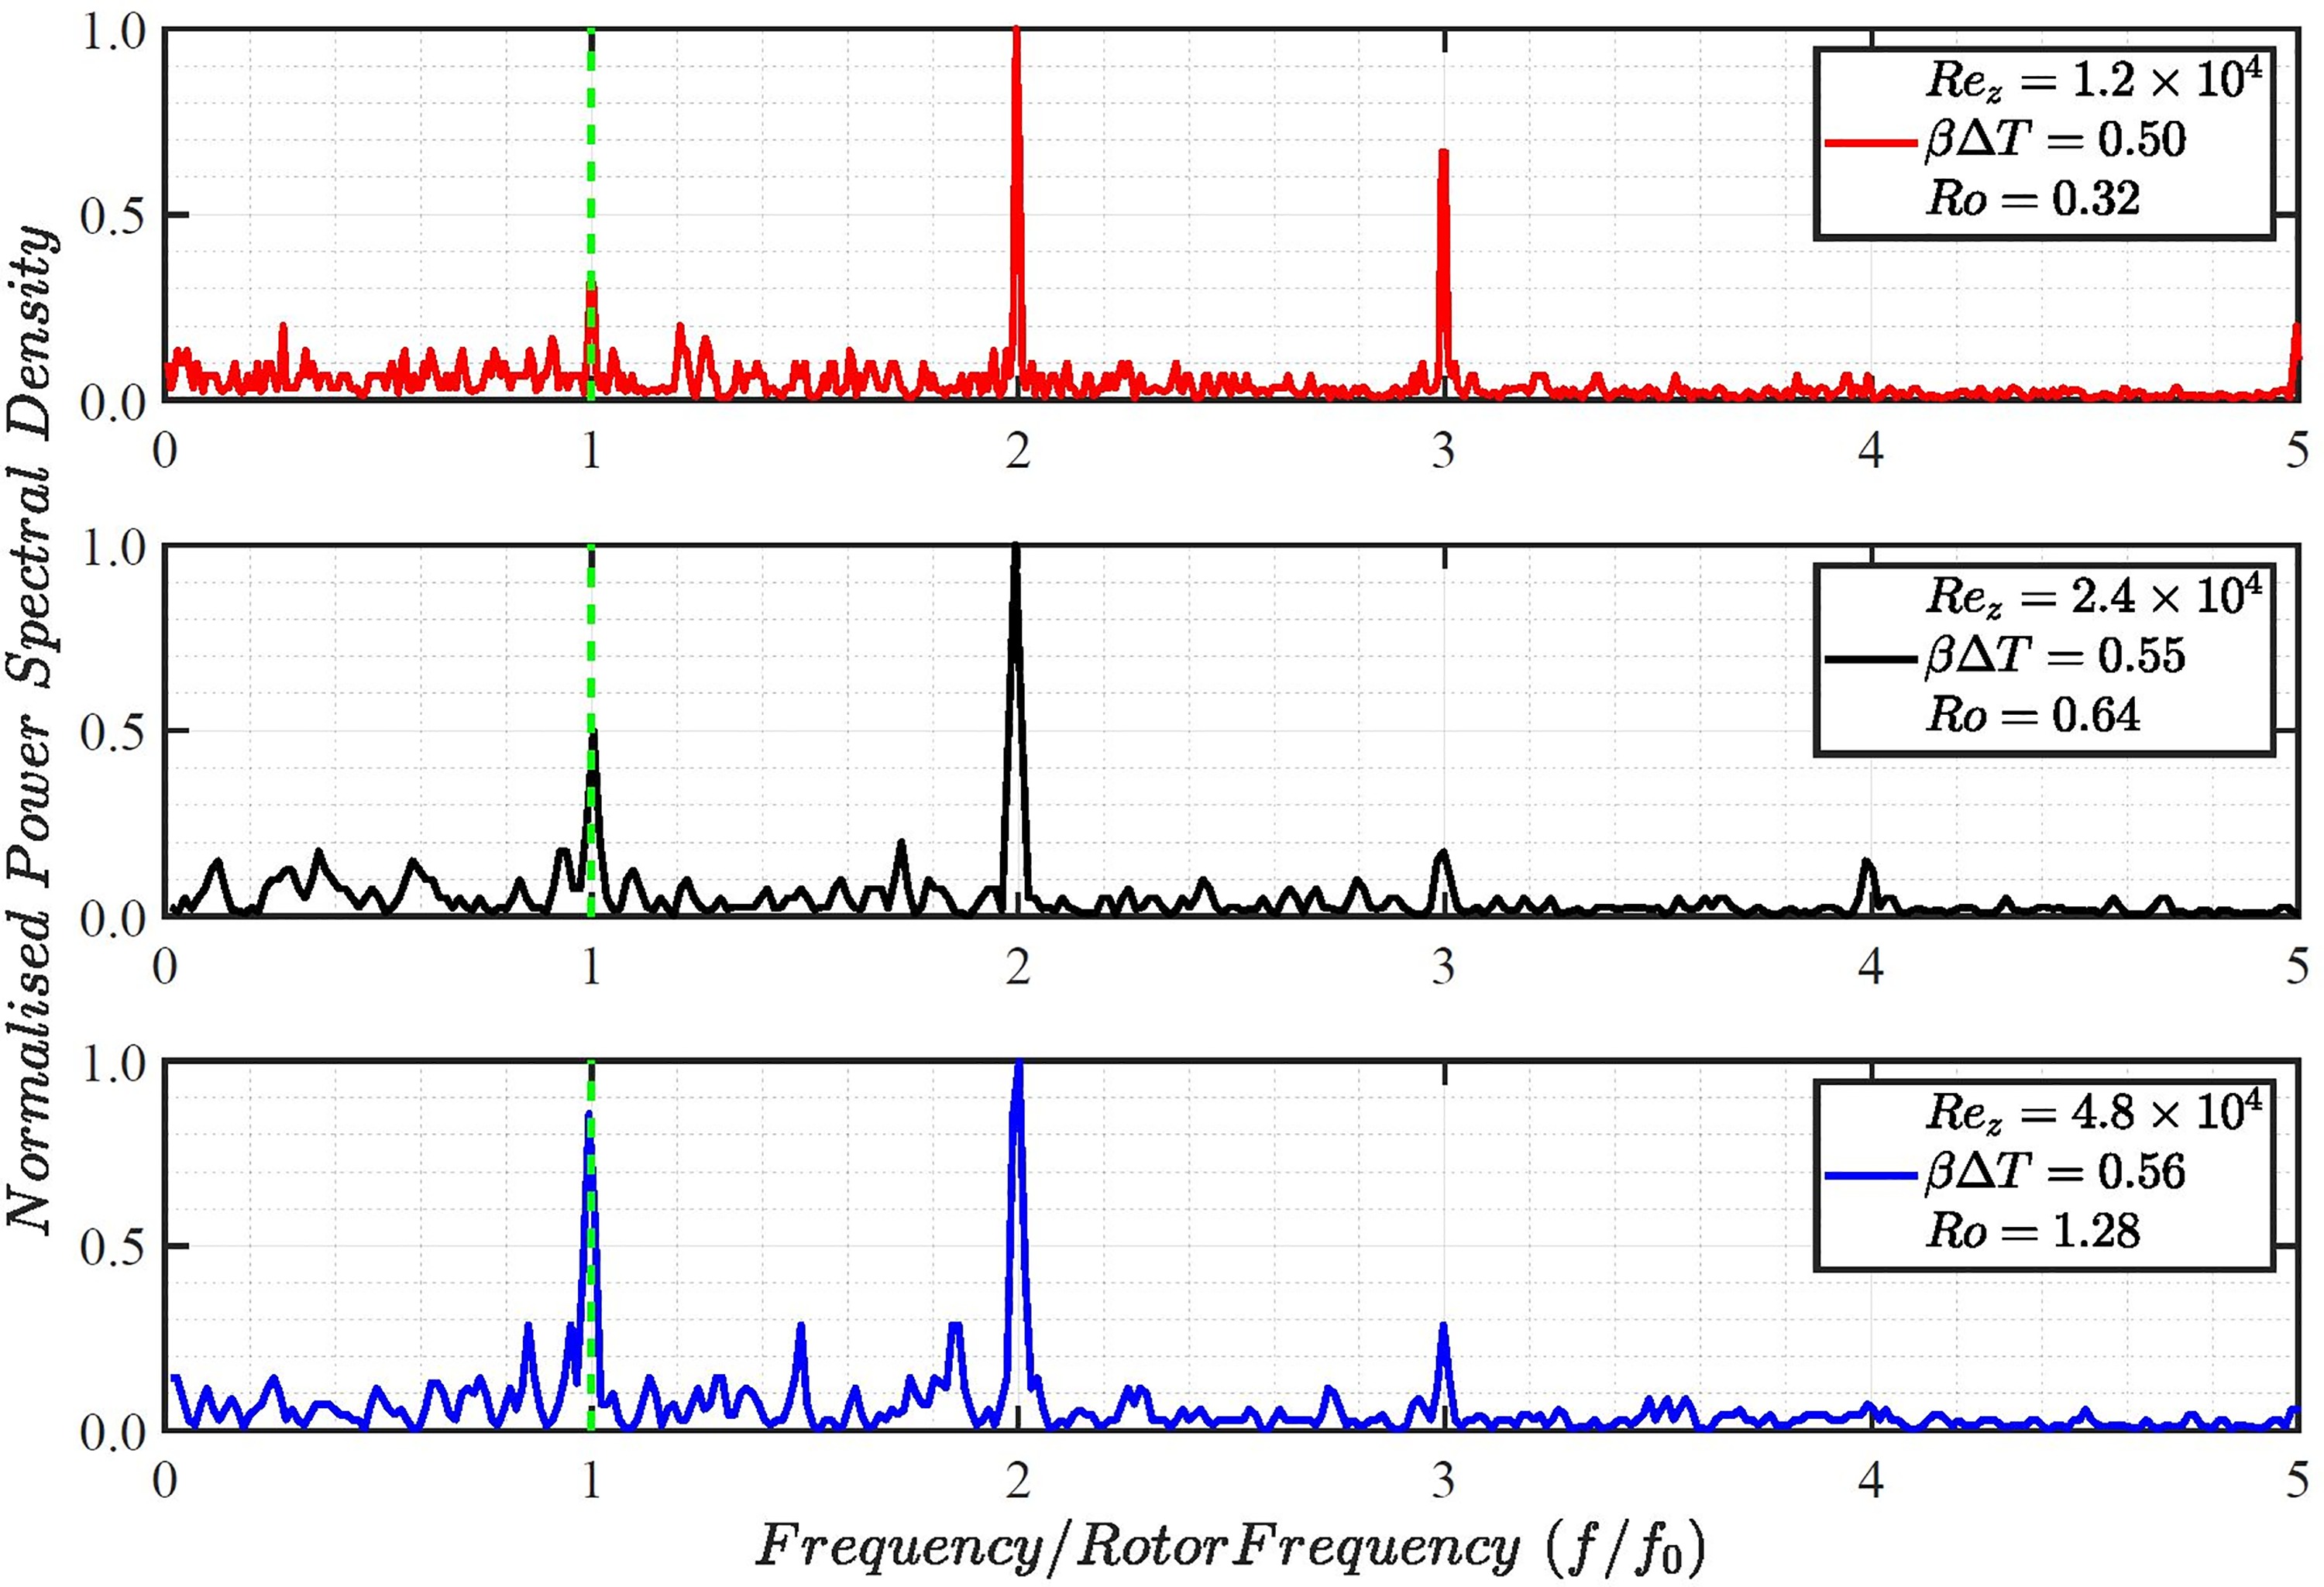
Spectral analysis of the LDA tangential component of velocity
It was noted previously that Farthing et al. (1992a) provided evidence of the existence of a pair of vortices in a heated rotating cavity with axial throughflow by flow visualisation. Long et al. (2007) used frequency spectra analysis of the tangential velocity component obtained from LDA to detect the existence of vortex pairs in their study. In this paper, a similar power spectral density method is used for the identification of vortex pairs that may be present in the cavity flow field. The power spectral density is achieved by calculating the raw tangential velocity data by using a Fast Fourier Transform (FFT) technique. The averaged value of over 4,000 raw velocity samples that are equally spaced in time provide a measured value. To achieve this, sample/hold and resampling of the instantaneous data is carried out before the actual FFT analysis. The frequency spectra are presented for the conditions represented by cases 1 to 3 as mentioned above. The analysis were carried out in the mid plane (z/s = 0.5) of cavity 3 at two radial locations of r/b = 0.86 and 0.91.
Figures 7 and 8 shows the normalised power spectral density of the tangential velocity component in the mid plane of cavity 3 at the radial locations of r/b = 0.91 and 0.86 respectively. For each case, the LDA data at the two radial locations were measured with a fixed time interval between them such that the signal at the higher radius is acquired first followed by that at the lower radius (15 s later). The symbol
Figure 7.
Measured frequency spectrum obtained from tangential velocity in the mid plane of cavity 3 at a radial location of r/b = 0.91 (Ω = 33.25 Hz).
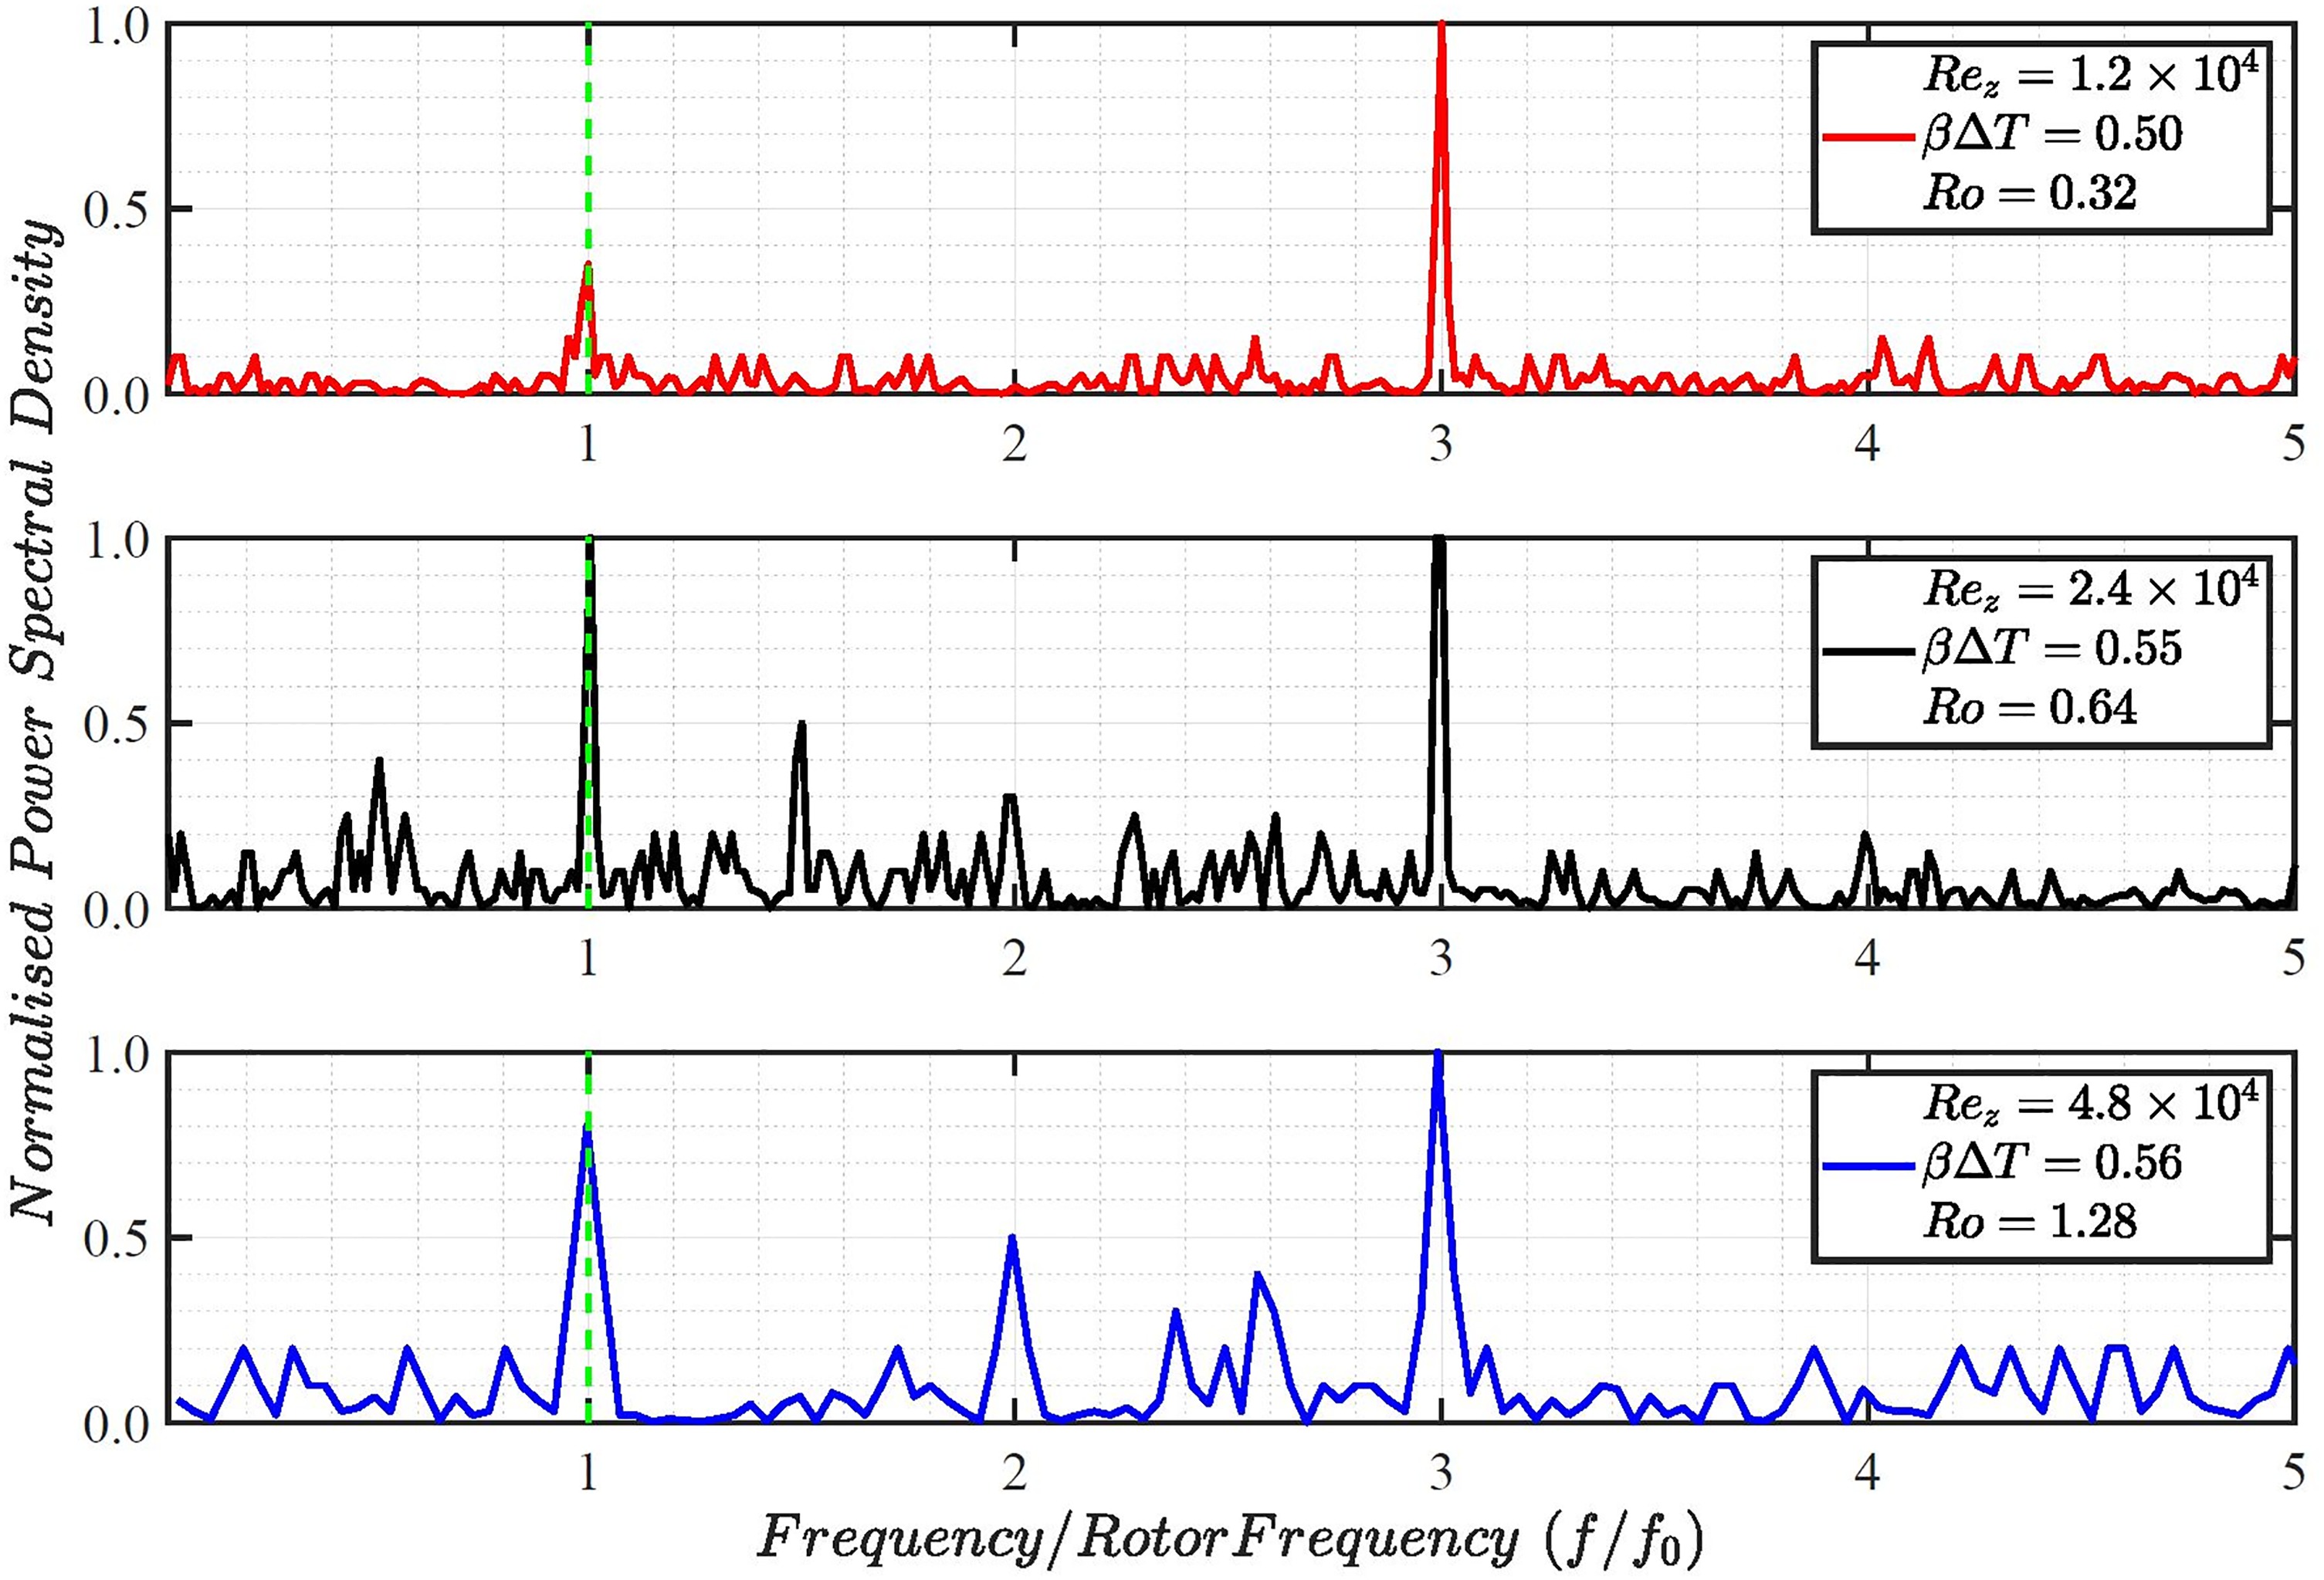
Figure 8.
Measured normalised power spectral density of the tangential velocity in the mid plane of cavity 3 at a radial location of r/b = 0.86 (Ω = 33.25 Hz).
The physical mechanism behind the formation of the power spectral density as shown in Figure 7 can be described as follows. If the measuring point of the tangential velocity is located towards the outer part of the circulation region, the tangential velocity signal records a value higher than that of the solid body rotation
As shown in Figures 7 and 8, the spectral content of the tangential velocity changes with time. Figure 7 shows the recorded data at the beginning of the test at radial location r/b = 0.91 and Figure 8 shows the frequency signal at the radial location r/b = 0.86 measured 15 s later. As an example, the spectral analysis of case 2 at the higher radius shows the existence of at least three pairs of vortices at the beginning of the test. The analysis of the data collected 15 s later at the lower of the two radii (but not far away from each other) suggests that the number of vortex pairs is reduced to two. This proves the transient and evolutionary nature of the vortical structures within the cavity. Although not clearly discernible from the above figures, due to the chosen x-axis scale, there is a 1–2% slip associated with the core flow in relation to the solid body rotation.
Figure 9 shows the reduced static pressure contours obtained from the transient numerical study. Two different time instances, the first one after two disc revolutions and the second one after 30 disc revolutions are shown. The lows and highs of the reduced static pressure can be used to identify the regions of cyclonic and anticyclonic circulations respectively. The regions with anticyclonic circulations are annotated as A1, A2 and A3 whereas cyclonic circulation regions are denoted by C1, C2 and C3. The black solid circles represent the radial locations where the spectral analysis was conducted experimentally. The white dashed circles illustrate the bore region below the disc cob. As seen in the experimental data presented in Figures 7 and 8, the number of vortex pairs present in the numerical solutions reduce from 3, at the end of 2 revolutions to 2 after 30 revolutions.
Figure 9.
Computed time evolution of incompressible reduced static pressure (Pa) field with superimposed relative velocity (ms−1) vectors (case 2):Ro = 0.64 Re z = 2.4 × 10 4 Re θ = 7.1 × 10 5 β Δ T = 0.55

It is worth nothing that the labelling of the cyclonic and anticyclonic zones is only for illustration of the flow structures inside the cavity. It is not; however, clear if their numbering sequence is correct in that A1 may not necessarily be paired with C1 etc. The changes in the pairs of vortices present with time will be discussed later in this paper in the numerical results part.
Transient β Δ T
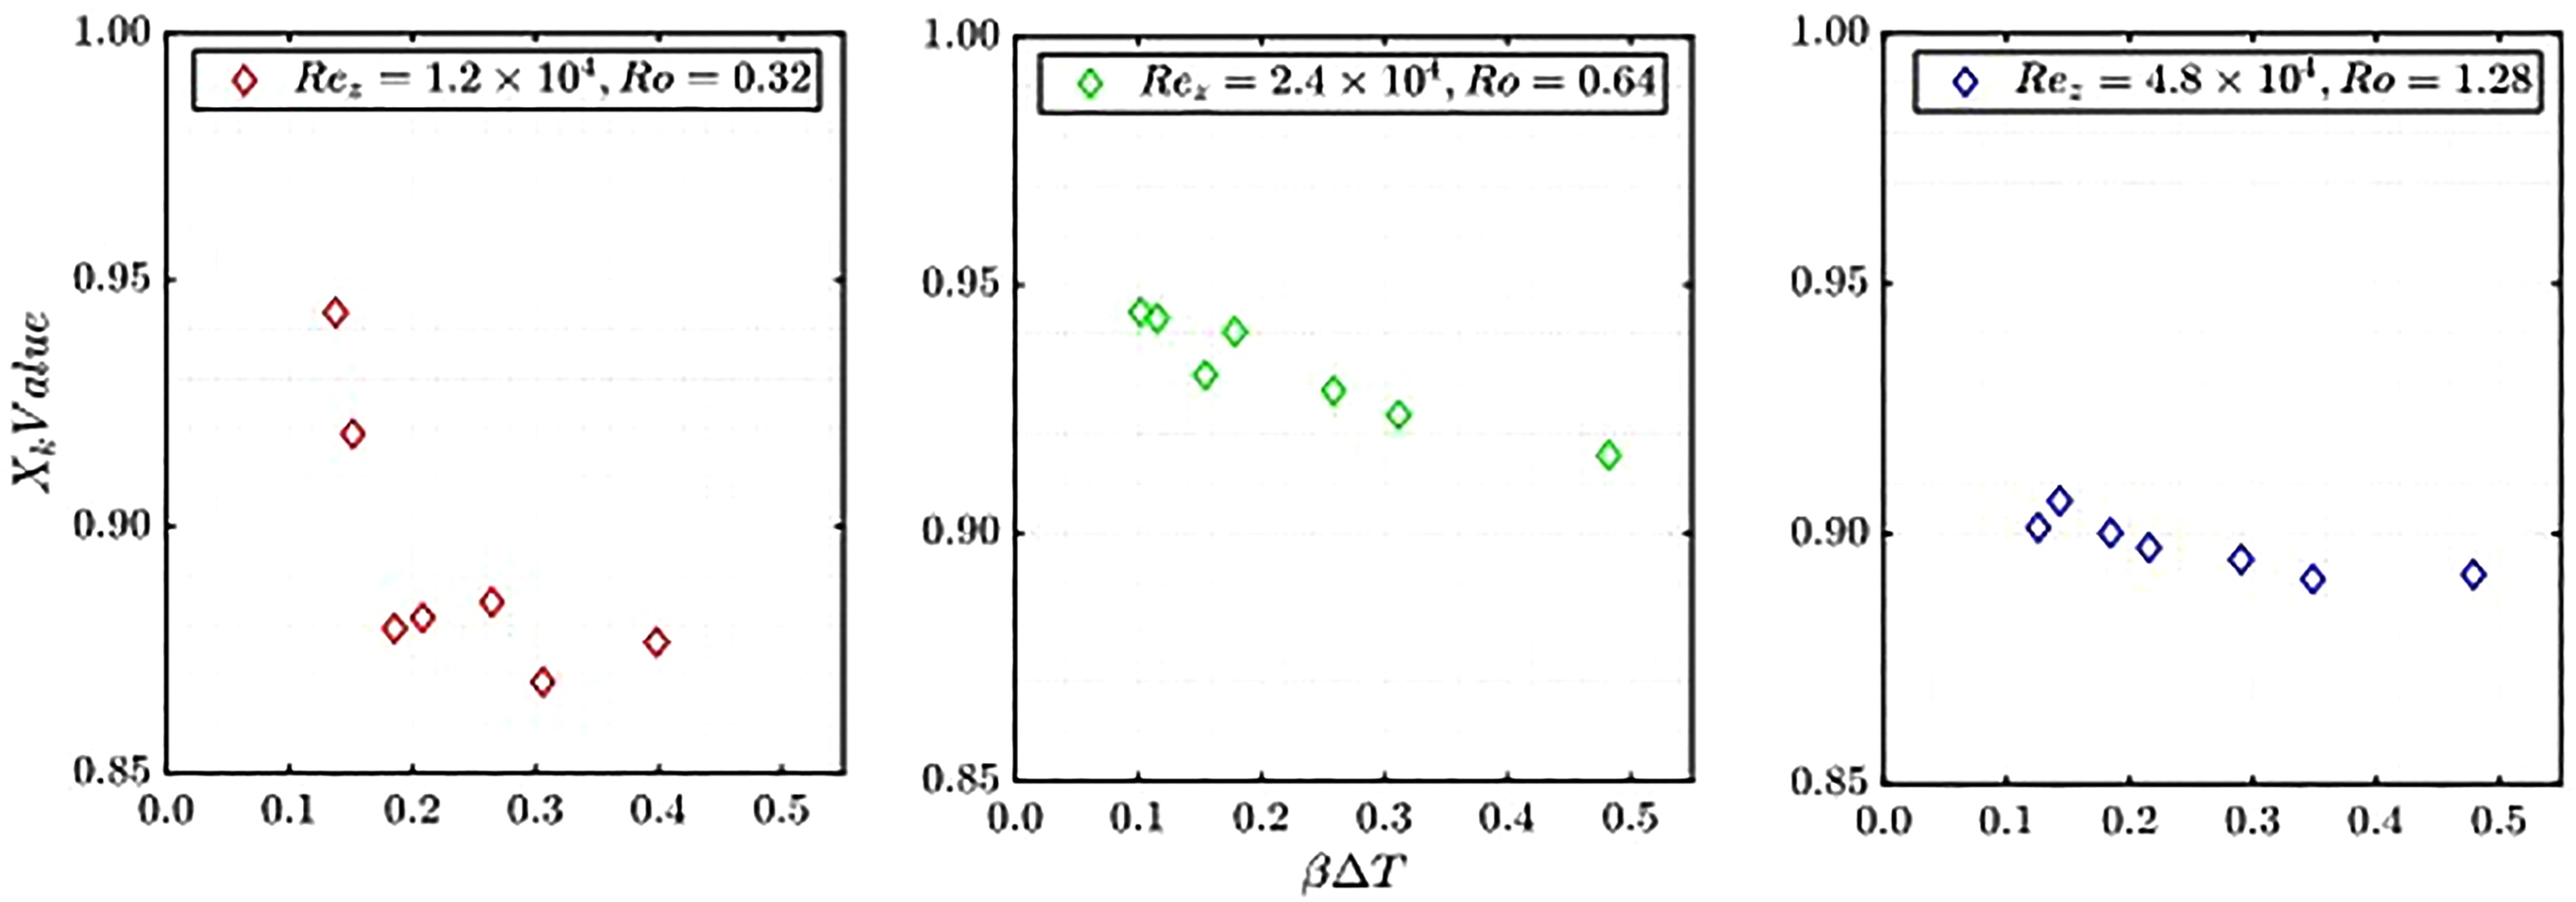
The flow visualisation and LDA measurements for rotating cavities with an axial throughflow with either the discs or the shroud heated showed that a secondary toroidal flow inside the cavity is generated by the axial jet of fluid. The strength of such a flow grows as the gap ratio (G) and the Rossby number (Ro) increase. For instance, the impact of the axial throughflow diminishes at the higher radial locations inside the cavity and consequently the buoyancy effects dominate when solid body rotation is present. At the lower radii, the effect of axial throughflow has been observed where the free vortex flow occurs and the strength of recirculation increases. Therefore, the heat transfer inside these cavities includes forced convection (generated by the axial flow) at lower radii and free convection (generated by the buoyancy dominated flow) at higher radii. Here, in this section, the flow structure inside the cavity is investigated differently by observing the sensitivity of rotational effects due to the variation in buoyancy parameter
The LDA measurements are conducted for these transient

Numerical results
The numerical analysis is performed for the condition specified by case-2 of the experimentation. This corresponds to;
The reduced static pressure,
This parameter can be assumed as equivalent to static pressure corrected for centrifugal pressure rise at each radial location. Owen et al. (1985) showed that the cyclonic and anticyclonic circulations are the regions where
Figure 12 shows the computed reduced static pressure in the radial-circumferential
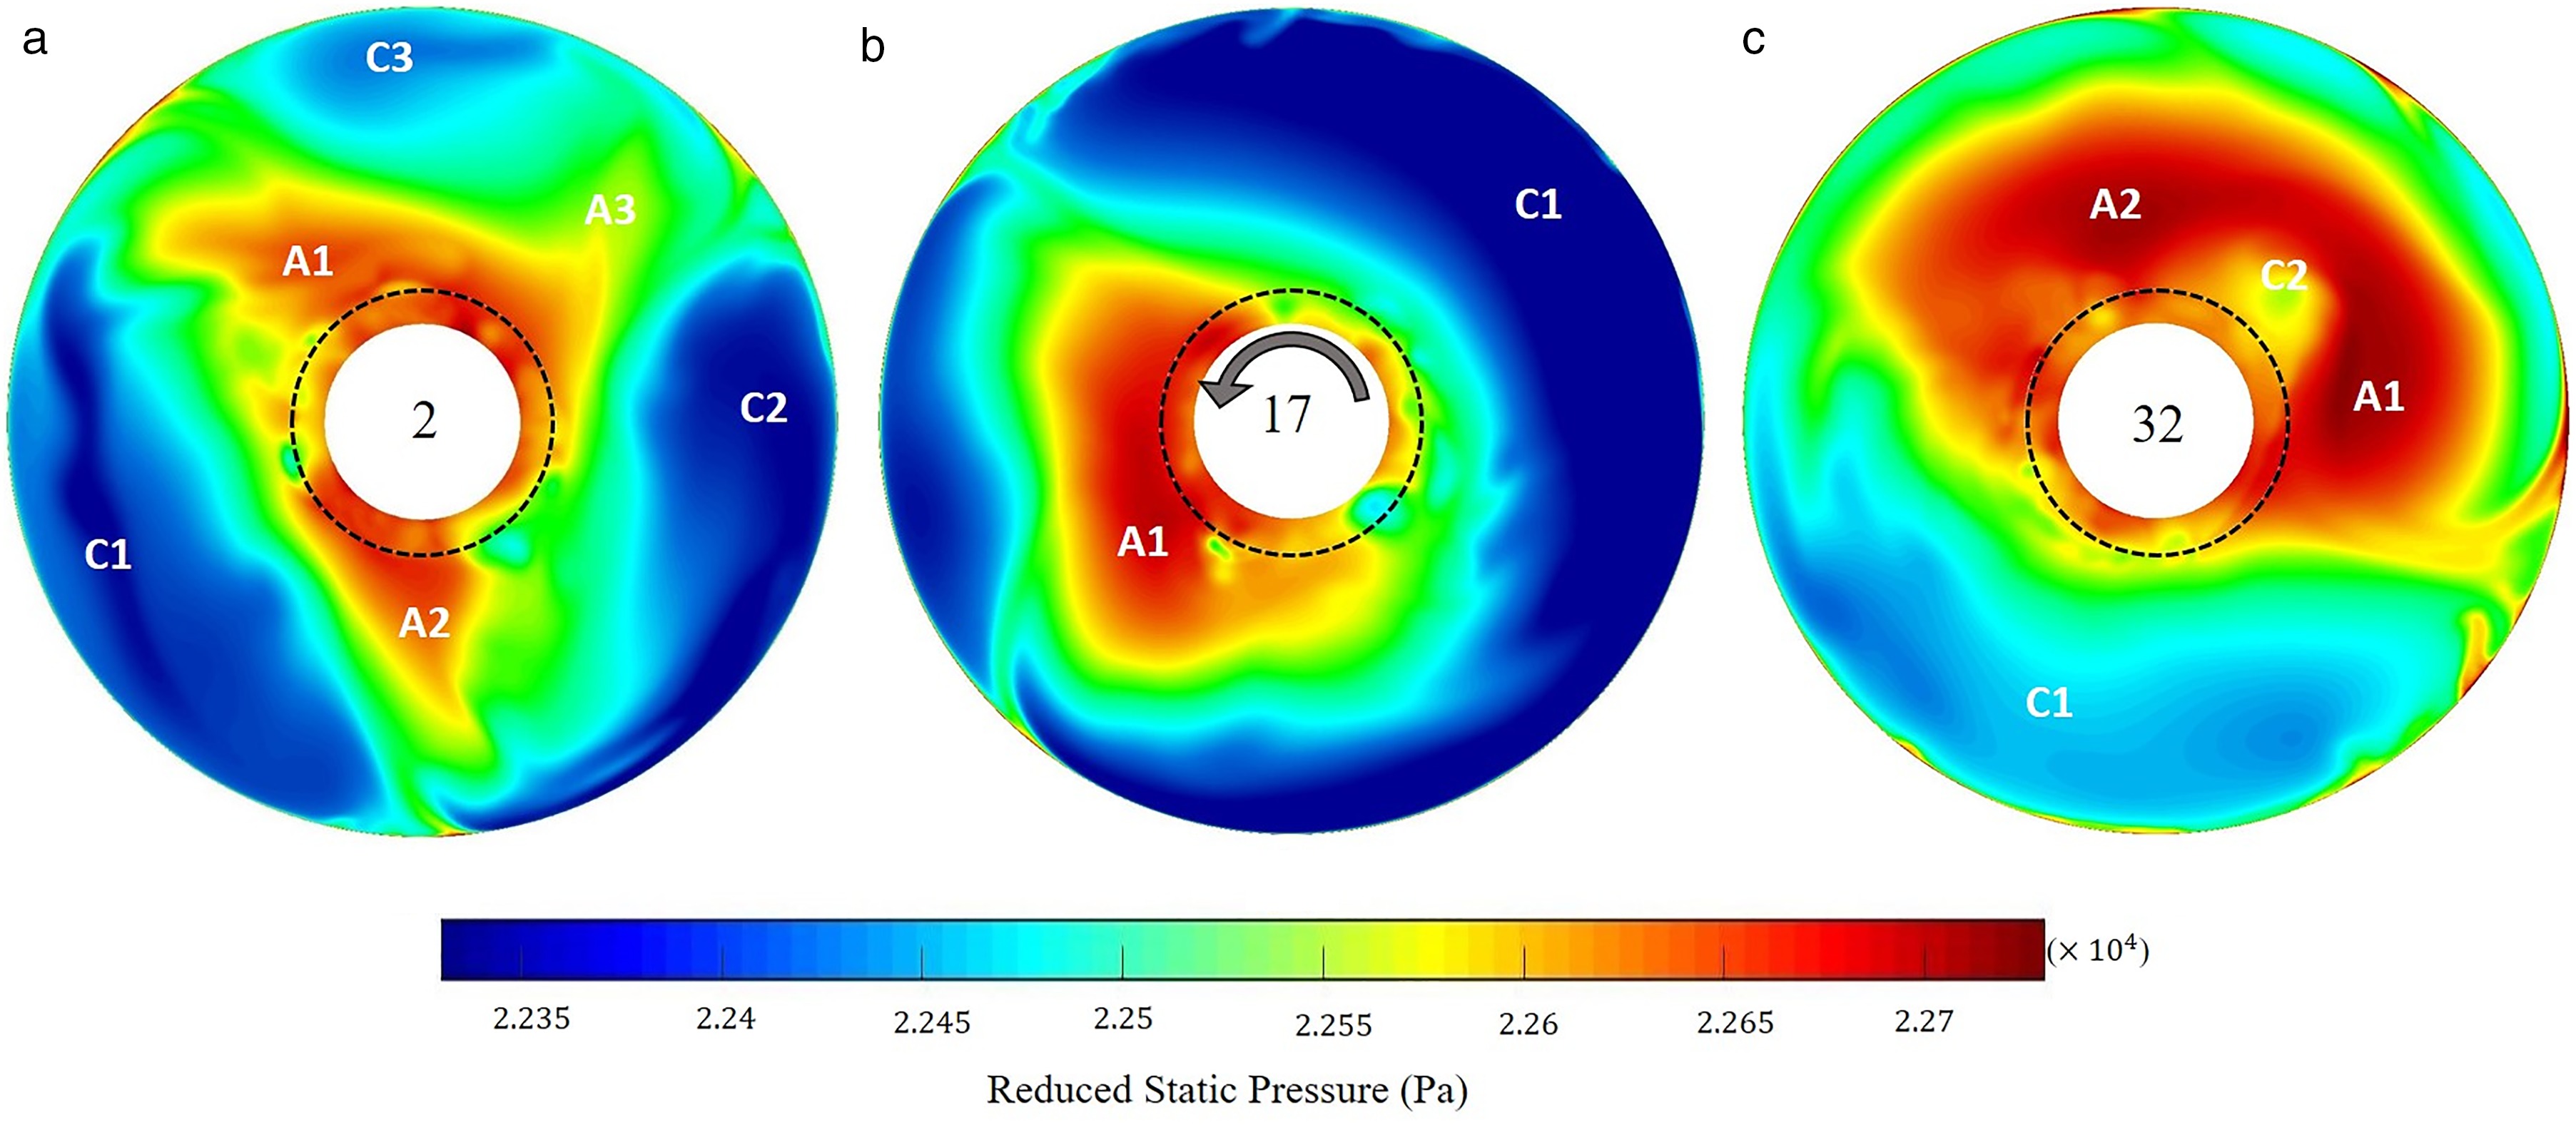
Owen (2010) suggested the following relationship between the cavity radius ratio, a/b, and the number of pairs of vortices, N, where
The number of pairs of vortices (N) calculated in this manner for the present cavity test case where the radius ratio of the annulus a/b ≈ 0.32 is 3. As shown above, although there is a good agreement between this relationship and the numerical study, the suggested number could change further with time. This is also seen in the experimental data where the spectral analysis showed three pairs of vortices initially which then changed to two pairs of vortices. The results also show that the value of N is not only a function of a/b but there are other parameters such as the axial and rotational Reynolds numbers that should be considered. The unsteady and unstable nature of the flow structure within the cavity was also observed and stated by various researchers including (Tian et al., 2004; King et al., 2005; Atkins & Kanjirakkad, 2014).
The normalised density change
Figure 13.
Computed contour plots of instantaneous density change and cavity delta T (K) within cavity 3 mid plane (z/s = 0.5).

where
The experimental and numerical investigation into the unstable flow structure within a heated rotating cavity by Bohn et al. (2006) reported a repeatable flow pattern fluctuating between one, two, and three pairs of vortices in a periodic manner. The current results have shown this unstable nature, however, the periodicity of the changes could not yet be established from the 35 revolutions that were numerically simulated.
Time averaged data
The time averaged results from the numerical simulation, of which the instantaneous data was shown in the previous sections, is presented here. The data is averaged both temporally and spatially. The mid plane of cavity 3 includes 90 K numerical ‘measurement points’ consisting of 250 radial and 360 (one degree apart) circumferential points. The data averaging was started after the 20th revolution and was continued up to the 45th revolution. The number of time-steps made available to be averaged for each revolution is 360.
Figure 14 shows the data time averaged over 1, 10, 20 and 25 revolutions. The average axial
Figure 14.
Computed axial ( V z ) ( V r ) ( V θ / Ω r )
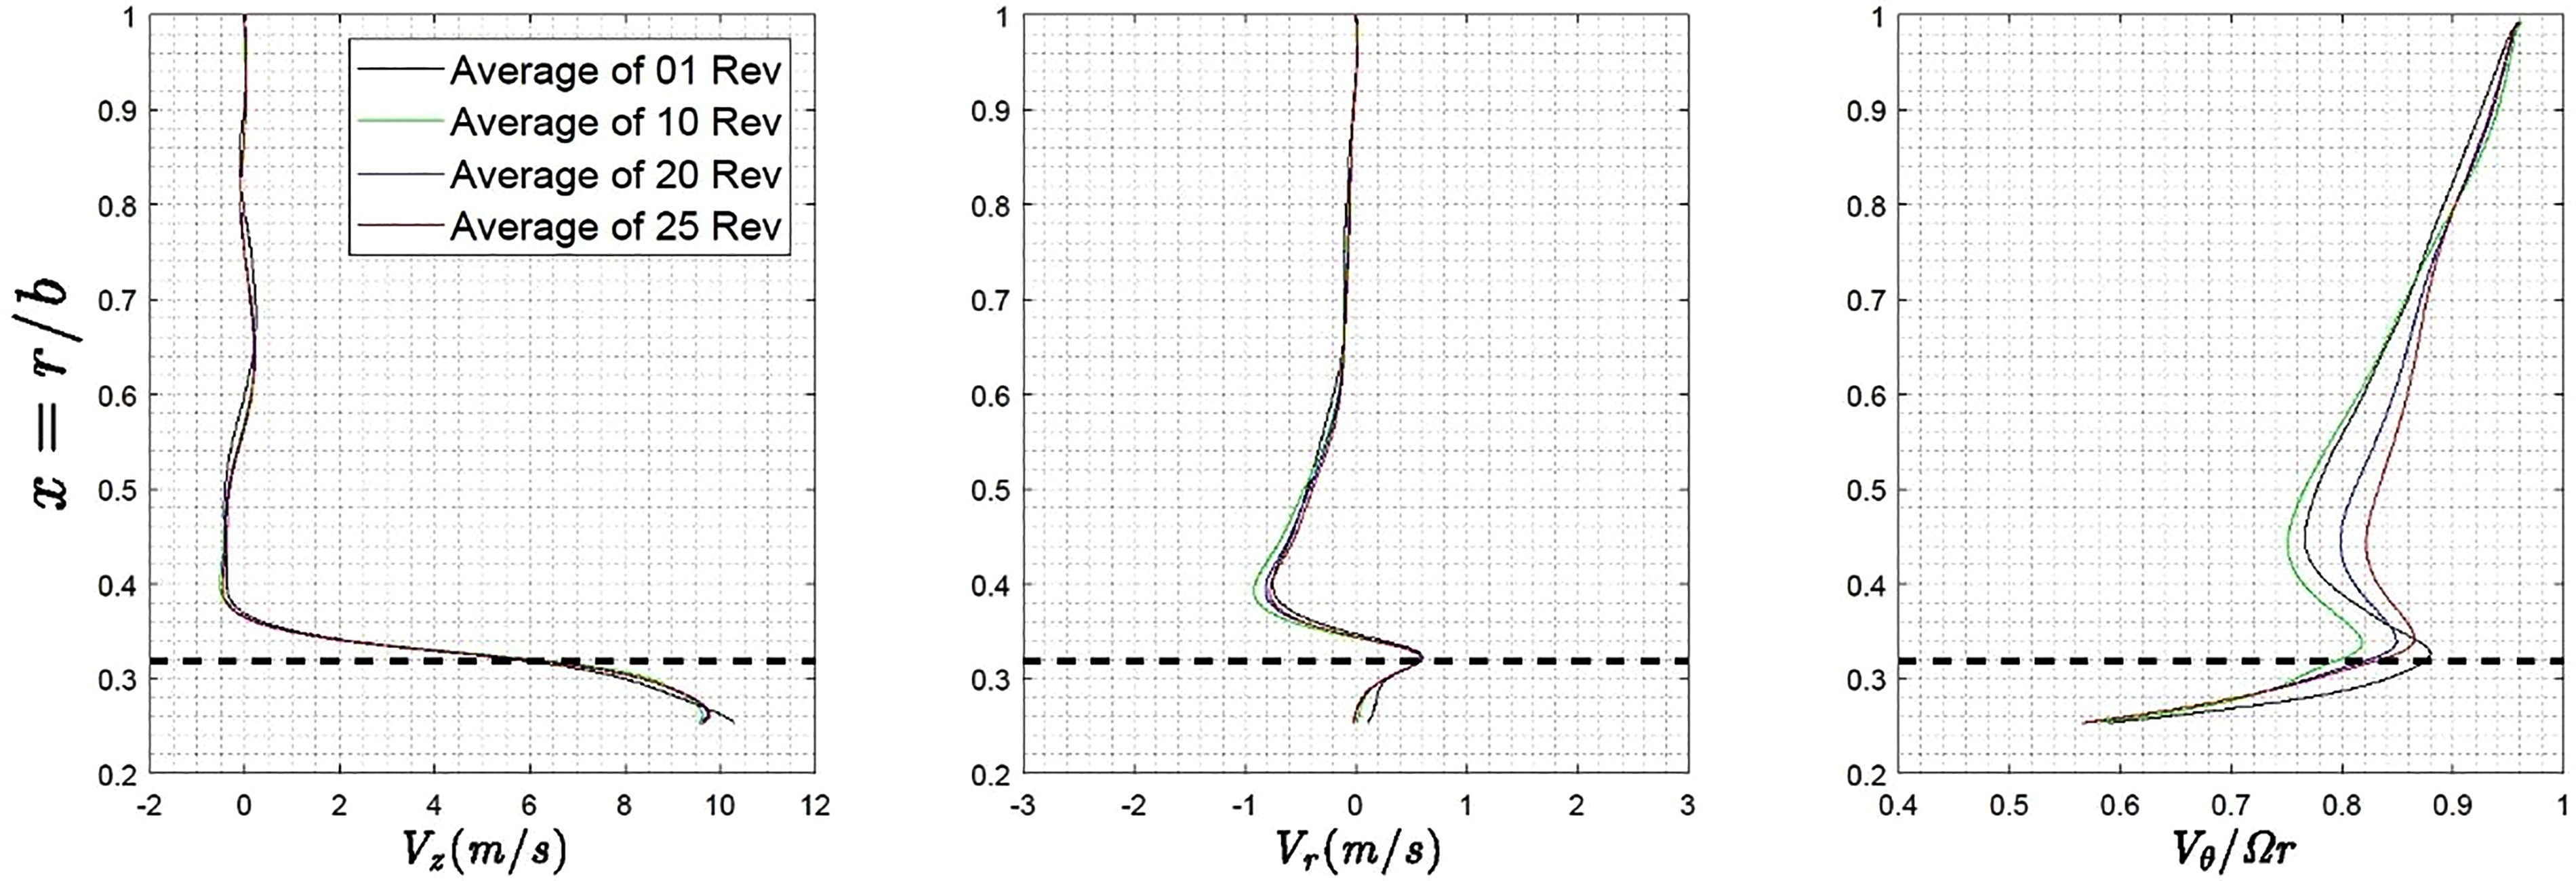
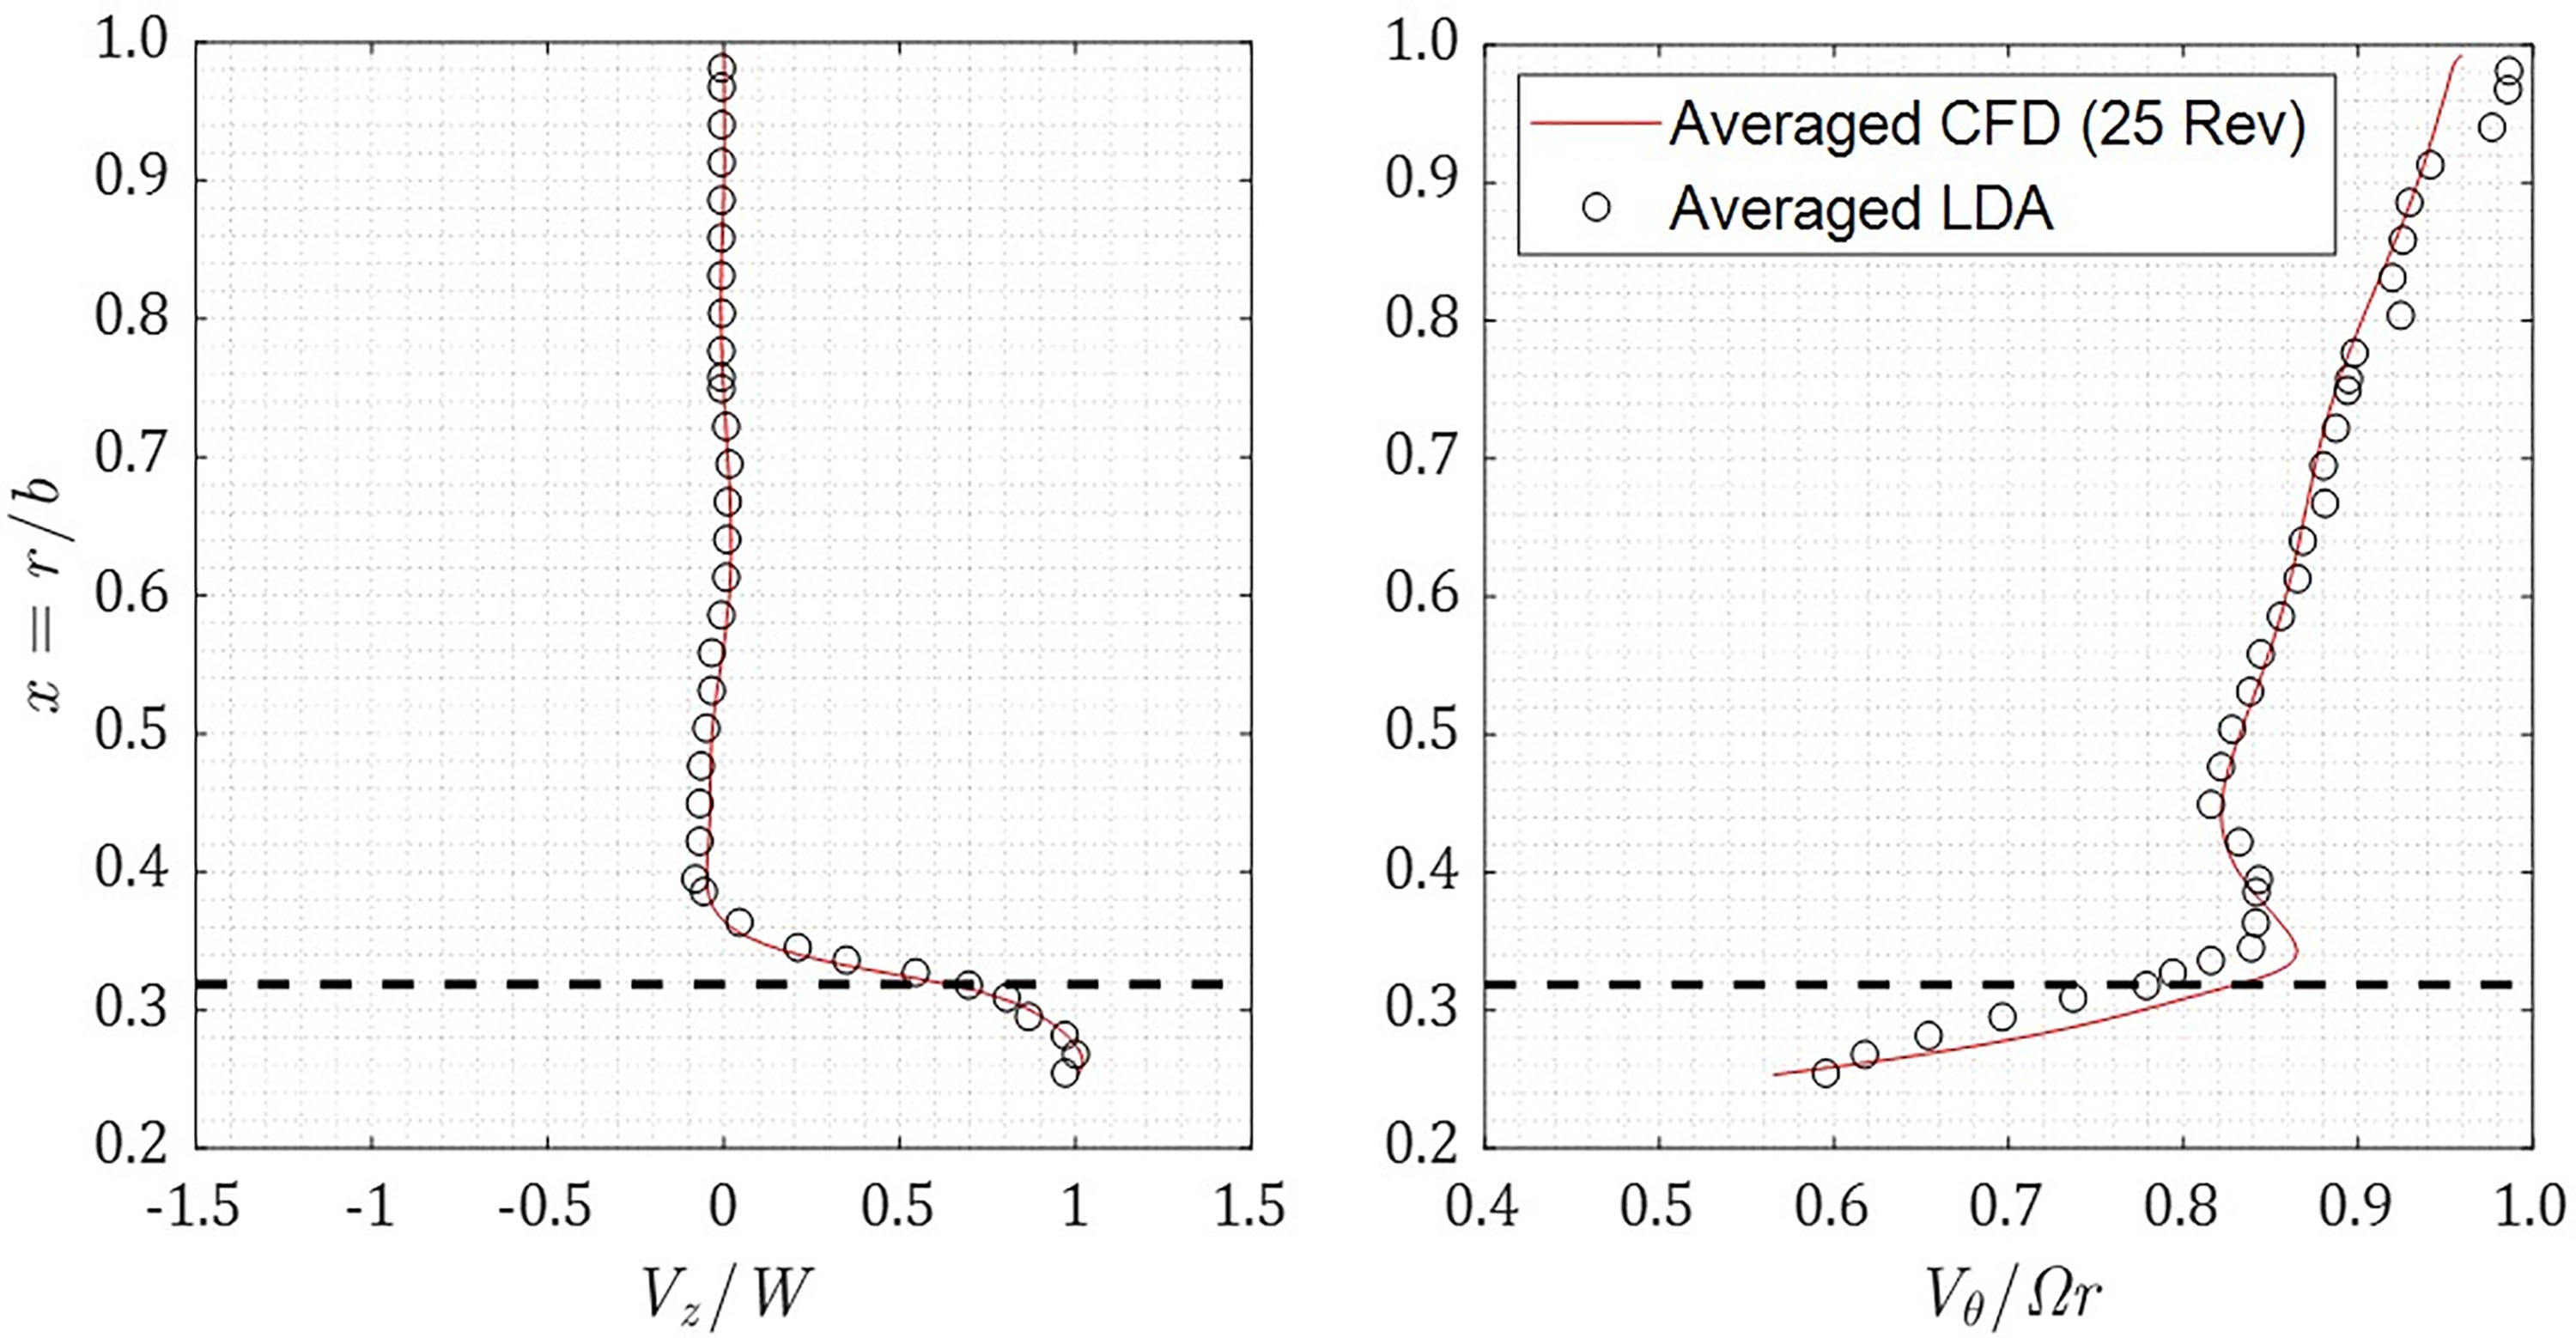
Figure 15 shows the comparison between the LDA experiment and the time averaged numerical data. The LDA data is inherently time averaged and there are 35 radial measuring points from the bore to the shroud. The CFD data shown is the time average over 25 revolutions. The normalised axial velocity
Conclusions
The experimental and numerical results from the Multiple Cavity Rig (MCR) at the University of Sussex are presented. The experimental data consists of LDA measurements of the axial and tangential velocity components within a heated rotating cavity with axial throughflow. The data corresponds to three axial Reynolds numbers at a fixed value of rotational Reynolds number. The spectral analysis of tangential velocity component is performed for these conditions. The numerical data presented is from Unsteady Reynolds averaged Navier-Stokes simulations conducted at one of the experimental conditions that is presented. The major conclusions of this work are summarised below.
The spectral analysis of the circumferential velocity obtained from the LDA indicates the temporal and spatial evolutionary nature of the flow structure within the cavity. For each of the three Rossby number cases presented, frequency peaks were detected at twice and three times that of the solid body rotation suggesting the existence of two and three pairs of cyclonic and anticyclonic circulations respectively. Furthermore, similar measurements obtained after a short (15 s) time gap suggests a change in the number of frequency peaks and hence that of the vortex pairs present.
Measurement of the buoyancy parameter
Instantaneous contours of computed reduced static pressure in the
Time averaged radial distribution of computed axial and radial velocities show the early establishment of bulk motion along these directions as the profiles change very little with time. The time averaged radial distribution of the normalised circumferential velocity (Xk) however changes as the averaging window is changed. These are consistent with the understanding that axial and radial velocities are nearly zero in the core of the cavity whereas the circumferential component has much more freedom to change as the rotating structures evolve. The time averaged radial distribution of axial velocity and swirl over the longest time average period presented (25 revolution) compares very well with the inherently time averaged data from the LDA experiment.
Nomenclature
a
Disc inner radii (m)
b
Disc outer radii (m)
Cp
Specific heat capacity (J kg−1 K−1)
dh
Hydraulic diameter (m)
D
Rotor outer diameter (m)
G
Gap ratio (=s/b)
Gr
Grashof number (=ρ2Ω2bβΔΤL3/μ2)
L
Length scale (m)
Nu
Nusselt number
P
Static pressure (Pa)
P*
Reduced static pressure (=P - 0.5ρ(Ωr)2) (Pa)
q
Heat flux (Wm−2)
Rez
Axial Reynolds number (=ρWdh/μ)
Reθ
Rotational Reynolds number (=ρΩb2/μ)
Ro
Rossby number (=W/Ωa)
s
Disc spacing (m)
T
Static temperature (K)
r
Radius (m)
rs
Shaft radius (m)
Vz
Axial velocity (ms−1)
Vθ
Tangential velocity (ms−1)
W
Bulk-average axial velocity at cavity inlet (ms−1)
Xk
Swirl value (=Vθ/Ωr)
β
Coefficient of volume expansion(=1/T) (K−1)
ΔΤ
Appropriate temperature difference (K)
μ
Viscosity (kg m−1 s−1)
ρ
Density (kg m−3)
Δρ/ρ
Density ratio (=(ρ-ρinlet)/ρinlet)
Ω
Rotational speed (rad s−1)
Ω
Rotational speed (rad s−1)