
Introduction
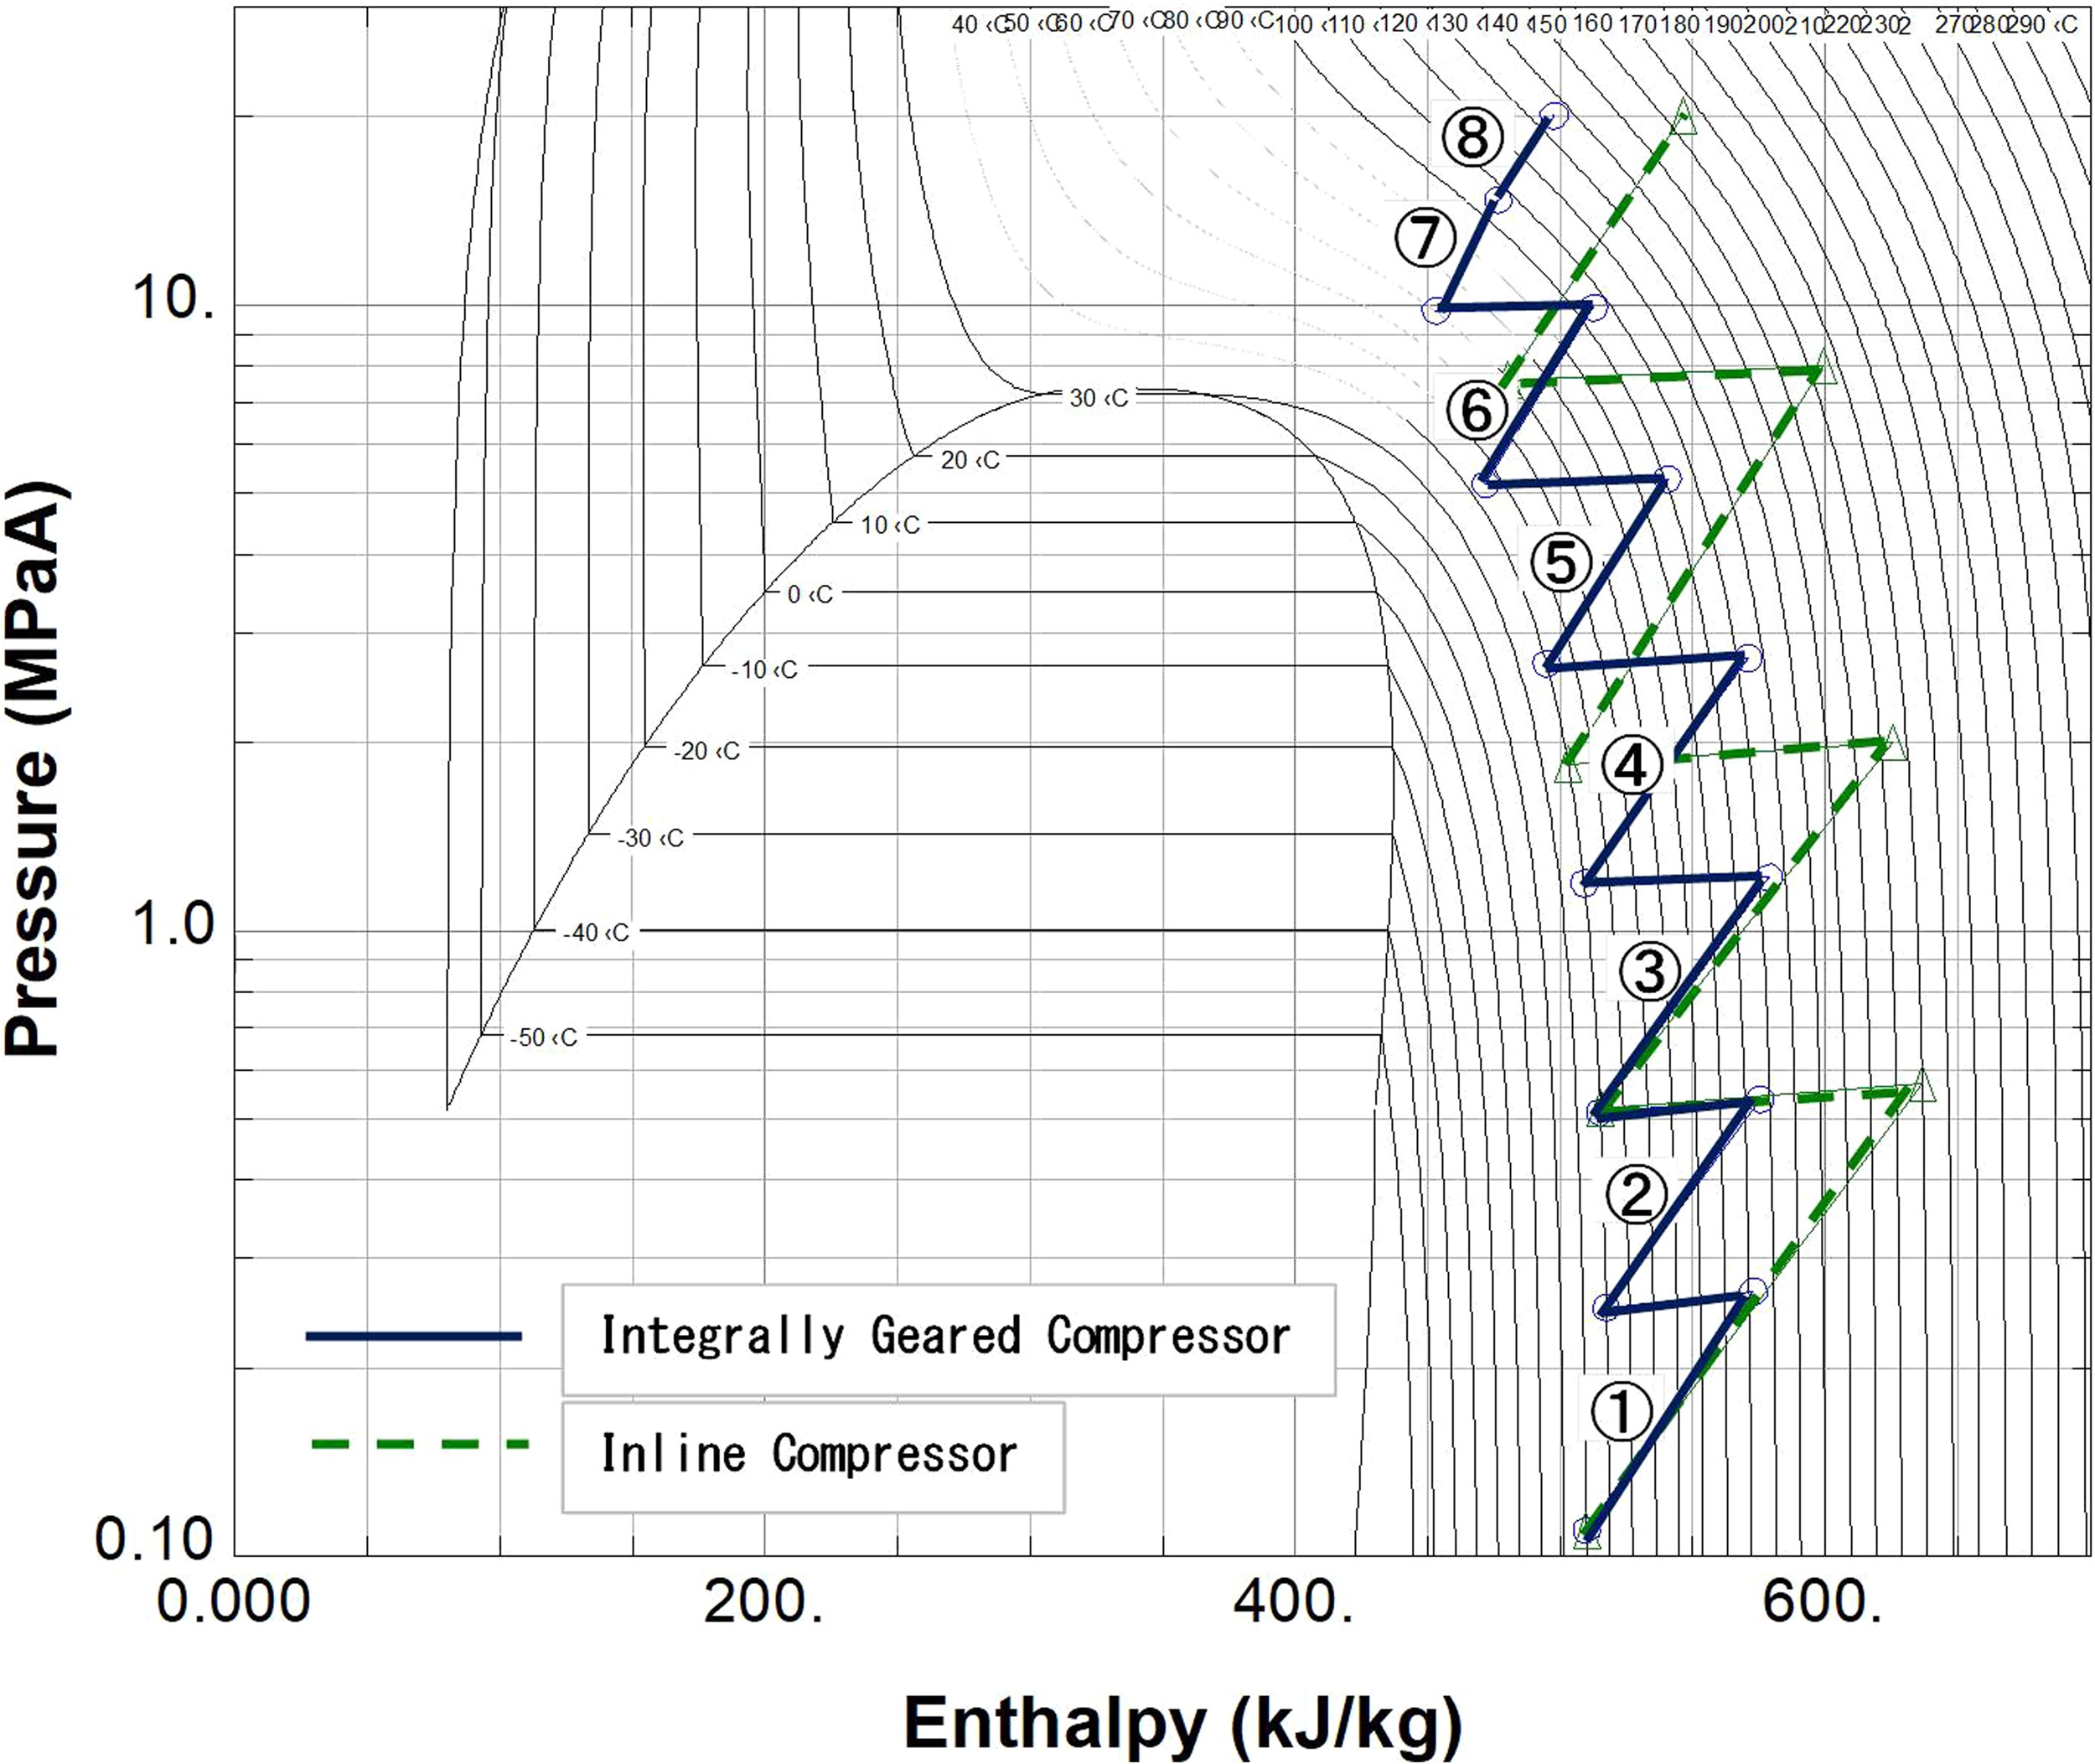
The integrally geared compressors and inline compressors are widely used across the globe. Higher efficiency can be expected in the former since the optimal operating speed is designed for each stage (pinion), which leads to reduced energy consumption. Intercooler implementation is simpler than in the latter and reduces the total energy amount. Figure 1 shows compression diagram of integrally geared compressor and inline compressor. In this case, six intercoolers are equipped for integrally geared compressor, while three coolers for inline compressor. Temperature rise is suppressed in the former thus power consumption becomes smaller than in the latter. There are several key technologies such as (i) Rotordynamic design (ii) High pressure casing design (iii) High pressure gas seal (iv) Aerodynamic component design for high pressure operation including super critical area and (v) Impeller blade strength design, which has to be implemented in order to employ integrally geared compressors for high pressure gas compression usage, such as Carbon Capture and Storage (CCS), Urea plant and S-CO2 Power Cycle (Bennett et al., 2017). The progress of these technologies is nowadays remarkable and enables integrally geared compressors to get into high pressure applications more than 20 MPaG. The authors designed, manufactured and tested the integrally geared compressor at full pressure - full load conditions with CO2 gas using above mentioned technologies. The result verified aerodynamic and mechanical performances as expected. There are some references in which actual compressor operations at high pressure conditions are reported (Olson et al., 2004; Wiebe, 2016), however their running rotor conditions have not been investigated. In addition to the usual measurements, newly developed methods were also applied and the authors succeeded in capturing running rotor conditions, such as natural frequency and log decrement and impeller blade stress during high pressure operation. These are usually not easy to measure but expected to be quantitatively verified for safety operation. The measured log decrement has shown higher value than calculated. The blade stress is under safe limits with enough margins from designed allowable value. All these verified results qualify our integrally geared compressor design and it is suitable for high pressure gas compression applications with reliable confidence.
Results and discussion
Design and manufacturing of prototype compressor
Overview of prototype compressor and test apparatus
Testing an actual size compressor at full pressure and full load condition using real gas is the best way to determine the performance. Miniature models are sometime used but it is not always sufficient to verify the reliability in actual use (Metz et al., 2015). For example, in a miniature model it is not possible to simulate the rotor behavior because all geometrical shapes cannot be proportionally reduced. Therefore, the vibration and damping measurements in an actual machine will always be different from a miniature model. Hence, the authors decided to design, manufacture and test the actual size compressor as a prototype to eliminate any unknown or uncertain factors related to size.
A relatively large CO2 compressor was selected as a prototype, which covers CCS application and large size Urea plant application (Musardo et al., 2012). Basically, eight compression stages are required to develop a discharge pressure of 20 MPaG from atmospheric pressure. Therefore, the authors designed all eight stages at first and validated the design by confirming the dimensions of all parts, interference between the parts, piping accessibility for maintenance and so on. Since, the low pressure stages (1st stage to 3rd stage) has no any special technical factors to be tested or measured during actual operation, only the high pressure stages (4th stage to 8th stage) were manufactured and tested. OEM had a lot of experience for such low pressure compression. The suction pressure of 1.0 MPaG was adopted for the 4th stage instead of atmospheric pressure. This suction pressure corresponds to the same pressure of the 4th stage suction in the 8-stage compressor. The prototype machine consists of a total five stages namely 4th, 5th, 6th, 7th and 8th, which represents more severe conditions than the low pressure part. The specification of the compressor tested is shown in Table 1.
Table 1.
Prototype CO2 compressor specification.
| Type | Integrally Geared | 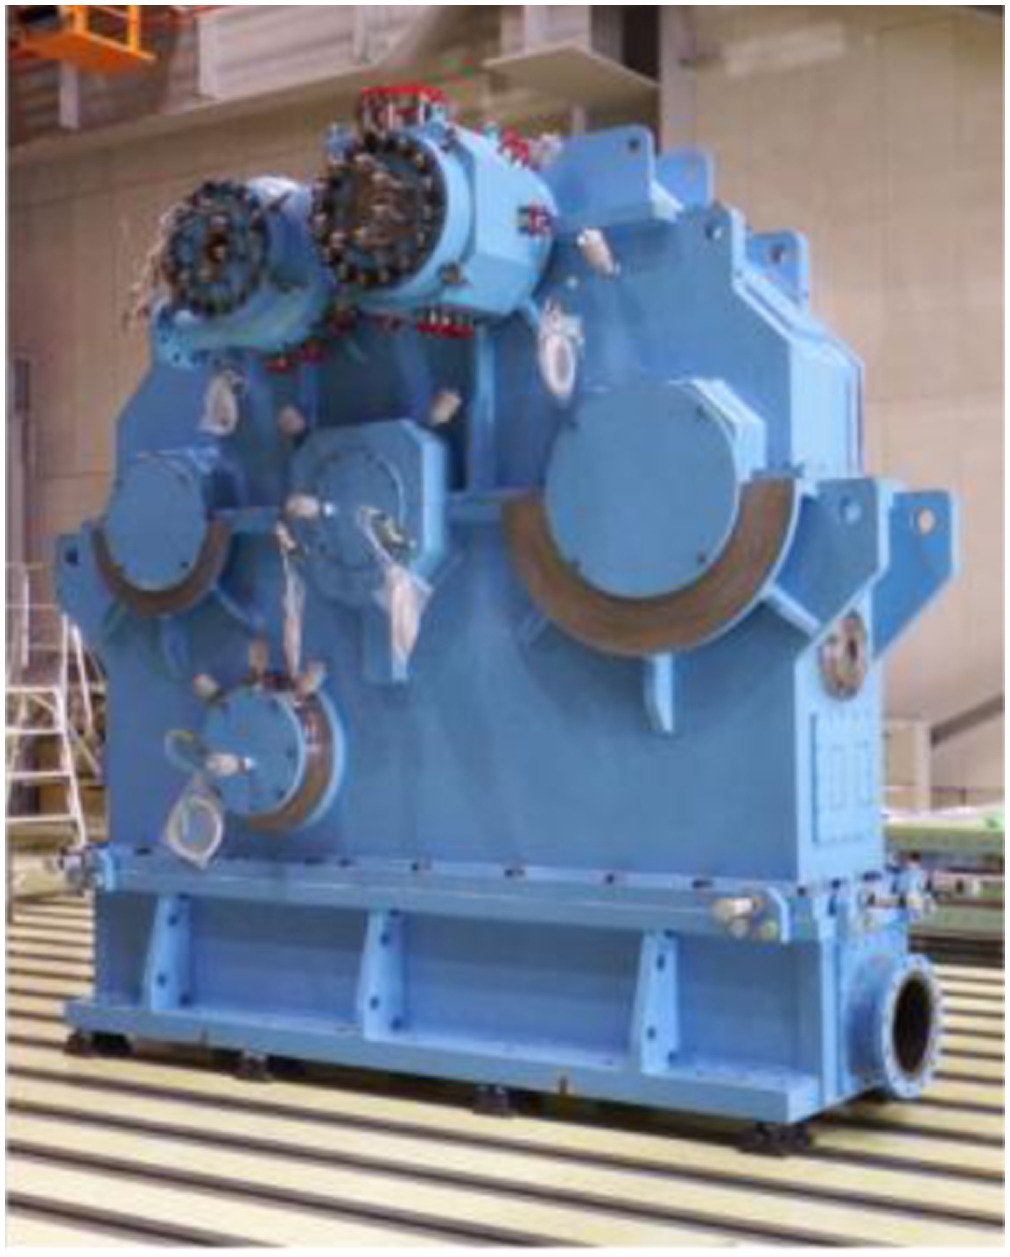 |
| No. of stage | 5 stages High Pressure parts | |
| Gas handled | CO2 | |
| Capacity | 140.000 kg/h (6.700 m3/h) | |
| Suction/Discharge Pressure | 1.0/20 MPaG | |
| Shaft Power | 8,085 kW | |
| Driver | Shop motor |
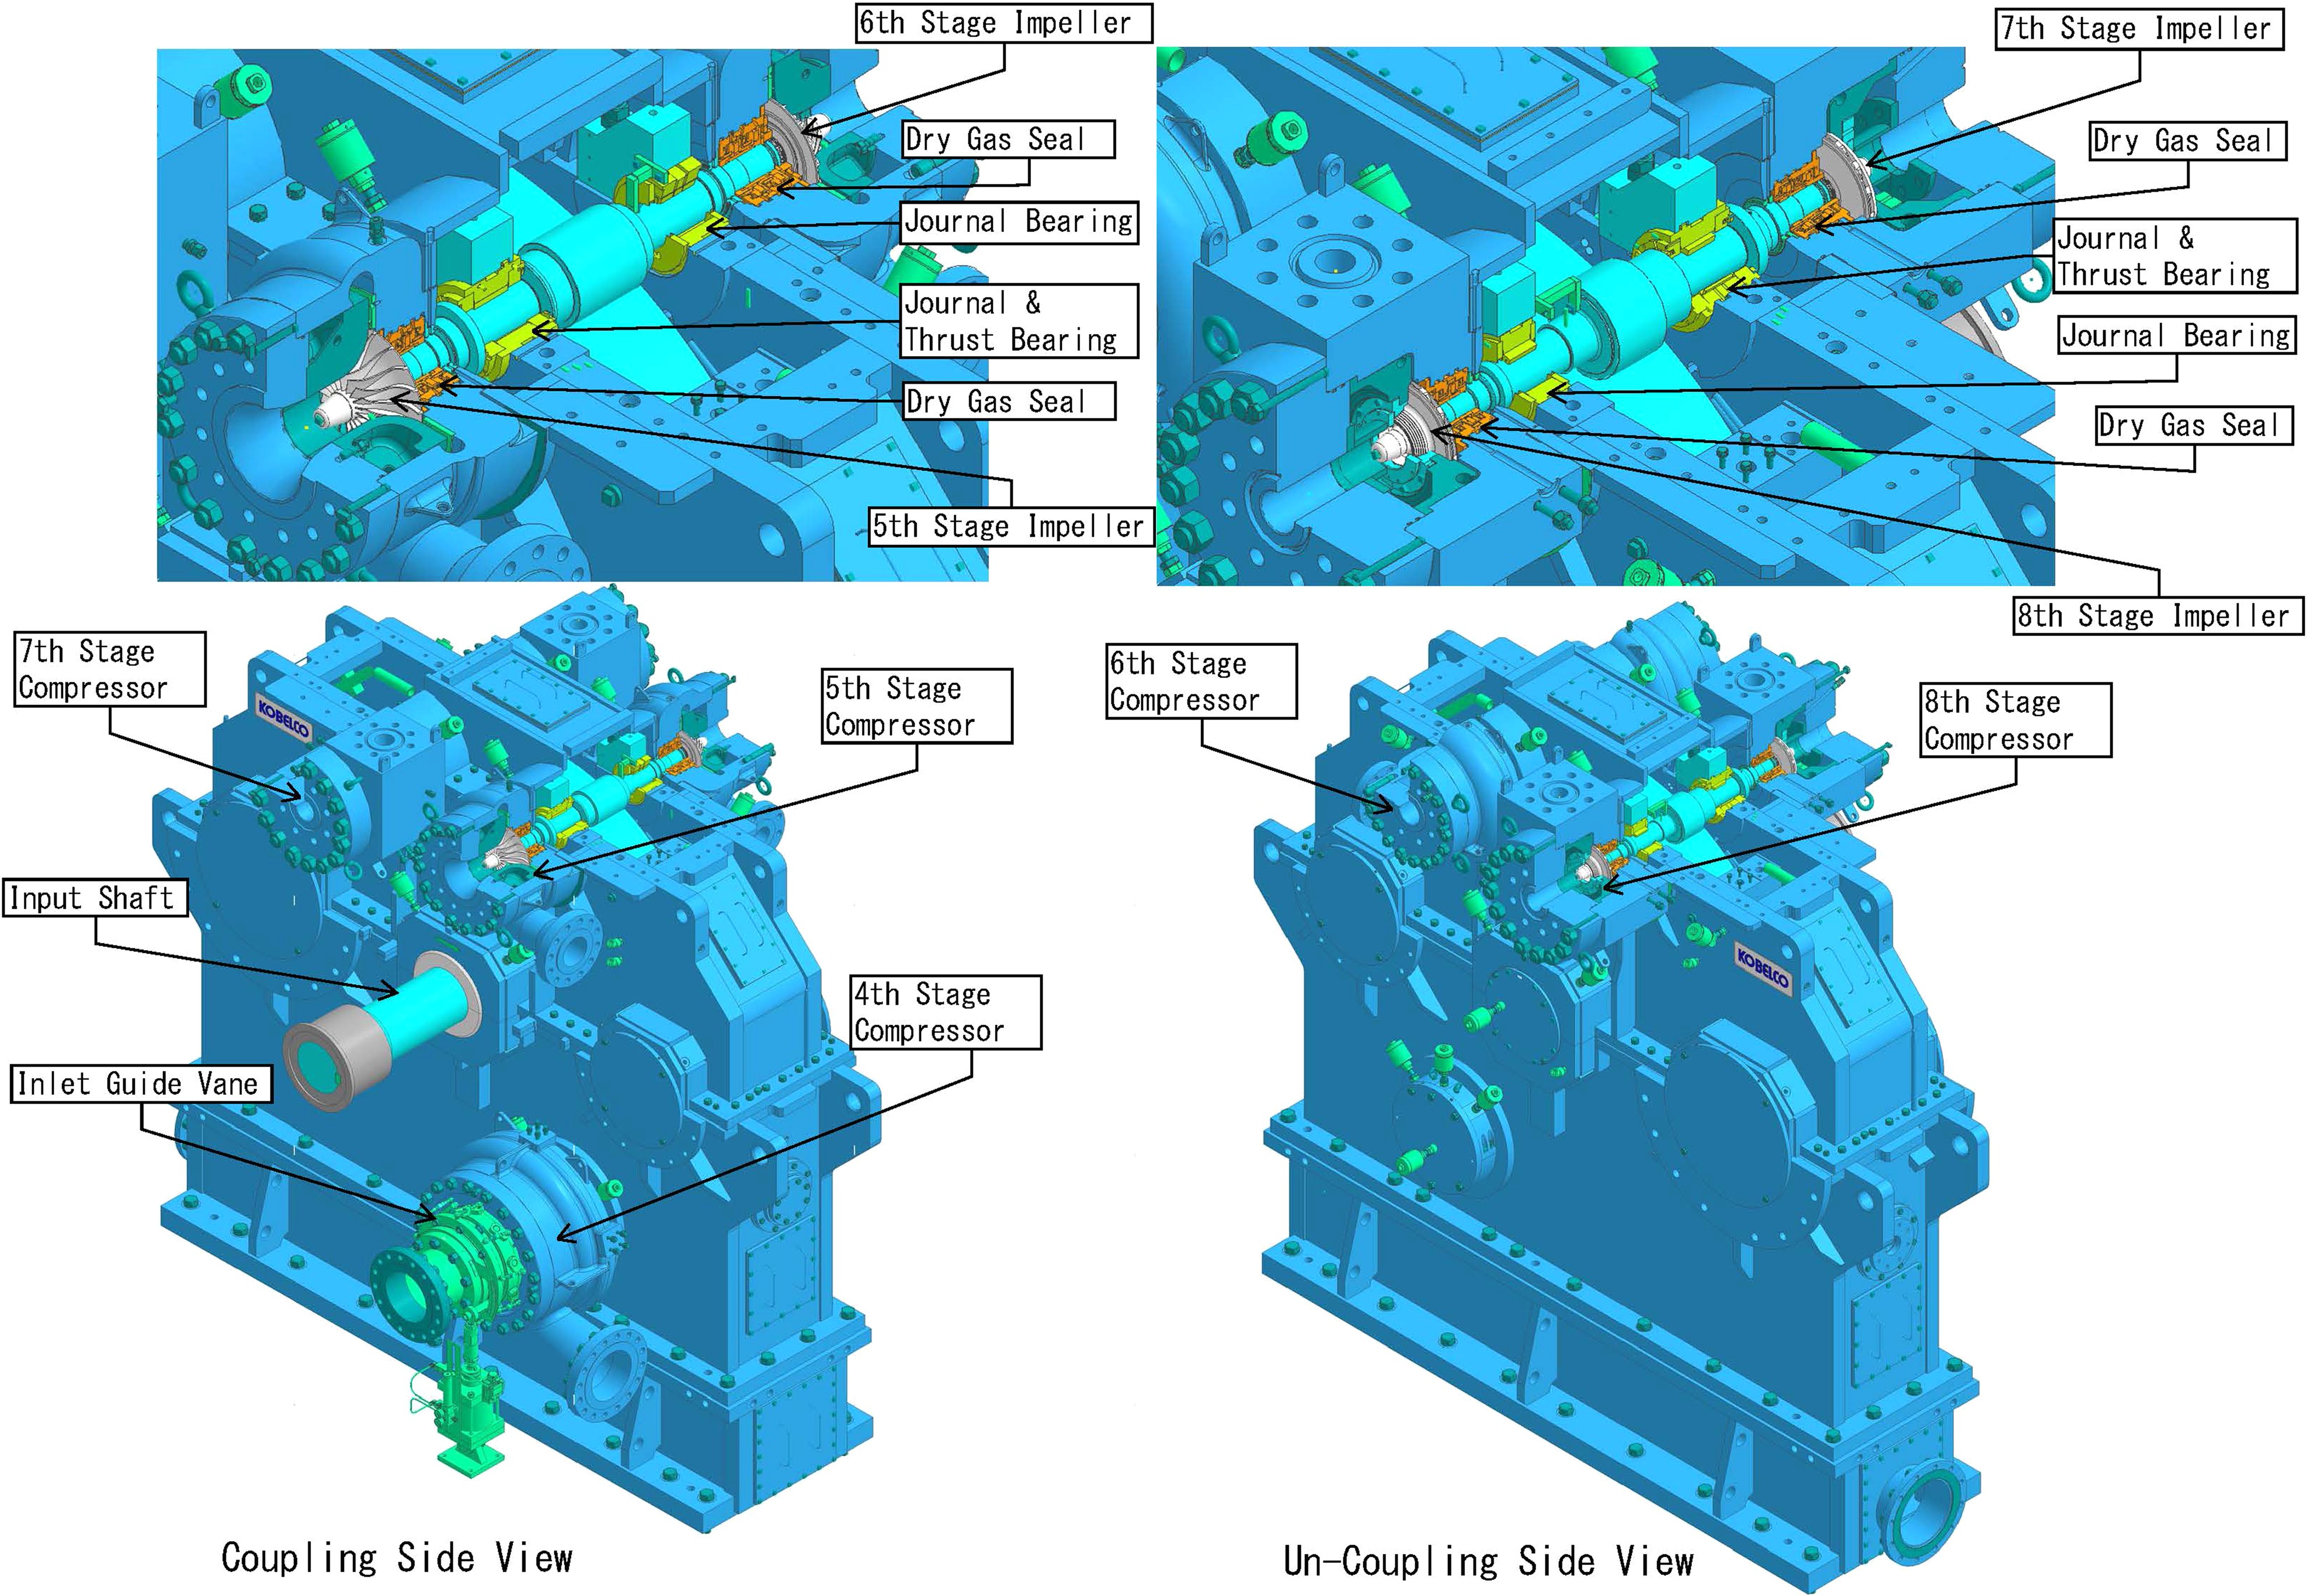
Open impellers are adopted for 4th stage to 6th stage whereas covered impellers for 7th and 8th stage. All the impellers are specially designed for the test considering the characteristics of carbon dioxide gas. The external look and the internal configuration of the main parts are described in Figure 2. The integral gears of the prototype compressor consist of one bull gear rotor and three pinion rotors. All pinion rotors are supported by tilting pad journal bearings. Squeeze film damping function is equipped for 5th, 6th, 7th and 8th stage rotor journal bearings to ensure high rotor stability. Thrust bearings are implemented to support thrust forces applied on each pinion shaft. Tandem dry gas seals are used for shaft sealing of all high pressure stages (4th stage to 8th stage).
The dynamic balancing and over speed tests for impellers were performed before assembling the rotor. An input shaft with bull gear is connected to a shop motor via a flexible coupling. Compressor casings (all stages) are specially designed and manufactured to withstand the maximum operating discharge pressure. All the casings go through hydrostatic test and leakage test before being introduced to operational test. A closed loop is designed for the test and intercoolers are installed between the 4th and 5th stage, 5th and 6th stage, 6th and 7th stage respectively. A main bypass cooler is equipped across 4th stage suction and 8th stage discharge. The main bypass valve in this loop regulates the discharge pressure. Intermediate bypass line is also connected between the 5th discharge and the 4th suction line enabling start up and relatively low pressure operation. Carbon dioxide gas is fed into the 4th suction line of the closed loop system from CO2 supply source at test shop. The schematic representation of the test loop and over-view of the test bench are shown in Figures 3 and 4, respectively.


Main component design and test
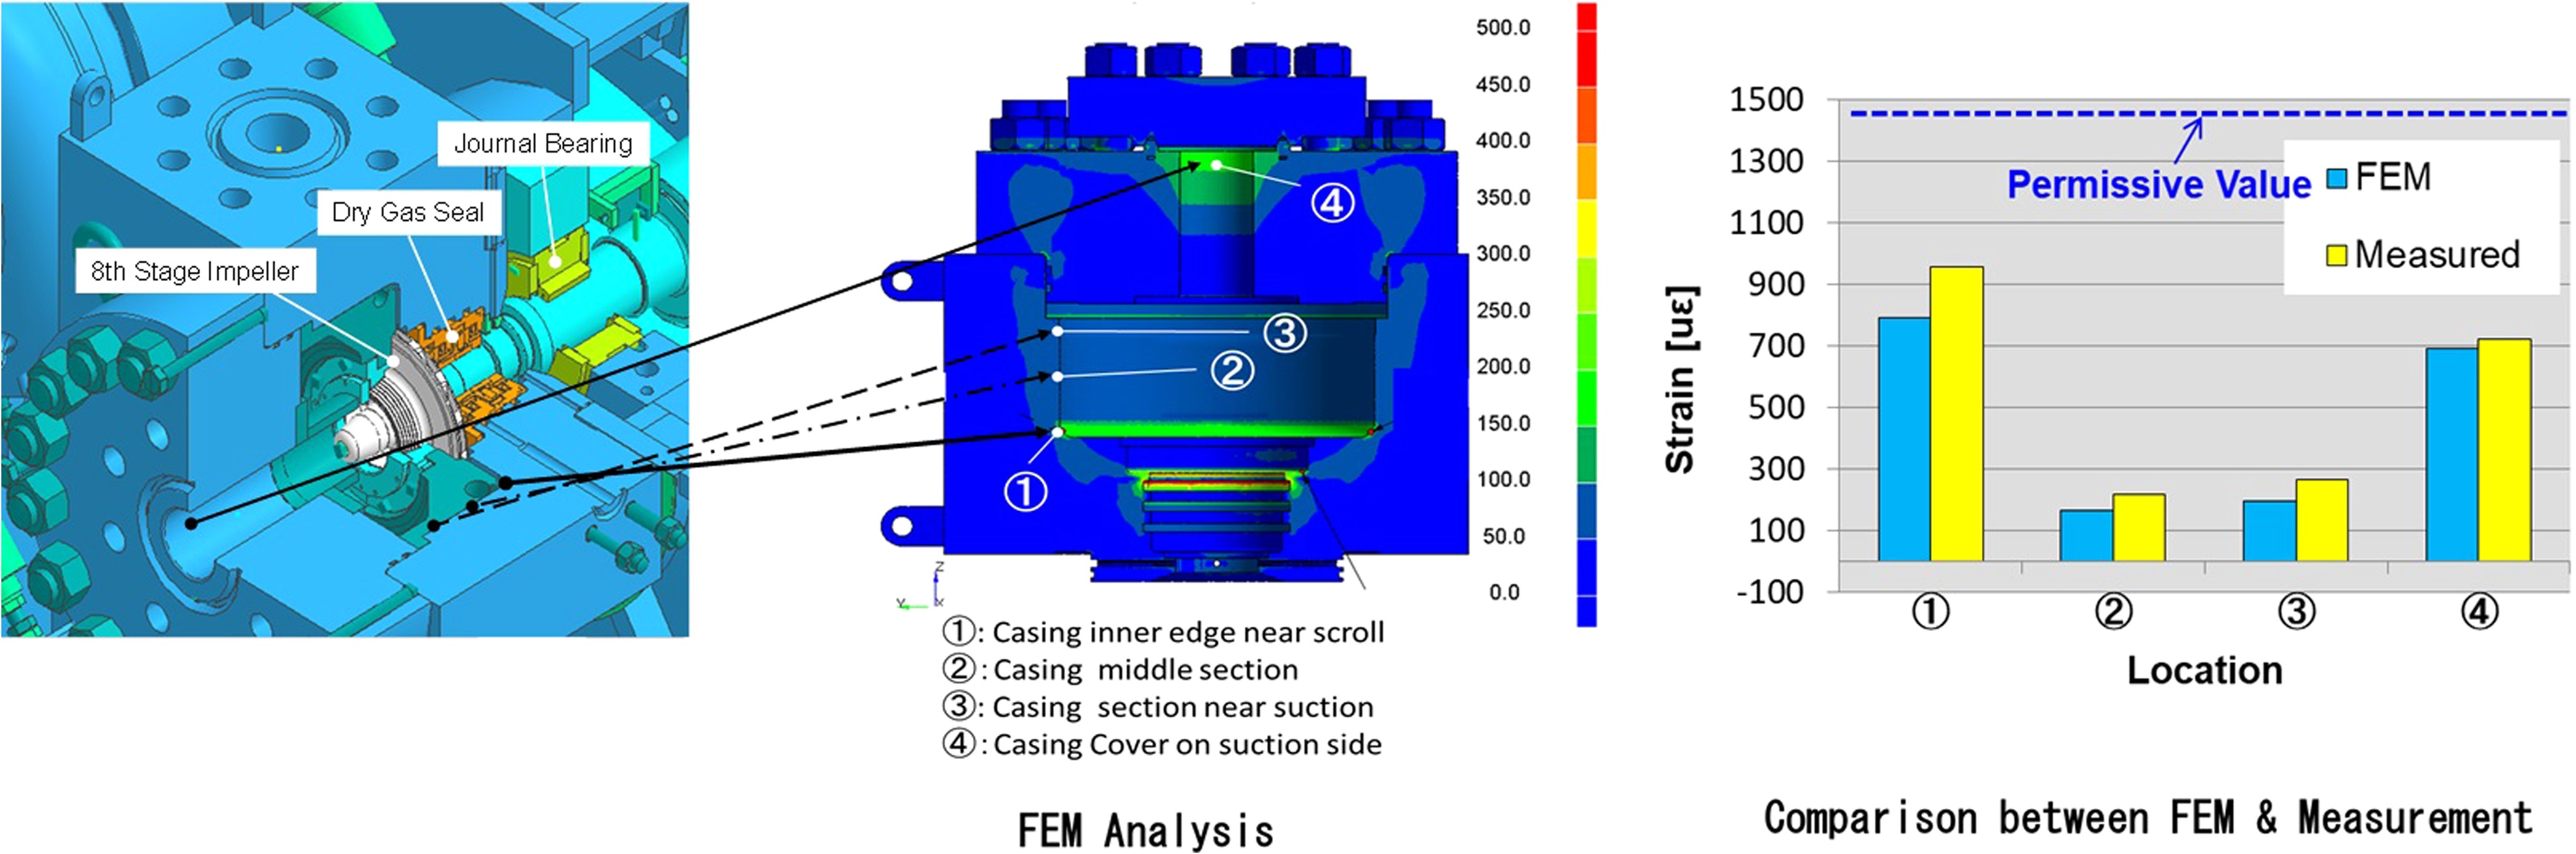
Compressor casings for all five stages were designed and FEM analysed, since higher stress was expected than that of usual compressors because of high pressure. As a result of stress concentration, a relatively higher stress than yield strength of the material was revealed near the tongue area of the scroll casing by FEM. Elasto-plastic analysis was carried out to assess the stress by using material characteristics data obtained from the test piece of same material. The analysis results were assessed according to ASME Section VIII and concluded that the designed casing had enough fatigue strength against expected usage for over 20–30 years as an industrial compressor. Not only FEM analysis but also actual stress was evaluated by means of strain gauges during pressurized test of the casing to verify FEM calculation results. Figure 5 displays the comparison of FEM analysis with actual stress measurements at the centre of casing flow passage and confirmed that the casing design is within the permissible stress limits.
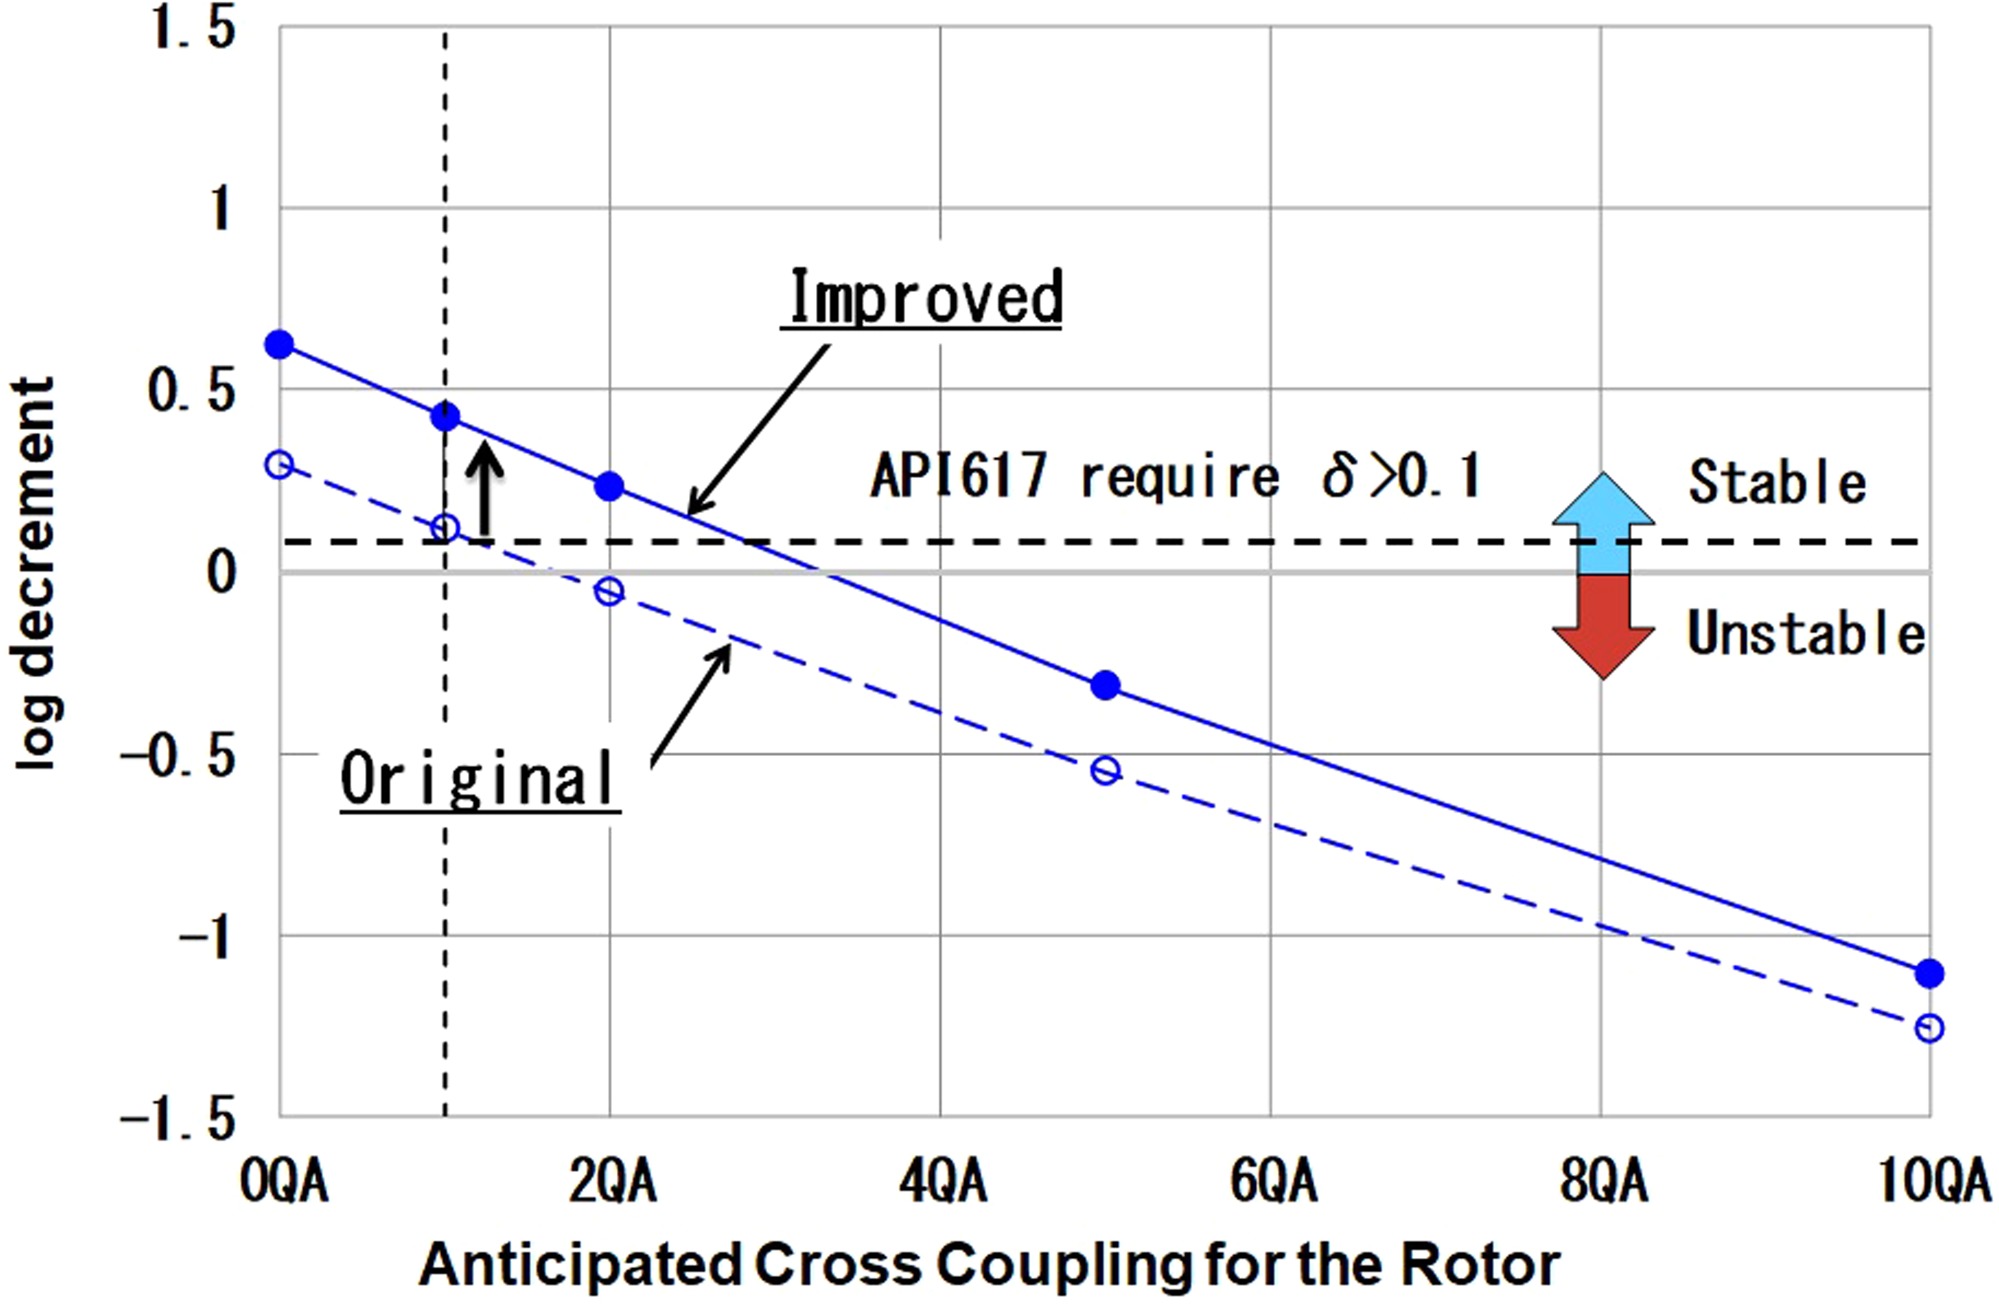
Rotor design was a key factor to enable a stable operation. The API regulates minimum log decrement for external excitation force on the rotor. Since the average gas density was relatively high, Level II stability analysis was required for rotors of 5th to 6th stage and 7th to 8th stage. The dynamic effects from impeller and seals that contribute to the overall stability of rotating assembly were examined and included in the analysis. The original rotor design could not satisfy the regulation because of stronger destabilizing fluid force acting on impellers of 7th to 8th stage rotor. Therefore, swirl brakes were implemented in front of the impellers, due to which the minimum criteria had passed (Baldassarre et al., 2014), however, still further stability was desired. Followed by the installation of squeeze film dampers to the journal bearings and then log decrement had finally improved sufficiently high as expressed in Figures 6 and 7. Since it was considered that the measurement of rotor vibration during operational test is not sufficient, a special measurement was adopted to obtain the rotor natural frequency and log decrement during running condition by implementing additional design to the compressor. Details and test results are described in the latter section.
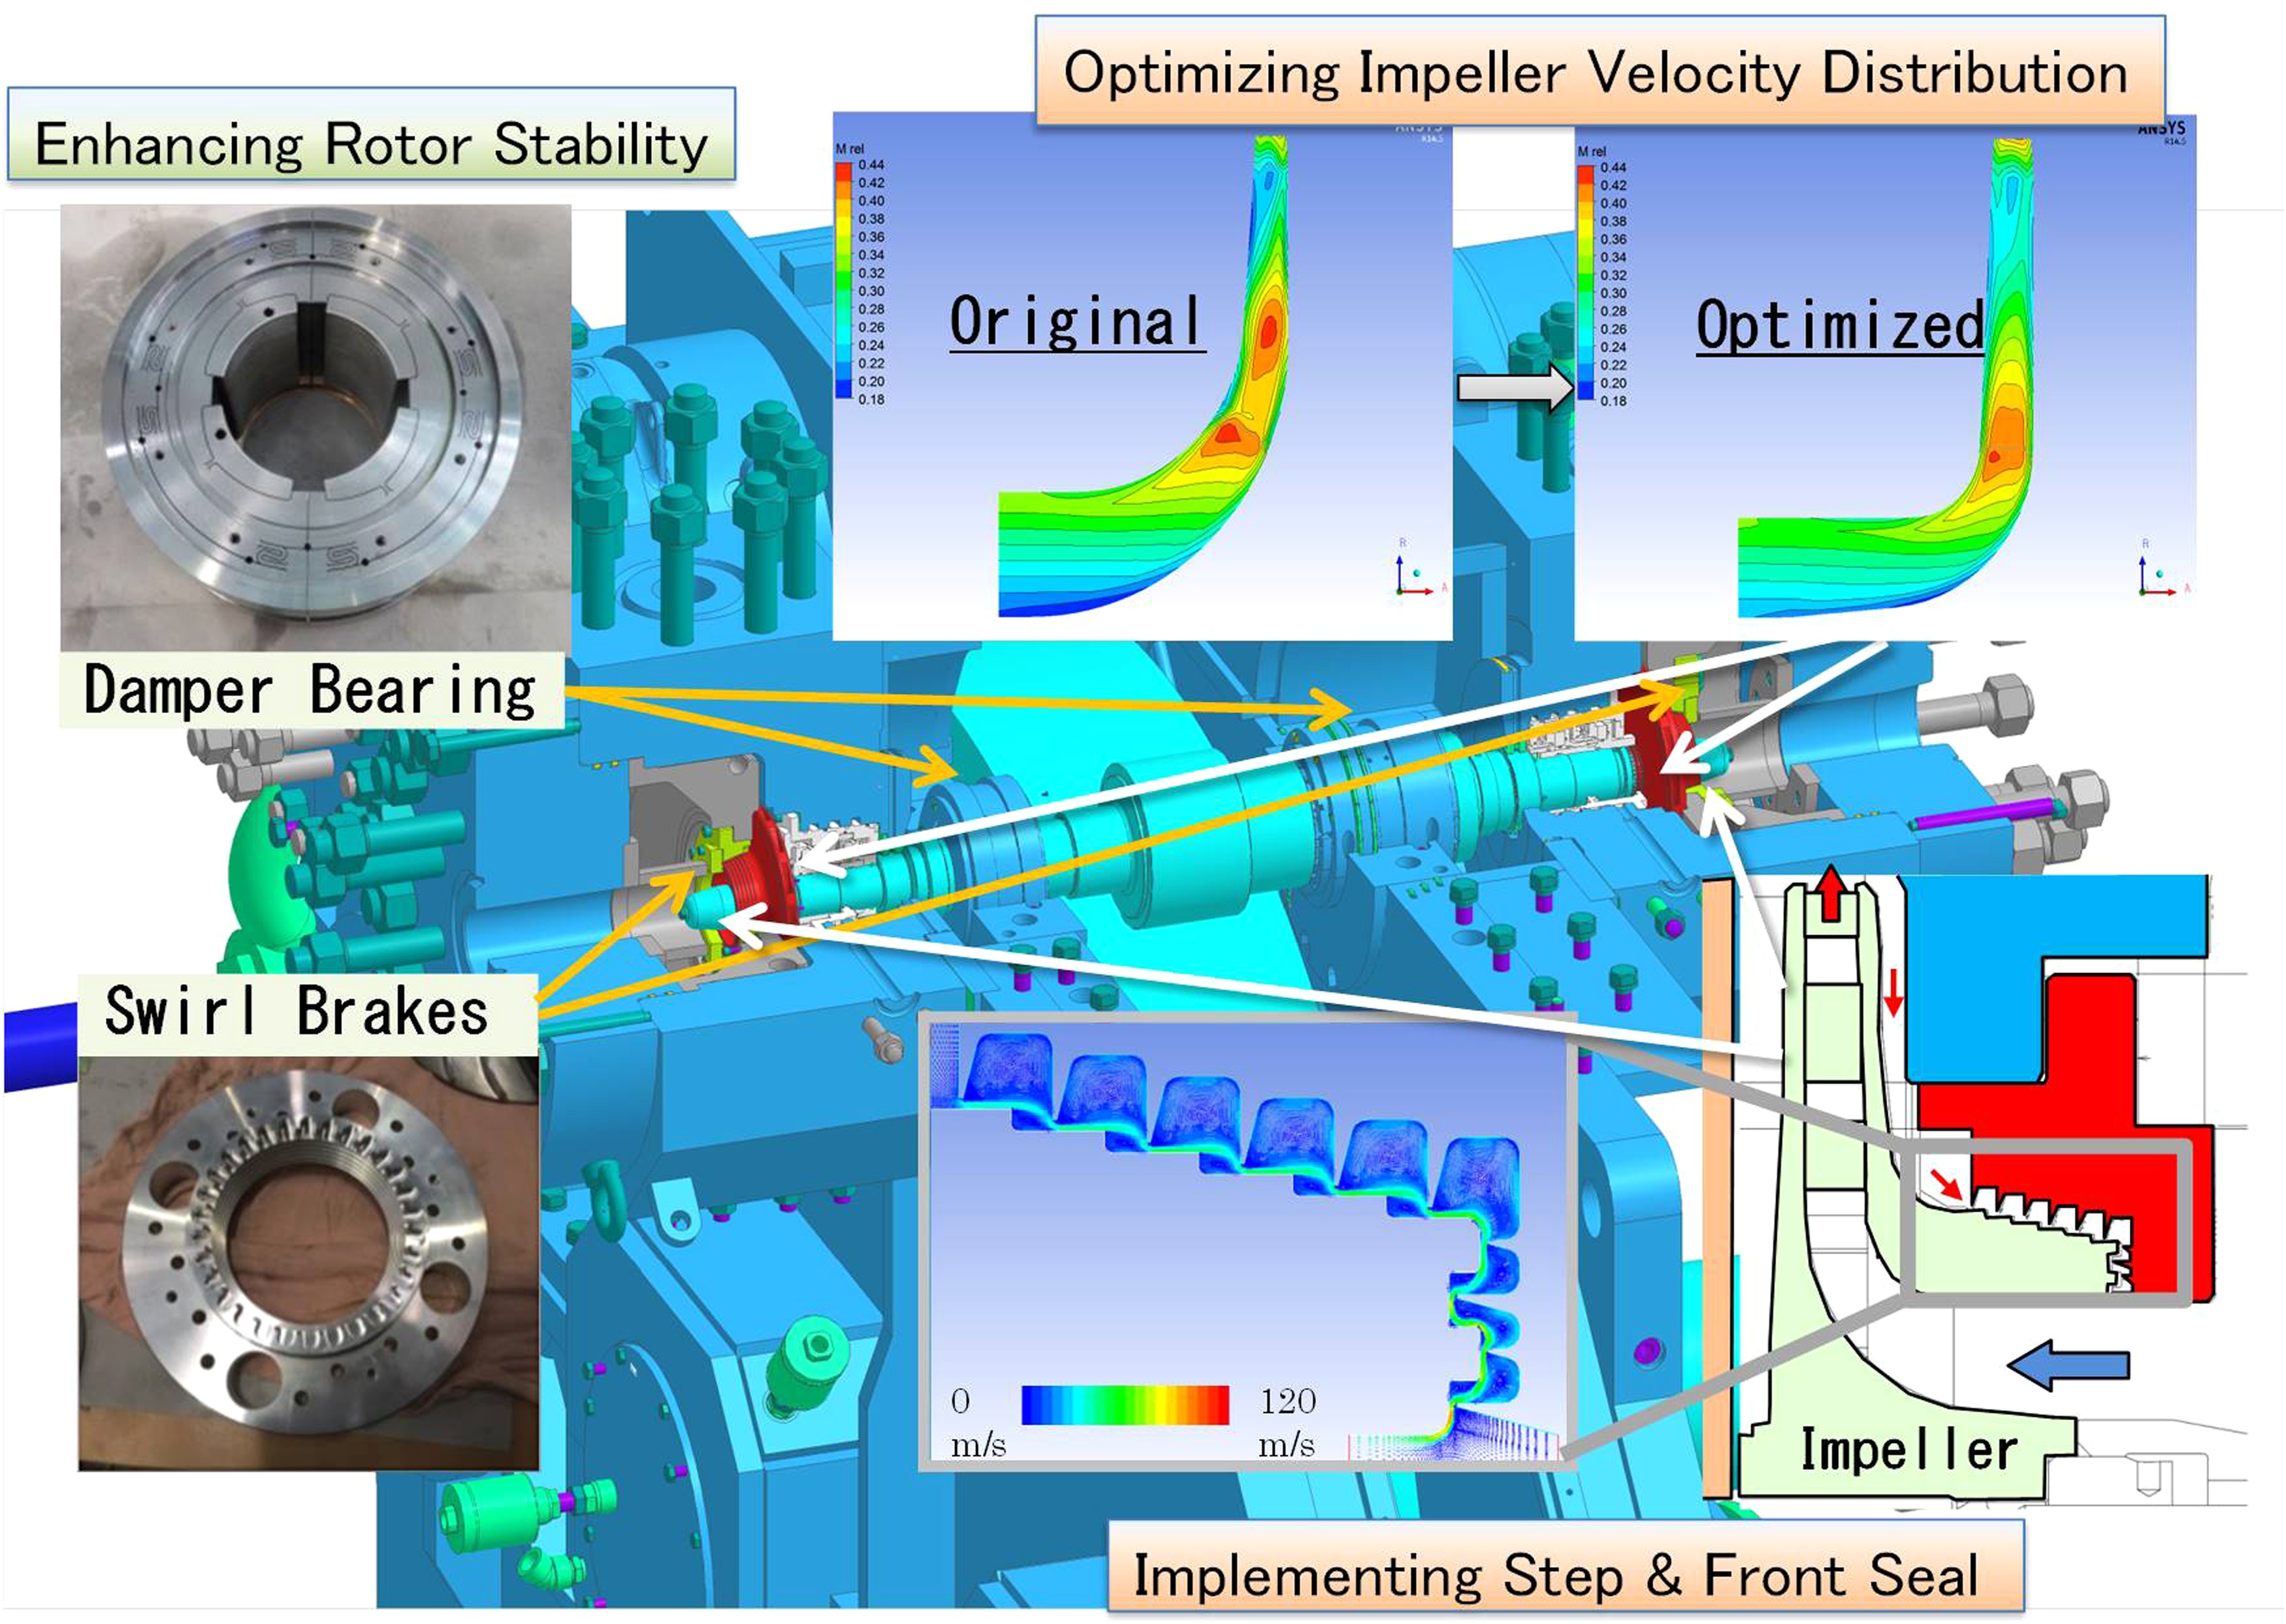
Covered impellers were adopted for 7th and 8th stage, where the gas pressure is high and their blade heights at the exit are very small. The gas condition is in supercritical region and thus special care about CO2 gas property should be paid to the design of impeller blades. Computational fluid dynamics was performed to study the velocity distribution through the impeller blades with CO2 gas properties. As a result of this study, the blade passage was optimized from conventional design to attain a smooth velocity distribution. The conventional design shows the existence of two velocity peak areas in the blade passage, whereas the velocity peak area had reduced in the optimized blade passage (upper right in Figure 6) and it was expected to have smooth velocity change. The gas flow around the impeller seal at the suction part was also investigated and modified to reduce the leakage flow rate by implementing step and front seal, thereby reducing the leakage amount by about 35 percent (lower right in Figure 6). The impeller efficiency was increased by a few percent in total.
Full pressure and full load test
The prototype compressor was installed at OEM’s test bench as shown in Figure 4, and the operational test was performed with CO2 gas. The test started at relatively low pressure condition and the mechanical and aerodynamic performances were monitored. The gas pressure level was gradually increased step by step until it finally reached the rated pressure level of 20 MPaG. The main purposes of this test are (1) to measure static performance and (2) to verify usually unknown values. The former includes aerodynamic performance of each stage and mechanical performance such as rotor vibration and bearing temperature. These are usually measured at site to detect any abnormal conditions. However, it is difficult to determine the performance margin from the design criteria at site by simply monitoring trend data. Knowing how much margin is left makes it possible to give confidence to stable operation and verify proper design. The latter purpose is to come up with such expectation. Following special and state-of-the-art measurements were planned and carried out in this full pressure and full load test. They are (a) rotor natural frequency and log decrement measurement, and (b) impeller blade vibration and stress measurement. All of them were performed during operation without affecting the original compressor performance and succeeded in generating quite meaningful and reasonable data. Details are described in the latter sections.
Mechanical performance
The mechanical performance test for shaft vibration and bearing temperature was carried out as first assessment, which is usually monitored to confirm stable operation. Two vibration sensors were equipped at each stage and continuously measured during the test. Lubrication oil was supplied at a required operating pressure and confirmed that the oil flowrate was within the desired value. All shaft vibrations were below API 617 criteria even at high discharge pressure condition i.e. 20 MPaG as shown in Table 2. Bearing temperatures were also much lower than OEM’s criteria for all stages. Based on these test results the mechanical design of the prototype compressor was judged suitable as a high pressure integrally geared centrifugal compressor. The basic bearing specifications are summarized in Table 3.
Table 2.
Mechanical performance test results (Rated Condition).
Table 3.
Bearing basic specification.
Aerodynamic performance
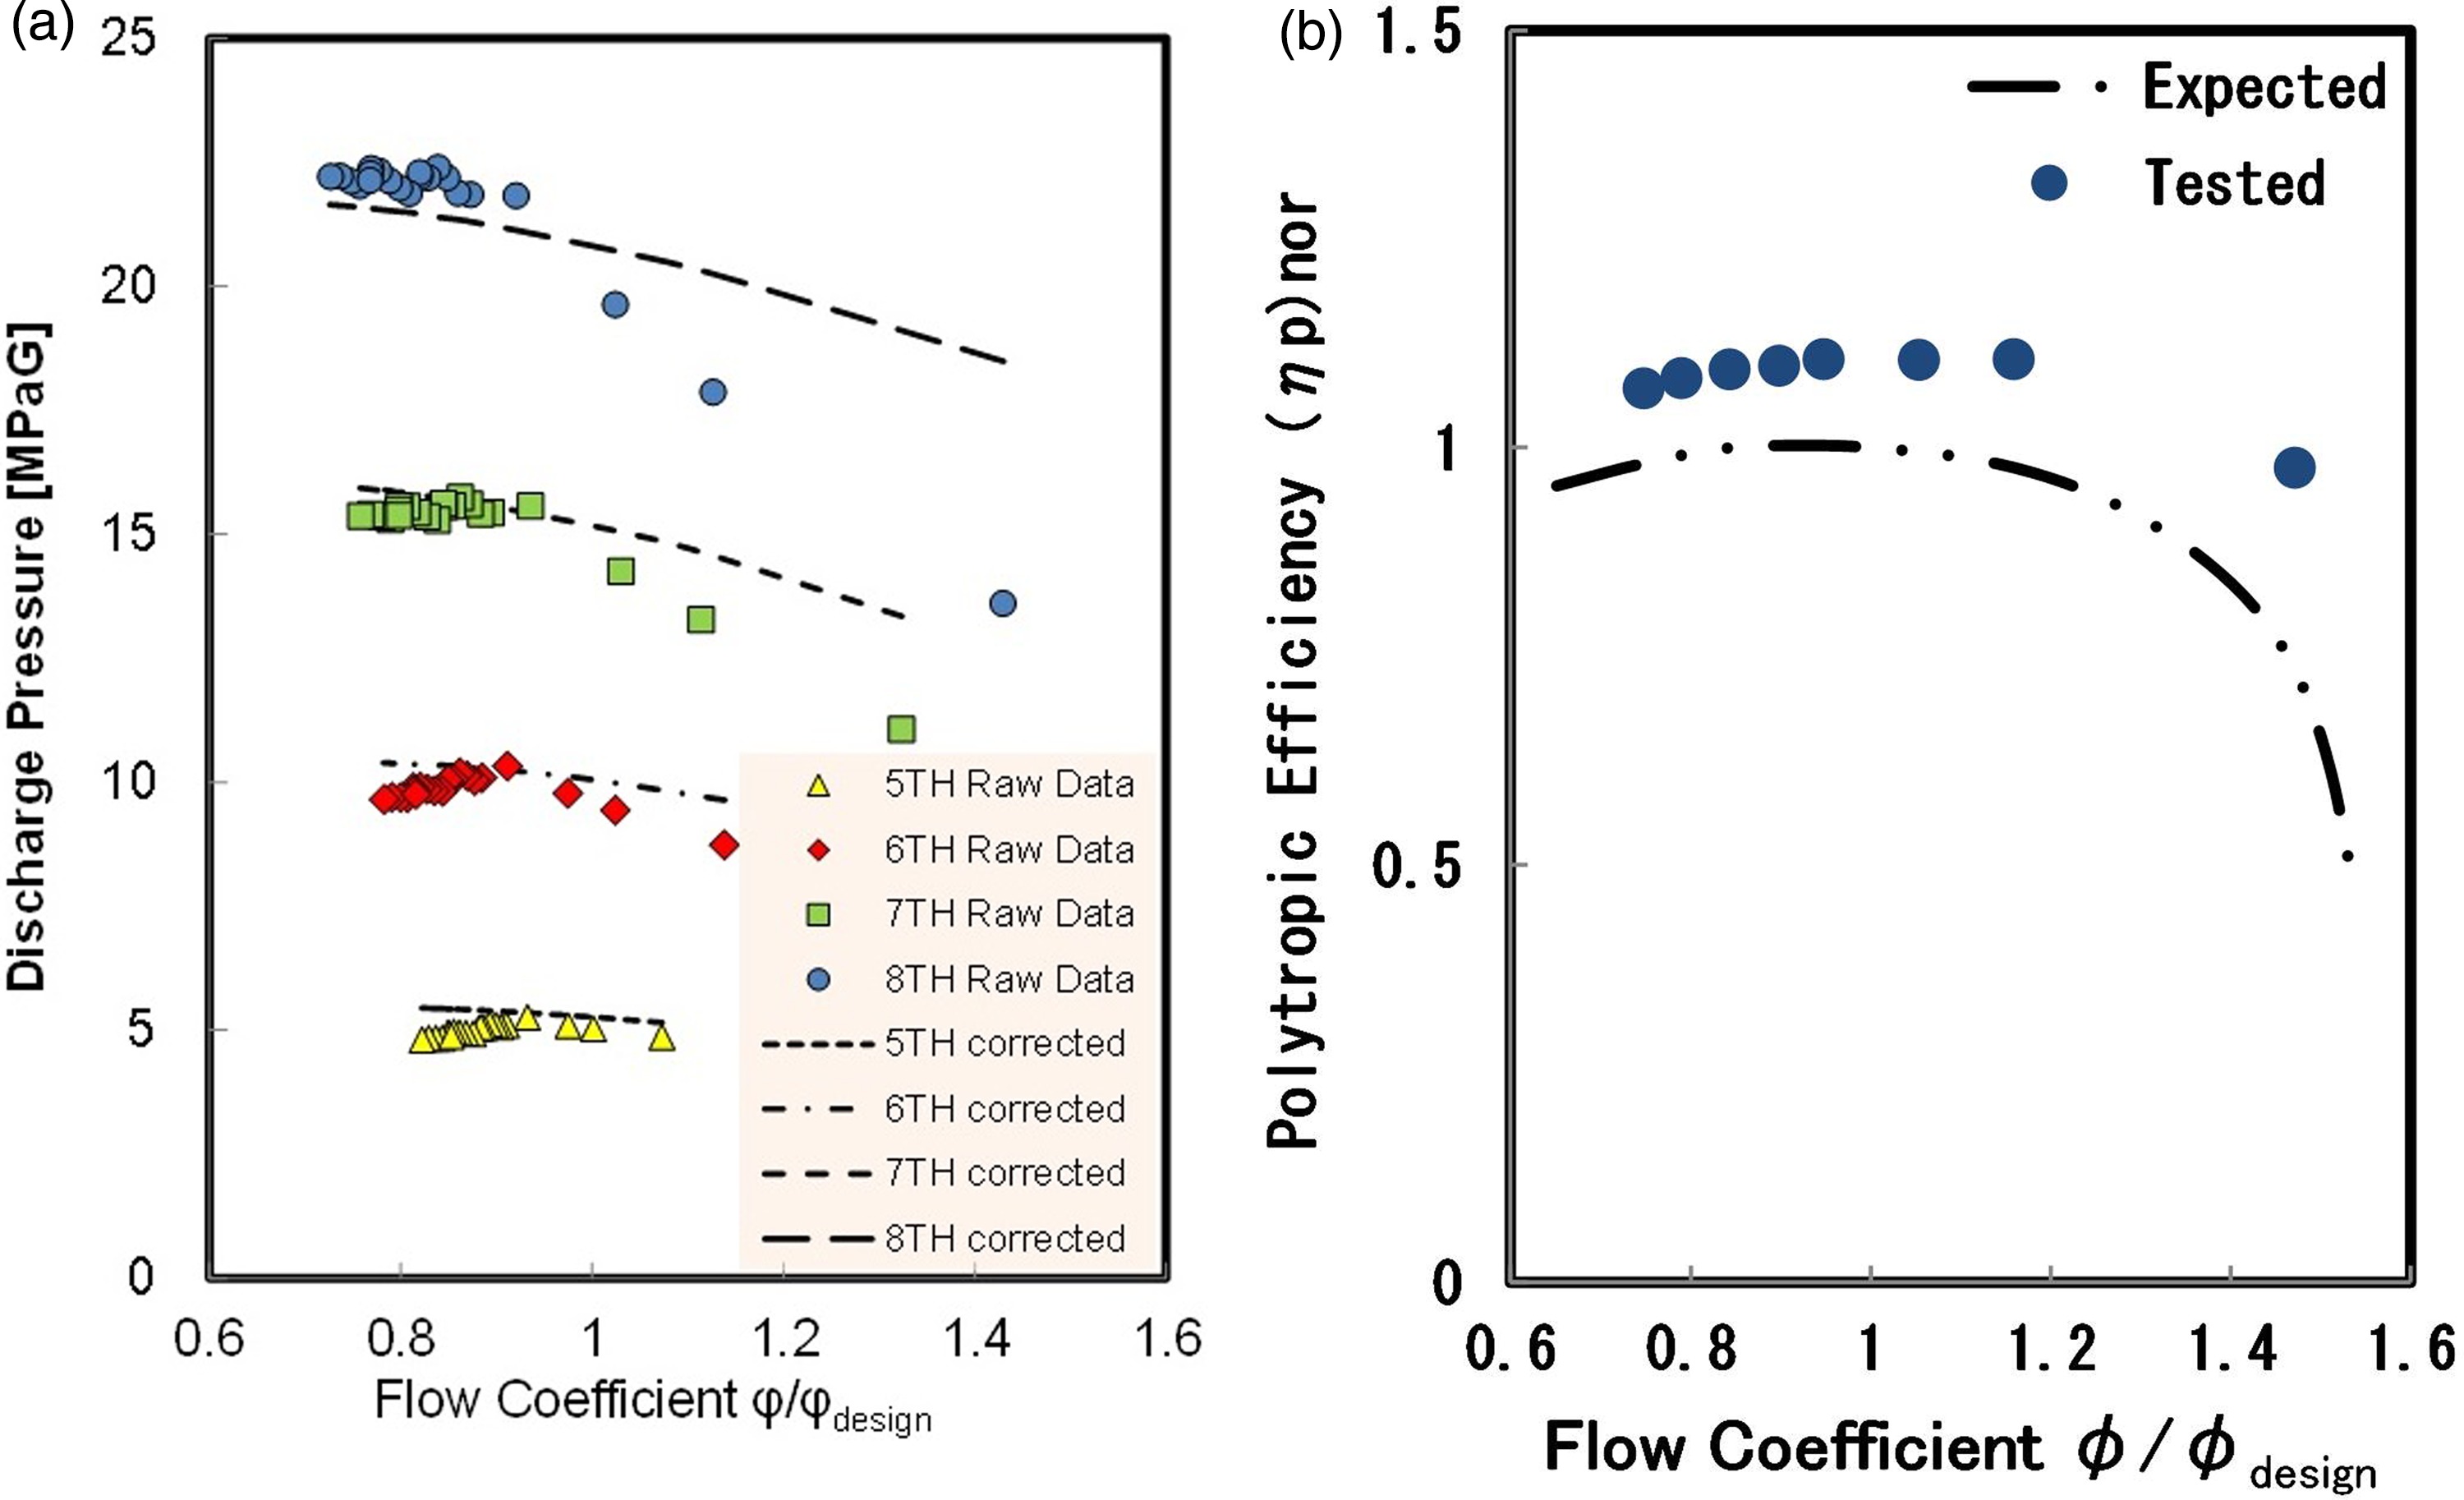
Gas pressures, temperatures and flowrates were measured at inlet and outlet of each stage of the prototype compressor to assess the aerodynamic performances. The inlet pressure of the 4th stage was kept constant by adjusting the supply and discharge pressure of CO2 gas and the flowrate was controlled by the discharge bypass valve. The flow coefficient versus the discharge pressure of the 5th to 8th stages is shown in Figure 8a. The graph of flowrate is normalized by inlet volume flow of each stage. The plots in the graph are simply measured values, which are affected by inlet conditions because of the test facility limited capability. The dotted lines represent corrected discharge pressure with constant inlet pressure and temperature. The rated discharge pressure of 20 MPaG was attained around the rated flow coefficient. Gas compression in supercritical zone is requested for especially the 7th and 8th compressor stages, where special design consideration was taken into account. Comparison between the expected performance and the actual test performance of the 8th stage is plotted in Figure 8b, in which the test result shows higher Polytropic efficiency than expected, thus the appropriately designed aerodynamic parts including the impeller is appreciable. All of these are test results with diffuser vanes.
High pressure rotor stability test
Justification of rotor stability evaluation
In high pressure compressors, the process gases become denser hence affecting the destabilizing fluid forces on the impellers. It is well-known that the high pressure fluid forces as well as the stiffness and damping of the bearings will greatly change the log decrement of rotors. In particular, the destabilizing fluid force decreases the log decrement of forward vibration modes. Once a negative log decrement occurs because of inappropriate rotordynamic design, such a rotor condition might cause serious unstable shaft vibration (Kulhanek et al., 2017). The API standard requires more than 0.1 rotor log decrement. Therefore, sufficiently high damping rotor dynamic design and the comprehensive stability test are very important to ensure the machine reliability under high pressure operation (Vannini et al., 2017).
If compressor OEMs can measure the log decrement of actual operating rotor, the mechanical reliability against unstable vibration will be demonstrated. A rotor log decrement measurement has to be performed under actual operating condition, because it highly depends on the operating load, i.e., discharge pressure and rotational speed. Generally, it is difficult to evaluate the rotor log decrement from steady operating vibration measurement, thus some OEMs attempt shaking test to excite the rotor vibration modes and observe the shaft vibration response by proximity probe. Since the excited vibration responses shaking from the outside of the casing are relatively small, further effective excitation method is desired for the rotor inside the casing.
The API standard exemplifies the rotor excitation method using the magnetic bearings (API STANDARD 617, 2014). Research in the past has established a stability test sequence applying the magnetic bearings for the inline centrifugal compressors (Noronha et al., 2014; Vannini et al., 2014). However, most integrally geared compressors have no extra space for installing the magnetic bearings on the rotor, because there are a lot of components on the rotor, i.e., shaft seals, bearings, impellers and a gear mesh. However, extending the length of the rotor to place magnetic bearings will change the rotor shape, hence it is not an actual rotor design verification. According to above discussions, it is difficult to apply the magnetic bearings to the integrally geared compressors to evaluate rotor stability. In this paper, the authors have developed a novel direct rotor excitation technique using the magnetic exciters designed in-house. The development of compact magnetic exciters enables to be incorporated into the casing and can be an effective method of exciting rotor vibration modes.
Test method and data processing of rotor excitation system
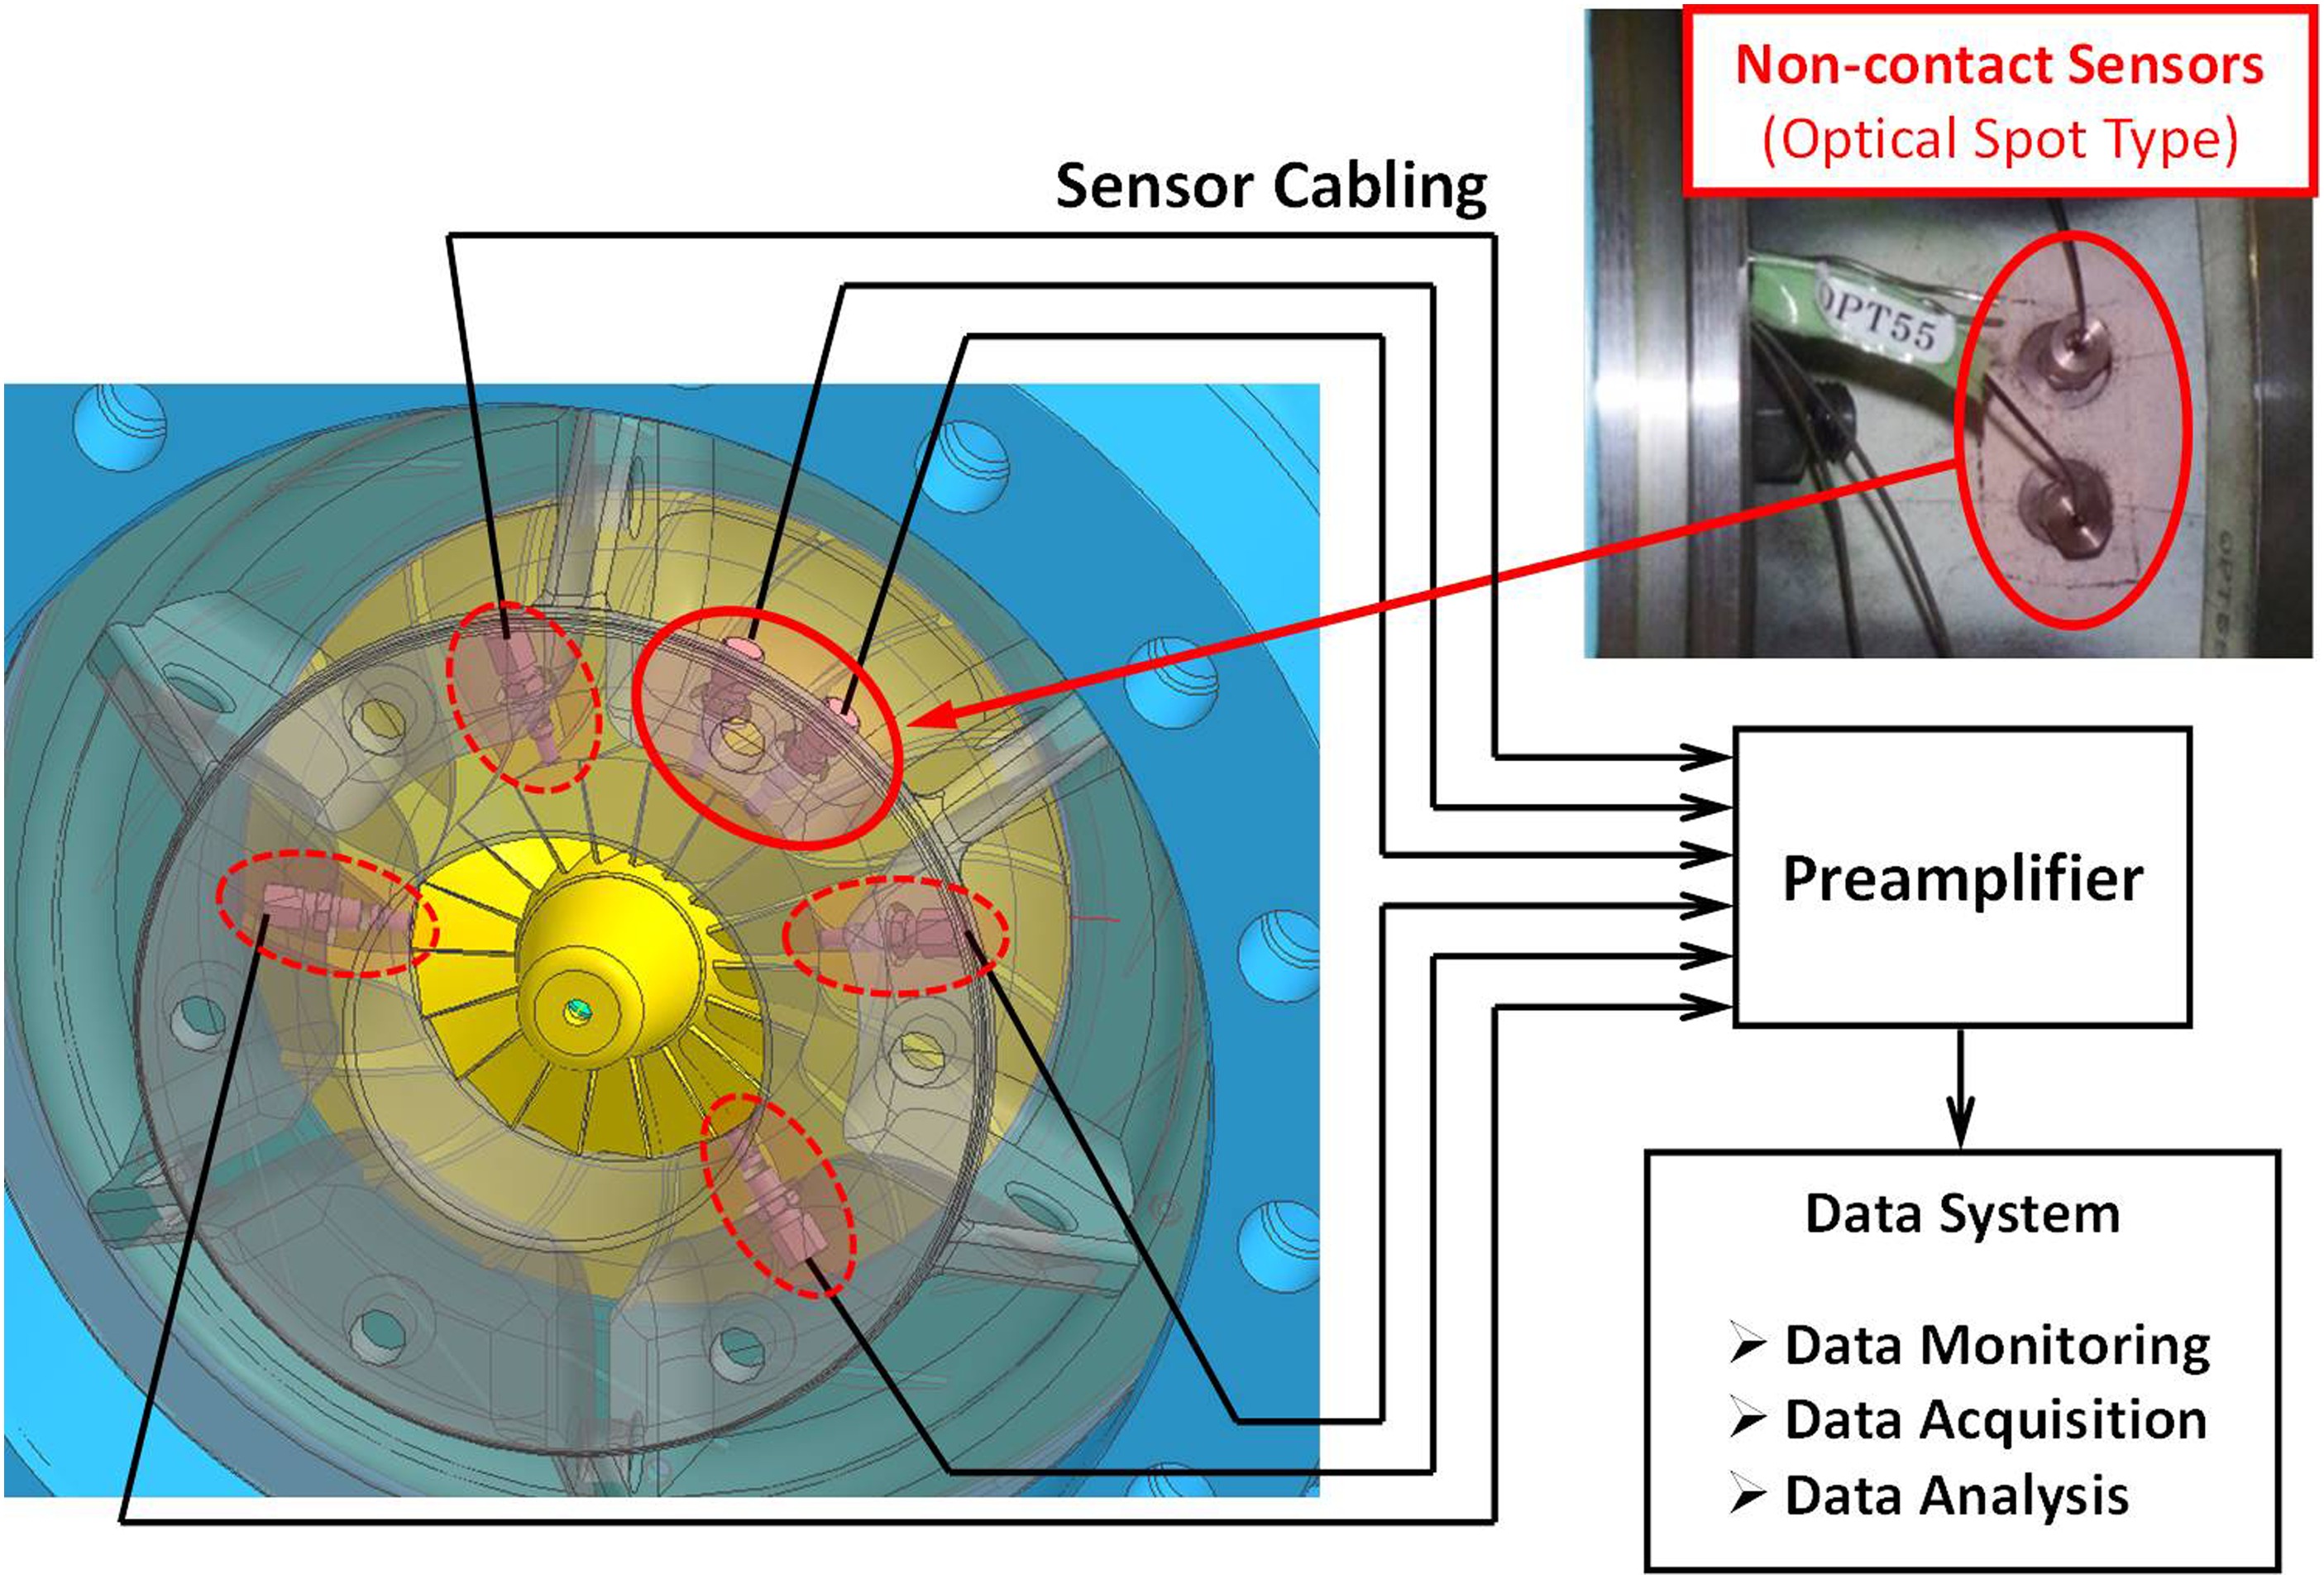
Figure 9a illustrates the excitation system developed. Four magnetic exciters are installed facing the 7th stage impeller shroud cover in the circumferential direction. The magnets are disposed outside the impeller to generate a bending moment that excites the rotor vibration mode though the generated forces acting in the axial direction of the rotor. The rotor has two rotating directions of vibration mode, one is along the rotational direction and the other is in the opposite direction.
Figure 9.
(a) Principle of Developed Magnetic Rotor Excitation System. (b) Magnetic Excitation System Configuration. (c) Cross Sectional View of the Magnetic Exciters Setup. (d) Magnet Assembly of 7th Stage Impeller.
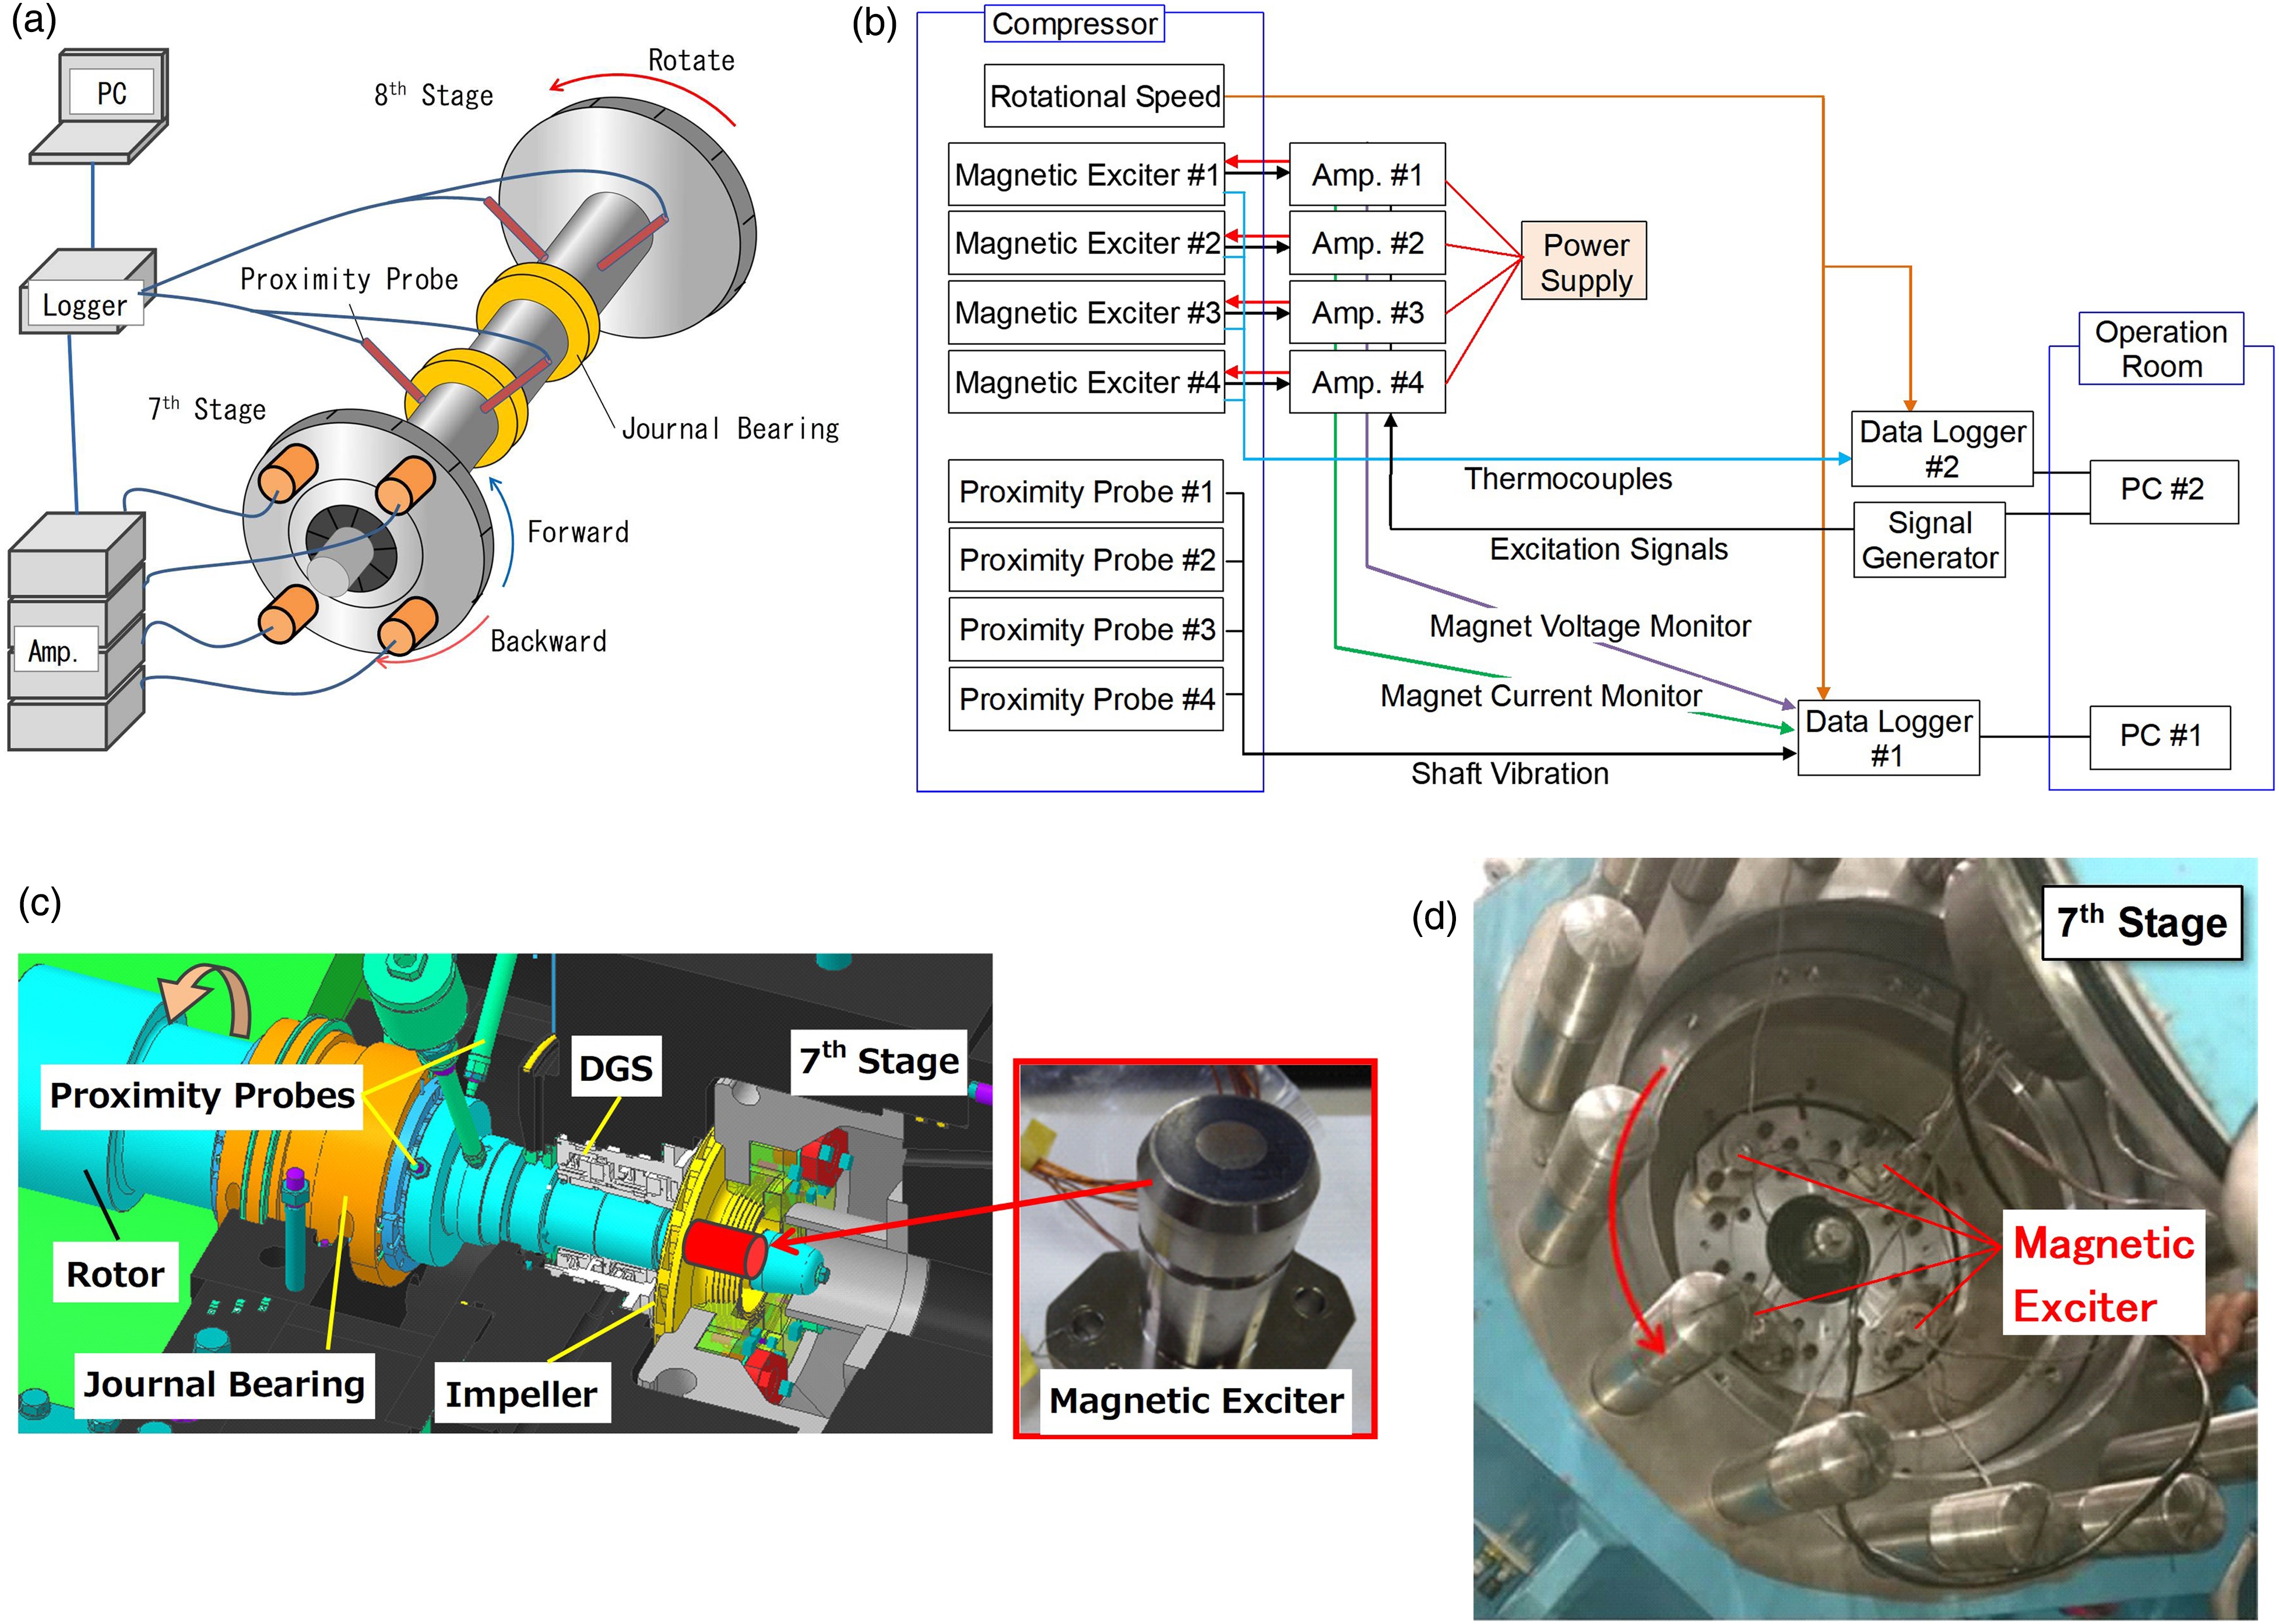
The authors implemented a rotational excitation method to excite each directional mode independently based on phase controlled magnet currents. The excitation in the rotating direction is called forward rotational excitation, and the excitation in the opposite direction is called backward rotational excitation, respectively.
According to computational modal analysis, the authors verified that it is sufficient to install a magnetic exciter only to the 7th stage impeller for rotor stability evaluation. This rotor has totally four proximity probes, two each at 7th stage and 8th stage respectively which is commonly utilized near the journal bearings in X-Y direction to monitor shaft vibration. These probes will detect the shaft vibrations generated by magnetic excitation technique.
Figure 9b depicts a magnetic excitation system configuration and signal cable connections at the time of actual stability test. The magnetic exciters and the proximity probes are set inside of the compressor. The amplifiers to drive magnets are located near the test machine. The signal cables are wired to the control room and signals are acquired by data loggers.
In-house software initiates an excitation command from PC #2 and signal generator generates an excitation signal that passes through the amplifier to drive a magnet. The thermocouples are installed on each magnet to monitor coil temperatures to avoid overheating of the coil due to applied current during excitation. Simultaneously the data logger also collects the applied voltage and current data to observe the actuation of magnets.
Figure 9c displays a cross sectional view of the magnetic exciters setup. The magnets are mounted inside the compressor casing, making it possible to measure the rotor stability without affecting the rotor design. Figure 9d shows the mounted magnet assembly at the 7th stage impeller.
The specific measurement procedures are as follows:
Output the swept sine excitation signals to drive magnets and measure the shaft vibration
Perform FFT analysis for shaft vibration data to obtain frequency response functions (FRFs)
Calculate directional FRFs (dFRFs) from the measured FRFs
Apply curve-fit to dFRFs as experimental modal analysis to determine natural frequency and log decrement
The dFRFs are separate results of forward mode component and backward mode component included in FRF. It achieves more accurate modal analysis to obtain natural frequency and log decrement (Takahashi et al., 2007, 2011).
The conventionally applied method of stability test installs a shaker on the outside of casing to excite the vibration modes by external force (Tokuyama et al., 2014). This technique is however, difficult to directly excite the rotor vibration modes, thus reducing the measurement accuracy. Furthermore, it excites the unwanted casing vibration mode which is not subjected to rotor stability evaluation. Apparently, high pressure compressor casing has higher stiffness than low pressure casings, thus excitation of high pressure casing might measure insufficient vibration response.
Rotor excitation test result
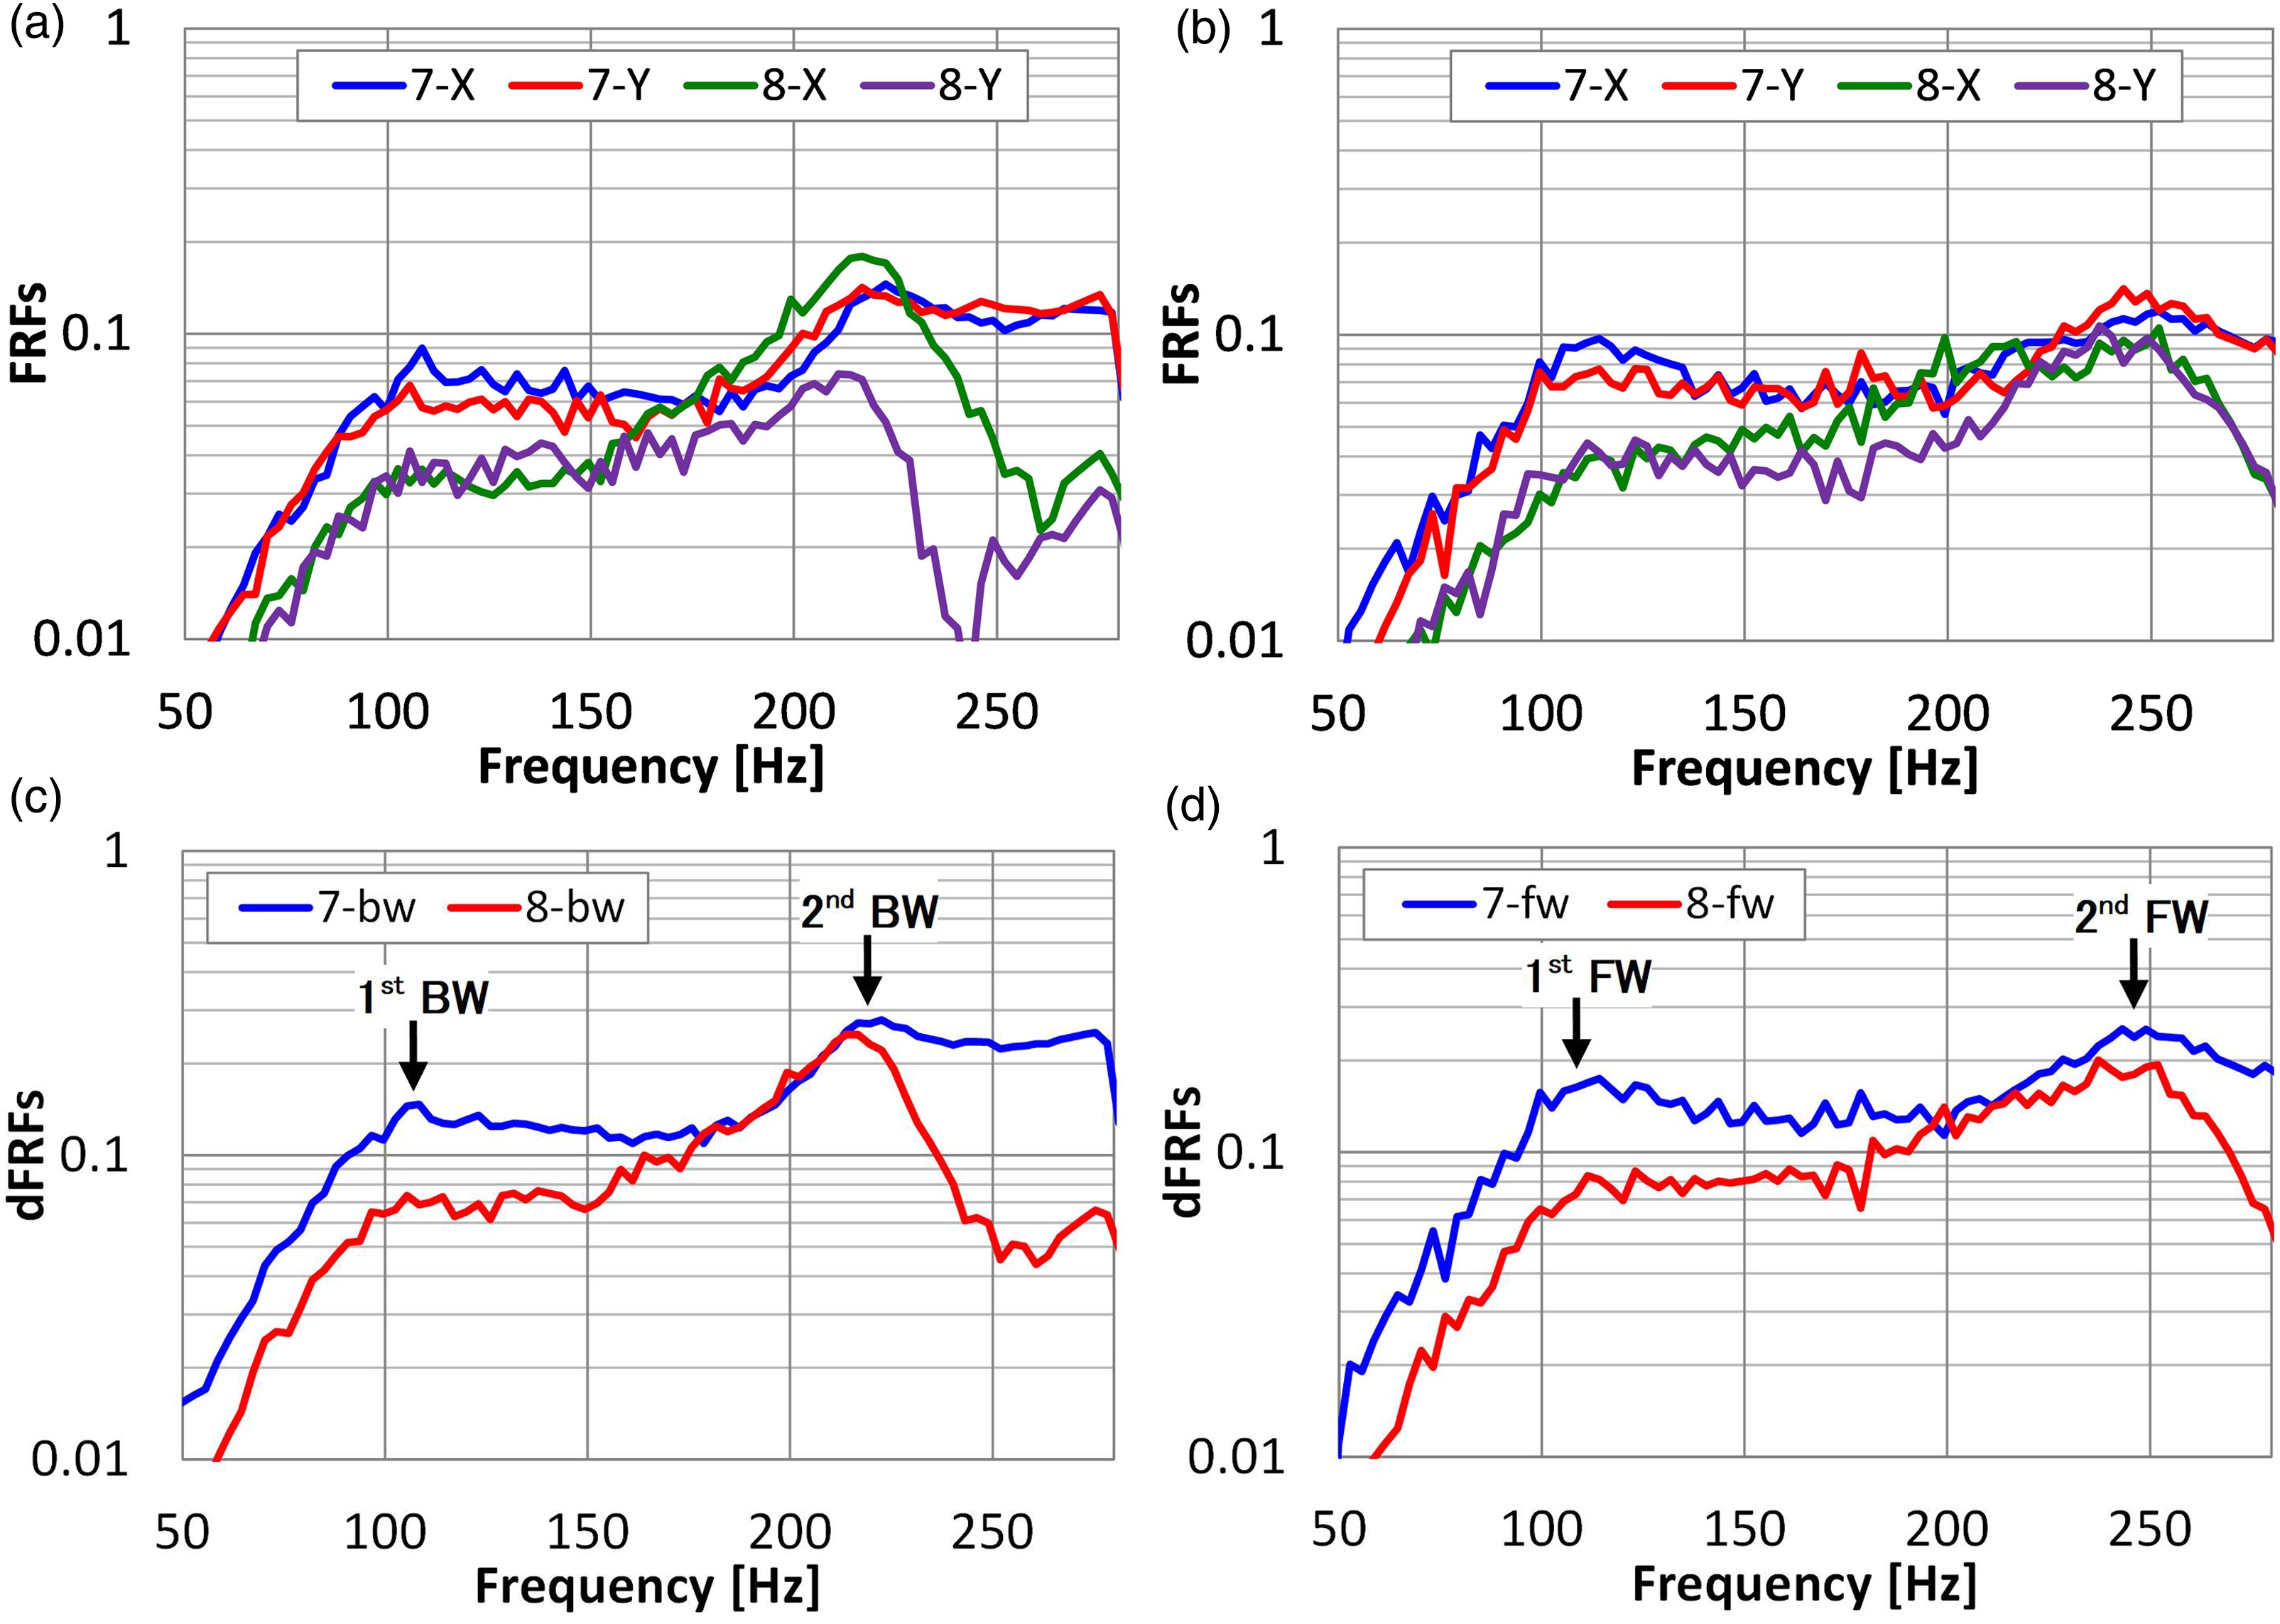
Figure 10a and b show the FRFs measured by each proximity probe due to the excitation method developed on compressor under actual operating condition. The excitation frequency range of FRF is from 50 to 280 Hz. Figure 10c and d show the dFRFs calculated from FRFs in Figure 10a and b. Figure 10c shows dFRFs of backward excitation and Figure 10d shows dFRFs of forward excitation. Both shows clear peaks in the rotor vibration mode.
Comparison of analysis results with test
Figures 11 and Table 4 summarize the rotor dynamic characteristics when operating at rated pressure of 20 MPaG. Figure 11a and b shows dynamic characteristics of rotor with tilting-pad journal bearing (TPJB). Whereas, Figure 11c and d show TPJB with integral squeeze film damper (ISFD). Also, the natural frequency of forward mode is shown in Figure 11a, the first mode is measured at 180 Hz and the second at 250 Hz, respectively. The predicted values are in good agreement with test results. Moreover, Figure 11b shows the measured log decrements are higher than the predicted ones which validates the safe design of rotor stability. These results quantitatively proved that the actual rotor log decrement is greater than 0.1 with enough stability margins.
Figure 11.
Dynamic Characteristics of Rotor. (a) Natural Frequency with TPJB. (b) log decrement with TPJB. (c) Natural Frequency with ISFD Bearing. (d) log decrement with ISFD Bearing.
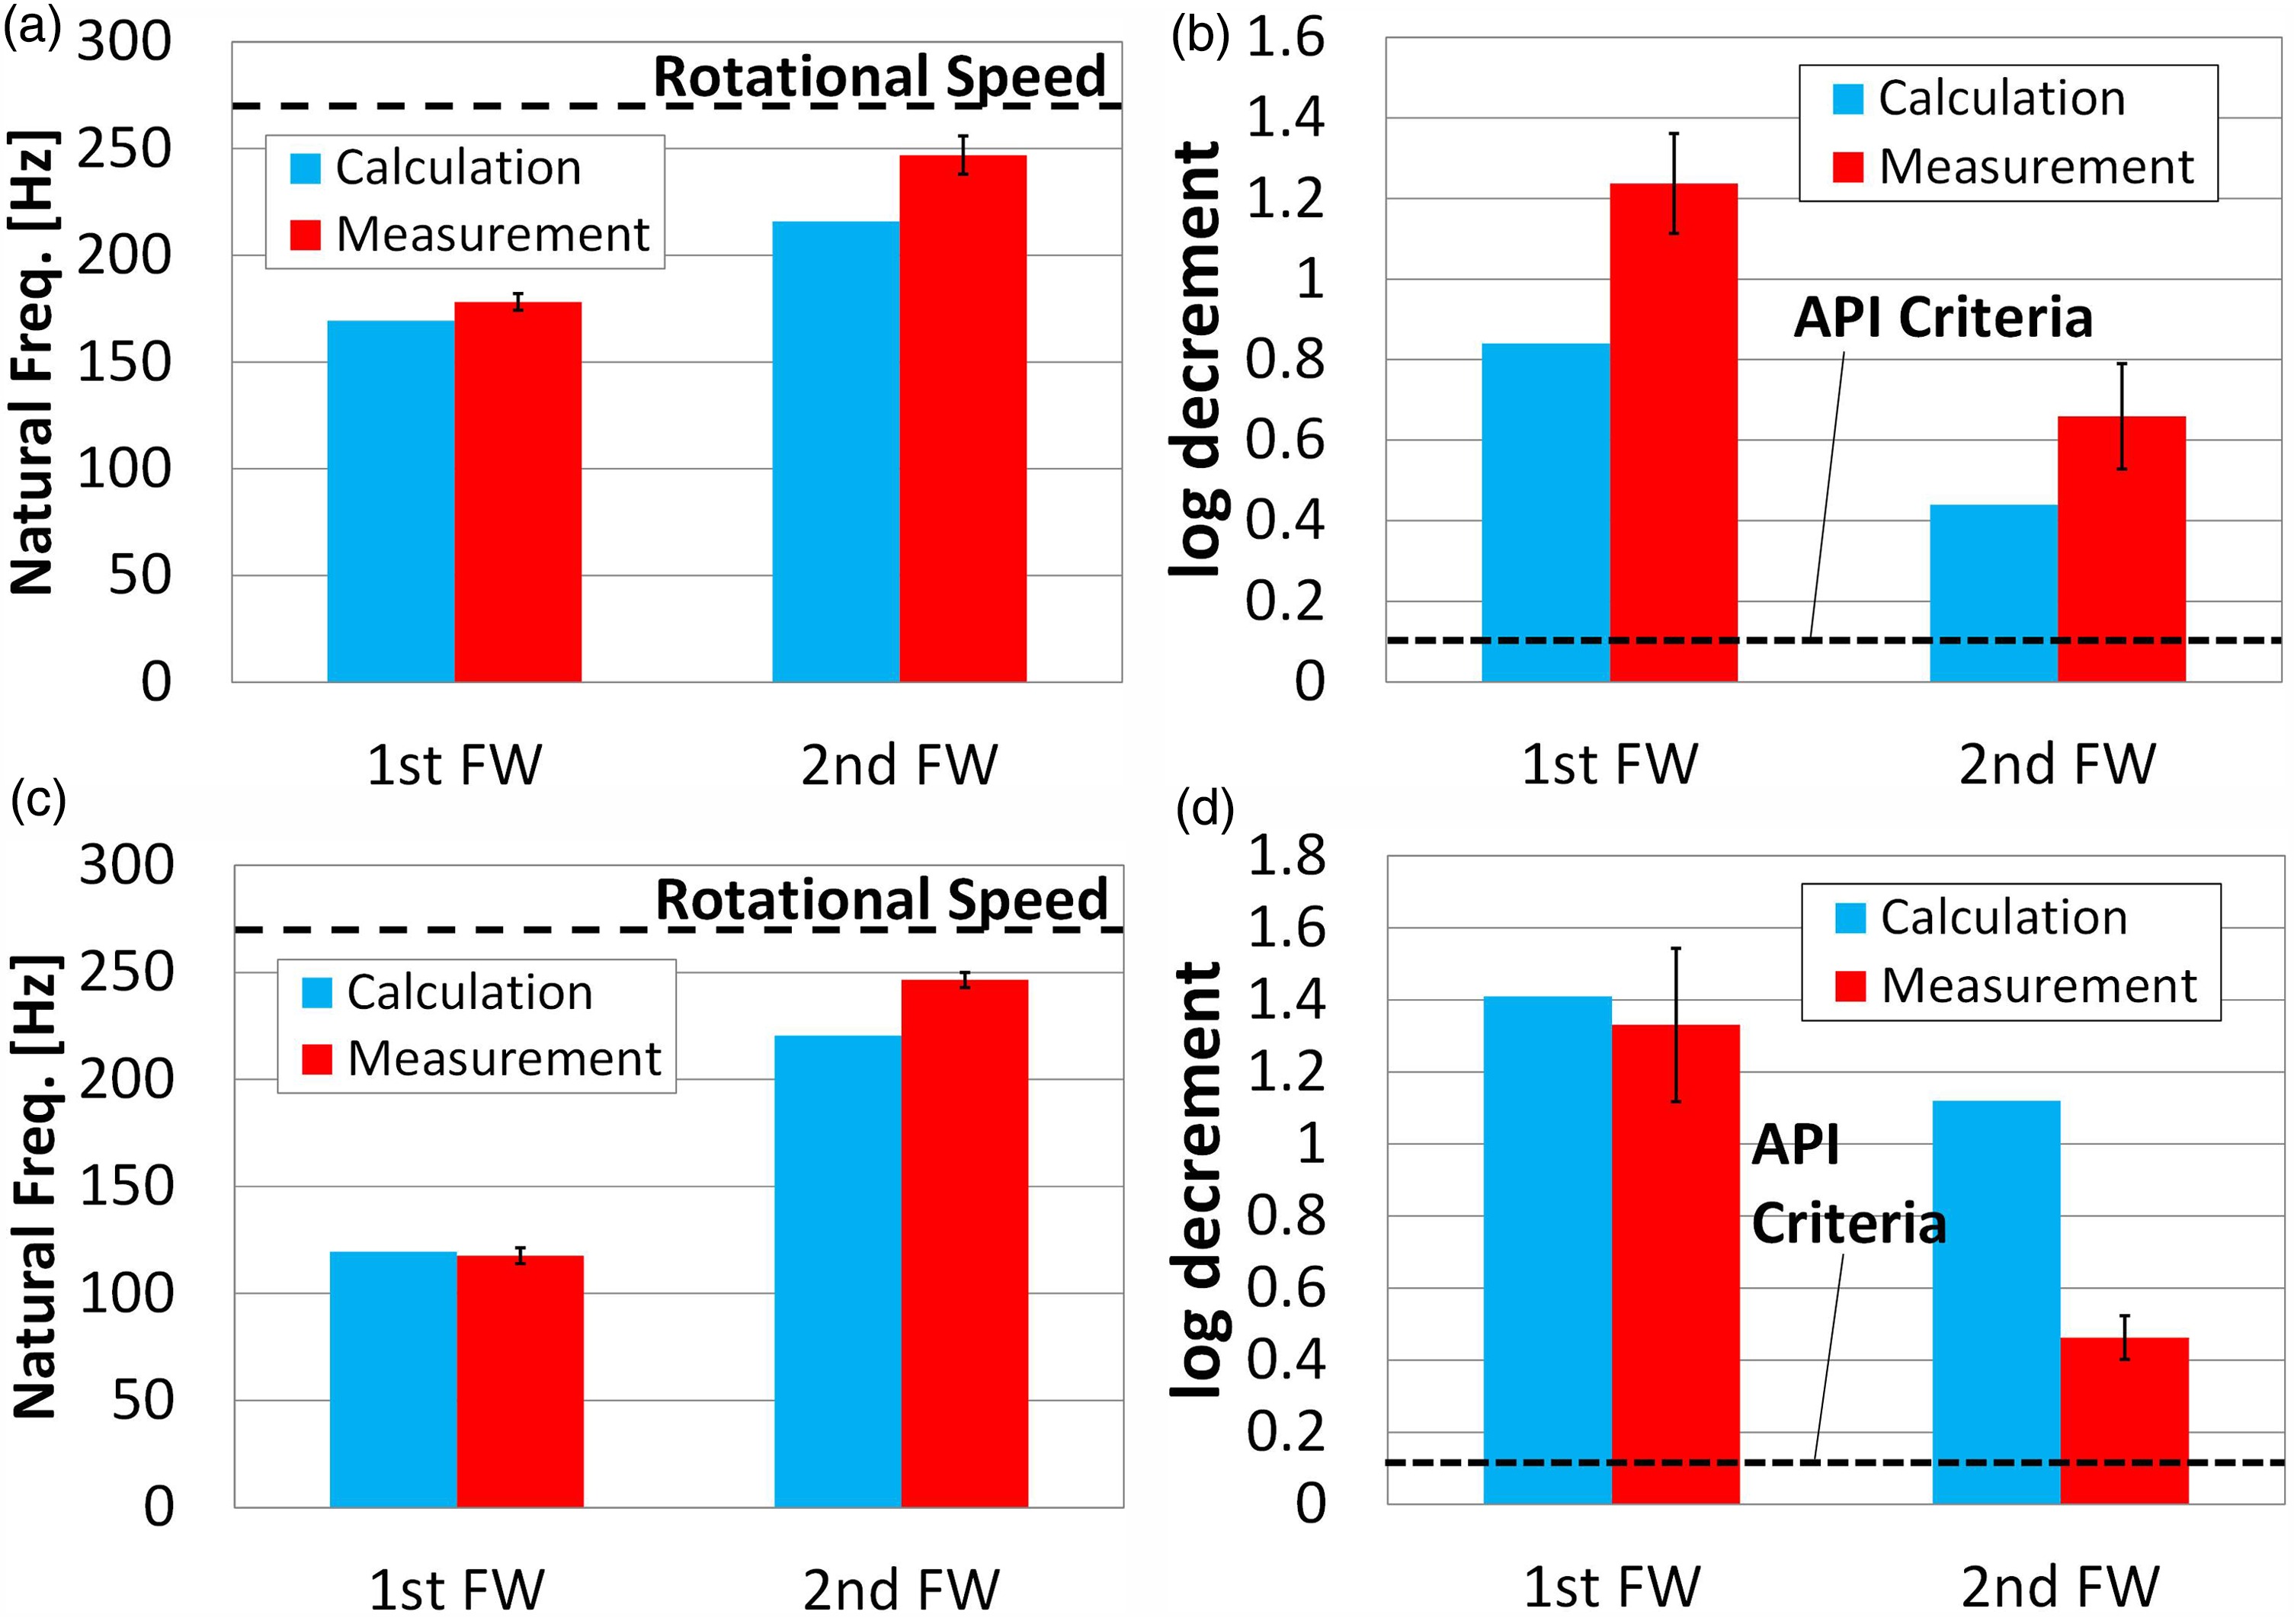
Table 4.
Measurement and calculation results of dynamic characteristics of rotor (Rated pressure 20 MPaG).
| Natural frequency [Hz] | Log decrements | ||||
|---|---|---|---|---|---|
| 1st FW | 2nd FW | 1st FW | 2nd FW | ||
| TPJB | Calculation | 169.4 | 215.8 | 0.84 | 0.44 |
| Measurement | 178.2 | 246.9 | 1.24 | 0.66 | |
| ISFD | Calculation | 119.5 | 220.4 | 1.41 | 1.12 |
| Measurement | 117.6 | 246.4 | 1.33 | 0.46 | |
Figure 11c also suggests good agreement with calculated natural frequencies and the measured values. In particular, the first forward natural frequency (120 Hz) of rotor with ISFD bearing is much lower than 180 Hz compared with TPJB (without ISFD) as shown in Figure 11a. The calculated natural frequencies are close to the measured values, it proves the proper rotor design and prediction techniques of rotordynamics. In Figure 11d, the calculated first forward mode log decrement well corresponds with the measured value. However, the measured second forward mode does not reach the predicted damping performance. The discrepancy of log decrement is possibly caused by the lack of bearing damping performance, because the tested pinion rotor and operating condition are same as the excitation test with standard TPJB bearing. For example, if oil film cavitation occurs in ISFD, it may significantly decrease the damping coefficient. Since it sufficiently exceeds the requirements of API, these results clarifies that the rotor maintains enough stability under the rated pressure operation. In addition, the measurement uncertainties of natural frequency are less than 5% as shown in Figure 11. The uncertainties of log decrement are at least 10% to 20% that is larger than natural frequency uncertainties.
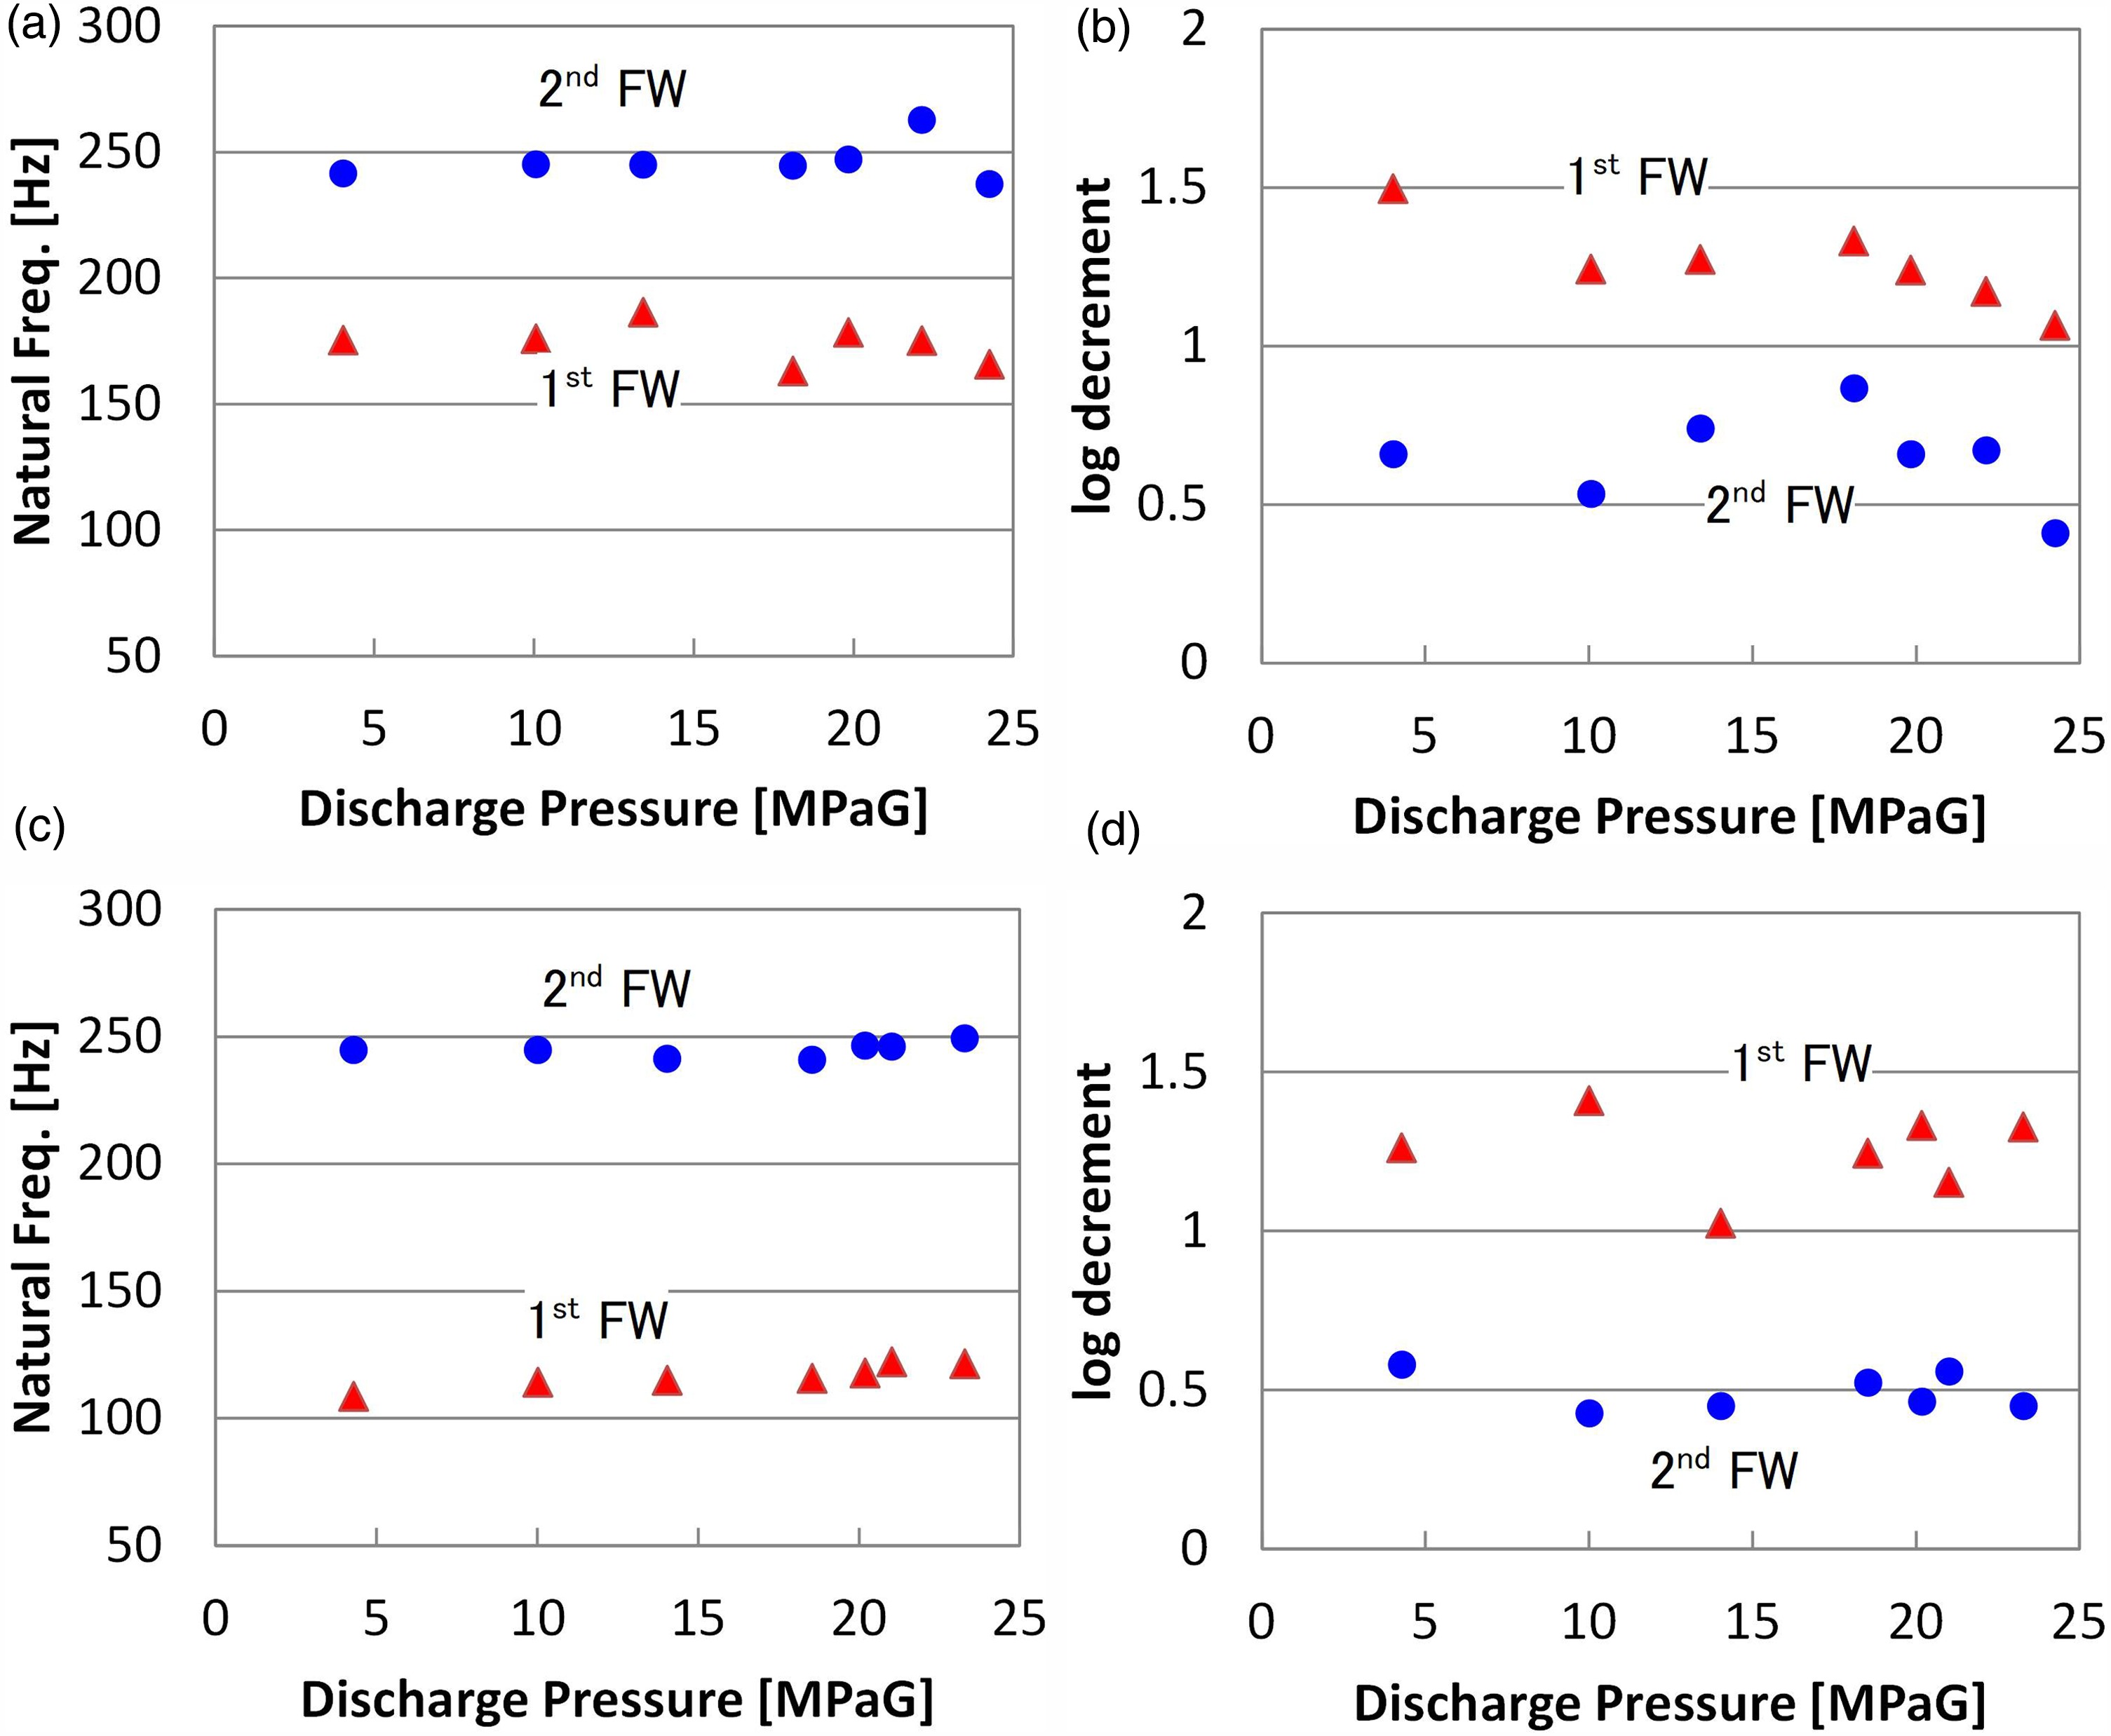
The operating pressure dependency of rotor dynamic characteristics
Figure 12 describes the behaviour of measured rotor dynamic characteristics versus the change in discharge pressure. Figure 12a and b are for TPJB whereas Figure 12c and d are for the journal bearings with ISFD showing natural frequency and log decrement. As for natural frequency, it does not change significantly depending on the discharge pressure as shown in Figure 12a, whereas the log decrements tends to decrease as the discharge pressure increases as shown in Figure 12b. It still maintains much higher log decrement than 0.1 at a rated pressure of 20 MPaG. Figure 12c shows the rotor natural frequency in case of ISFD bearing, which indicates lower first mode natural frequency than that without ISFD case. In Figure 12d, the second forward mode log decrement of ISFD somehow does not increase compared to TPJB. In addition, there is no deterioration of log decrements with increase in discharge pressure and keeps sufficient stability up to maximum discharge pressure. These results substantiate the validity of rotor stability design in this development.
Figure 12.
Measured Natural Frequency and log decrement vs Discharge Pressure. (a) Measured Natural Frequency vs Discharge Pressure (TPJB). (b) Measured log decrement vs Discharge Pressure (TPJB). c) Measured Natural Frequency vs Discharge Pressure (ISFD Bearing). (d) Measured log decrement vs Discharge Pressure (ISFD Bearing).
Dynamic blade stress evaluation of open impellers using blade vibration measurement
Justification of Blade Vibration measurement
The impeller, which is a main part of the centrifugal compressor, is exposed not only to the mean stress due to centrifugal force, but also to dynamic stress caused by compressed gas flow. It is considered that a large dynamic force acts on the impeller especially under high pressure condition, so it is very important to confirm the mechanical strength reliability of the impeller blades in actual compressor operation. The prototype compressor has five impellers, in which 7th and 8th stage impellers are covered type, whereas 4th, 5th and 6th stage impellers are open type. The open impeller consists of an axisymmetric disk and blades without an impeller shroud cover, and there is a possibility that large dynamic stress may occur when each blade tip vibrates greatly. Therefore, the blade vibrations of 5th and 6th stage impellers were measured and the dynamic blade stress was evaluated.
Dynamic blade stress estimation method using blade vibration measurement and FEM analysis
Dynamic stress measurement on the blade surface using strain gauges has been conventionally applied to evaluate the mechanical strength reliability of impellers. Although this method can measure the strain directly related to the stress, it is necessary to mount strain gauges with wirings on the blade surfaces and to install signal communication devices such as a telemetry system or a slip ring to a rotating part. Alternatively, there is a blade vibration measurement (BVM, so-called blade tip-timing measurement) method using a non-contact displacement sensor to easily measure the blade vibration behaviour. This method has been applied to axial flow type large gas turbines and steam turbines and it doesn’t require installing sensors to the rotating part. The authors have applied BVM method to industrial centrifugal compressors and evaluated the dynamic blade stress. The dynamic blade stress estimated by blade vibration measurement was successfully validated with the data measured simultaneously by strain gauges (Iwata et al., 2017).
The BVM system measures blade passing time via non-contact sensors such as optical probes or eddy current probes. Blade vibration amplitudes and frequencies are analysed based on the deviation of blade passing time per rotation. The non-contact sensors are installed in stationary casing, and their output analogue signals of blade tip passing are triggered to generate pulses. When the blade tip oscillates, the time difference between the tip passing timing and non-oscillating pulse signal for shaft rotational speed detection changes, and the blade vibration is analysed based on the deviation of the passing timing for each rotation. In this measurement, the blade tip passing speed was about 126 m/s at maximum, and the high-frequency of 80 MHz clock was used for precise timing of the blade passing pulse (i.e., vibration measurement resolution of about 1.6 µm).
As shown in Figure 13, optical non-contact displacement sensors were installed to 5th and 6th stage casings, and the vibration displacement of the impeller blade tips was measured. The vibration of all blades can be measured by BVM system. Six sensors were arranged in a circumferential direction for each impeller to improve the accuracy in analysing the amplitude and frequency.
When the vibration mode shape of impeller changes, the peak amplitude of dynamic stress and the location where it occurs are different even if the vibration displacement of the blade tip is the same. Therefore, it is important not only to measure tip vibration amplitude, but also to specify the vibration mode. The relationship between displacement and stress in a specific vibratory mode can be obtained by FEM modal analysis. When the vibration mode shape and the impeller blade tip amplitude can be specified by BVM, it is possible to estimate the dynamic stress using displacement versus stress relationship in the corresponding vibration mode. In order to reduce the estimation error, it is preferable to measure the tip vibration where the amplitude of vibration is the largest.
Evaluation of dynamic blade stress at blade resonance
The blade vibration of 5th and 6th stage impellers were measured during start up, coast-down operations under low pressure condition and during deceleration operations under low / medium / high pressure conditions. The discharge pressure at 5th stage during deceleration operation was 0.2 / 2.7 / 5.3 MPaA under low / medium / high pressure conditions, respectively.
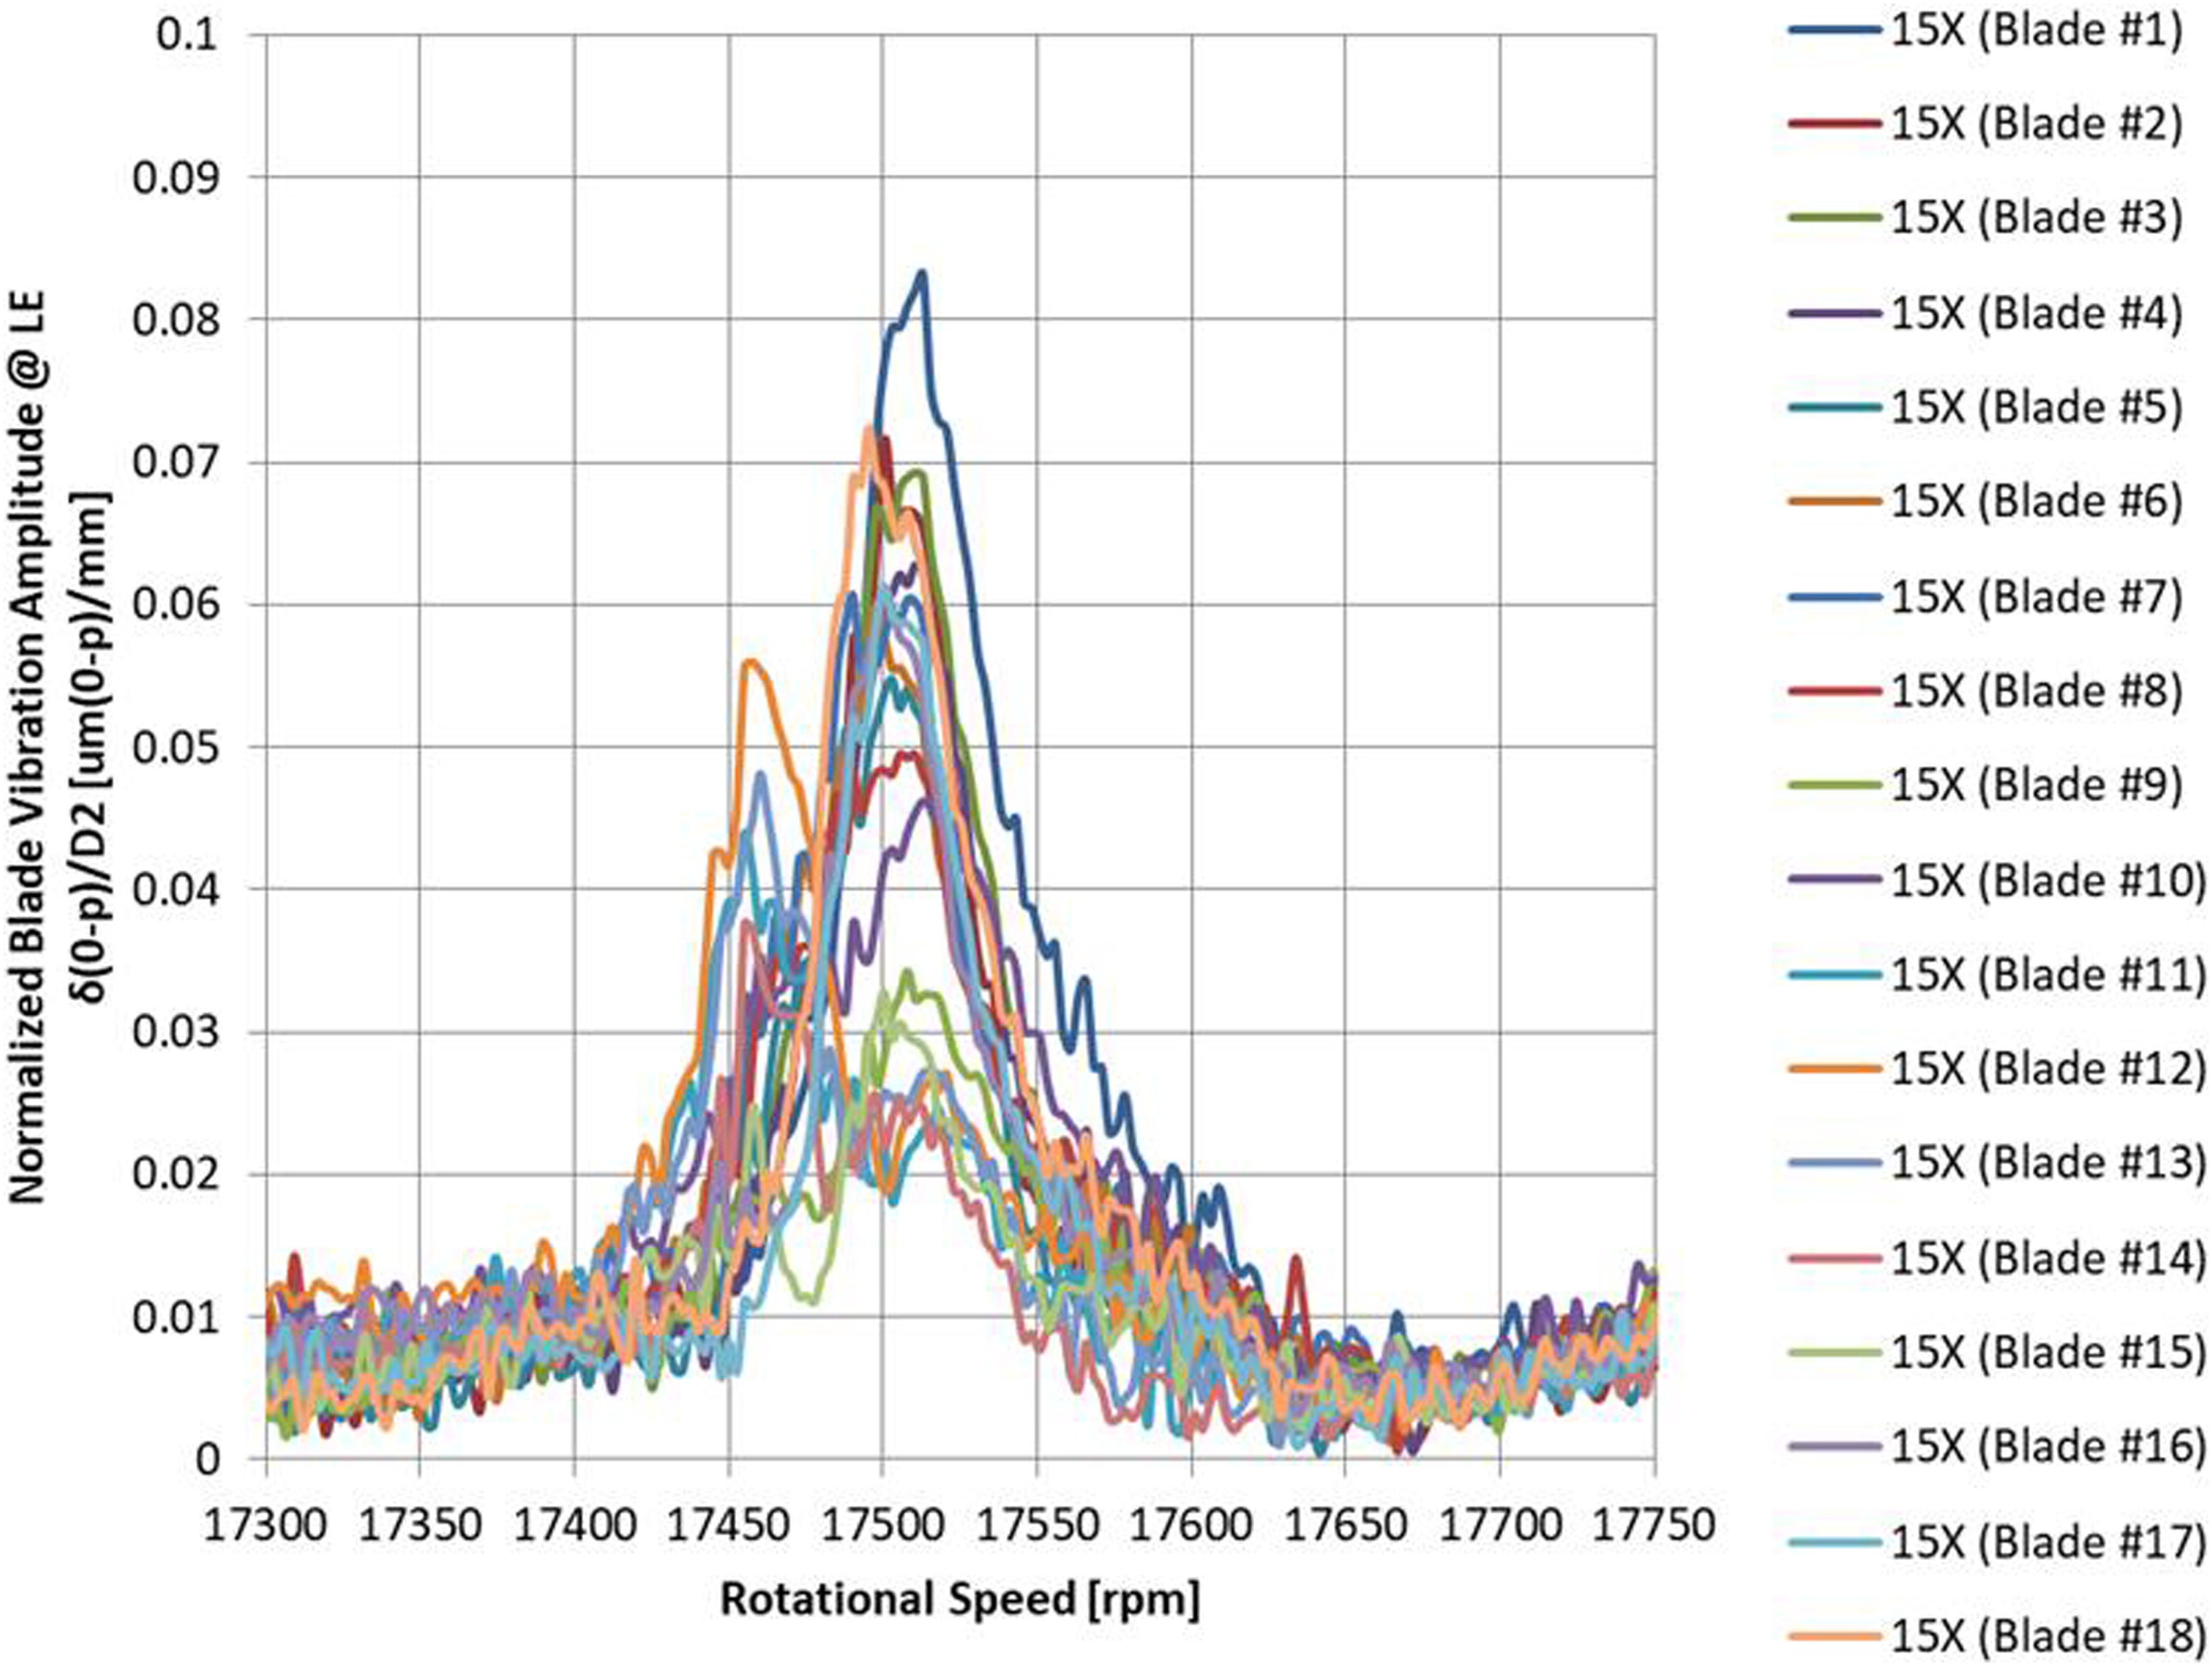
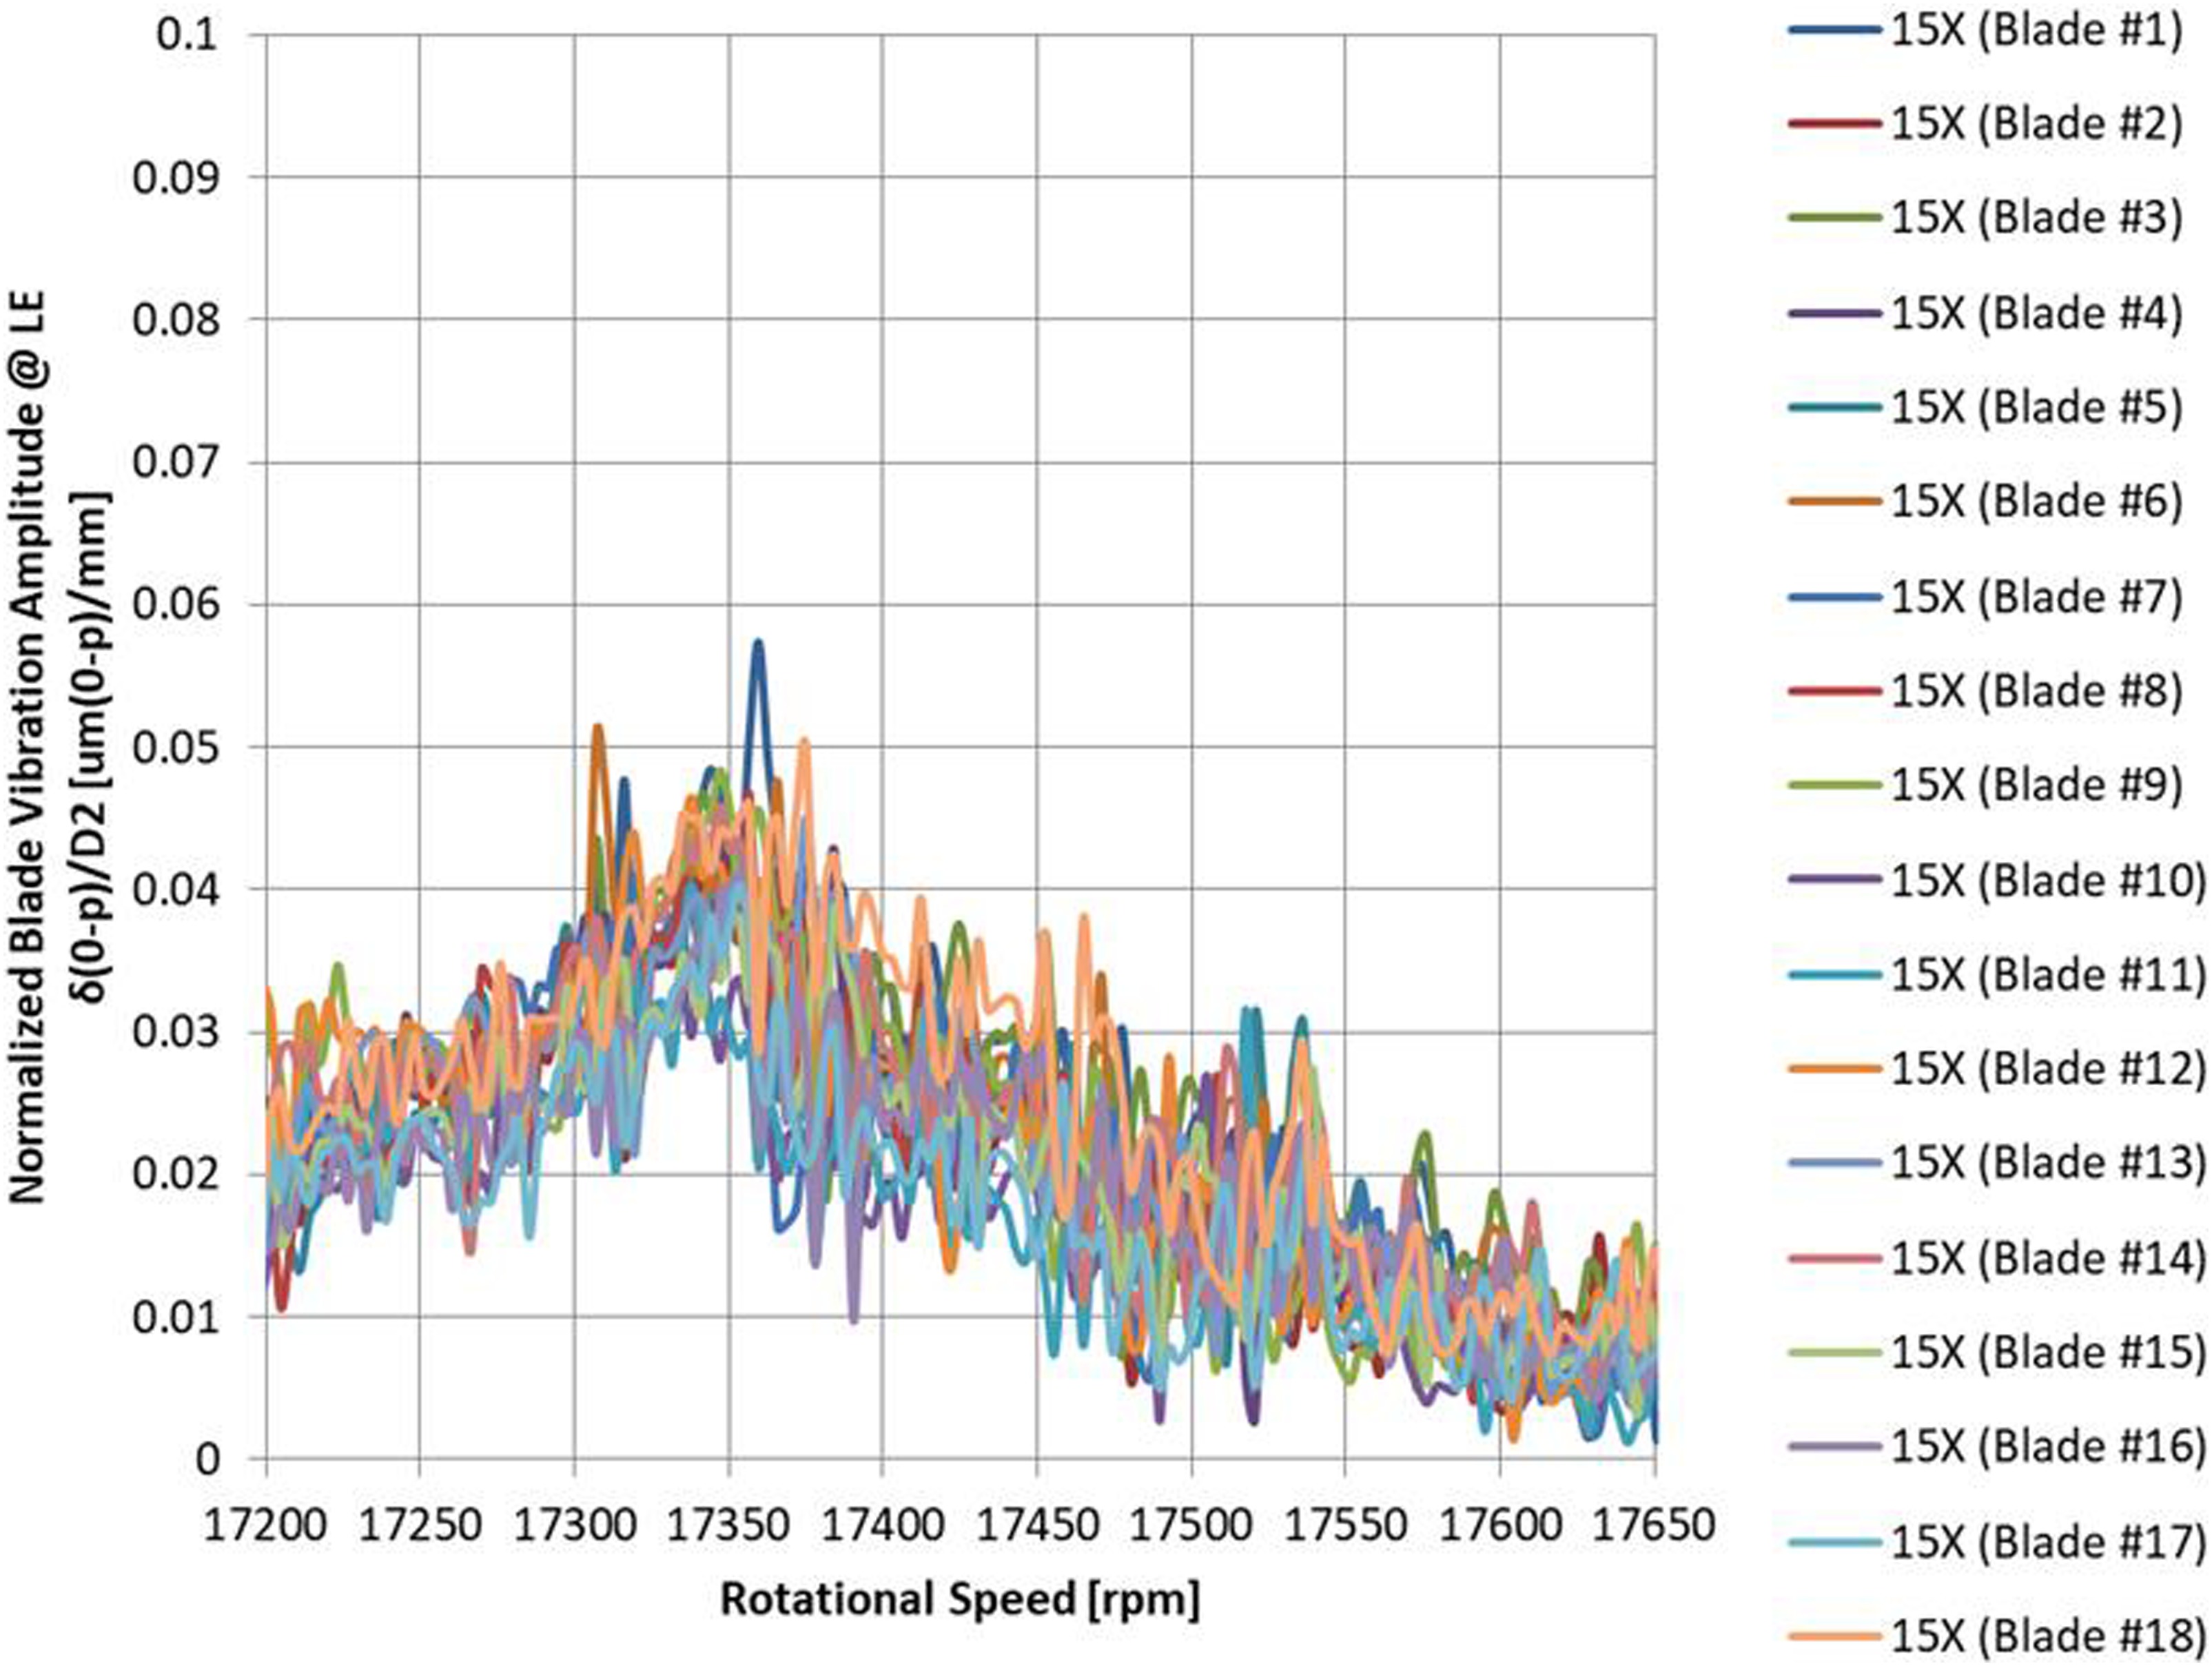
Figure 14 shows vibration response of all blades 5th stage impeller during deceleration operations under low pressure condition. BM1 (Blade Mode 1) resonance was observed at around 17,500 rpm. The frequency of this resonance was around 4,375 Hz, which was 15 times (=diffuser vane number) of rotational speed. Figure 15 shows the blade vibration response under medium pressure operation. BM1 resonance was observed at around 17,360 rpm. The peak amplitude at medium pressure was observed to be smaller than low pressure and also the peak frequency shifts a bit lower compared with low pressure operation. On the other hand, BM1 resonance was not clearly confirmed at high pressure operation. The maximum dynamic stress at low pressure was estimated to be 3 percent of blade material strength using the measured blade tip amplitudes and FEM results. It was found that the dynamic stress of 5th stage impeller was sufficiently lower compared with material strength. For 6th stage impeller, the response peak was not clearly observed and the natural frequency itself could not be measured under any operating conditions. Therefore, it was confirmed that the blade stress at resonance was sufficiently small for 6th stage impeller also. From the above, it was confirmed that the resonance stresses for 5th and 6th stage impellers were sufficiently small.
Conclusions
Comprehensive tests were conducted for the main component as well as the complete machine and experimentally determined not only general performances such as overall aerodynamics and rotor vibrations but also usually unknown parameters. By implementing state-of-the-art techniques, the unknown parameters like rotor natural frequency and log decrement, impeller blade vibratory stress could be accurately measured. The overall performance result met the expectations and the measurements had quantitatively verified the mechanical reliability of compressor. As an outcome of series of experimental evaluations it is concluded that this integrally geared CO2 centrifugal compressor is highly efficient with improved reliability can be used for high pressure applications, which will also contribute to energy saving and global environmental conservation.