
Introduction
Unsteady turbulent high-speed compressible flows often give rise to complex aeroelasticity phenomena by influencing the dynamic behaviour of the structures on which they act. Under certain conditions, the energy transfer from the fluid to the structure can cause excessive vibration levels and structural integrity may be compromised. The problem is particularly severe for gas turbines where virtually all blade rows are susceptible to aeroelasticity effects either by inherent self-induced motion (flutter and buffet) or by response to aerodynamic flow distortions and blade wakes (forced response). The most complex and the least understood aeroelasticity phenomena occur in multi-stage core compressors, the subject of this paper, because of their wide operating envelope. During engine development programmes, costly structural failures are known to occur because of a mixture of aeroelastic instabilities such as acoustic resonance, flutter, forced response, rotating stall, surge, etc.
As turbomachinery blade aerofoils are thinned to improve performance, reduce weight and reduce cost, aerodynamic and aeroelastic challenges become more predominant. Moreover, the use of titanium blade-integrated-disks (blisks) is becoming more common in modern civil aero-engine designs. Such structures have a very low mechanical damping in contrast to traditional bladed-disk assemblies. For such structures, the main source of damping to the blade comes from the air flow, which highlights the importance of accurate prediction of aerodynamic damping. Aeroelastic instabilities, such as flutter and non-synchronous vibrations, may also couple with aerodynamic flow disruptions, driven by the emergence of stall cells or flow reversal during surge. Moreover, large magnitude blade deflection induced by high loading during surge can cause rubbing between blade tip and the casing, or more destructively the contact between rotor and stator blades. It is thus important to be able to predict the instabilities at such difficult flow conditions at the early design or testing phases of engine development. Aerodynamic and aeroelastic experimental tests at such conditions, especially for multi-stage high speed machines, are usually very expensive both in time and financial cost. Computational methods such as 3D unsteady Reynolds-averaged Navier-Stokes (URANS) have shown to be capable of providing a more informative understanding of the flow physics in such conditions with greatly reduced cost.
This paper reviews the work on aeroelastic instabilities in multi-stage core compressors (driven by stall, surge, forced response and flutter) carried out Rolls-Royce Vibration University Technology Centre (VUTC) at Imperial College over the past 20 years. In the following sections, the physical phenomena triggering compressor instability and possible numerical approaches for modelling them are highlighted for each case.
Flow solver
The CFD code used for this work is AU3D, which is a three-dimensional, time-accurate, viscous, finite-volume compressible flow solver. For detailed information the reader is referred to Sayma et al. (2000). The unsteady flow cases are computed as URANS, with the basic assumption that the frequencies of interest are sufficiently far away from the frequencies of turbulent flow structures. The flow variables are represented on the nodes of a generic unstructured grid and numerical fluxes are computed along the edges of the grid. The numerical fluxes are evaluated using Roe’s flux vector difference splitting to provide matrix artificial dissipation in a Jameson-Schmidt-Turkel (JST) scheme. The overall solution method is implicit, with second-order accuracy in space and time. For steady-state flow computations, the solution is advanced in pseudo-time using local time stepping, while dual time stepping is used for unsteady computations to preserve stability at high Courant numbers. For steady-state flow calculations, solution acceleration techniques, such as residual smoothing and local time stepping are employed. The current computations use the one-equation Spalart-Allmaras turbulence model proposed by Spalart and Allmaras (1992). The parameters in Spalart-Allmaras have been adjusted on previous fans to get good agreement near the stability limit; the parameters are held constant in all the present work. Some recent publications regarding the improvements can be found in Lee et al. (2018) and Moreno et al. (2019). The resulting CFD code has been used over the past 20 years for flows at off-design conditions with a good degree of success; see, for example, Vahdati et al. (2011), Choi et al. (2012) and Dodds and Vahdati (2015).
Rotating stall induced vibration
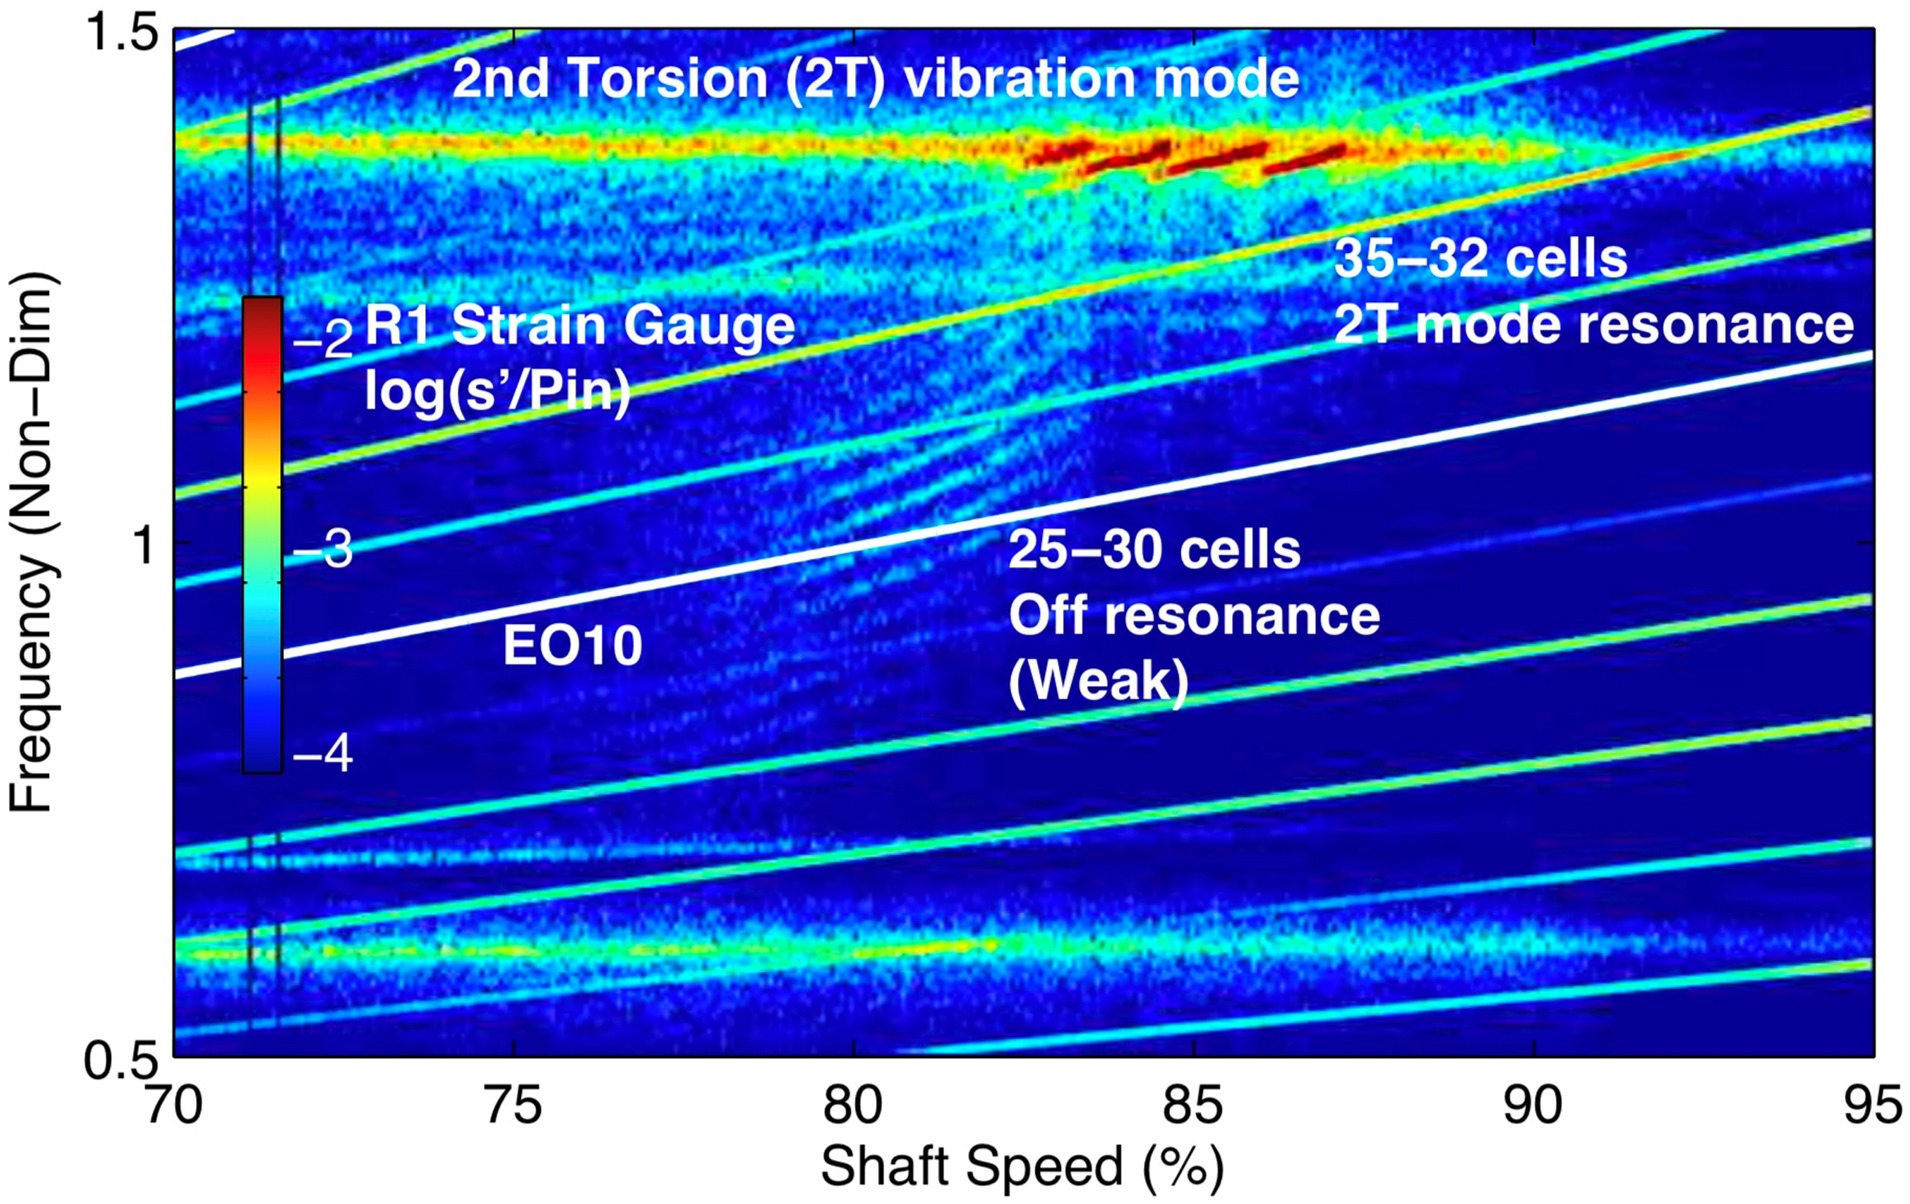
This section presents the aeroelastic instabilities due to part-span rotating stall in a high-speed compressor. As described by Day et al. (1978), part-span rotating stall usually occurs at part-speed as the stability limit of one or more blade rows is reached. In this state the compressor is operating in stable rotating stall and the flow structure is believed to follow the form described by Emmons et al. (1955). This behaviour is typical of part-span “progressive” stall, whereby multiple stall cells are present local to the hub or, more commonly, the tip region, and can be confined to a limited number of blade rows. In fully developed rotating stall, the overall flow through the compressor is constant in time, with the stall cells redistributing the flow around the annulus. Although this type of rotating stall may not result in surge or massive loss of power, it can cause excessive vibration and noise. From an industrial perspective, it is important to understand the factors that influence changes in stall characteristics as it may result in moving from a safe operating regime to one that causes rotor blade failure. These effects are normally assessed by engine strain gauge tests, which are used to map out stall boundaries. An example of the rotor strain gauge spectrum, extracted from Dodds (2016), is shown in Figure 1, for which the interaction with the torsional mode can be seen clearly. Between 77–83% speed a multiple mode pattern of 25–30 lobes can be identified. The presence of multiple modes is attributed to spatial and temporal non-uniformity in the stall cell pattern. Whilst this non-uniform pattern persists until 83% speed the torsional mode amplitude is weak. However, above 83% speed, the stall bands jump to be dominant at a higher frequency because they can be observed to interact with the second torsion vibration mode (which appears as a near horizontal line in Figure 1. In total 4 “streaks” can be observed to cross this mode, corresponding to a 35 cell pattern followed by 34, 33 and 32 cells. A key point here is that below 83% speed the stall phenomenon occupies a wide frequency range and is incoherent in the sense that multiple modes appear to coexist. At higher speeds, the stall phenomenon appears to be constrained to a fixed frequency in the rotating frame aligned exactly with the torsional mode. It is seen from this plot that when the frequency of rotating stall is close to the natural frequency of a blade vibration mode, the two frequencies can “lock-in” giving rise to high vibration levels. Moreover, the result shows that a spatial “lock-in” event where the circumferential order of the part-span rotating stall shifts to match that induced by the vibration mode. This type of interaction has been reported in recent experimental and computational investigations by Kielb et al. (2003) and Holzinger et al. (2016).
Figure 1.
Strain gauge showing evidence of rotating stall coupling with the second torsion mode, from Dodds (2016).
For such flows, the unsteady frequency (which determines the vibration and the noise levels) is determined from the number and the speed of rotating cells, and therefore, particular attention should be paid to the prediction of the stall pattern. However, due to the high cost of these tests and the limited scope for varying engine configuration and operation, efficient computational methods that minimise rig and engine testing become vital. The numerical modelling of such a situation remains a formidable challenge as the analysis must be able to represent accurately not only the aerodynamic and structural properties of a large number of blade rows but also the interactions through these.
In the work by Vahdati et al. (2006) and Dodds et al. (2015), a methodology was developed which can predict the effects of multi-lobe rotating stall on blade vibration levels. Of particular importance is to link the variable-vane scheduling to the number, size, distribution, and speed of rotating stall cells so that the critical modes of vibration can be identified and avoided. To achieve that objective, an eight-stage compressor was chosen where the first three stator blade rows have variable-angle vanes. The domain used for steady state computation is shown in Figure 2. Two vane settings, namely datum-scheduled (DS) and mal-scheduled (MS), were investigated because of the availability of experimental data for these two conditions.
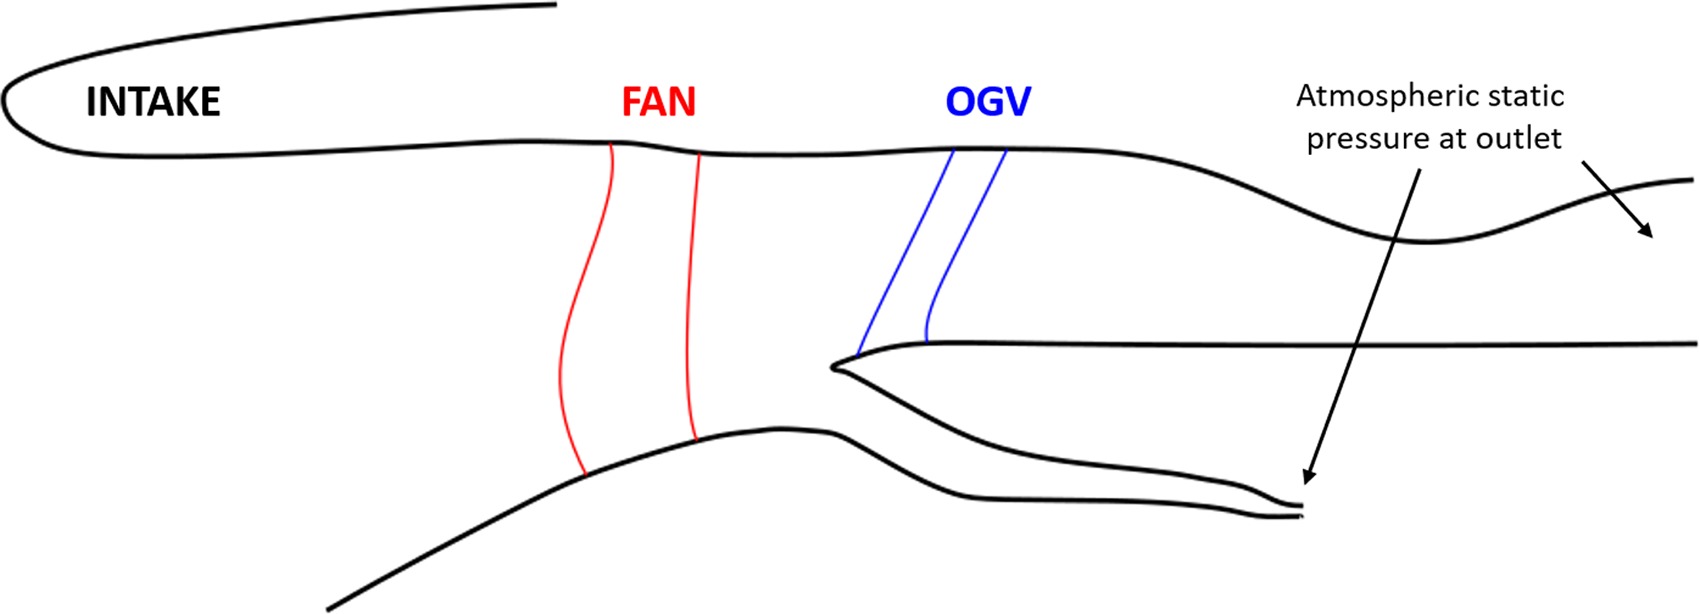
In the steady-flow computations, the entire domain was modelled using a single-passage approach with mixing planes. Mass flow through the bypass and core are controlled by means of nozzle with atmospheric static exit boundary conditions. The steady results showed that the separated flow region on the blades of Rotor 1 has a larger axial and radial extent in the MS case.
For the unsteady computations, the whole annulus of the first nine blade rows of the compressor were modelled, whereas the rest of the compressor as well as the LP domain were modelled using single passages. This approach was adopted to allow circumferentially non-uniform flow disturbances to develop in the full annulus blade rows, which is crucial in the inception and development of rotating stalls. The variation of the static pressure upstream of Rotor 1 after 13 engine rotations is shown in Figure 3. It is seen that the flow looks almost symmetric for the DS case, i.e., no sign of rotating stall. On the contrary, a non-symmetric pattern, i.e. rotating stall, develops for the MS case. The variations of the instantaneous static pressure upstream of Rotor 1 along the circumference at 70% and 90% heights together with the corresponding Fourier components are shown Figure 4a. A close study of these figures reveals the existence of a 12-band rotating stall for the MS case. Moreover, Figure 4a shows that the rotating stall is much stronger at 70% height. The unsteadiness due to rotating stall interacts with the assembly vibration modes, a feature that creates unsteady forcing on the blade. The Fourier components of the unsteady forcing for different nodal diameter (ND) modes arising from the blade 1F mode are shown in Figure 4b. In the event of the two frequencies matching, the response in that mode is estimated to be about 20% of the chord length using a Q-factor damping value of 200, which corresponds to a structural damping loss factor of 0.5%. The above results are in a very good agreement with engine data (not published).
Figure 3.
Instantaneous static pressure upstream of Rotor 1: datum-scheduled (DS) vs mal-schedule (MS).
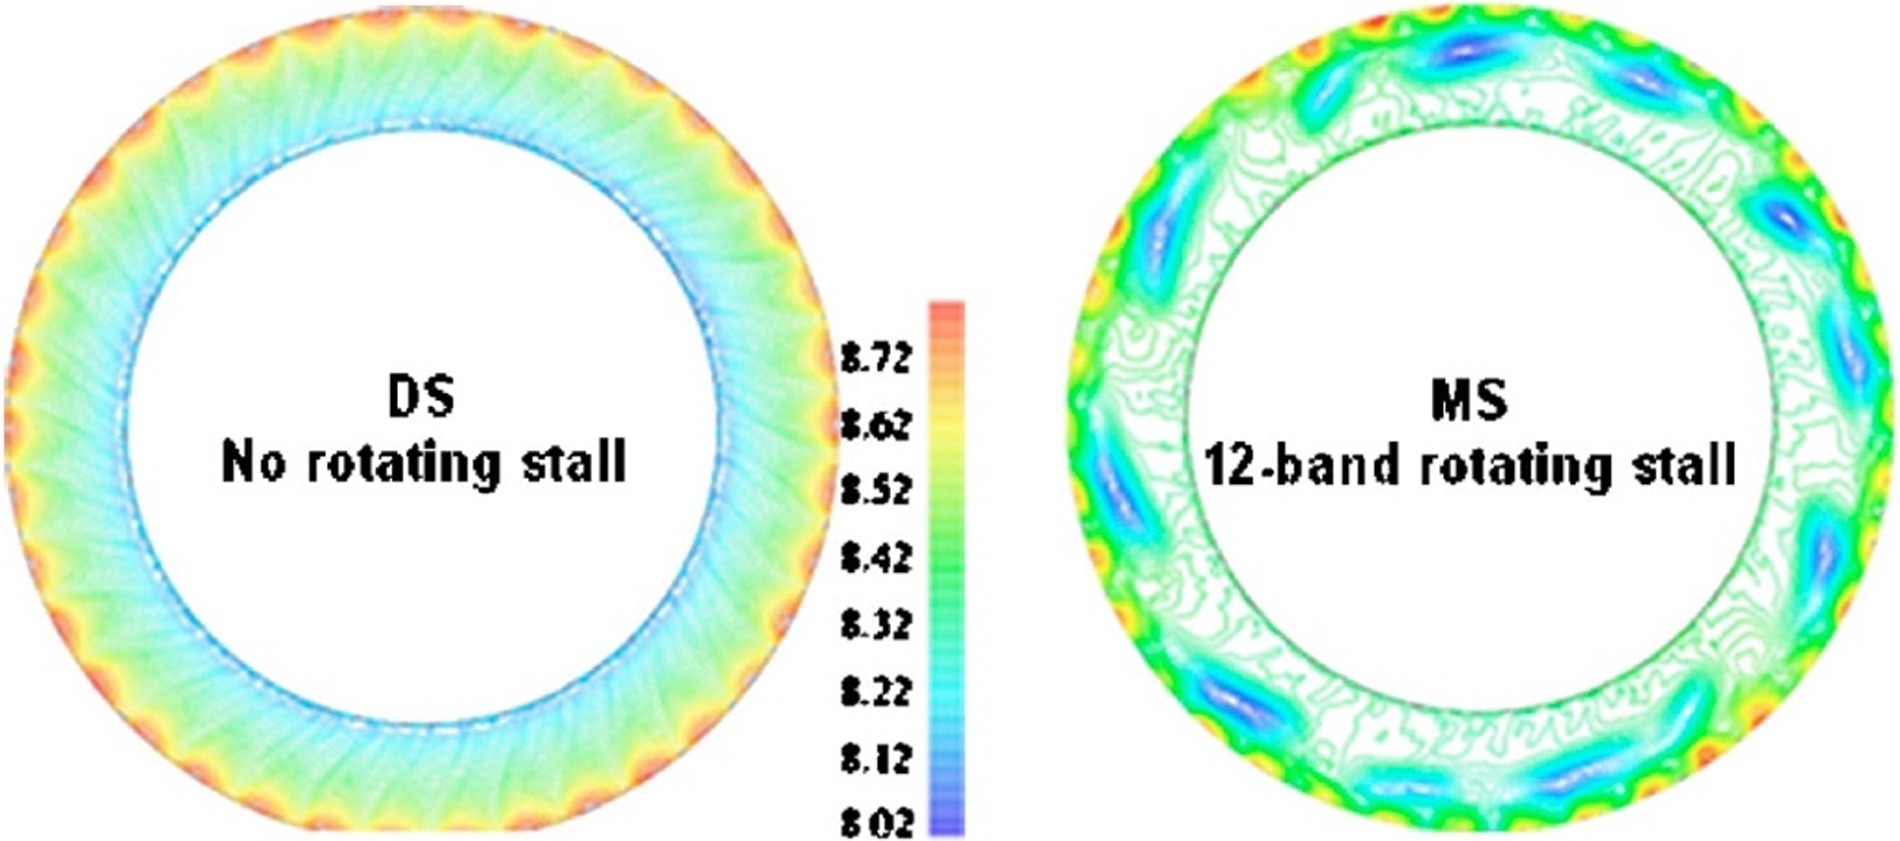
Figure 4.
(a) Static pressure upstream of Rotor 1 and its Fourier components at 70% and 90% height; (b) Fourier components of forcing on the rotor blades.

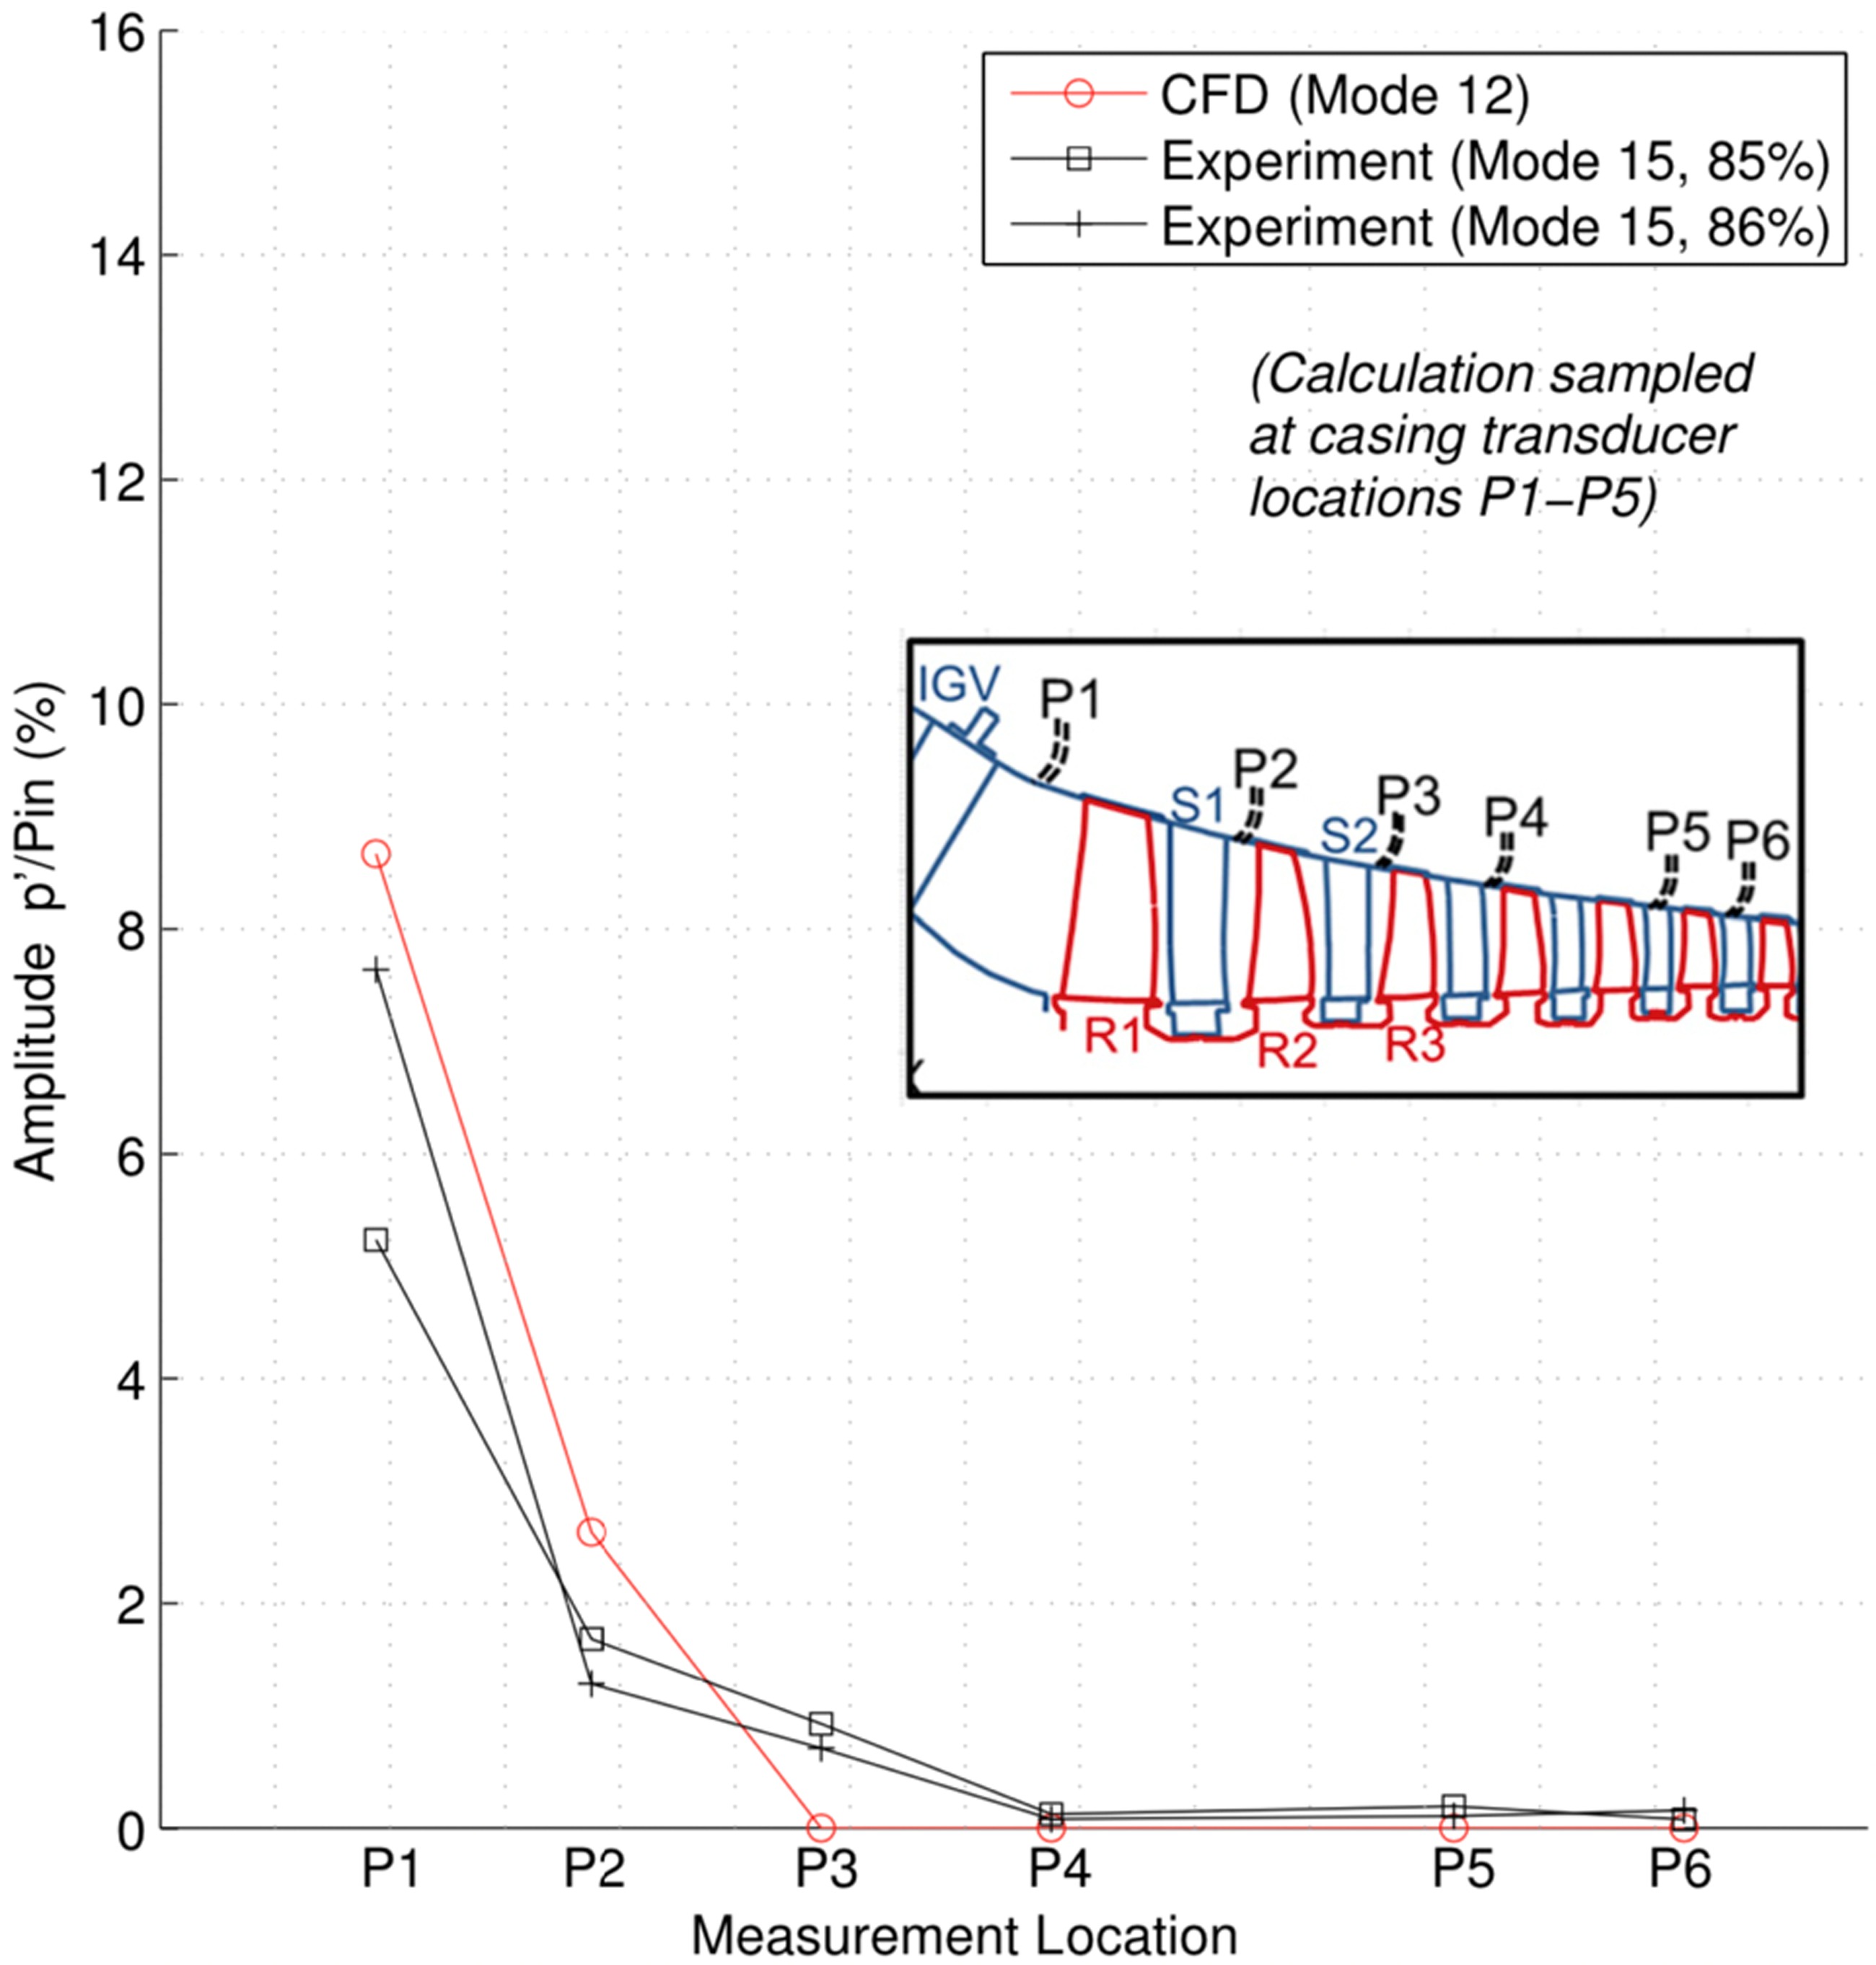
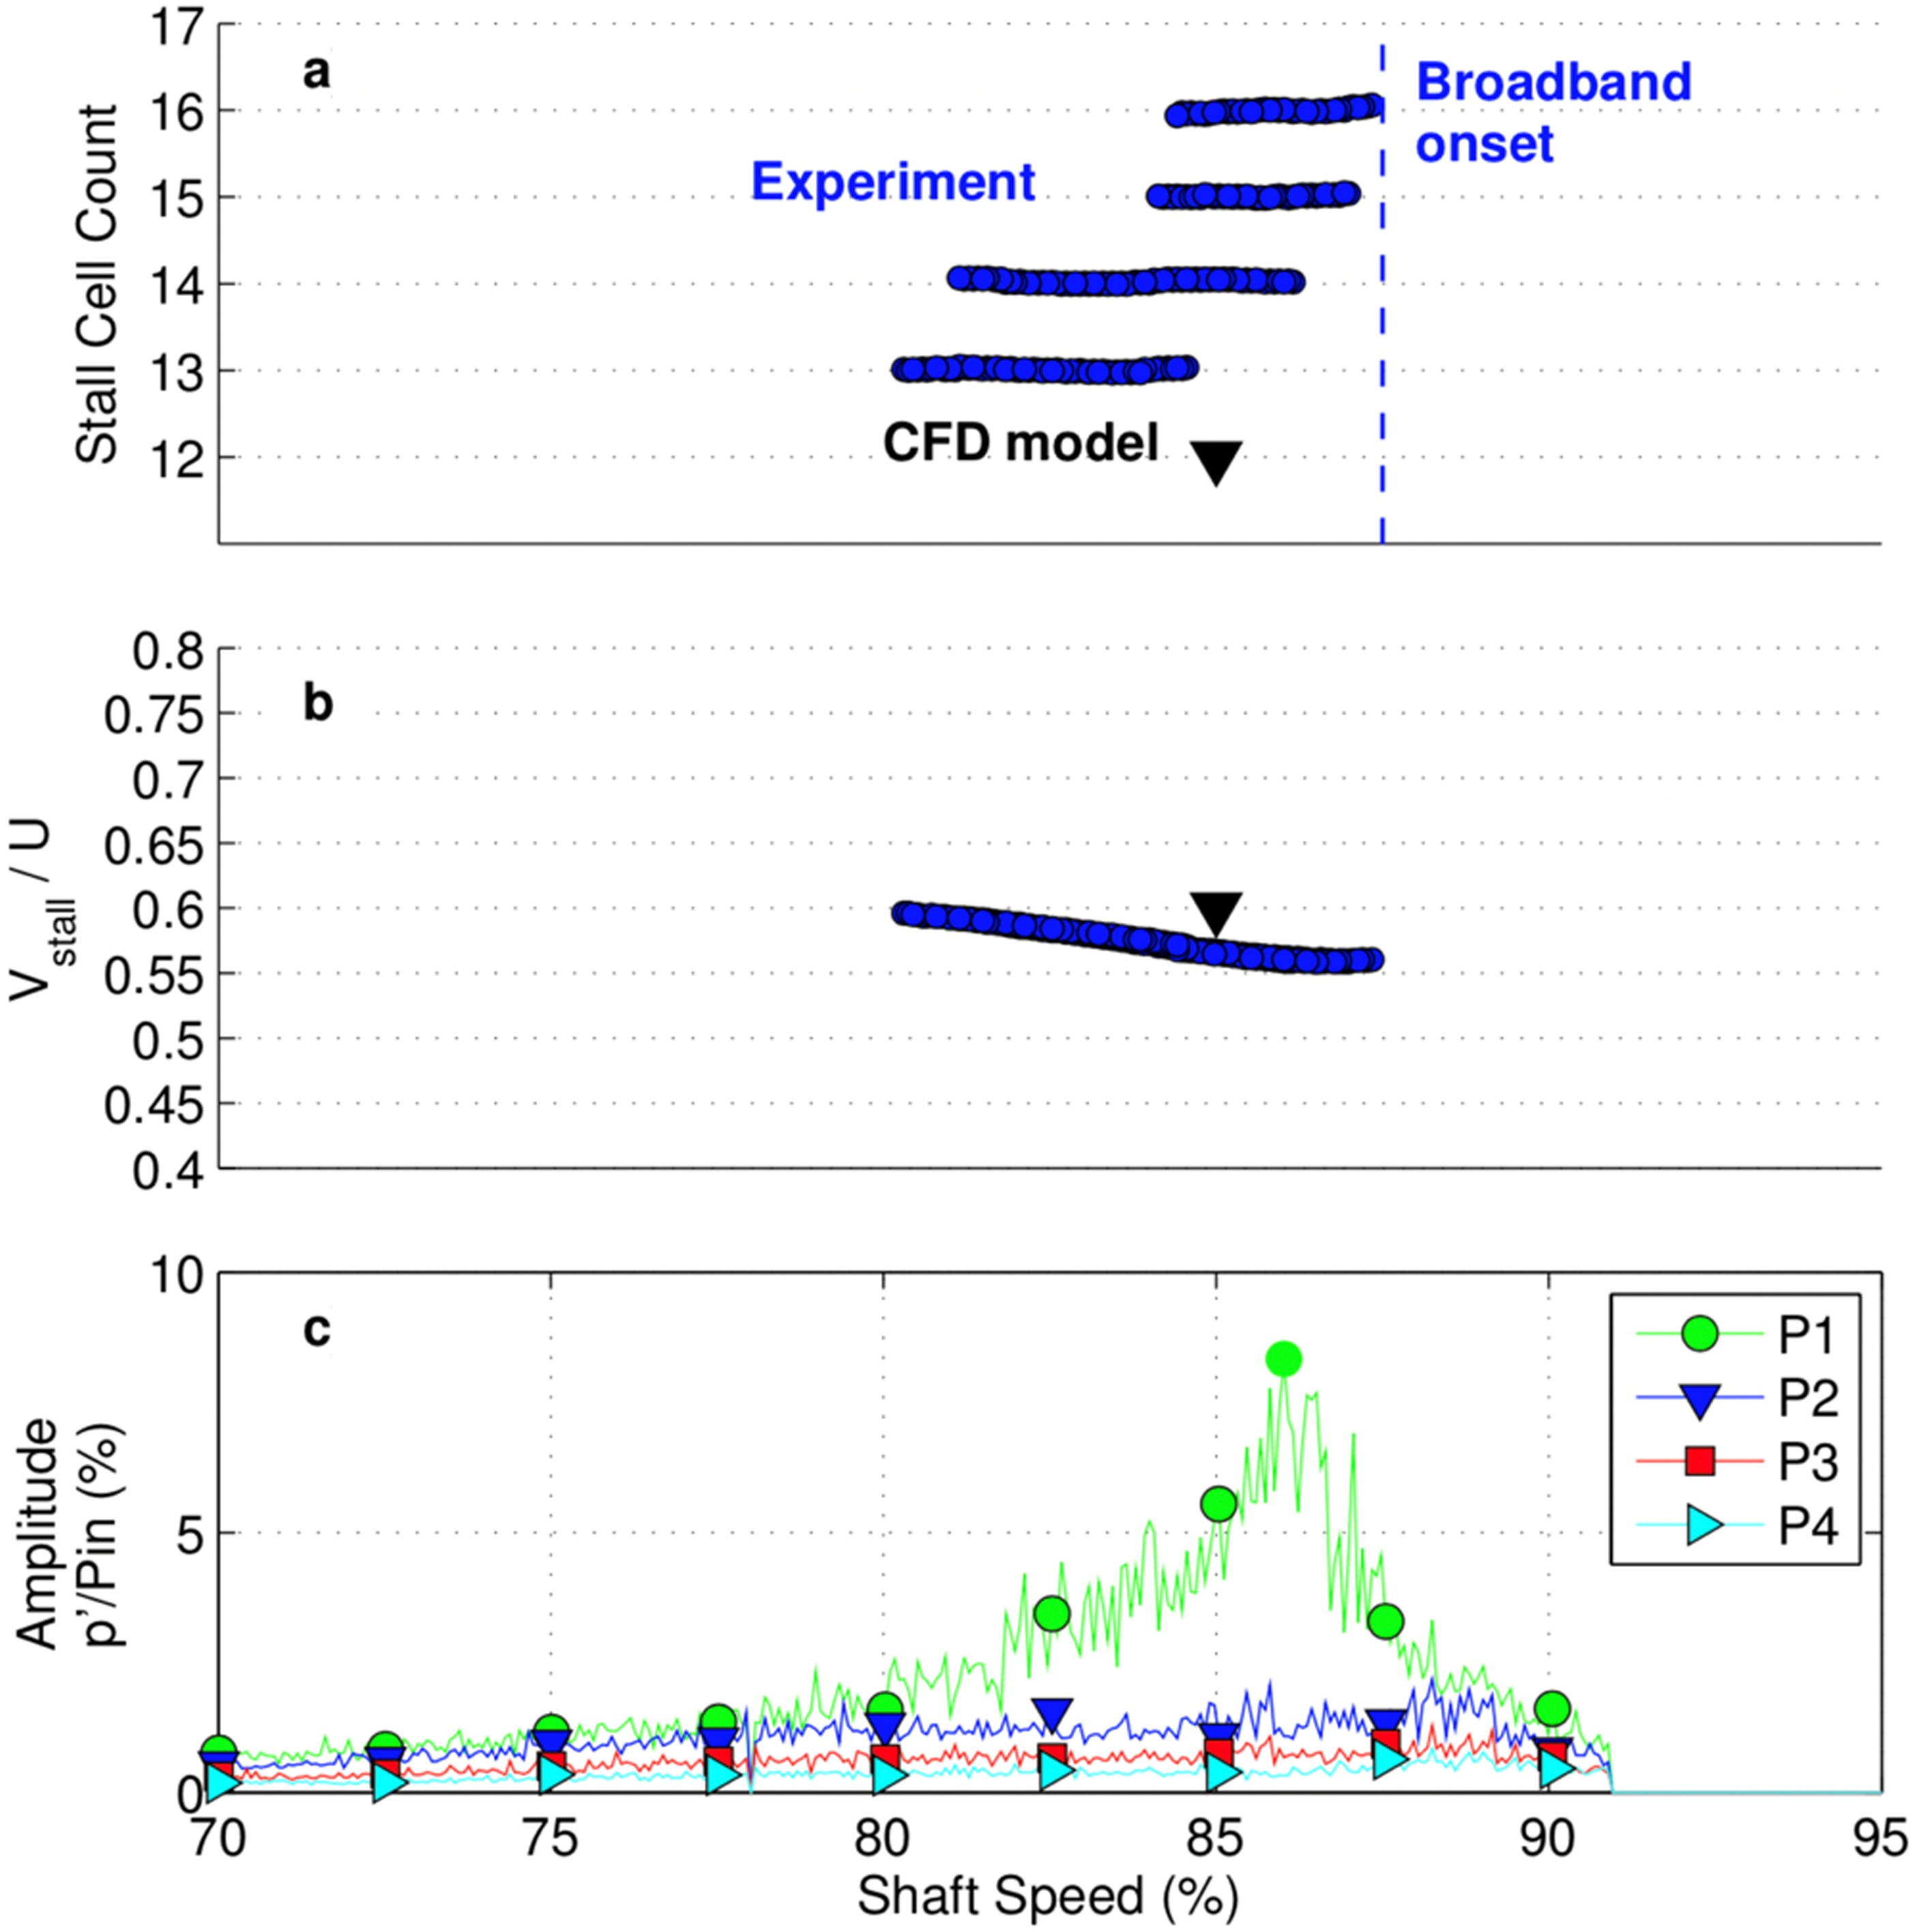
The quality and accuracy of CFD prediction for part-span rotating stall was comprehensively assessed in a subsequent study carried out by Dodds and Vahdati (2015) and Dodds (2016). In this study, unsteady computations were conducted for a similarly designed compressor using the same flow solver and a very similar calculation setup. Stall cells predicted by CFD were examined and compared with experimental measurements. Figure 5 shows the axial distribution of static pressure along the casing of the compressor at a flow condition containing rotating stall near R1 tip. In Figure 5, the amplitude of unsteady pressure (due to rotating stall) obtained from the simulation is compared with experimental data at each measurement location. Both experimental data and simulation results show a sharp peak at station P1, i.e. R1 leading edge. The agreement between experiment and simulation is good, in terms of both the absolute level and axial distribution. Figure 6 shows the comparison in cell count, circumferential propagation speed and pressure amplitude at various compressor speeds. The spatial and temporal non-uniformity in the pattern of stall cells (13–16 cells) is due to the existence of multiple frequency bands in the measurement. The CFD model shows a good agreement with experimental data, with a 12-cell pattern present rotating at 60% of shaft speed. For more information on this subject the reader is referred to Dodds (2016).
Flutter in deep surge
In contrast to part-span rotating stall, surge is a global instability, which involves an axial oscillation of the flow inside the whole compression system, consisting of the blade rows as well as any ducting or plenum volume after the last blade row. Surge occurs in cycles where the flow oscillates throughout the compression domain as the downstream volume (combustor) is filled and emptied periodically.
This section summarises the modelling of a surge event by Vahdati et al. (2006) using the same eight-stage core compressor as shown in the previous section. The domain used in the surge study, identical to that used in the steady state computations, is illustrated in Figure 2. The approach taken is based on the time-accurate version of the single-passage steady-state flow model where mixing planes are used at the blade row boundaries. The characteristic variables are imposed at the mixing plane and the number of conditions imposed is determined from the actual flow direction. Therefore, the interface boundaries can automatically change from inlet to exit or vice versa. A multi-bladerow single-passage analysis is a reasonable simplification from the full model and, in spite of its potential shortcomings, which will be discussed later regarding the modelling of rotating stall, it provides considerable insight to the flow behaviour during surge. It is assumed that full surge has developed and that the unsteadiness is mainly in the axial direction. This approach is useful to provide a first approximation to vane loading during surge.
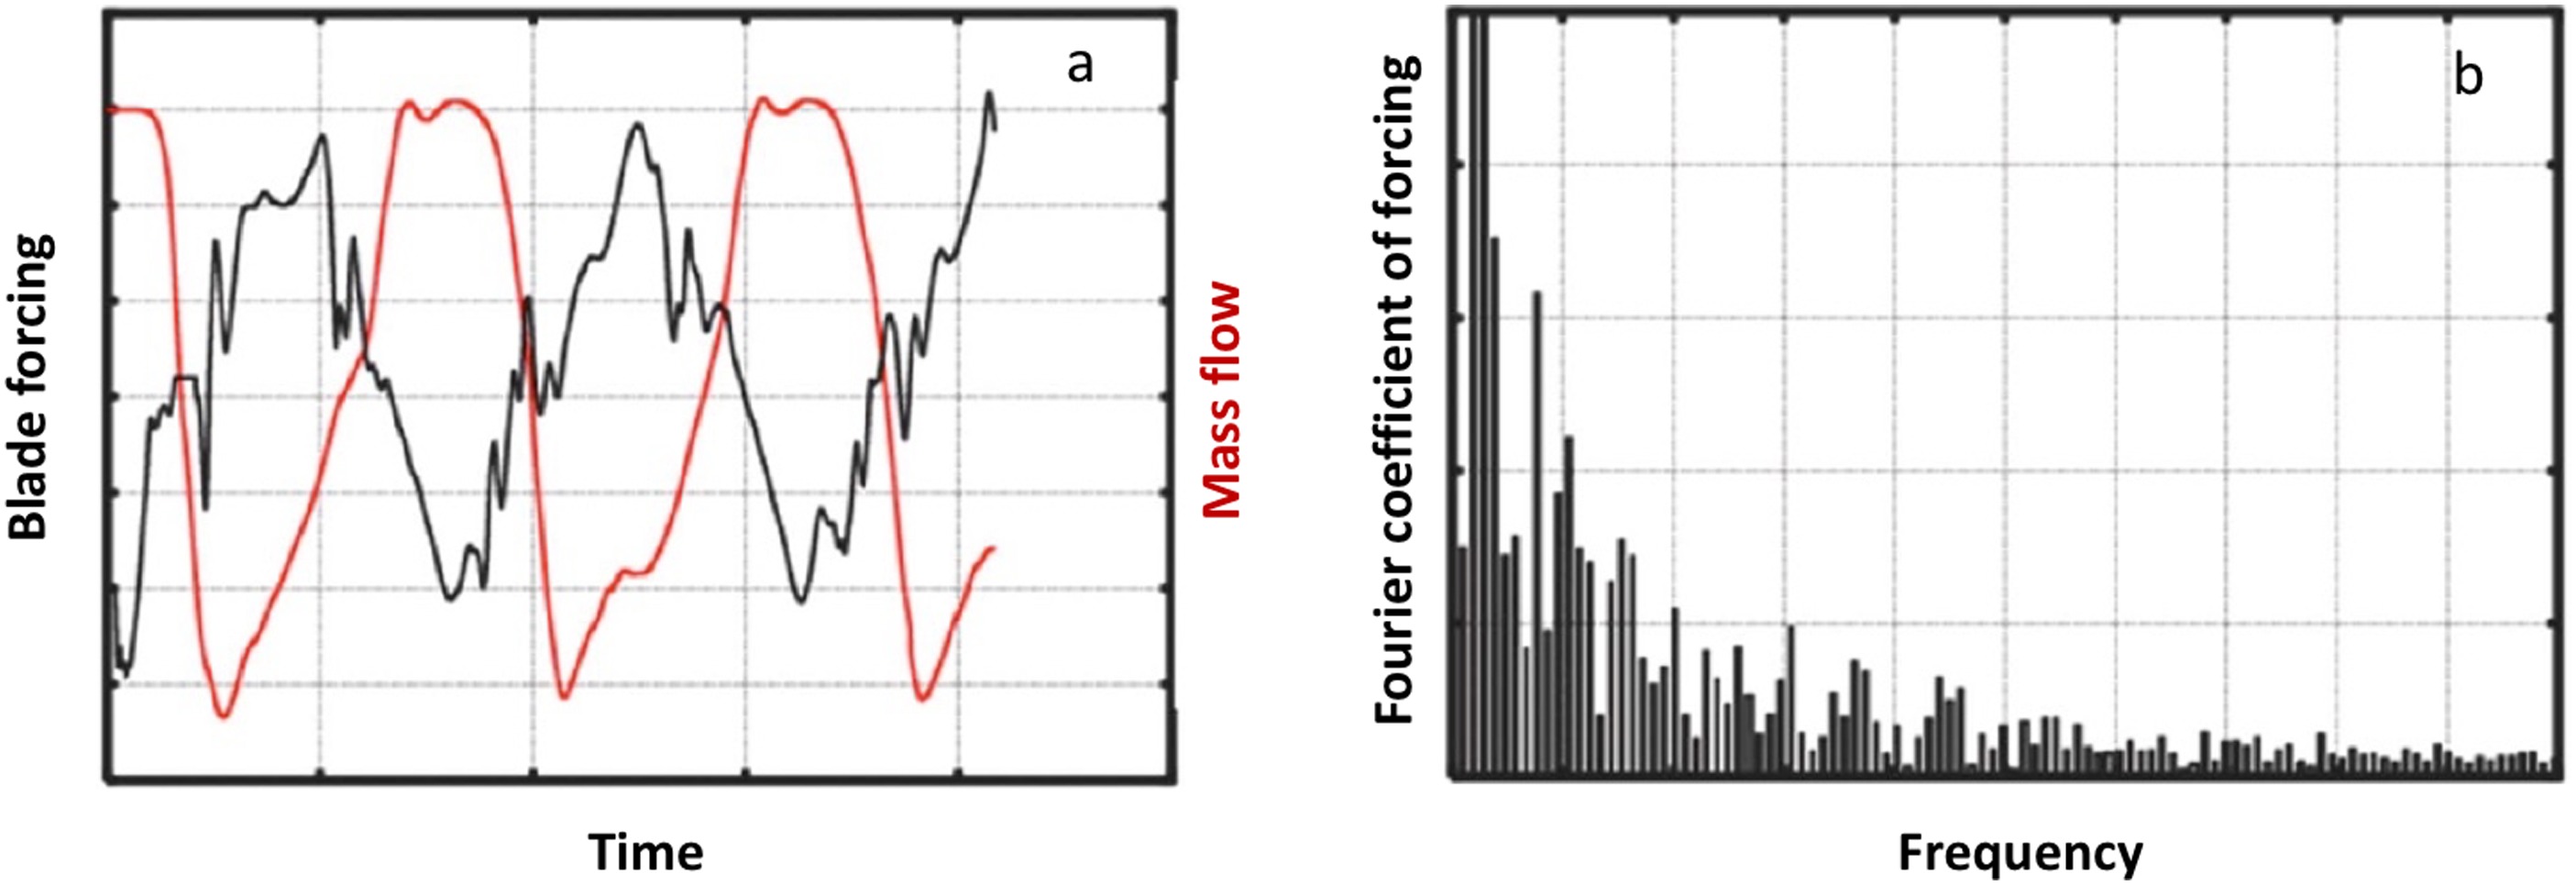
Starting from a steady and stable solution, the nozzle at the back of the core compressor is gradually closed, until a situation is reached where the compressor is not able to produce the required pressure ratio and the flow becomes unstable and surges. The variation of negative axial velocity, indicative of stall regions, at mid-passage plane at six different time levels is shown in the left plot of Figure 7. It is seen from this figure that there is no stall initially. As time evolves, stall regions are formed and expand in the domain. The process continues until the whole compressor is filled with reversed flow and the flow starts to come out of the compressor. Due to the flow reversal, the volume upstream of the nozzle empties and the pressure at the end of compressor decreases. Hence, the required pressure rise across the compressor drops and consequently the compressor recovers from stall. With the filling of the volume, the pressure at the back of the compressor increases again, and the process above repeats itself. Surge occurs in cycles where the flow oscillates throughout the compression domain as the downstream volume combustor is filled and emptied periodically. Hence, the frequency of the surge is dictated by the size of the volume upstream of the nozzle. The time history of the mass flow/pressure ratio is shown in the right plot of Figure 7, which shows the hysteresis loop for the compressor. It is obvious that the above procedure creates a significant amount of unsteadiness, and hence, as a result of interaction with blade modes, a large amount of unsteady forcing is produced. The time history of mass flow and forcing on the blade, as well as the Fourier components of the forcing, are shown in Figure 8. The forcing is for the first flapwise bending (1F) mode of the rotor assembly. It can be seen that, for such an event, the forcing on the blade almost repeats itself during each surge cycle. A Fourier transform of the forcing shows that all frequencies are present in the forcing and that the aeroelastic behaviour during surge can be viewed as an impulse response where all modes are excited. The highest forcing corresponds to the surge frequency, and it is determined by the size of the control volume.
Figure 7.
Time history of negative axial flow at mid-passage (left); Hysteresis loop for mass flow versus pressure ratio (right).

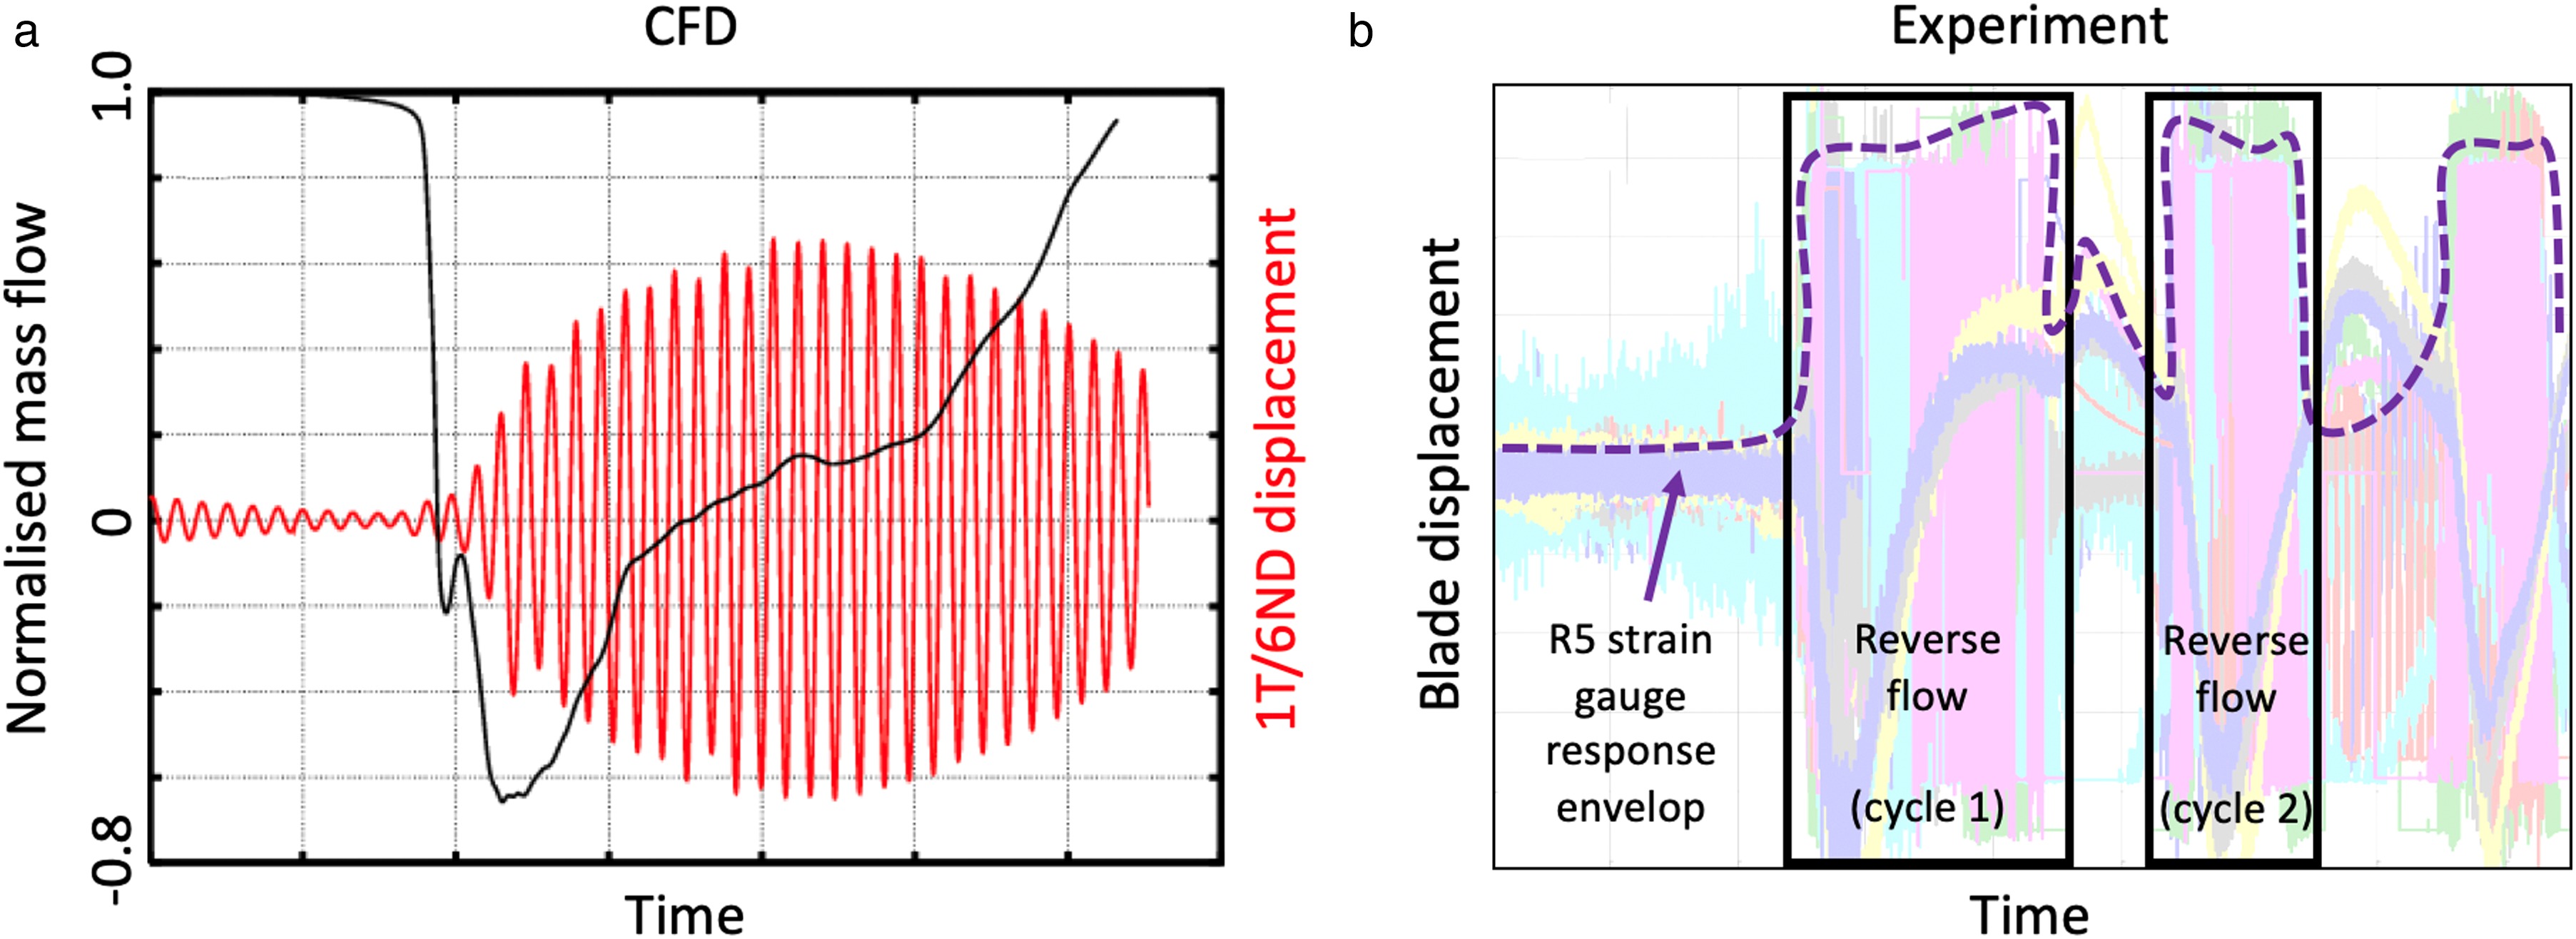
To investigate the blade flutter stability during the surge event, a hybrid model is used for the analysis of R5. Based on the converged steady state solution, an unsteady computation model was constructed by expanding the R5 single passage mesh and solution to full annulus, while keeping the mesh and solution of other blade rows as single passage (see Figure 9). The expanded domain and steady solution were used as the initial condition for unsteady computation. In this computation, all blade rows were modelled in an unsteady fashion and the inter-row interfaces were modelled as mixing planes. The unsteady computation starts by closing the nozzle at the back of the compressor to trigger surge. Using full annulus R5 model allows aeroelastic calculations to be performed by exciting the R5 blade in all nodal diameter modes of interest (first flap (1F) and first torsion (1 T) modes). Hence, in such computations, there are two sources of unsteadiness: the surge excitation and blade vibration. This approach allows the modelling of blade response, in addition to the unsteady forcing, during surge cycles, from which the flutter stability of the rotor blades can be determined. Figure 10a shows the blade displacement time history together with inlet mass flow time history. It can be seen from this figure that the 1 T mode is initially stable (during normal operational conditions). As the compressor surges and R5 experiences reversed flow, the 1 T mode becomes unstable and the blade experiences flutter. However, during the recovery phase of the surge cycle, the blade becomes stable in the 1 T mode again and the aero-damping becomes positive. It should be noted that the blade is highly unstable during the reversed flow period, and very high vibration amplitudes can be experienced especially for lower surge frequencies (i.e. bigger exit plenum volumes). The measured data, shown in Figure 10b as time history of strain gauge measurements, seems to show a similar trend. In this Figure, the envelope of R5 strain gauge measurements is highlighted by the dashed curve and the flow reversal period in the first and second surge cycles are marked by boxes. It is seen that the blade experiences very high vibration levels during the reversed flow period of surge cycle, while amplitudes decrease during the recovery period. Further analysis of strain gauge measurements on different blades and casing mounted pressure transducer signals (“Kulites”) confirmed the high response of R5 to be the 1st torsion (1 T) mode concentrated around a 6 nodal diameter (6ND) pattern.

Figure 10.
(a) Time history of mass flow rate and blade displacement for the 1 T/6ND mode; (b) Time history of measured blade displacement in experimental tests.
In order to understand the cause of flutter during the reversed flow and develop faster computational strategies a 2nd approach was used. In this method, three solutions obtained at three different instants of time together with the corresponding boundary conditions are stored during the unsteady computations shown in Figure 7. A whole-assembly model of R5 is created from these solutions and flutter computations are performed using the extracted solutions and stored boundary conditions. In a way, one assumes that surge cycle is frozen in time and the aero damping is obtained for a particular time instant during surge. As the surge and flutter frequencies can be very different, the aim of such an approach is to reduce the computational cost and provide a first-order approximation to the reduction in aero damping during surge. In this case, the only unsteadiness is due to blade vibration.
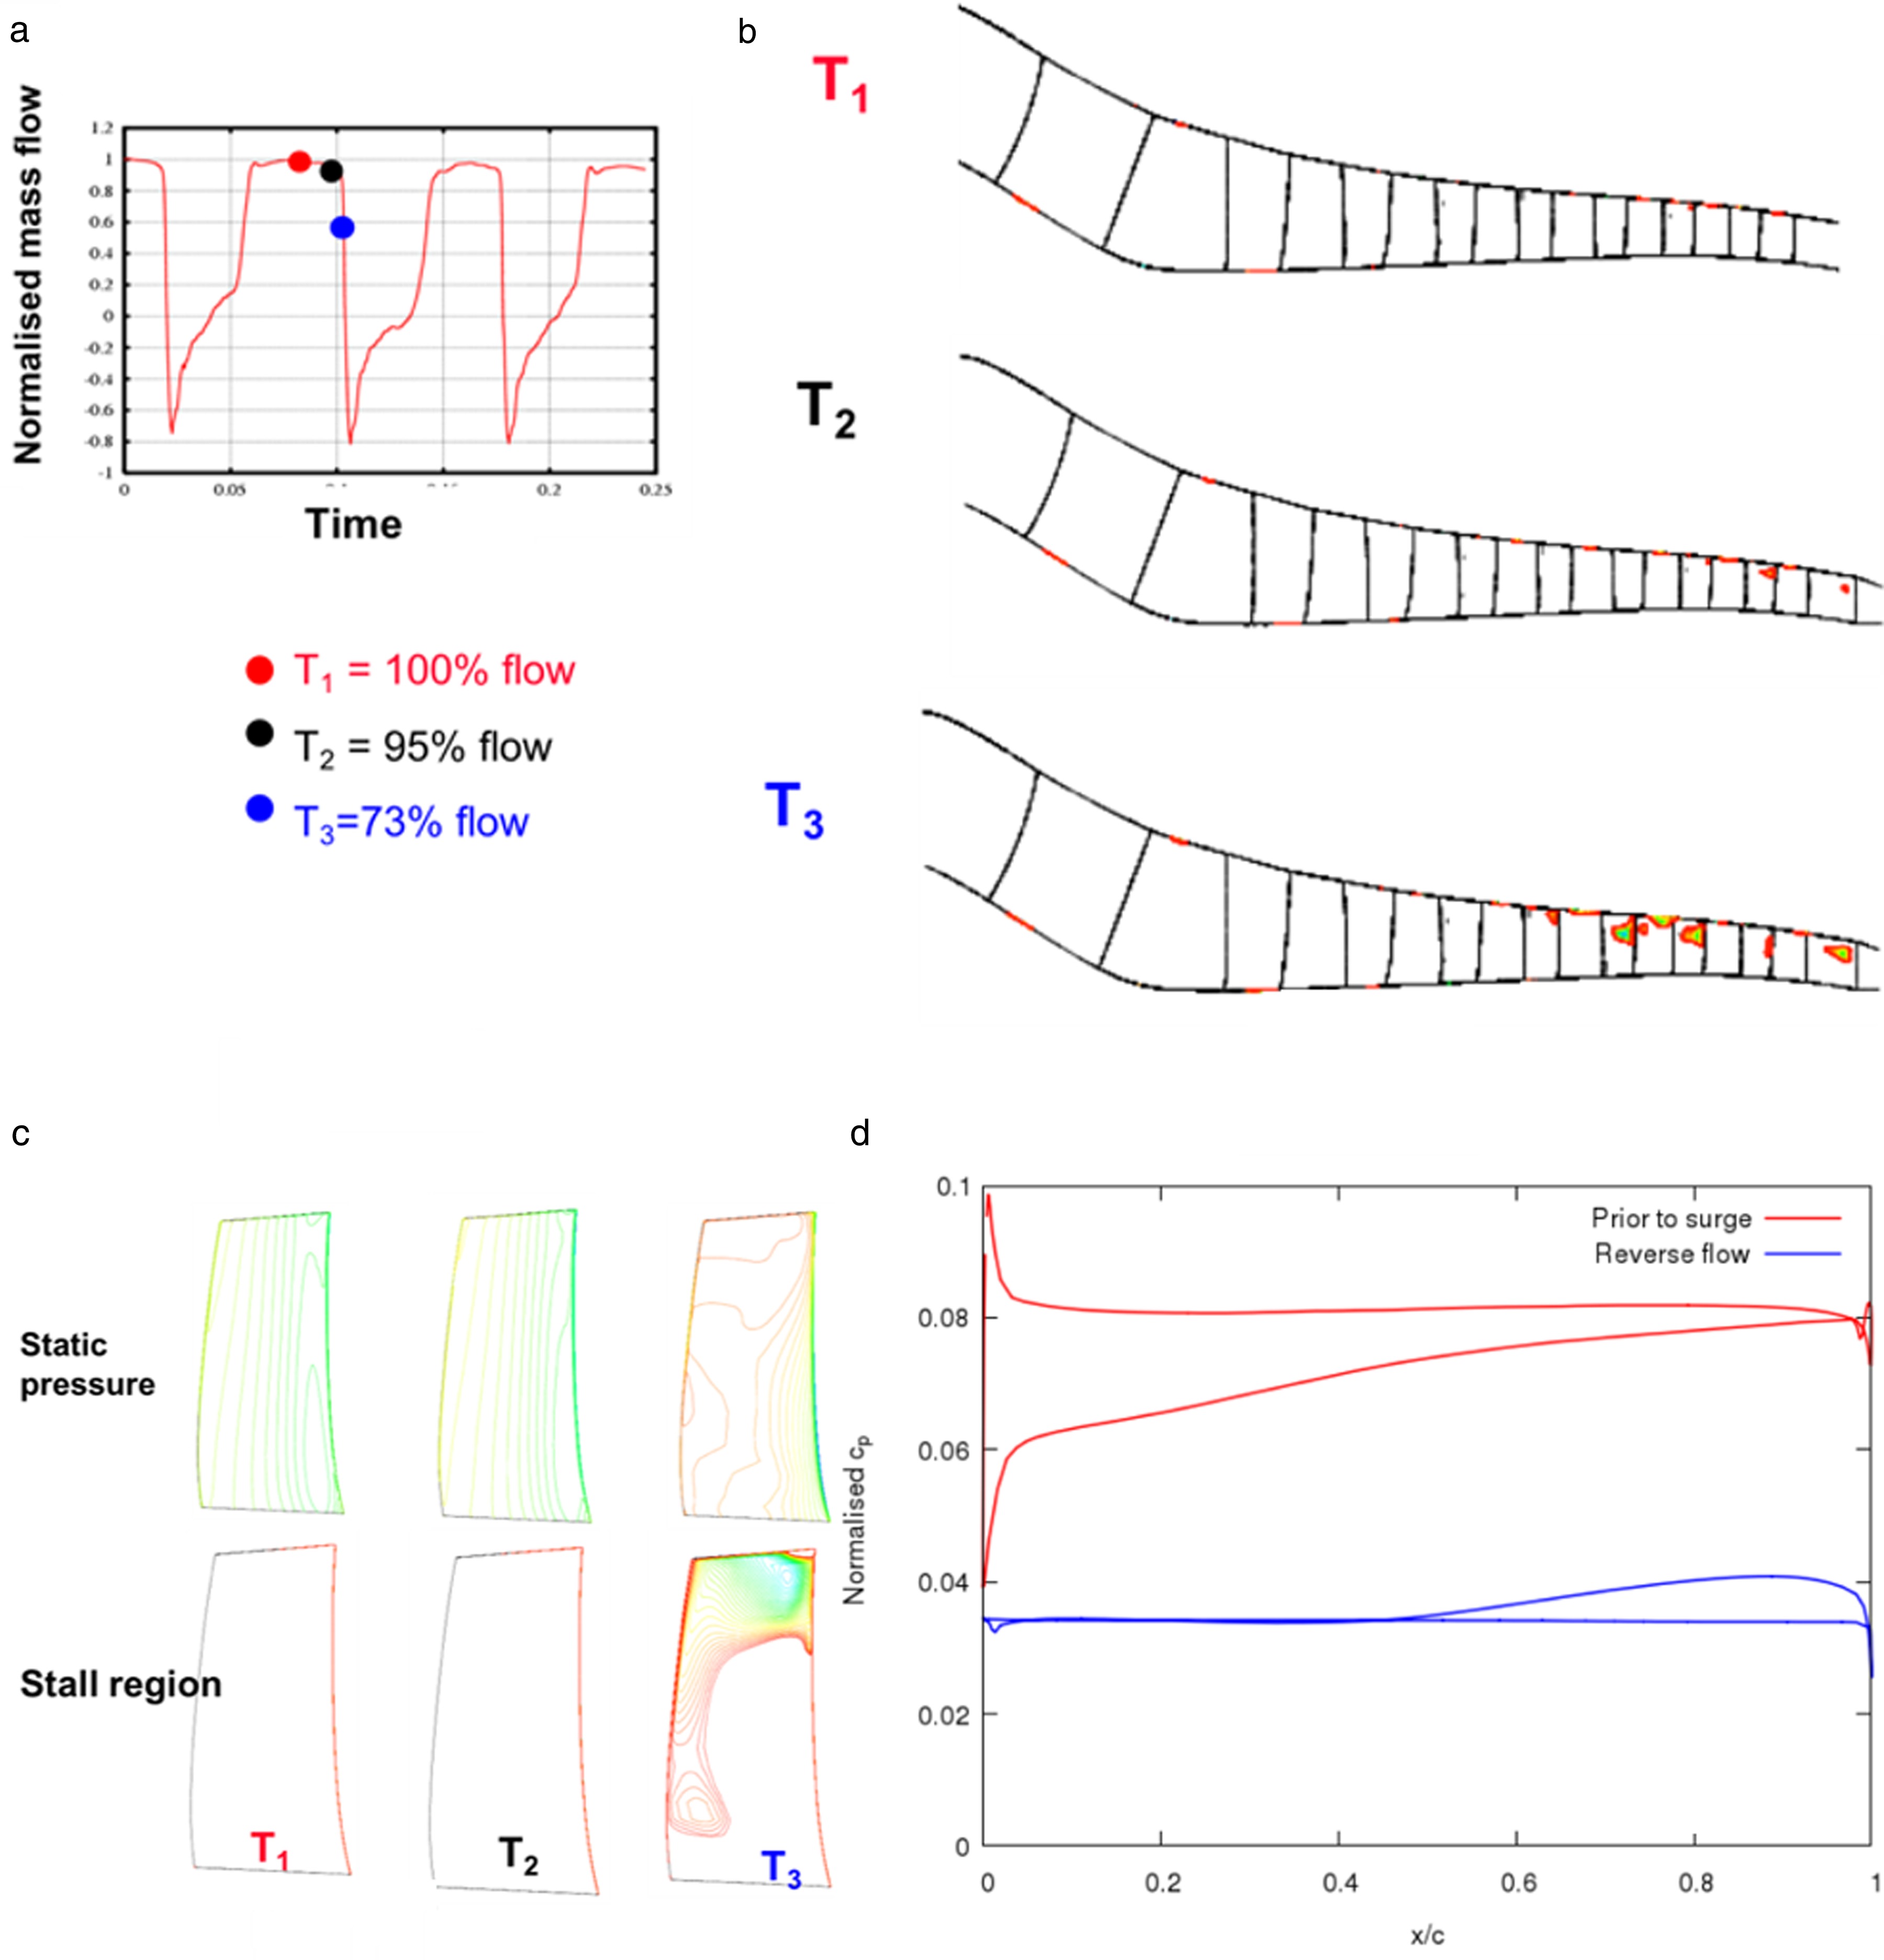
Figure 11 shows the regions of negative axial velocity, i.e. reverse flow, for 3 different instants of time (T1, T2 and T3). Time T1 is at normal operating condition, time T2 is very close to stall and time T3 is at the beginning of surge. The upper plots of Figure 11c show the static pressure on the suction surface of the blade and the regions of negative axial velocity for the same time instants are directly below those plots. It is seen that the flow at time T3 is totally different from the flow at times T1 and T2. The variations of static pressure during normal operation and reversed flow on rotor 5 at 80% height is shown in Figure 11d. The plot clearly shows that the blade loses most of its lift during reversed flow. It is also apparent that the front section (0–50% chord) of the blade generates no lift which explains why the blade may suffer from torsional instabilities.
Figure 11.
(a) Time history of mass flow and (b) reversed flow contours at three instants of time; (c) Flow on the suction surface of Rotor 5; (d) Variations of static pressure at 80% height of Rotor 5.
The computed damping curves plotted against nodal diameter for both 1F and 1 T modes are shown in Figure 12. The plot clearly shows that the 1 T modes becomes unstable during reversed flow while the 1F mode remains stable at all operating conditions. The 1 T damping curves (shown on the right-hand side) show that as one moves from T1 to T2, the aero damping decreases slightly but the shape of the curve remains the same. This is very similar to classical flutter cases where a decrease in mass flow (i.e. higher point on a constant speed characteristic) results in a decrease in aero damping. However, during surge (T3), the flutter vs damping curve does not seem to follow the classical “sine wave” trend. The instability is spread across many nodal diameters and happens in negative nodal diameters.

Overall, the results obtained using the hybrid full-annulus/single-passage model compare quite well with the results obtained using a single-passage mixing plane strategy. The single-passage mixing plane method for surge modelling offers good computational efficiency over an equivalent whole-annulus analysis, but it cannot model the rotating stall to surge transition. It is inherently assumed that the unsteadiness is axial during surge. However, the method can produce a first-order approximation to the blade loadings during surge and could be used to determine the axial gap between blade rows. This approach would be of more interest if the blade loadings were higher during the surge than the rotating stall that precedes it. Moreover, such an approach can be used for determining the weakest stage in a multi-stage core compressor. The validation of such approach was recently presented by Zhao et al. (2018), where an 8-stage compressor assembly was modelled using a full annulus model. By varying the size of the exit plenum volume, a full-span rotating stall and a deep surge event were predicted by the model. Overall, the URANS CFD model was shown to be capable of predicting detailed flow features at conditions traditionally challenging for numerical simulations, such as fully developed full-span rotating stall and deep surge of a multi-stage high speed compressor. It is also shown that the numerical model can offer more detailed knowledge of the transient flow field where comprehensive experimental measurements are challenging. Moreover, it was observed that for full surge a single passage approximation of the full assembly is quite accurate.
Forced response due to asymmetric flow features
The forced response of bladed discs is a very common vibration problem during the development phase of multi-stage compressors. A primary mechanism of blade failure is high-cycle fatigue (HCF) which is cause by vibrations at levels exceeding the material endurance limits. The two most common types of forced response vibration of core compressors are:
Rotor/stator interactions driven by blade passing, which usually occurs in relatively high engine orders.
Low engine order (LEO) forced response vibrations.
For the first type of forced response, traditional industrial practice is to identify possible resonances, at engine order (EO) frequency crossings, from the Campbell diagram and to try to avoid them by tuning the blade frequencies. However the usefulness of this approach alone is limited by the lack of knowledge of the resonant response levels. The actual blade response level is dependent on two quantities: unsteady aerodynamic loading and total damping in the mode of interest, both of which can be modelling using numerical computations. Therefore, there is a strong case for the development and use of advanced numerical tools for the prediction of absolute vibration levels of blades. Nevertheless, forced response methods for this type of interactions are well established. The second type of forced response, a less researched variant, arises when the unsteady aerodynamic forcing function contains low-order harmonics of the shaft speed, hence the term LEO forced response. A typical example is stator/stator clocking in a core compressor. Such harmonics are due to some loss of symmetry in the flow which may be due to a general unsteadiness that persists throughout the engine. Similarly, blade-to-blade variations due to manufacturing tolerances, errors in controlling the variable stator vane angles, and “blocked” stator passages are known to generate low harmonics.
Vahdati et al. (2005) conducted a computational forced response analysis for the first five blade rows of a civil aero-engine core compressor, hereafter labelled as S1 (40), R1 (31), S2 (32), R2 (38), and S3 (50), where the number within brackets indicates the number of blades in each row. Figure 13a shows the geometry of the 5 blade rows in the core compressor. Interest was particularly paid to the forced response of the R2 blade row due to a blocked stator vane passage, i.e. stagger variation in one of the stator blades. Such geometric assymetry may arise from manufacturing tolerances or, under extreme circumstances, due to a malfunction of the control mechanism for the variable stator vane. To investigate the effect of such feature on the forced response of R2, computations were carried out with a gradual blockage by rotating one of the S2 blades by 10, 20 and 25 degrees, an approach which links the R2 response levels as a function of the blockage angle.
Figure 13.
(a) The core-compressor geometry (left to right: S1, R1, S2, R2 and S3); (b) Steady state Mach number contours at S2 exit.
The steady state Mach number contours at S2 exit for the 25° blockage case are plotted in Figure 13b. It is seen that the effects of the blockage on the flow are confined to the blocked passage and its immediate neighbours. The whirl angle variations arising from such a flow will cause low-engine-order harmonics which will excite the vibration modes of blade row R2. Unsteady computations were subsequently carried out using the full-annulus 3-row (S2/R2/S3) model to allow the passage and development of flow disturbances from S2 to the downstream domain. Figure 14a shows the instantaneous entropy contours at 90% height. It clearly shows that the blocked passage creates a large amount of loss which convects downstream to the other blade rows and interacts with the flow in these blade rows. This interaction creates a large unsteady forcing on the blade which contains all the harmonics as shown in Figure 14b. Maximum blade response for the bending and torsional blade mode was calculated from the modal force and aero-damping and is plotted in Figure 14c for the assembly modes of interest as a function of stator blockage angle. It is seen that the response for Mode 1 is very high at 25° blockage, a feature that must be considered duly in the design process of a core compressor. Moreover, it is seen that the entropy variations are quite strong at the computational boundary exit which indicates that the blockage can create high amplitude vibrations for the rotors further back in the compressor.

Acoustic reflection driven flutter
Flutter as a self-feeding aeroelastic instability presents one of the biggest challenges in modern aero-engine designs. This interaction between the unsteady aerodynamic loading and the blade motion can lead to the amplification of vibration levels resulting in high-cycle fatigue blade failures. Although there have been extensive studies about flutter stability of compressor or turbine blades, very limited work can be found regarding the effects of rotor–stator acoustic interaction on flutter stability of embedded blades. For an embedded rotor within a multi-stage compressor, flutter can occur when the acoustic pressure fields upstream and/or downstream of the blade row are cut-on (i.e. wave propagates without attenuation). Acoustic pressure waves generated by rotor vibration propagate between (and are reflected at) blade rows, influencing the flutter stability of the embedded rotor.
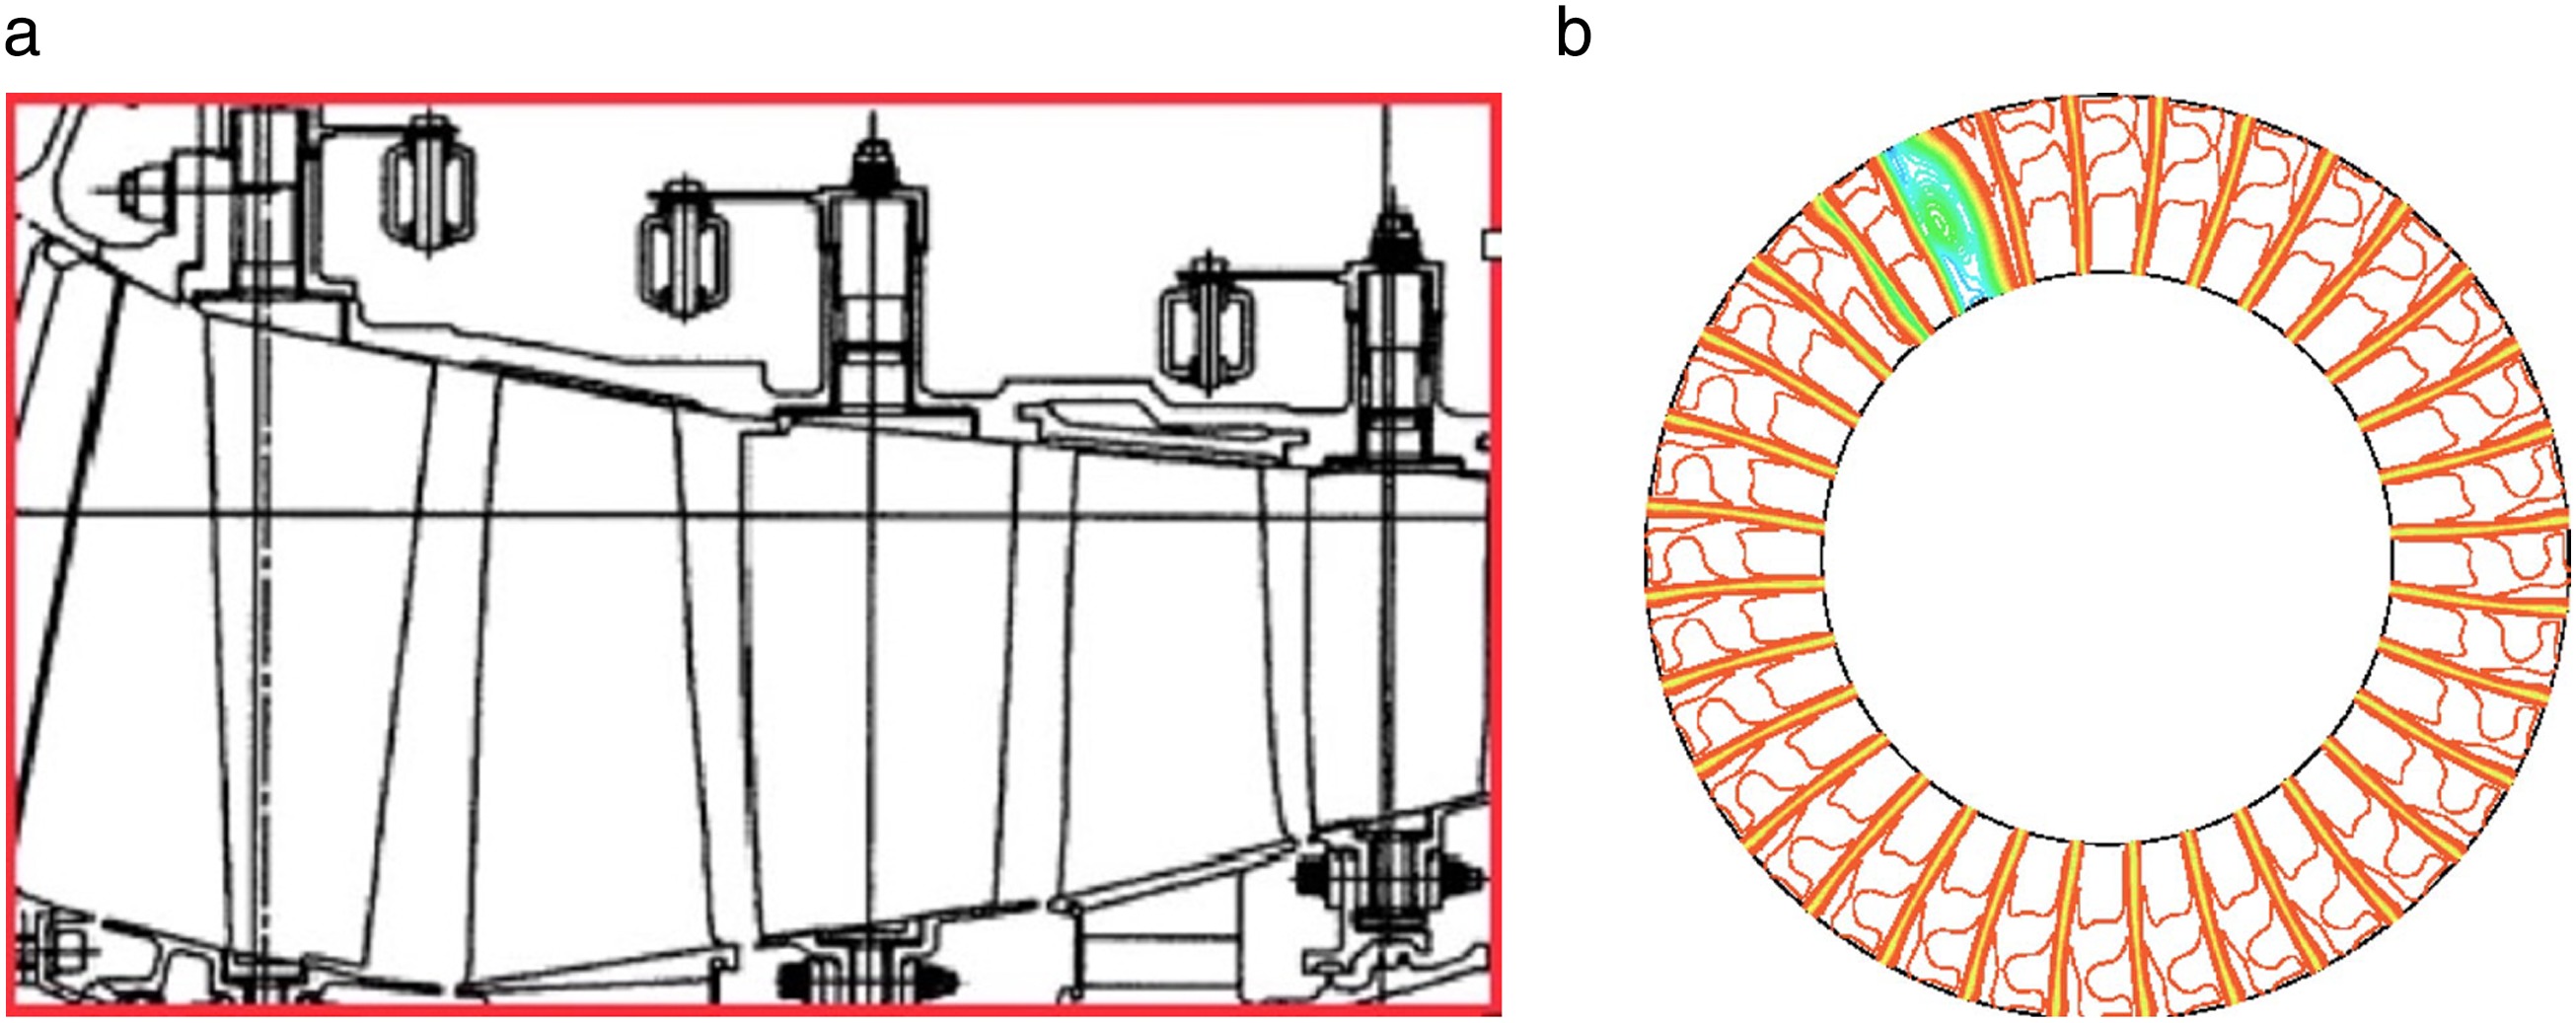
The influence of acoustic reflections from adjacent blade rows on flutter stability of an embedded blade row was investigated by Zhao et al. (2015, 2016). The test case compressor (Figure 15a) features 9 highly loaded stages on a single spool contributing to an overall pressure ratio of 22:1. Titanium blisks were installed on the front stages to save weight. The inlet guide vane (IGV) and first three stages of stator vanes (VSV) have adjustable blade stagger angle which operate with different settings according to spool speed. During a sea-level, working line acceleration, vibration survey of the engine, non-synchronous vibration was measured on the blades of the Rotor 2 blisk within the 9-stage high pressure (HP) compressor (Figure 15b). Analysis of “Blade Tip Timing” (BTT) and casing mounted pressure transducer signals (“Kulites”) confirmed the cause of instability to be flutter in the 1st flapwise bending (1F) mode with a zero nodal diameter (0ND) pattern, and at a reduced frequency of 0.67. This phenomenon was very unusual as it occurred in a very narrow speed range (between 92% and 94% aero-speed) at a flow condition well away from stall. Moreover, the vibration occurred at a reduced frequency significantly higher than the typical critical flutter frequencies. For the flow condition at which the flutter event was recorded, the acoustic fields upstream and downstream of the rotor were found to be cut-on for low inter-blade phase angle modes (including the plane wave mode), which indicates that the main cause of flutter is not related to the flow and modeshape driven flutter. In order to determine the cause of the instability, flutter analyses for the embedded rotor were carried out using unsteady CFD computations at the speed and flow condition of the measured flutter event.
Figure 15.
(a) The 9-stage high-pressure compressor with Titanium rotor blisks; (b) The measured flutter event.

The domain used for steady and unsteady flutter computations are shown in Figure 16a. The rotor row of concern (rotor 2), which showed flutter instability in experimental tests, has a hub/tip ratio around 0.7. In all the flutter computations presented, the blades were excited in first flap (1F) mode at a reduced frequency of 1.2. Results are shown for the peak efficiency operating point. At this condition, the inlet relative Mach number at tip is around 0.8 and the flow remains subsonic (apart from the suction peak) over the blade. For unsteady flutter computations, aerodynamic damping was computed from the logarithmic decrement of the displacement time history. Unsteady flutter computations were performed for the isolated row, 3 blade row and 5 blade row assemblies respectively (Figure 16b). Identical operating conditions were maintained for all cases studied regardless of the number of blade rows used in the unsteady computational domain. Non-reflective boundary conditions were used to minimise numerical boundary reflection. Sensitivity of flutter stability of the embedded rotor is studied by comparing blade aerodynamic damping for different assemblies.
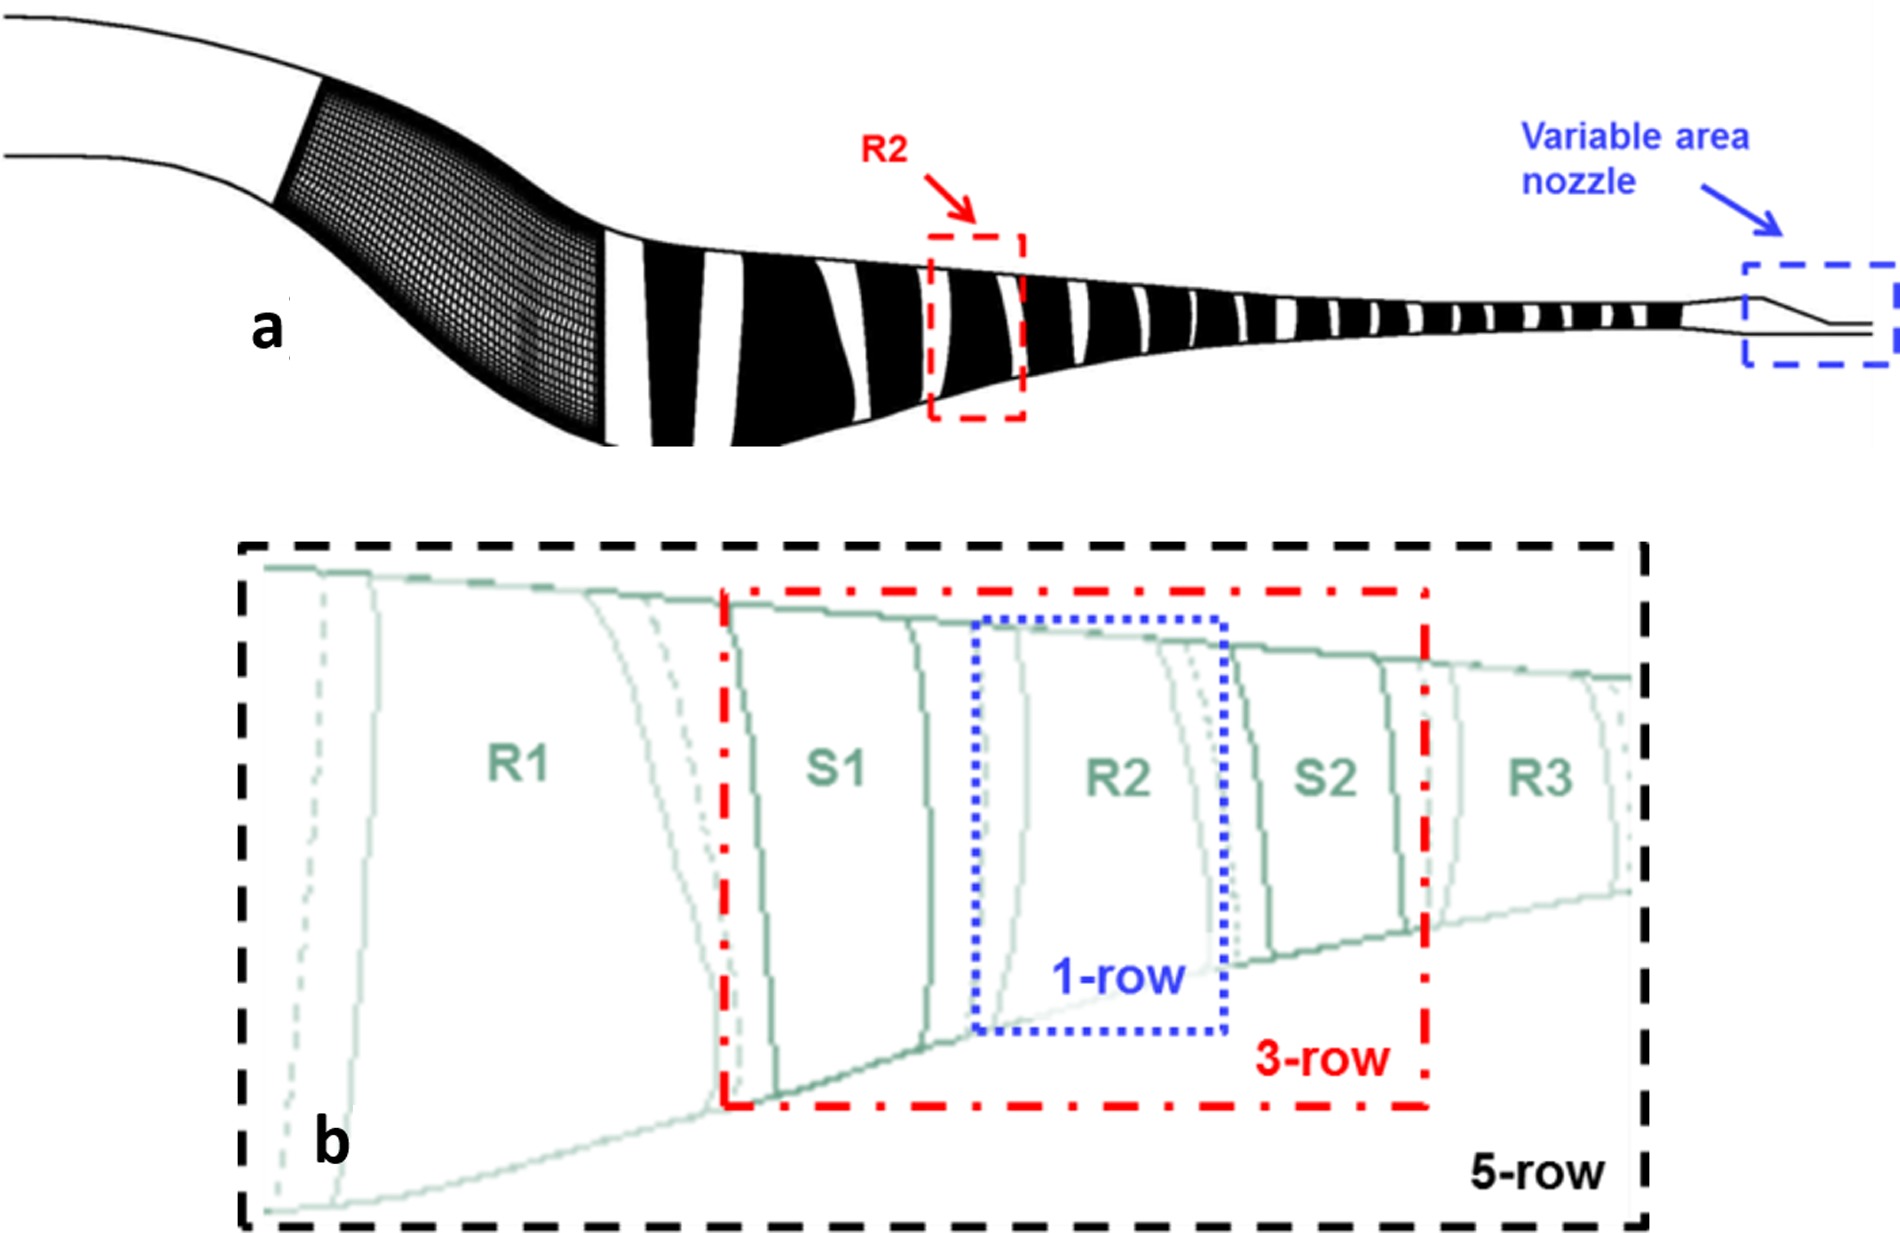
Figure 17a shows the computed aerodynamic damping of rotor 2 for low nodal diameters −4 to 4. In this plot a positive ND represents a forward travelling wave (co-rotating with the rotor), and a negative ND represents a backward travelling wave (counter-rotating with the rotor). The aero-damping distribution of higher NDs are not shown since the blade becomes highly damped and thus does not pose a stability concern. As can be seen on the plot, the isolated rotor shows positive aero-damping for all NDs, suggesting that at the operating condition studied the rotor is always stable in the absence of other rows. With the introduction of upstream and downstream stators, aero-damping of the embedded rotor changes significantly from that of single blade row analysis. It is stressed again that, this is not due to the change of flow on rotor 2 as the numerical set up ensures that the base steady flow on rotor 2 is the same in all the computations. Positive, as well as negative effects on aero-damping can be observed from the plot. Moreover, the least damped mode shifts from 2ND (in single blade row analysis) to 0ND (in multi blade row analysis), and flutter is seen at 0ND with a small negative damping which is in accordance with experimental observations. The influence of adjacent blade rows on flutter stability of the embedded rotor is clearly seen based on this plot, where the stable isolated rotor becomes unstable due to interaction between blade rows. This interaction between the blade rows is considered to be acoustic since the frequency of concern is well away from any engine order or forced response frequencies.
Figure 17.
(a) Aero-damping for R2 in different assemblies; (b) Change of R2 aero-damping due to the presence of adjacent blade rows.
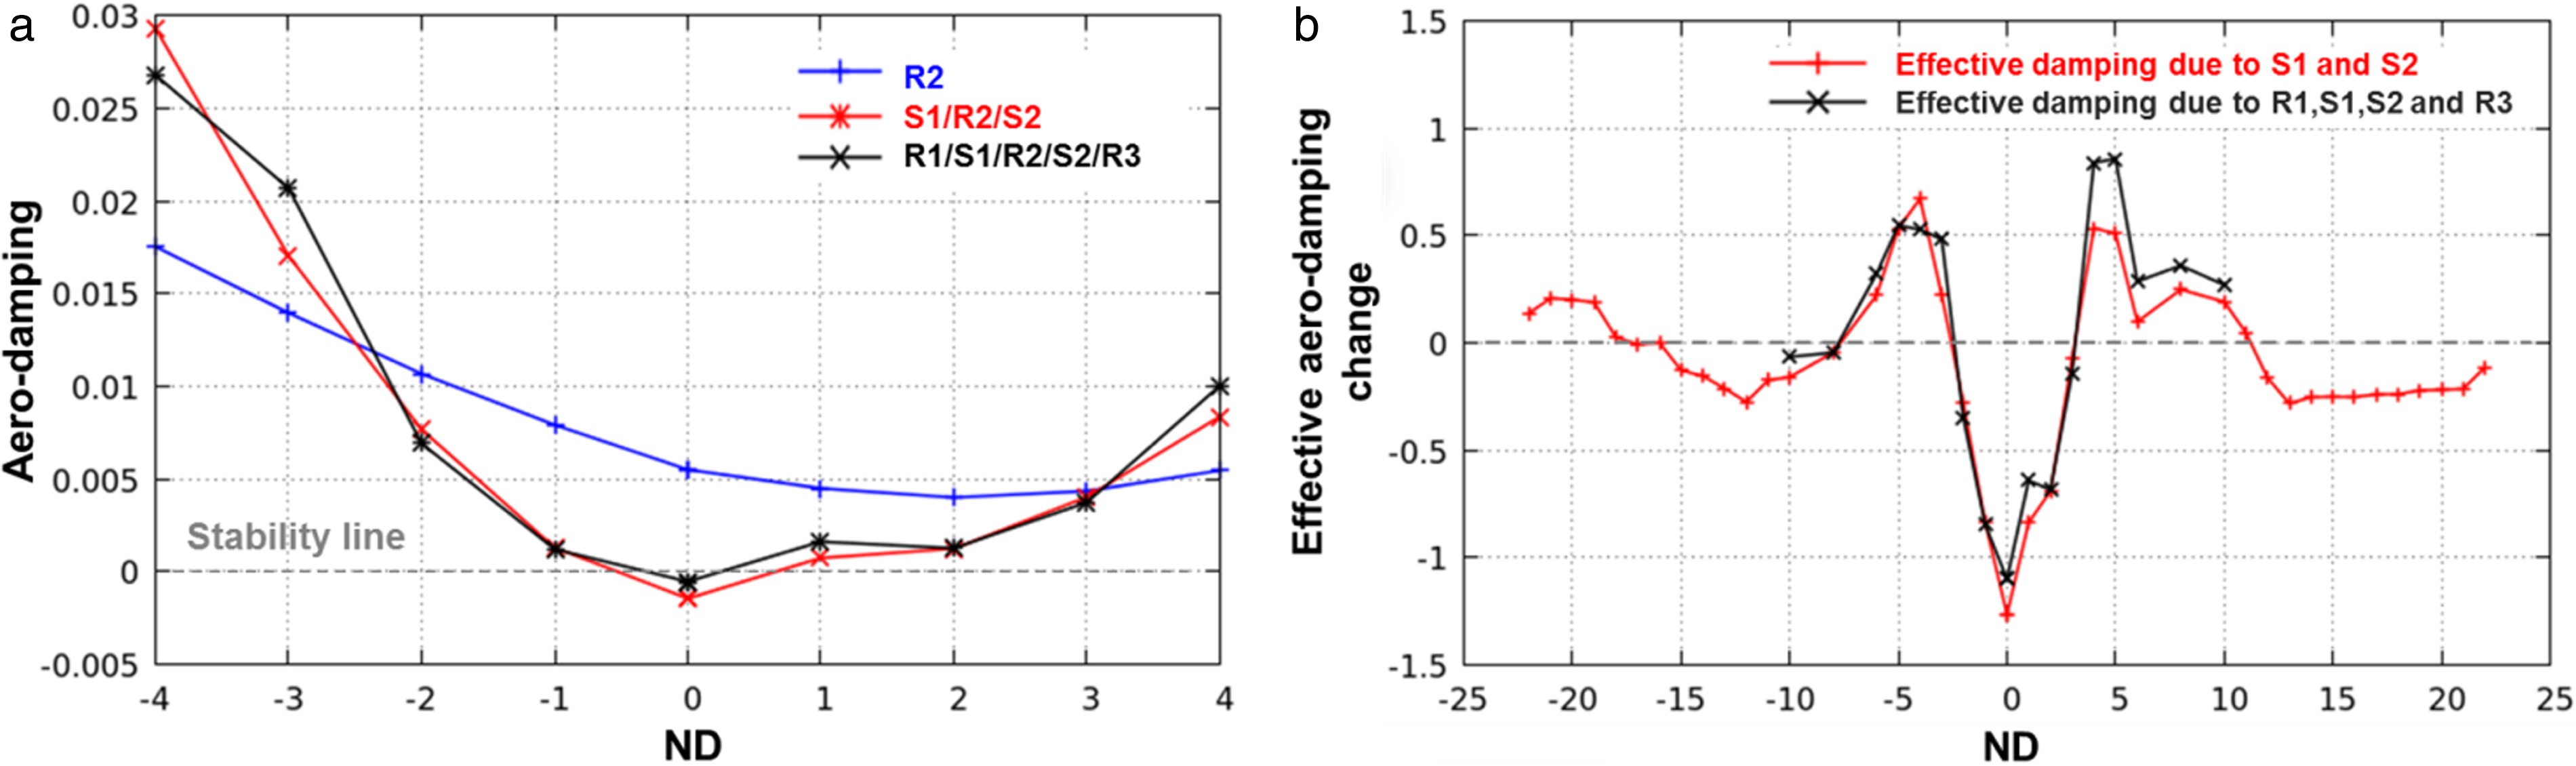
In order to understand the effect of acoustic interaction from adjacent stators on different travelling modes, the differences in aerodynamic damping of the rotor between multi blade row assemblies (labelled as S1/R2/S2 and R1/S2/R2/S2/R3 respectively in Figure 17a) and isolated blade row (labelled as R2 in Figure 17a) are computed and normalised by the “blade-only” damping (aero-damping of isolated R2), which are plotted in Figure 17b. The “effective aero-damping change” due to acoustic reflections represents the contribution of acoustic reflections to damping of the blade. This term provides a good measure of acoustic reflection effects. As can be seen in the plot, a cyclic distribution about the zero-stability line can be identified. Positive and negative effects (due to reflections) are clearly shown in this plot where the largest decrease in aero-damping is seen between −2ND and 2ND and the most increase in stability is seen in the vicinity of −5ND and 5ND. This influence of reflections on blade aerodynamic damping decreases for higher NDs as the acoustic modes cut-off, and the amplitude of the propagating pressure waves decay along the path of travel. Moreover, by comparing effective damping of the 3 blade row case and the 5 blade row case, it is obvious that R1 and R3 which are farther away have little influence on flutter stability of R2. Therefore, it is appropriate to assume that interactions from not immediately adjacent blade rows are negligible for this test case and, in order to reduce computational costs, those blade rows could potentially be discounted.
Conclusions
Extensive research has been conducted to develop a predictive capability for multi-stage compressor aeroelastic stability, which can minimize rig and engine testing by means of advanced simulations that will cover the flight envelope in an efficient manner. This paper reviews some of the past work, and highlights some important findings and lessons learned that resulted from these investigations.
The variable-vane scheduling plays an important role in determination of the nature of rotating stall in multi-stage compressors. In the case of the high-band rotating stall, the disturbances diffuse very rapidly downstream. Hence, only the blade row adjacent to rotating stall is likely to experience high response levels. From a design point of view, it is important to demonstrate that the compressor is free from rotating stall using a simple and cost-effective design tool. From a diagnostic point of view, it is important to understand rotating stall in terms of both the exact pattern and speed of the stall cells so that any critical vibration modes can be identified and avoided.
Using a single passage model of whole multi-stage compressor assembly, not only can one model steady flow near stall but one can model a simplified axial surge event using mixing planes and produce the hysteresis loop for compressor. The method allows a total flow reversal (negative mass flow) and recovery from it. From an engineering viewpoint, the simple method can be used to obtain a first-order approximation to surge loading. The approach can be of more practical use, e.g., axial gap approximations, provided that the unsteadiness during surge is mainly axial and the loadings during surge are higher than the rotating stall that precedes it. Further studies using full-annulus blade row for the rotor of interest reveals a strong relationship between the flutter stability of the rotor and the transient mass flow, where the blade mode studied here is seen to be unstable during flow reversal periods of the surge, and subsequently regains stability as the compressor recovers.
An integrated aeroelasticity methodology, based on large-scale numerical modelling, has been described for full-annulus multi-bladerow forced analysis of core compressors. It was shown that partially blocked stator passages can cause large vibratory response. Although extremely unlikely, such eventualities need to be addressed at the design stage. Stator angle variations due to the difficulties of controlling all variable inlet guide vanes to the same level of accuracy, even though believed to have less impact than blocked passages, may also cause unexpected low engine order excitation.
The effect of blade row interactions on flutter stability of an embedded rotor was investigated using multi-row full annulus unsteady CFD computations. It was found that acoustic reflection has significant impact on flutter stability of an embedded rotor blade in a multi-stage compressor. As the use of blisks, which have very low mechanical damping, is becoming more common in modern aero-engine designs, effects due to acoustic reflection on aerodynamic damping should be taken into account during early development stages of an engine. Flutter computations were performed on an embedded rotor in a high-pressure compressor with and without the presence of its adjacent blade rows. Acoustic reflections from the two neighbouring stators shows positive and negative effects on aerodynamic damping of the embedded rotor for different NDs, whereas the effect of reflection from blade rows further away is found to be negligible in this case.