
Introduction
In the last decades, ORC systems experienced a remarkably increasing appeal, since, in a context of limited resources, it is crucial to exploit efficient technologies for power generation from low/medium enthalpy grade sources. The use of organic fluids instead of water for the Rankine cycle leads to considerable advantages, such as reduced specific enthalpy drops and single-phase expansions, which make this technology one of the most attractive for low-to-medium temperature sources (Colonna et al., 2015). However, complex fluid flows establish within the turbo-expander due to the strong non-ideal behaviour of the working fluids in proximity of the liquid-vapor saturation curve, where the expansion generally takes place. Moreover, the expanders are often designed with a low number of stages, which result in high pressure ratio cascades which leads to transonic and supersonic flows, characterized by complex shock wave patterns.
Therefore, the fluid dynamic design of an ORC expander, typically an axial or radial turbine, requires major attention, also considering that the efficiency of the expander has a crucial impact on the cycle performance and therefore on overall plant profitability (Macchi, 2017). In order to successfully design an ORC turbine, several low-fidelity tools were conceived, mainly based on a mean-line method able to compute the thermodynamics and the geometry of each stage at blade mid-span. These methods have proven their value in traditional turbomachinery, where several experimental campaigns where carried out to validate the reliability of the correlations exploited for the loss prediction. The lack of experimental data on ORC turbines in the open literature, though, has often forced to settle for a validation of mean-line models results through high-fidelity CFD simulations. However, the effectiveness of the latter with organic fluids operating at low compressibility factors is in general established on the use of the state of the art fluid models, while a systematic comparison between simulations and experimental results is still missing. The only experiments documented in literature on the flow of organic fluids are, in fact, providing results for nearly isentropic nozzle expansions or flow around wedge profiles and bluff bodies (Zocca et al., 2019; Reinker et al., 2021). Further data were then provided in (Baumgärtner et al., 2020), which reports a study on an annular turbine cascade but still requiring a numerical estimation of the total pressure downstream the blades.
In order to cover the described literature gap and to attempt a first validation of the CFD simulations results, an experiment was conceived at Politecnico di Milano with the aim of analyzing the flow field across a supersonic turbine linear cascade representative of ORC applications. This paper briefly covers the design of the experiment in Section Design of the experiment. After that, Section Experimental campaign reports the main results of the experimental campaign, with a rigorous analysis of the flow field and a comparison between experimental data and CFD simulation results.
Design of the experiment
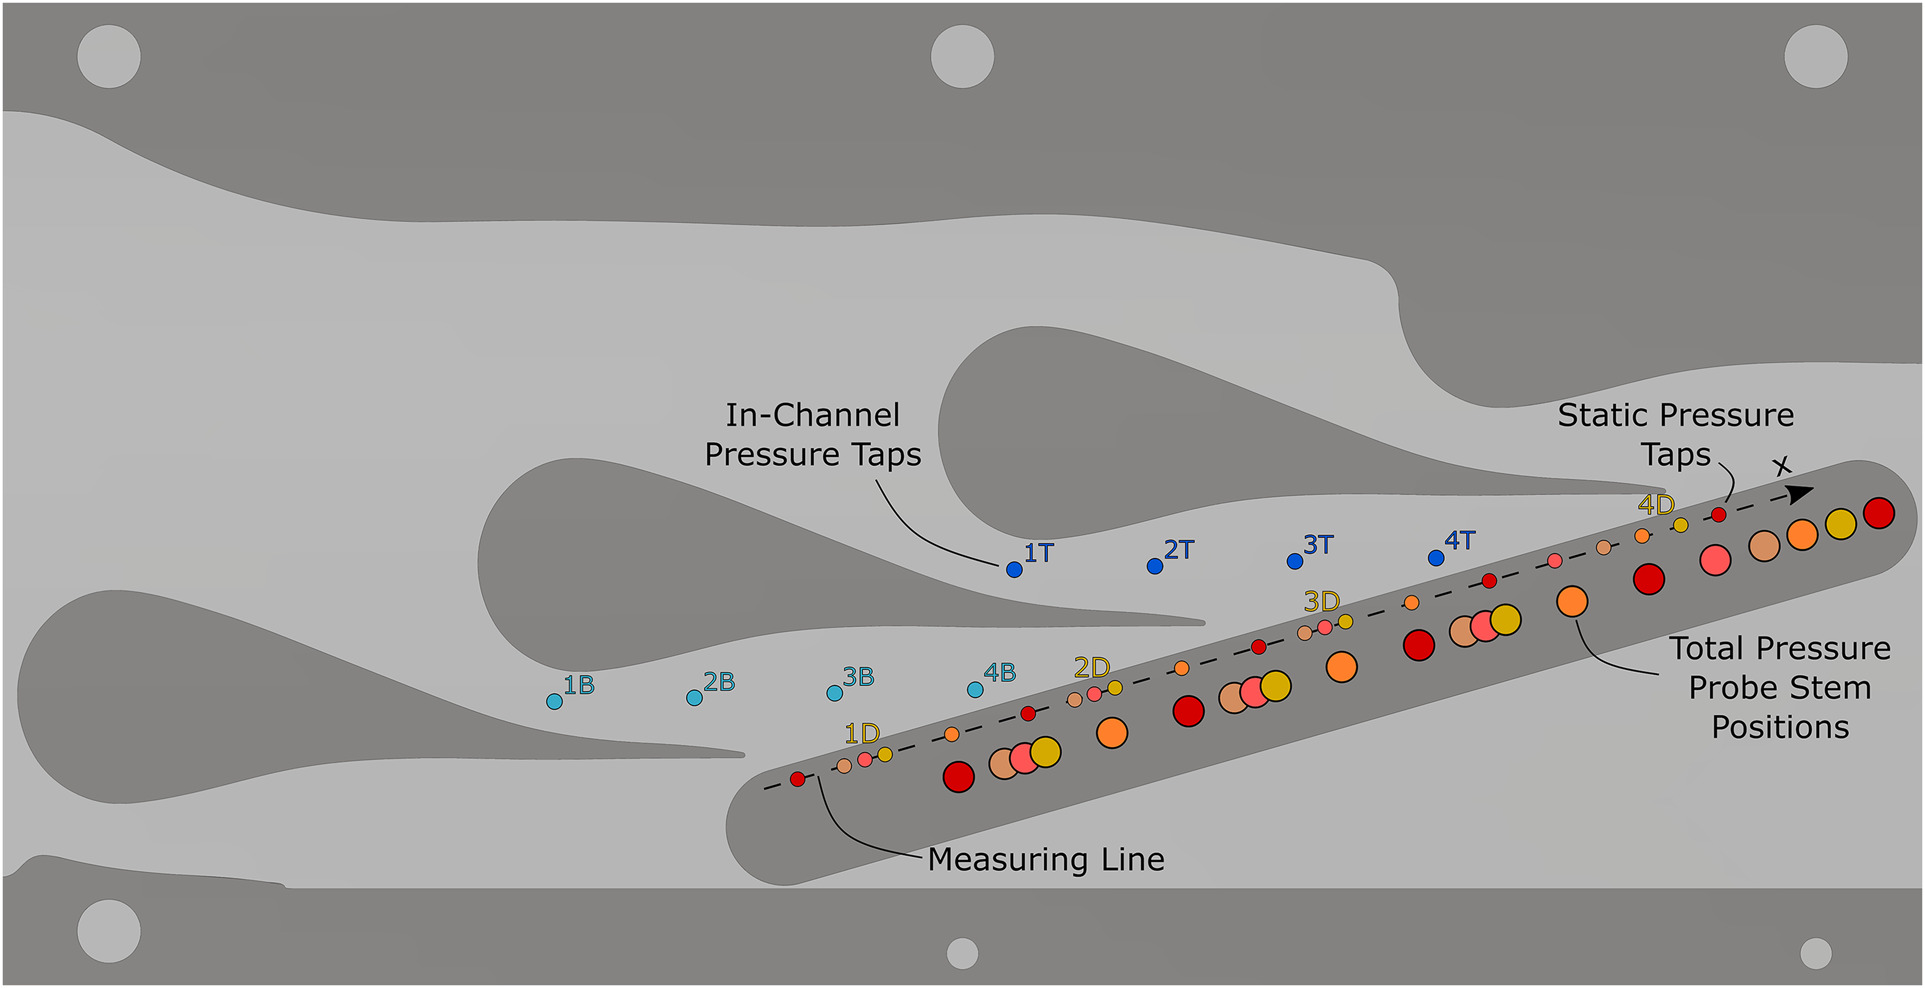
The campaign was designed to take place within the Test Rig for Organic VApors (TROVA) (Spinelli et al., 2013), a blowdown wind tunnel conceived to work with organic fluids flowing across a stationary test section that replaces the expander. In this specific context, a converging-diverging geometry was selected to represent a supersonic turbine linear cascade for ORC applications, illustrated in Figure 1. A thorough description of the design of the whole test section and of the related instrumentation is provided in Manfredi et al. (2023), while here are resumed only the main features, essential to point out the cascade characteristics and allow a better understanding of the results outlined in the next sections.
Figure 1.
Test section configuration. The static pressure taps are numbered according to their location on the top channel (T), bottom channel (B) or downstream measuring line (D). The circles on the measuring line coincide with the probe head locations. Main dimensions: pitch = 45 mm, throat = 6 mm, chord = 70 mm, blade height = 18.7 mm.
The experiments were designed to be carried out with hexamethyldisiloxane (MM) as working fluid, which is typically considered for medium to high temperature ORC applications and it is particularly convenient for the current investigation, since it exhibits an highly non-ideal thermodynamic behaviour at temperature levels well below the thermal stability limit. As highlighted in Section 1, the main interest of this work is to investigate the flow field of expansions occurring in the non-ideal region. For this reason, the design conditions were fixed at pTd = 25 bar and TTd = 261.5 °C, leading to a corresponding compressibility factor of ZTd = 0.31. These conditions were exploited for the whole geometry optimization and as boundary conditions for CFD validations. Nonetheless, as specified later in Section 3, experiments will be mostly carried out at lower pressures, still allowing an assessment of the flow field at fairly low values of Z, while reducing at the same time issues related to the limited schlieren measurement range (Conti et al., 2017) and to the test section sealing.
As reported in Figure 1, the linear cascade features three blades and two side-walls, implementing two main central channels, where all the measurements are performed, and two lateral ones. The geometric pitch is of 45 mm and the stagger angle is γ = 75°. Both inlet and outlet are perfectly axial, meaning that the flow deflection is null, resembling the small deflection of radial machine vanes. The test section, however, aims to be representative also of axial turbines; in fact, the original profile was extracted from Romei et al. (2020), where the flow turning through the cascade is 75°. Here, a null deflection is equivalent to operate the blade with a 75° of negative incidence at the inlet. To withstand such extreme boundary condition and avoid flow detachment, the blade shape was modified, assessing its performance with a CFD validation. The equivalence of the resulting flow field to the one characterizing typical turbine cascades is also proven by the blade pressure distributions reported in Manfredi et al. (2023). The profile was then optimized with the in-house tool FORMA (Persico et al., 2019) to minimize entropy generation. The result is a profile featuring a large curvature radius at the leading edge, which makes it tolerant to significant incidence angle variations while still keeping identical post-throat flow fields and therefore achieving very similar performances, as most of the entropy generation occurs in the supersonic region.
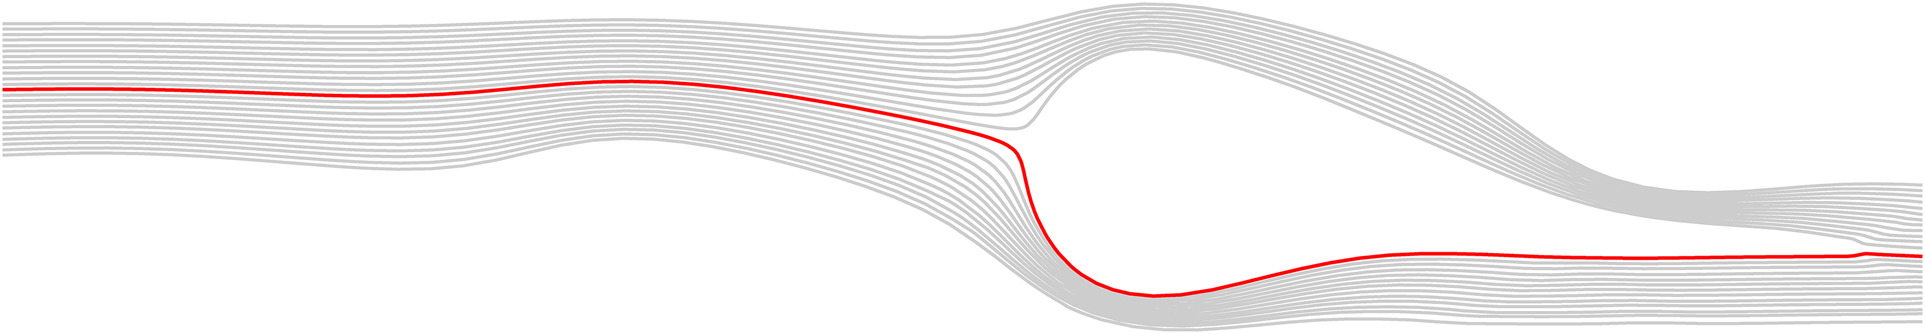
As far as the sidewalls are concerned, they were carefully designed to ensure that periodicity was attained, despite the reduced number of available channels. The lower side-wall is obtained simply by reproducing the pressure side of the blade from the throat to the trailing edge and carving the profile with a sufficiently large curvature radius to avoid any flow detachment at the inlet section. The upper side-wall was instead derived by merging the suction side of the blade to the flow streamline extracted from the numerical simulations previously performed on the optimized blade geometry. Such streamline is depicted in Figure 2 and it can be compared to the upper-wall shape in Figure 1, where the addition of a large fillet is present at the inlet section to avoid separation.
Once the cascade and the sidewalls were defined, a 2D CFD simulation of the flow across the complete test section was carried out to investigate the obtained periodicity. The simulation was performed in design conditions and periodicity was assessed by extracting several quantities, such as entropy and Mach number, from the measuring line and verifying that the peaks of their auto-correlations where spaced by a pitch distance. The auto-correlation assessment pointed out a very good periodicity, as reported in the related plot observable in (Manfredi et al., 2022), concluding the cascade design.
In order to experimentally investigate the flow, several measuring techniques were implemented. Inlet conditions, changing over time due to the blowdown nature of the facility, are measured in a plenum upstream the test section, where the flow can be considered uniform and characterized by a very low kinetic energy. Here a flush-mounted pressure transducer and two thermocouples (J and K type) are placed to measure total pressure and temperature respectively. Furthermore, four pressure taps (dark and light blue dots in Figure 1) are inserted in each of the two central channels. They are equispaced between the throat section and the blade trailing edge locus and allow to evaluate the pressure distribution along the expansion, to verify the in-channel periodicity and to assess the agreement with CFD simulations results. Since one of the main scopes of this work is the direct measurement of the cascade performances through the evaluations of losses, downstream the blades a tailored insert was designed to measure both static and total pressure. The former is measured by wall pressure taps, that are equivalent to the ones located inside the two main channels, characterized by a diameter of 0.3 mm and connected to locally mounted absolute transducers. The latter, instead, is obtained by the insertion of a L-shaped total pressure probe. This measuring device was purposely designed to overcome the challenges derived by four main requirements, namely, a satisfactory spatial resolution that enables to perform point-like measurements, an optimal dynamic response to accurately follow the blowdown process, an adequate structural stiffness to avoid oscillations even at high pressures and an appropriate stem configuration to ease the orientation of the probe head with the flow direction. The result of the design process is a total pressure probe that features an external diameter of 1.6 mm, reducing as much as possible its influence on the flow field, and an inner diameter of 1 mm, reaching a trade-off between spatial resolution and dynamic response. To achieve structural stiffness, the probe was manufactured though stereolithography (SLA), which allows to employ a hard material such as a cobalt-chrome alloy and to add miniaturized details in the stem to enable the accurate orientation of the probe with the flow. To measure the incoming flow total pressure, the probe is connected to a remote differential transducer through pneumatic lines, which are flushed with nitrogen during the experiments to avoid the local condensation of the organic fluid. The need of measuring both static and total pressures is due to the inevitable generation of a bowed shock in front of the probe head, due to the supersonic incoming flow. The probe measures, therefore, a post-shock total pressure, but, coupling this information with the static pressure from the relative tap, it is possible to retrieve the pre-shock total pressure solving the balance equations across the shock wave, as specified in section 3. In order to achieve a distribution of the losses across the two main channels, 21 measuring points (machined on five different inserts) were located along the two pitches, not uniformly spaced to enhance resolution in the wakes, as can be appreciated from Figure 1, where different circle colors designate taps belonging to different inserts. The expanded uncertainty of pressure measurements, slightly different for each sensor, is of the order of 0.1% of the transducer full scale. Temperature measurements, in turn, have an expanded uncertainty of about 1 °C. Lastly, optical visualizations are carried out through a double-passage schlieren device that allows to observe the flow-field density gradient. This measuring technique is of paramount importance as it allows to study the complex shock pattern established during the test allowing a direct comparison with the flow field obtained through CFD simulations.
Experimental campaign
This section reports results from the experimental campaign designed as previously described in Section 2. First of all, the validation of the test concept by exploring the cascade flow field through optical visualizations and static pressure measurements is hereafter described, focusing on the analysis of test repeatability, periodicity and consistency with CFD simulations results. In the frame of this preliminary investigation, the total pressure probe was not inserted and losses across the cascade not measured. After that, a series of tests were executed with the probe located in two significant measuring points, the wake of the central blade and the mid point of the lower channel. Even if losses were computed, a complete traversing of the cascade was not yet achieved, being the assessment of the probe influence on the resulting flow field the main purpose of these tests. In Table 1 the features of the main experiments later described are reported. The ranges included for Mach and Reynolds numbered are to be interpreted as from the start to the end of the test. Mach number is extracted from CFD, while isentropic quantities at the outlet and the blade chord are used to compute Re.
Table 1.
Experiments overview.
| Fluid | Initial pT0 (bar) | Initial TT0 (°C) | Outlet Mach | Re number | Probe positions |
|---|---|---|---|---|---|
| N2 | 15 | 10 | 2.65 | 12 M–4 M | No probe, 3D, 4D |
| MM | 13 | 235 | 2.08–2.15 | 20 M–5 M | No probe, 3D, 4D |
Nitrogen preliminary tests
Before starting the experiments carried out with MM, for which the cascade was originally designed, few preliminary tests were performed using nitrogen as working fluid. The aim of these tests, which are significantly faster to be executed as the plant is filled with nitrogen at ambient temperature, is to assess the experiments results repeatability and check the instrumentation and the acquisition system. Moreover, a first comparison with CFD calculations is relevant as well, since the simulations results with nitrogen in ideal gas conditions can be considered the most reliable ones. Here, attention will be focused on repeated tests carried out with an initial inlet total pressure of 15 bar, which is high enough to also verify the capability of the sealing systems to prevent leakages at pressures comparable with those envisaged for test with MM as working fluid.
Starting with a repeatability analysis on two exemplary tests, in Figure 3 the signals acquired from the 8 in-channels taps are plotted as ratios between the measured static pressure and the upstream total pressure (pT0), highlighting their evolution as function of pT0; notice that, since the total pressure is decreasing during the test due to the emptying of the feeding reservoir, the plots have to be read from right to left. The taps are numbered from the upstream to downstream and divided between upper and lower channel, as specified in Figure 1. As can be appreciated, the errorbars of the signals obtained from the two tests overlap at every measuring point, ensuring an excellent experiment repeatability. In addition, the plots show a perfectly flat trend during the test, which is expected when using nitrogen, since outlet Mach and therefore pressure ratios are only function of the area ratio and the specific heat ratio γ, which is constant for a perfect gas. The steep pressure ratio slope at low values of pT0 represents the final portion of the test; the expansion ratio is, in fact, constant for the majority of the test duration, where the the lower pressure in the downstream vessel causes the cascade outflow to be underexpanded, as soon as the downstream backpressure approaches the upstream total pressure, a series of normal shocks entering the cascade channels are formed. Specific attention was then devoted to the assessment of the cascade periodicity. This feature was already numerically analyzed through CFD in the design operating condition; here, as shown in Figure 4, pressure ratios from the upper and the lower channels are compared for one of the previously mentioned tests with nitrogen, characterized by different working fluid and boundary conditions with respect to the design case. It can be easily noticed that a more than satisfactory periodicity is still achieved in the described operating conditions, with the quantities coming from the two channels being overlapped up to the point when the re-entering normal shocks cross the pressure taps. The outcome of this analysis does not only confirm the appropriate reproduction of the annular cascade flow into the linear test section, but it also allows to extend the conclusions that are later derived by probe measurements in a single channel to the whole cascade.
Figure 3.
Nitrogen test repeatability analysis. In-channel pressure ratio p/pT0 vs upstream total pressure pT0.
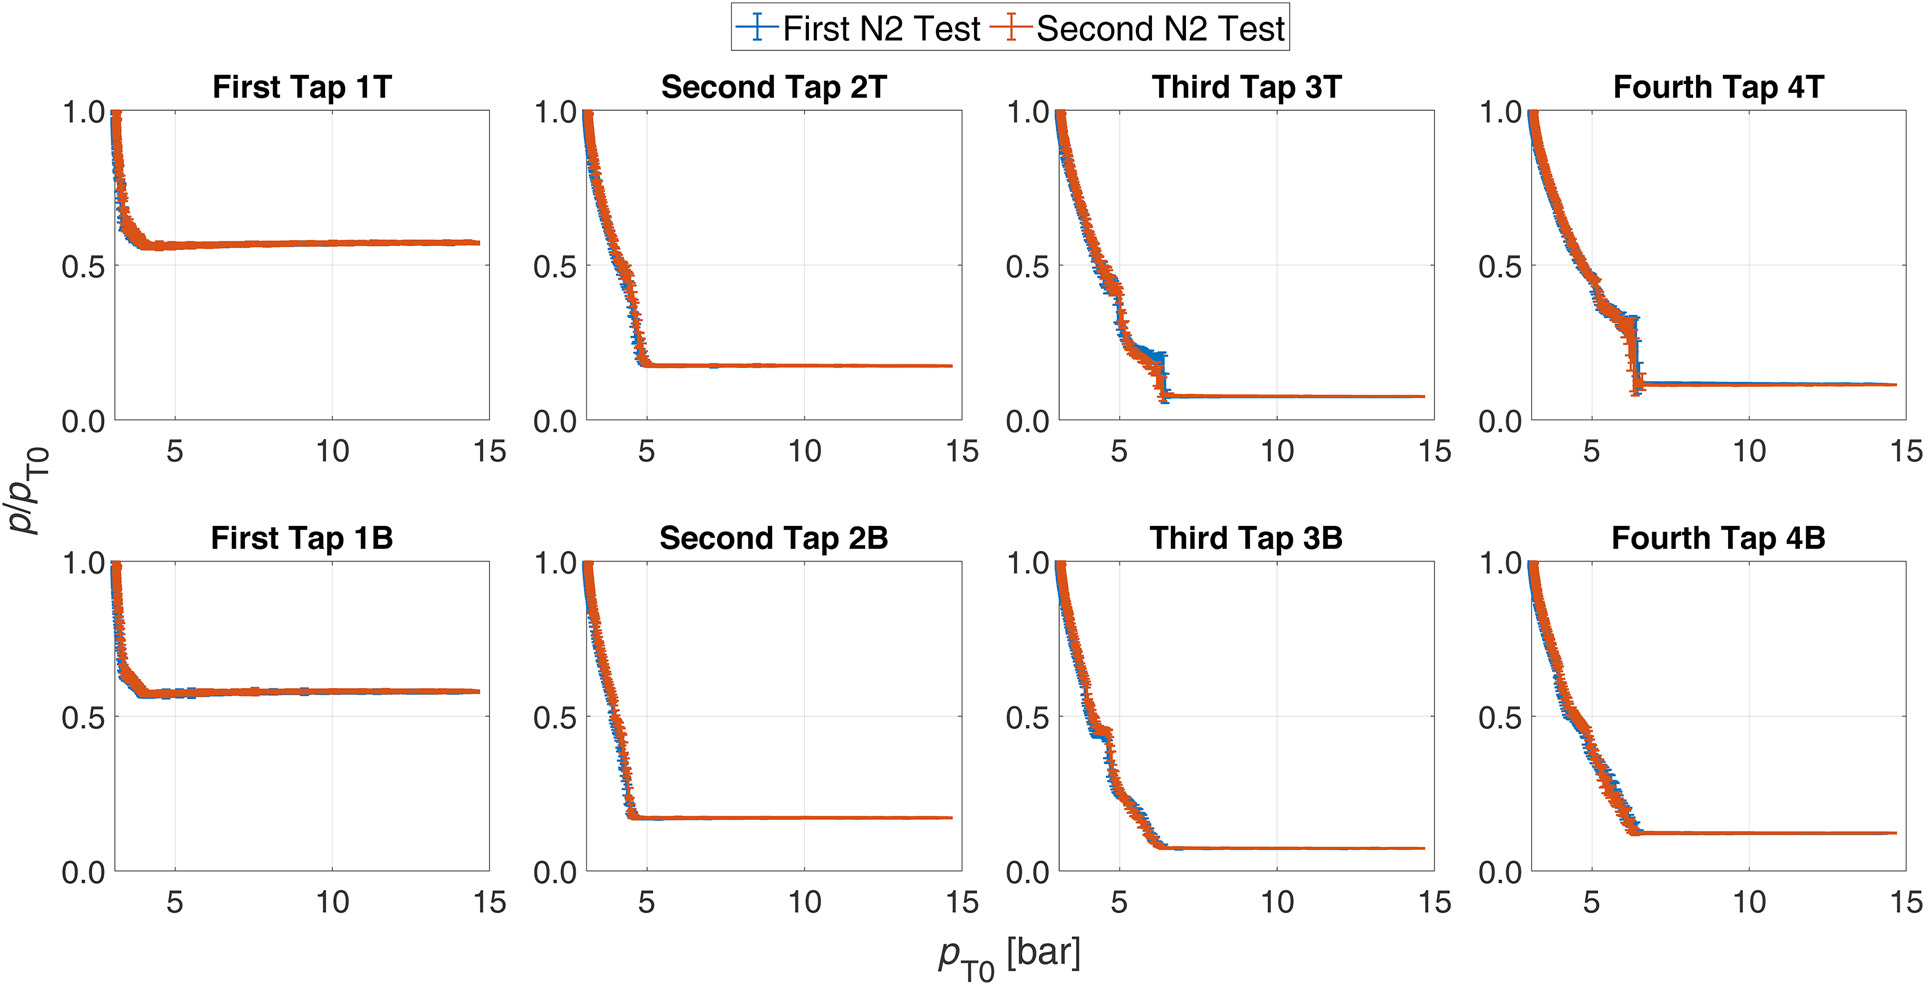
Figure 4.
Nitrogen test periodicity analysis. In-channel pressure ratio p/pT0 vs upstream total pressure pT0.
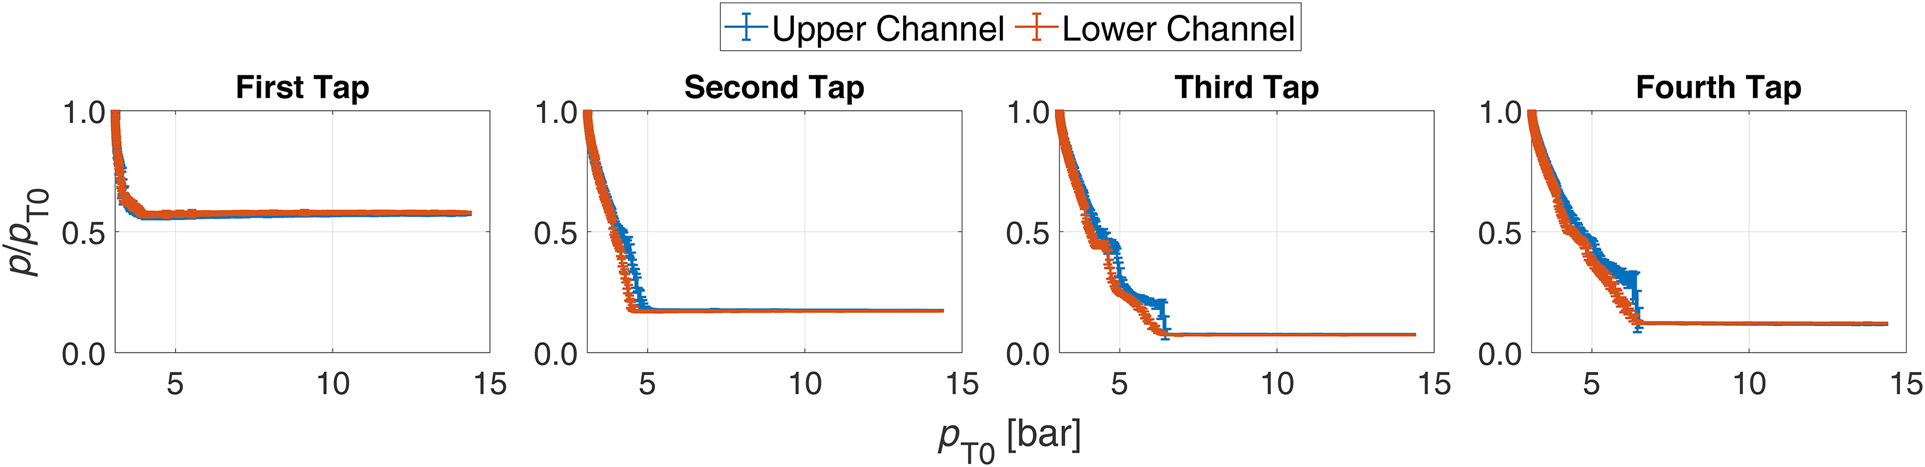
Figure 5 illustrates, then, a comparison between the expected flow field obtained from CFD simulation, represented through a contour of the density gradient, and the actual flow field extracted from the schlieren visualization at the timestep corresponding to pT0 = 7 bar. The simulation was performed with a 2D domain, representative of the blade midspan flow field, and the mesh was defined through Ansys ICEM, creating a multi-block structured grid featuring approximately 345 k cells and a dense o-grid region around the blades and the sidewalls to reach y+ ≤ 1, so to achieve a near-wall boundary layer resolution in combination to the selected k−ω SST turbulence model. Due to the nature of the experiment, the level of inflow turbulence was set as low as 1%.
Figure 5.
Flow field comparison between CFD simulation and schlieren visualization with pT0 = 7 bar. (a) CFD simulation - Density gradient contour. (b) Schlieren visualization of the flow field.
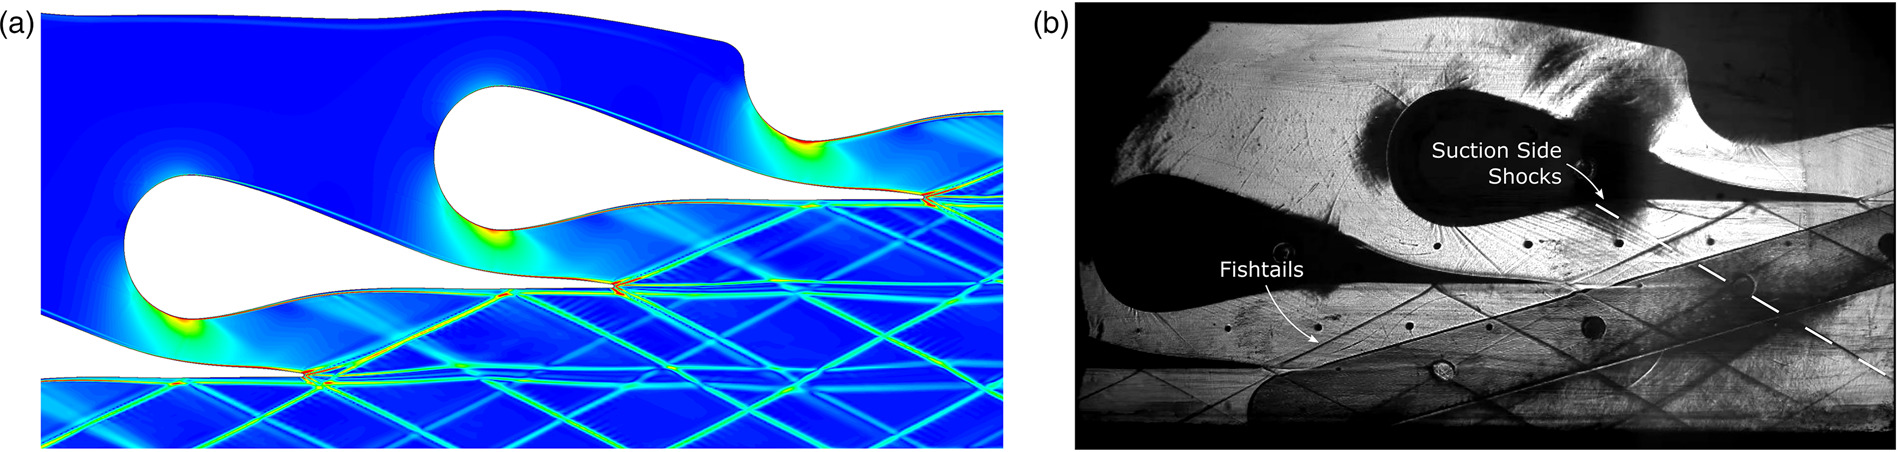
The influence of this value on the simulations results, however, is extremely limited, as the Reynolds number is around 10 million, making the flow fully turbulent from the beginning of the blowdown process. Moreover, a no slip boundary condition was imposed to all the walls, which were treated as perfectly smooth without specifying a level of roughness. This is justified by the fact that the endwalls have an irrelevant value of Ra, as the front wall is made of quartz glass, while a lapping process is required on the back wall to achieve a reflection of the light source needed for schlieren visualizations. Blades and sidewalls are, instead, characterized by a maximum Ra of 0.2 μm, whose potential influence on the evaluation of the total pressure losses would be irrelevant with respect to the deviation obtained by the measurement error propagation. The illustrated flow field is characterized by a complex pattern of shocks distinguishable into two main types, namely the blades fishtails originating from the trailing edges and the oblique shocks starting from the suction side of each blade in the region between pressure taps 2 and 3, where the profile curvature changes concavity. Then, since the flow is constrained by either blades or sidewalls, the shocks are reflected and interfere with each other, creating the displayed structures. The comparison between the CFD and the experimental flow field shows an excellent agreement as both the blades fishtails opening angles and the slope of the shockwaves originating from the suction sides are concerned, while small disagreement is present on the reflected shocks, possibly due to a non-perfect numerical prediction of the boundary layer development. This qualitative analysis is confirmed by Figure 6, where the pressure ratios of the in-channel signals are compared to the same quantity extracted from CFD simulation at different values of pT0, always reporting and excellent agreement. It is relevant to underline that, even if a careful assessment of the measurements uncertainties was carried out through the calibration of the instrumentation, the error bars are not reported here, as their amplitude would not be clearly appreciable. However, as an order of magnitude, the value of the error of the pressure ratios is always below 0.6%.
MM tests
After these encouraging results obtained with nitrogen, a set of experiments using MM as working fluid was carried out. Here, in addition to tests where only the in-channel pressures were measured assessing the cascade periodicity and the test repeatability, experiments were also carried out acquiring the static pressures along the downstream measuring line and specifically at the four positions marked with yellow circles in Figure 1. As far as the thermodynamic conditions are concerned, the initial upstream total pressure was fixed at 13 bar, with a total temperature of 235 °C, reaching ZT0 = 0.65 and a value of the fundamental derivative of gas dynamics of Γ = 0.619.
Focusing on the experiments carried out acquiring also the downstream pressures, Figure 7 shows, for two exemplary test repetitions, the pressure ratio distribution as function of the upstream pT0 along the upper channel taps and the four measuring points downstream the cascade, numbered, with reference to Figure 1, from bottom to top. It can be easily appreciated that also with MM as working fluid, a very good repeatability is attained, especially within the blade channels and in the third and fourth downstream measurement points.
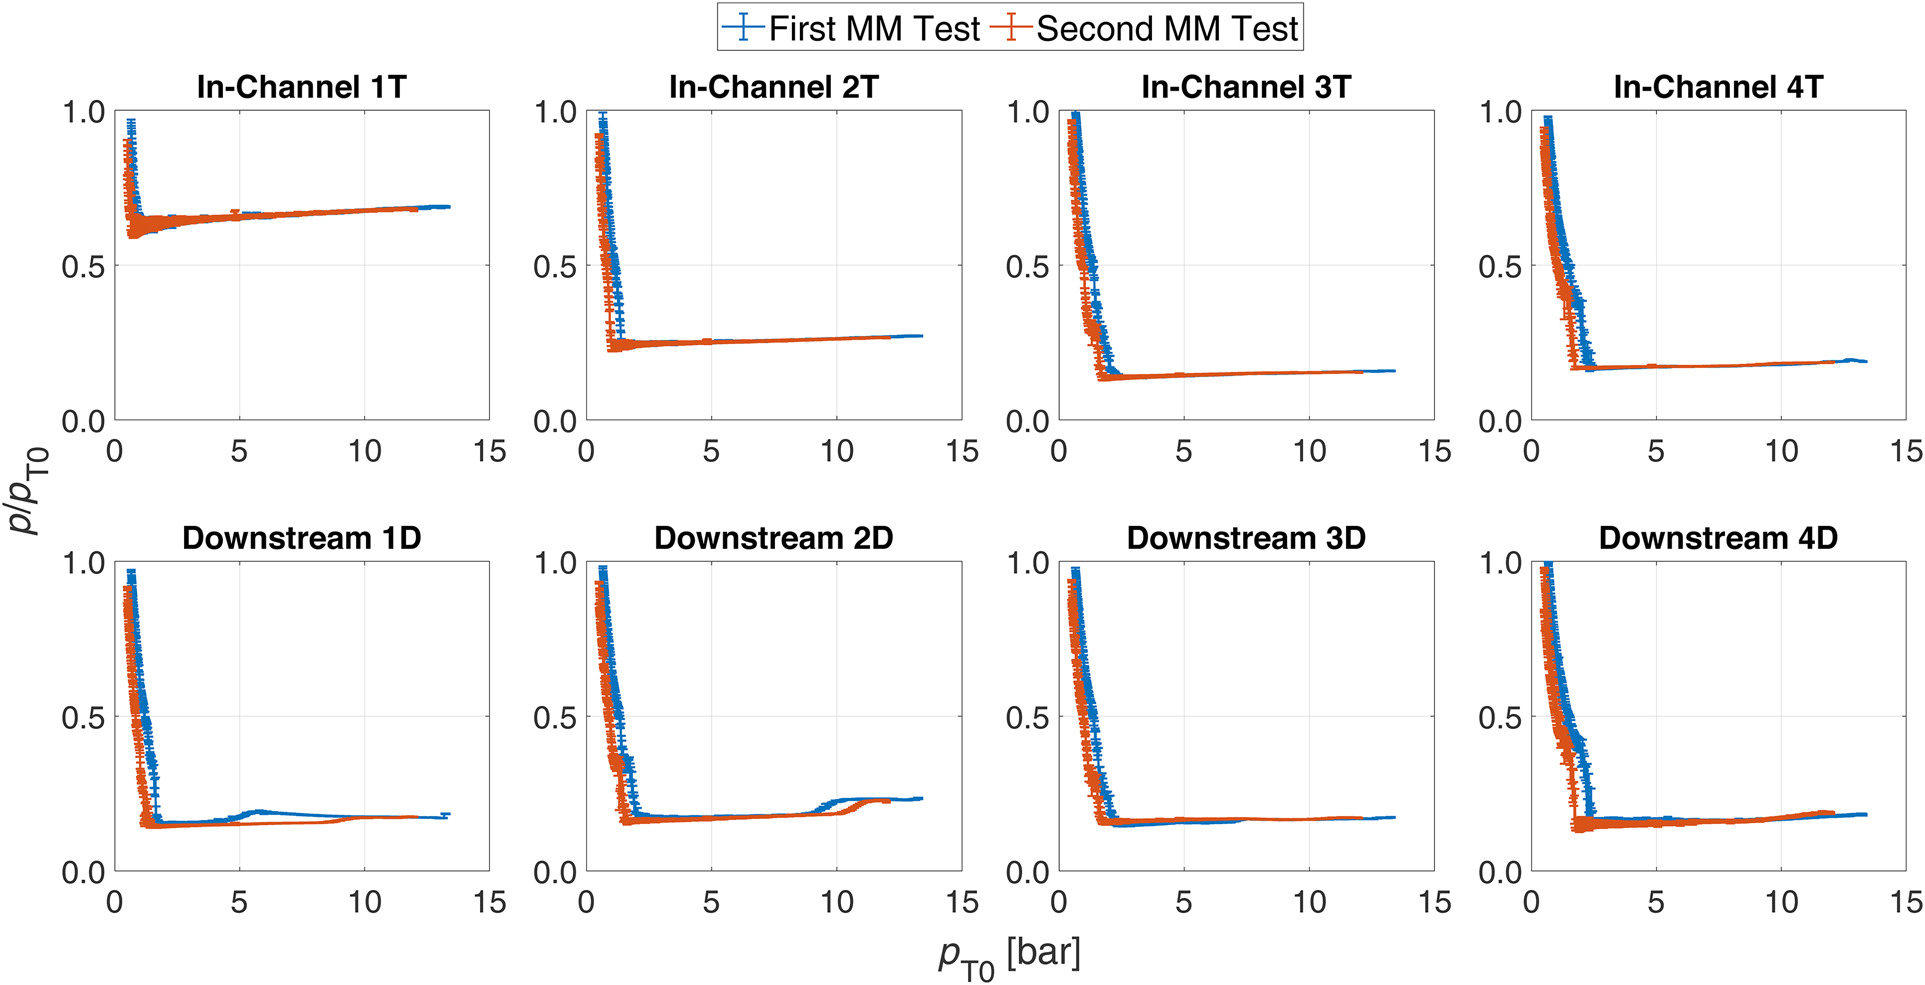
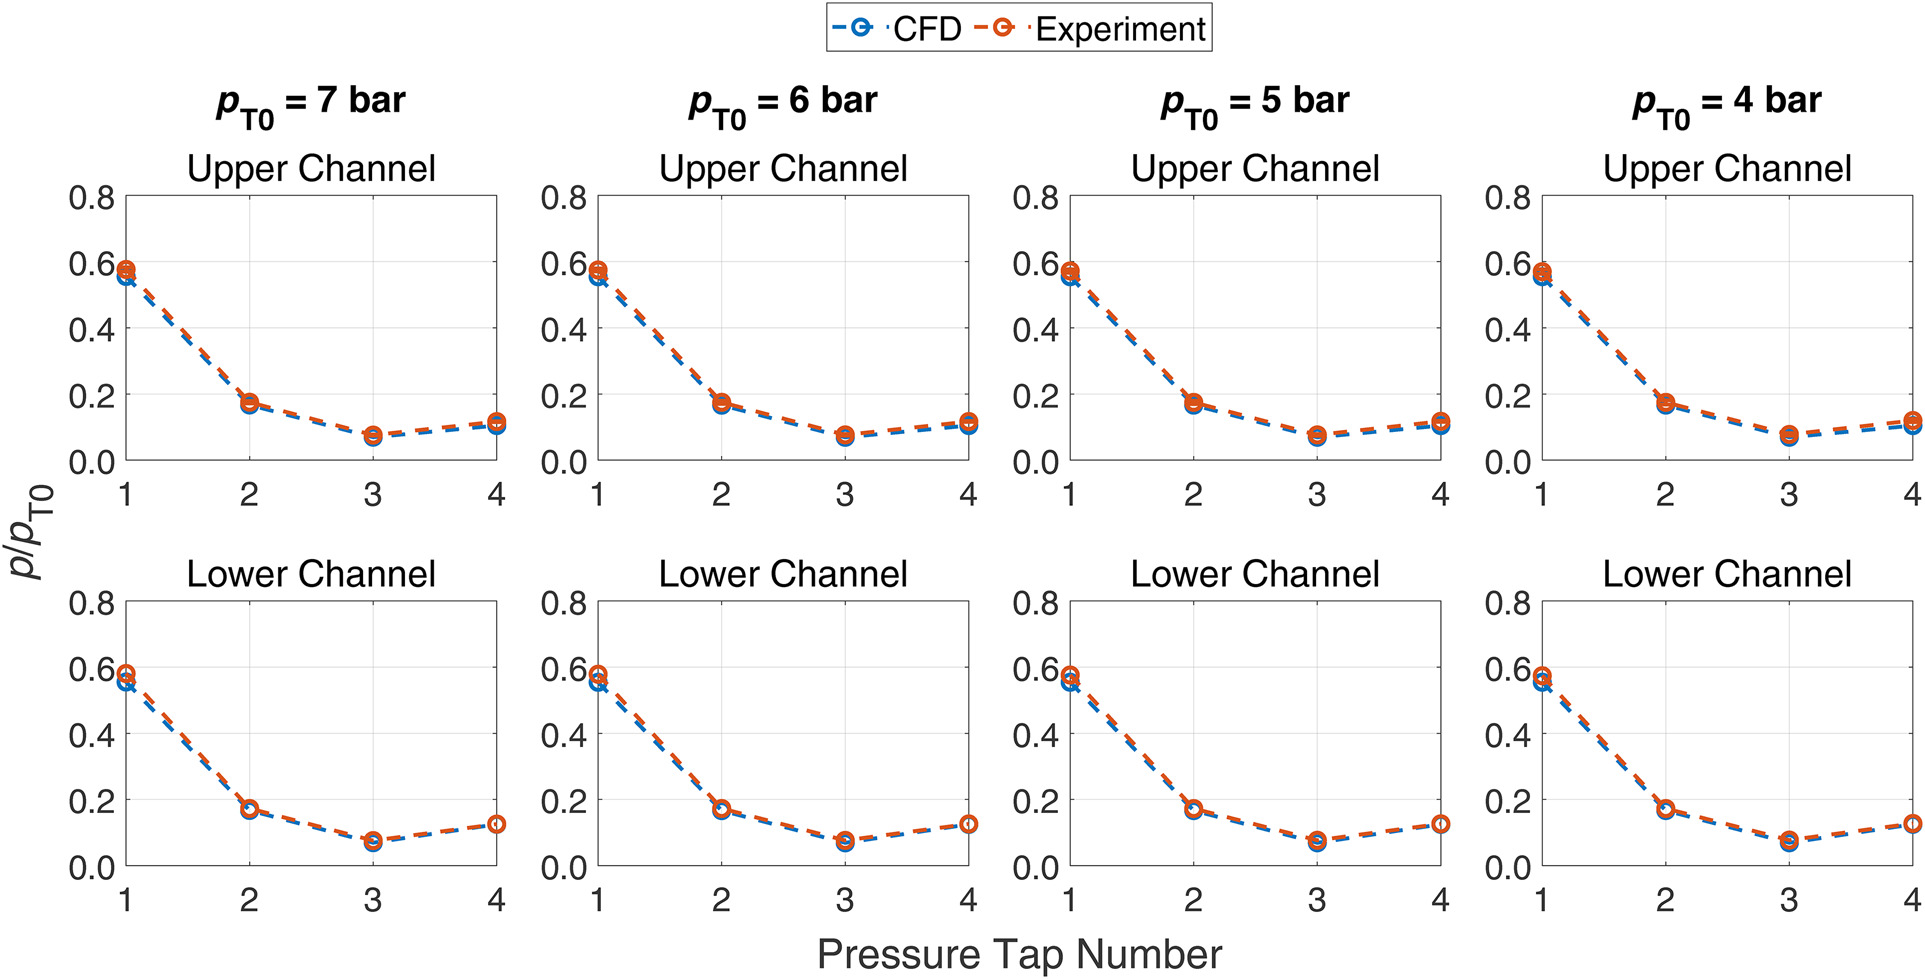
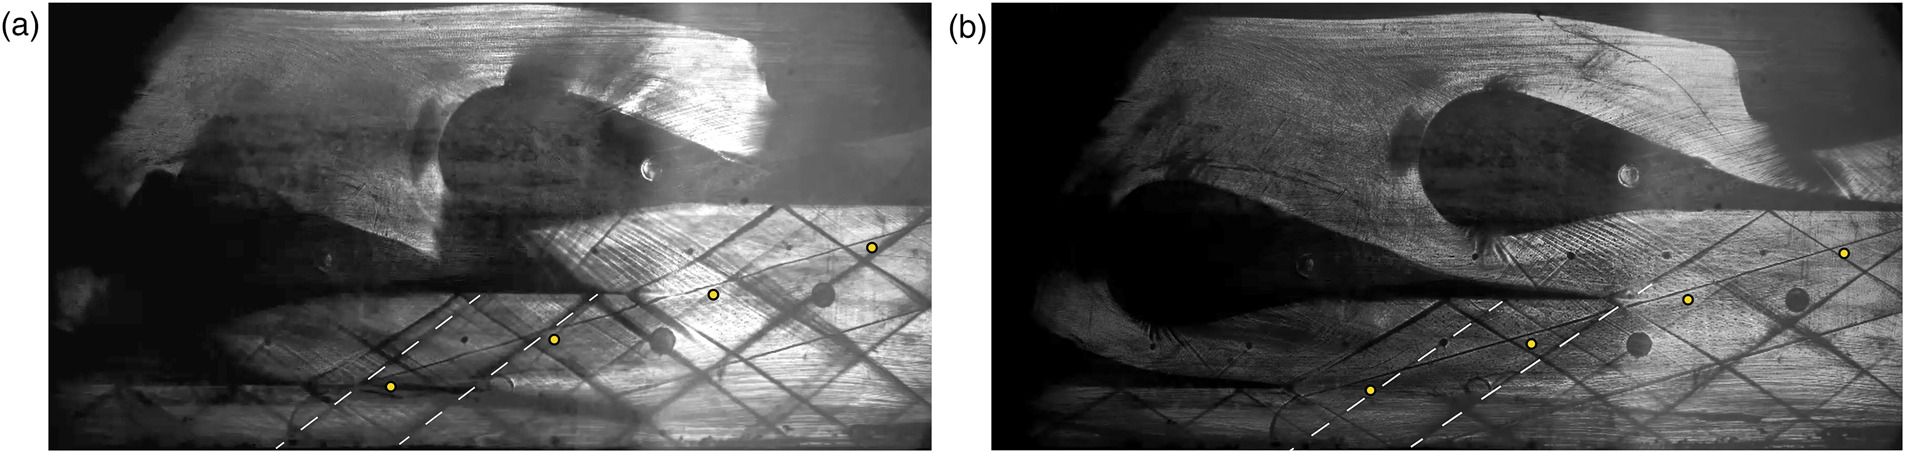
The pressure ratios are, correctly, no more constant throughout the blowdown process, since, in non-ideal conditions, the Mach number is also a function of the stagnation conditions and increases as the test proceeds, resulting in a progressive reduction of the fishtail slope and a decreasing trend of p/pT0. The variation from this trend that can be spotted in the first two downstream measuring points (Downstream 1 and 2 in Figure 7), is motivated by the presence of several shockwaves that, after being reflected by the lower sidewall, lie near the pressure taps, increasing the acquired pressure. Along the process pT0 decreases and the fishtails angles are reduced, therefore the shocks moves away from the tap location, which suddenly detects a pressure reduction. Such evolution of the flow field can be observed in Figure 8a and b, where two frames from the schlieren visulizations when pT0 = 10 bar and pT0 = 4 bar are reported. The four pressure taps downstream the cascade are highlighted in yellow, while white dashed lines are superimposed over two shock reflections to better depict the flow field differences in two distinct moments of the experiment and the effect of the shockwaves on the pressures acquired by the measuring points closer to the lower sidewall. This phenomenon explains the peculiar trends reported in Figure 7, and also indicates a non perfect repeatability, as the specific shock pattern and boundary layer evolution are highly sensitive to operating conditions. Nonetheless, the experimental data show a very good agreement with CFD simulation results. The latter were, as for nitrogen tests, performed through a 2D analysis representative of the midspan section, implementing, via Look-up Tables, state-of-the-art model for MM (Thol et al., 2016), to correctly reproduce the non-ideal thermodynamics of the gas. Figure 9 reports the comparison between the in-channel pressure ratios obtained through experiments and numerical simulations at four different upstream conditions.
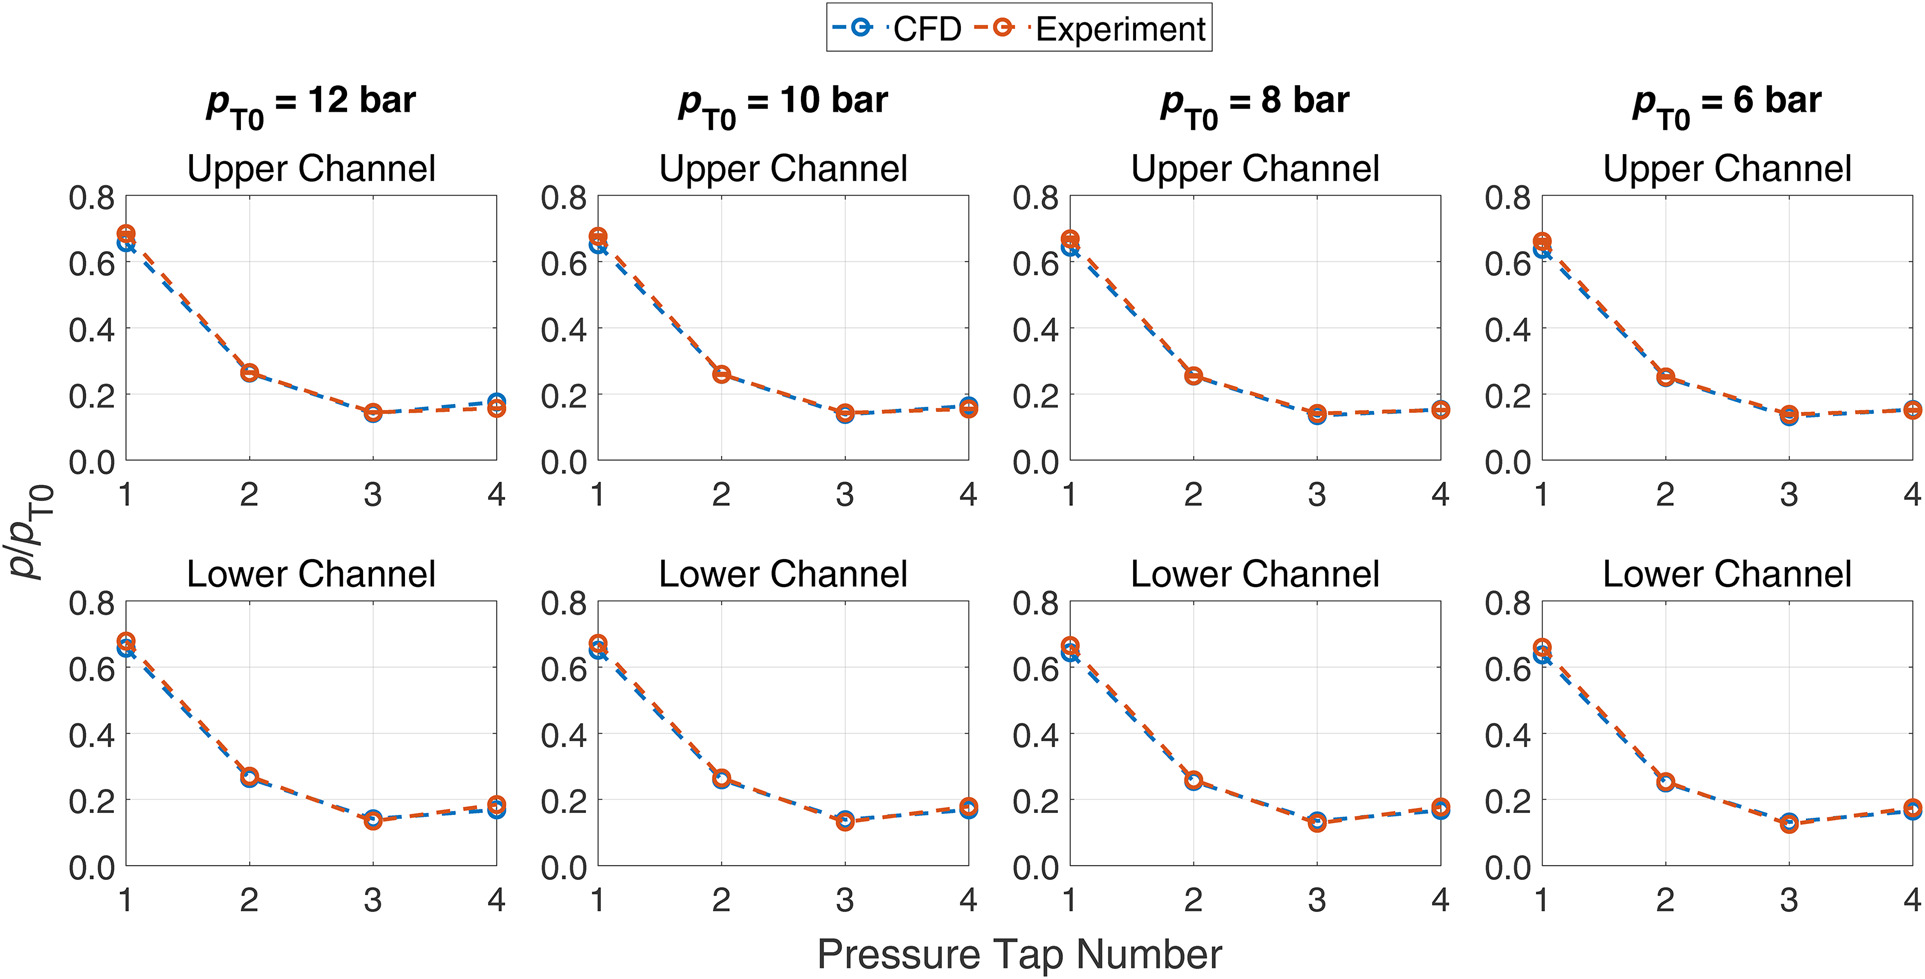
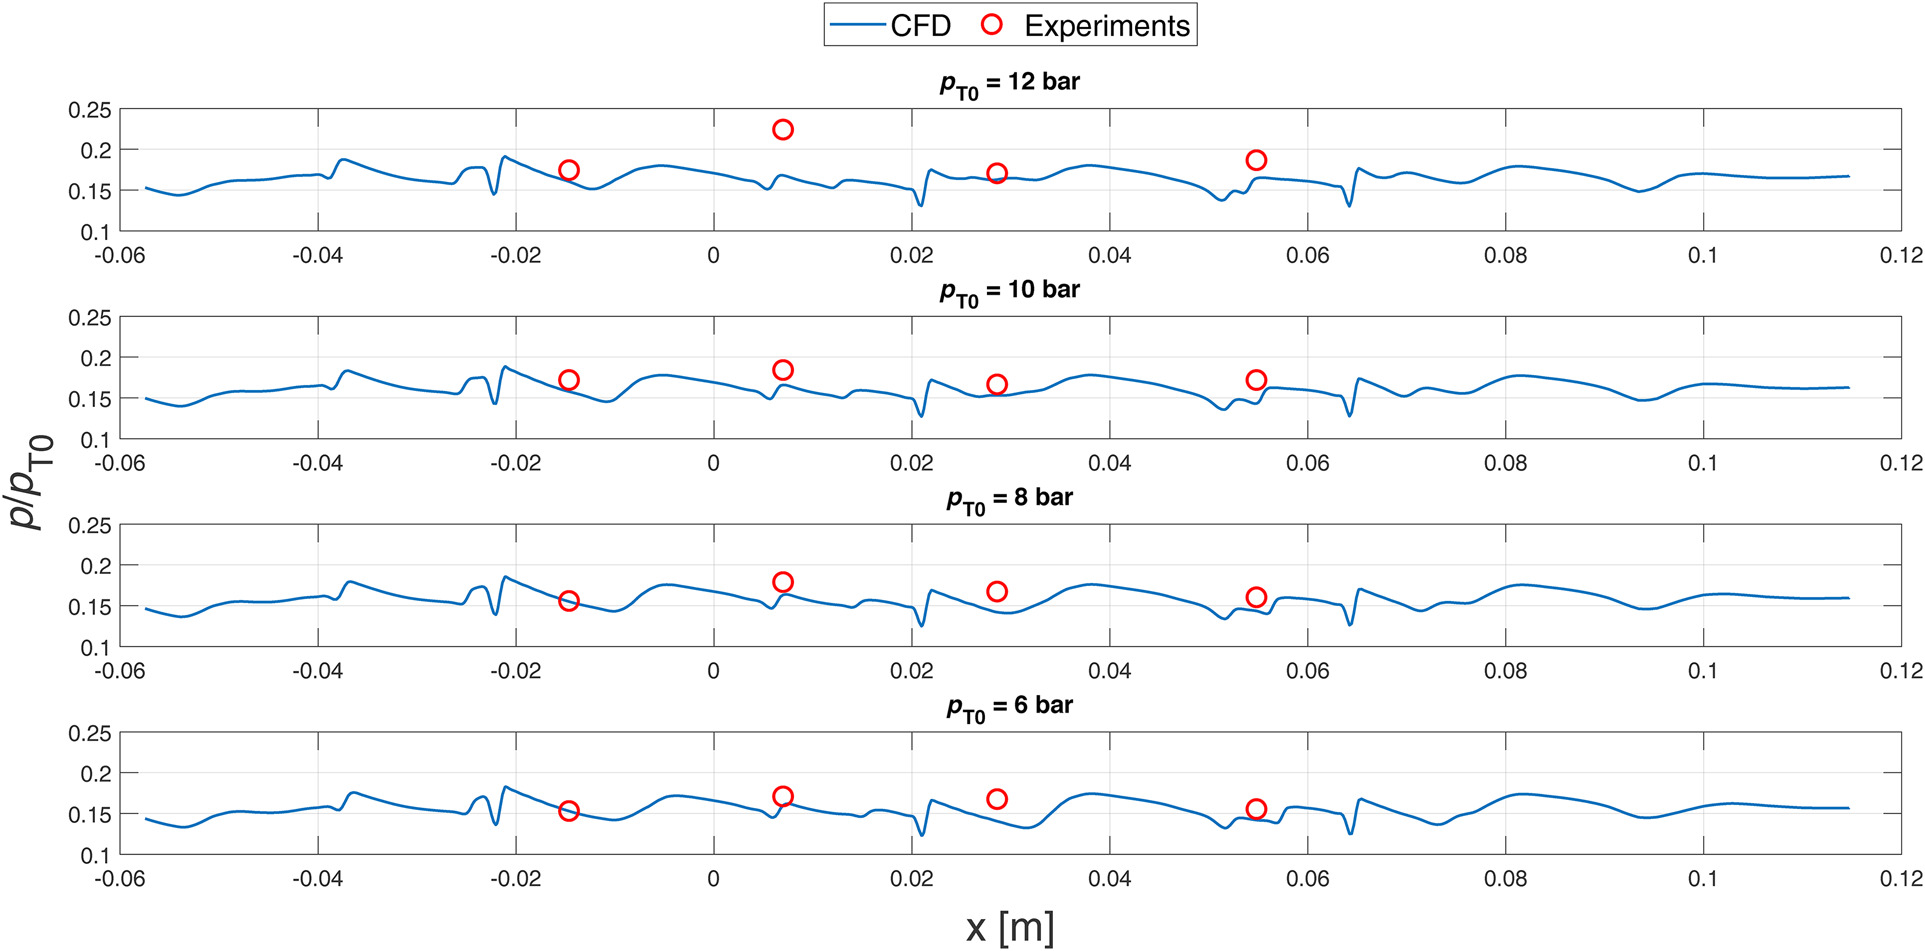
As can be noticed, the plots corroborate the results discussed so far, showing a very accurate CFD prediction of the experimental data, with only limited differences in the fourth pressure tap of the higher channel at the highest considered pressure, that, as observable in Figure 8, is affected by the shock reflection from the lower wall at high upstream total pressures. A similar comparison is also reported in Figure 10, where the pressures acquired in the four downstream taps are compared to the ones expected from CFD simulations.
Figure 10.
MM tests - Downstream line compared to CFD simulations results. The direction of measurement line is reported in Figure 1.
Probe tests
In this last section, experiments carried out with the total pressure probe inserted in the test section are described. As anticipated, the main purpose of these sets of tests is not yet the derivation of the complete loss profile downstream the cascade traversing the probe across all the designed measuring points. These experiments, instead, mainly serve to evaluate the potential interaction of the flow with the inserted probe, verifying the absence of a flow field perturbation and the validity of the normal-shock assumption at the front of the probe head. For this reason, the tests were carried out placing the probe in the two most meaningful locations, that are the wake downstream the central blade trailing edge, where the largest losses are expected, and the mid point of the lower channel, representative of the free stream condition. The periodicity analysis previously described allows to extend the following results to the whole cascade. Also for these experiments, both nitrogen and MM were exploited as working fluids.
First of all, the effect of the probe insertion on the flow field is addressed, focusing on the tests carried out with the organic fluid. Figure 11 shows a frame of a schlieren visualization extracted from a test performed with the probe in the central wake, in the instant when pT0 = 10 bar and TT0 = 230 °C, reproducing conditions very close to the ones observed in Figure 8a.
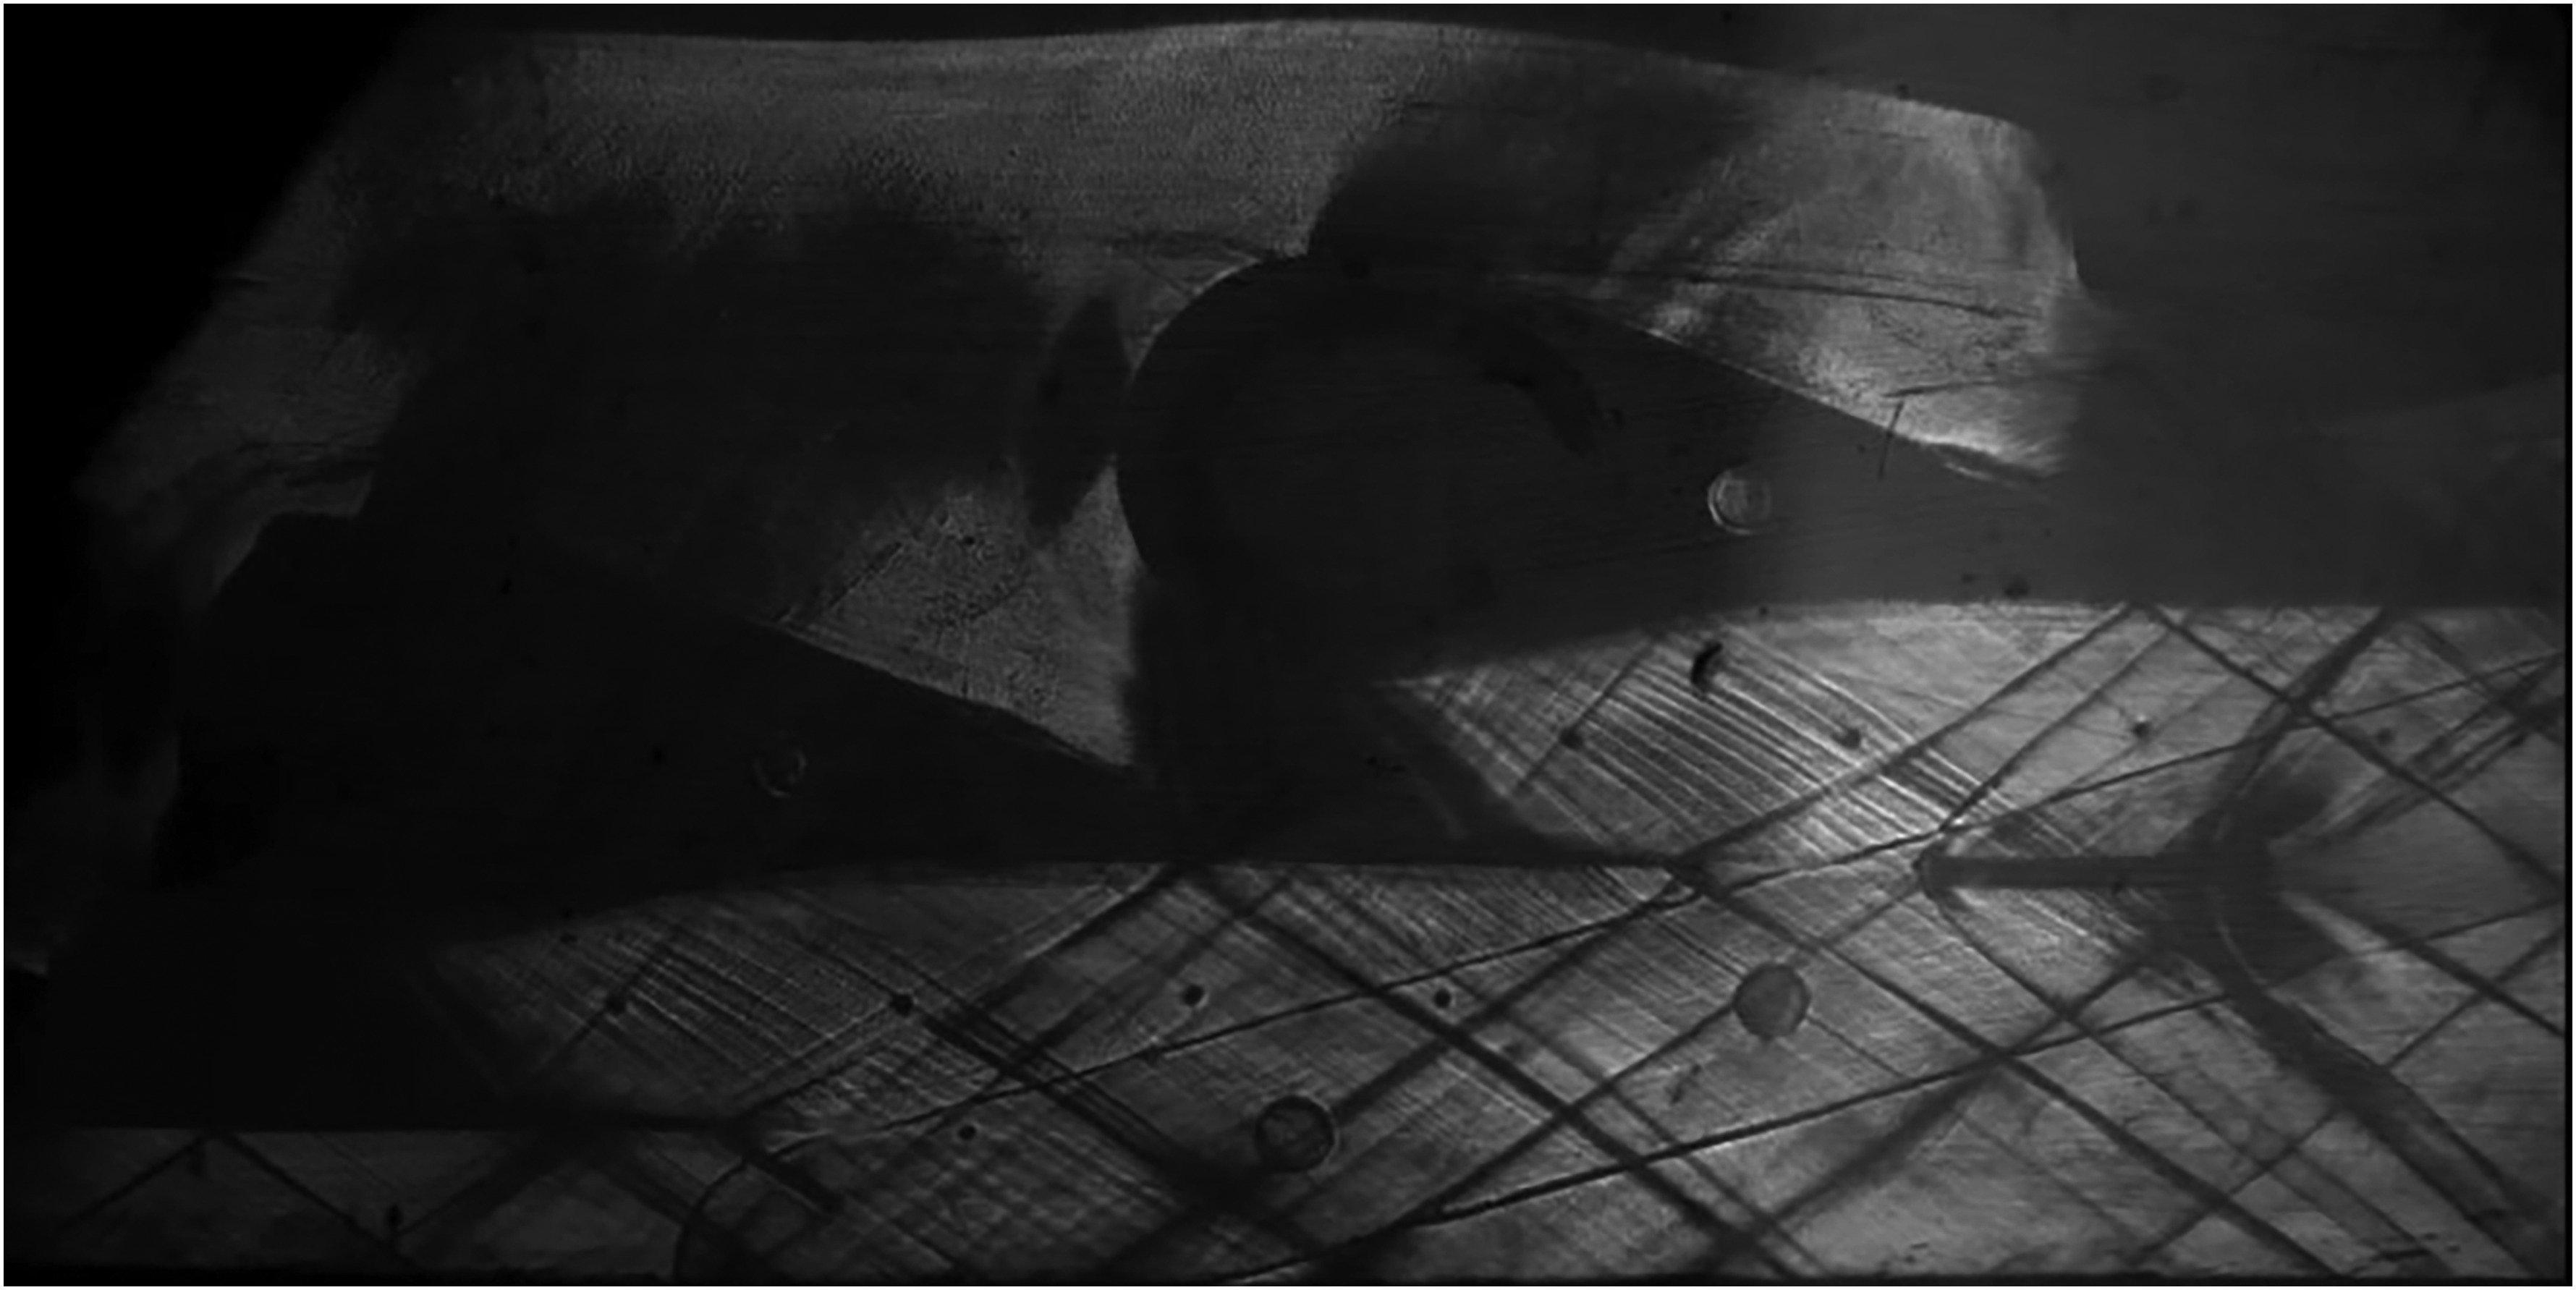
Comparing the two frames, it can be qualitatively assessed that the resulting flow field is not disturbed by the presence of the total pressure probe: the two shock patterns appear identical and the shocks originated in front of the probe head and stem do not interact with the fishtails or their reflections, which keep their original inclination. This outcome is of paramount relevance, as a larger fishtail angle would increase the pressure measured by the tap located before the probe-induced shock, altering the necessary quantities used to solve shock equations (reported in 1) and to retrieve cascade losses. Figure 12 provides an additional evaluation of the flow fields equivalence. Here the lower-channel static pressures from three different MM tests are compared, showing how the resulting pressure ratios remain constant whether the probe is absent, placed in free stream or in the wake. The green line plotted in the last two charts represents the ratio between the post probe-induced shock total pressure and the upstream one.
Figure 12.
Comparison of static-to-total pressure ratios in MM tests without and with the total pressure probe inserted.
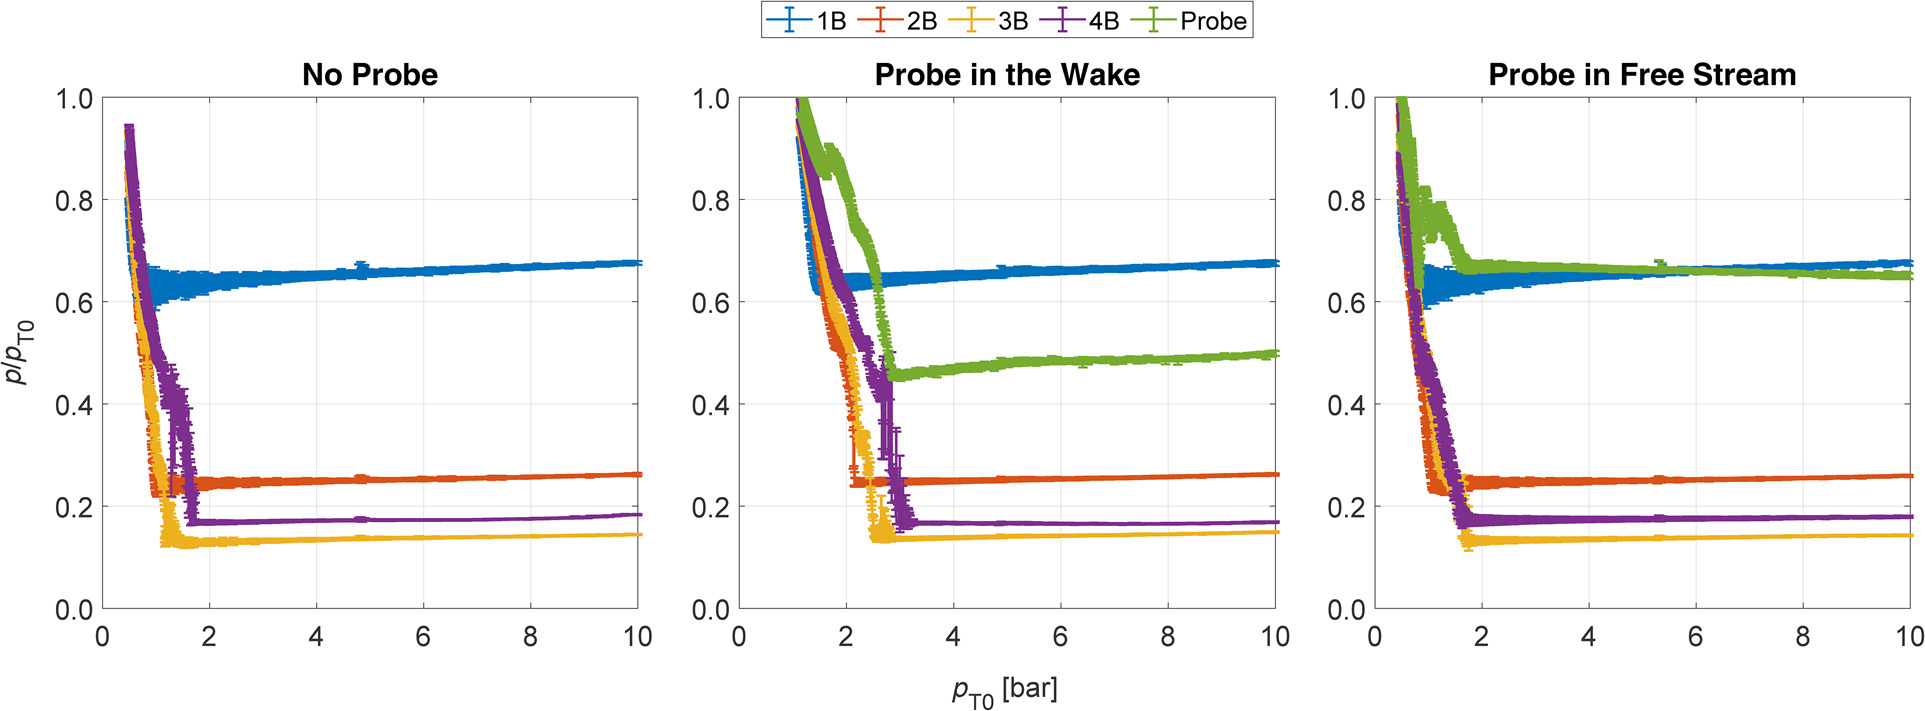
This quantity is, of course, function of the losses in the considered measuring point, showing therefore higher values in free stream than in the wake. It is interesting, as well, to observe the different slopes between the signals reported by the probe located in the two positions: in the free stream case, the trend is almost flat, resembling the one of the most downstream tap (in yellow); in the wake, it noticeably decreases across the test, with a slope that is close to the one reported by the most upstream pressure tap (in blue). This feature highlights that the losses in the free stream are expected to be almost constant during the blowdown process, while the non-ideal behaviour of the working fluid affects more the losses in the wake, whose value is strongly dependent on the upstream conditions.
Having confirmed the equivalence of the flow field with the probe inserted into the cascade, the measurements obtained from the nitrogen tests were utilized to solve the shock balance equations and calculate non-dimensional losses. The choice of focusing on nitrogen experiments for this analysis is motivated by the fact that, even if the cascade was not designed to work with this working fluid, the behavior of nitrogen as an ideal gas enables a reliable comparison between computed losses and CFD data, as it is required to validate the normal-shock assumption in front of the probe head. To compute the total pressure losses, the employed measured quantities are the total upstream conditions TT0 and pT0, the pre-shock static pressure p1 and the post-shock total pressure pT2 obtained by the probe. It is relevant to underline that, though the pre-shock pressure p1 is extracted from a wall tap, the pressure is assumed to be uniform across the span, as confirmed by an appropriate CFD analysis. From the mentioned quantities, the set of equations reported hereafter could be solved to numerically retrieve the value of the total pressure downstream the cascade. These equations represent, respectively, mass, momentum and energy balances across the shock, the necessary equations of state to obtain the needed quantities from the measurements, and the definition of total enthalpy, coupled with its conservation across an adiabatic flow.
(1)
Given the necessity to solve implicit functions and to use equations of state specified in thermodynamic libraries, the implementation of an effective method for error propagation becomes crucial. While problems of these kind are typically addressed using Monte Carlo simulations, this method comes with an extremely expensive computational cost, requiring, for this set of variables, up to 106 trials to achieve a 95% confidence interval (GUM, 2004). To overcome this challenge, a metamodelling technique, namely the Polynomial Chaos Expansion (PCE), was employed. The fundamental principle behind PCE involves the definition of a functional approximation of the computational model via its spectral representation, utilizing a basis of polynomial functions to create a surrogate of the original problem (Marelli et al., 2022). This surrogate is significantly faster to evaluate, reducing the computational time for the error propagation from around 9 hours to 2 minutes for the post-processing of a nitrogen test.
In Figure 13 the results relative to an experiment carried out at high pressures with the probe located downstream the central wake are reported. Figure 13a shows the three measured pressures used for the described calculations, together with the computed value of pT1 and the consequent cascade total pressure difference. In Figure 13b, these quantities are translated into non-dimensional losses, computed as:
Figure 13.
Evaluation of the total pressure downstream the wake - N2 tests. (a) Measured and computed pressures. (b) Non-dimensional pressure losses.
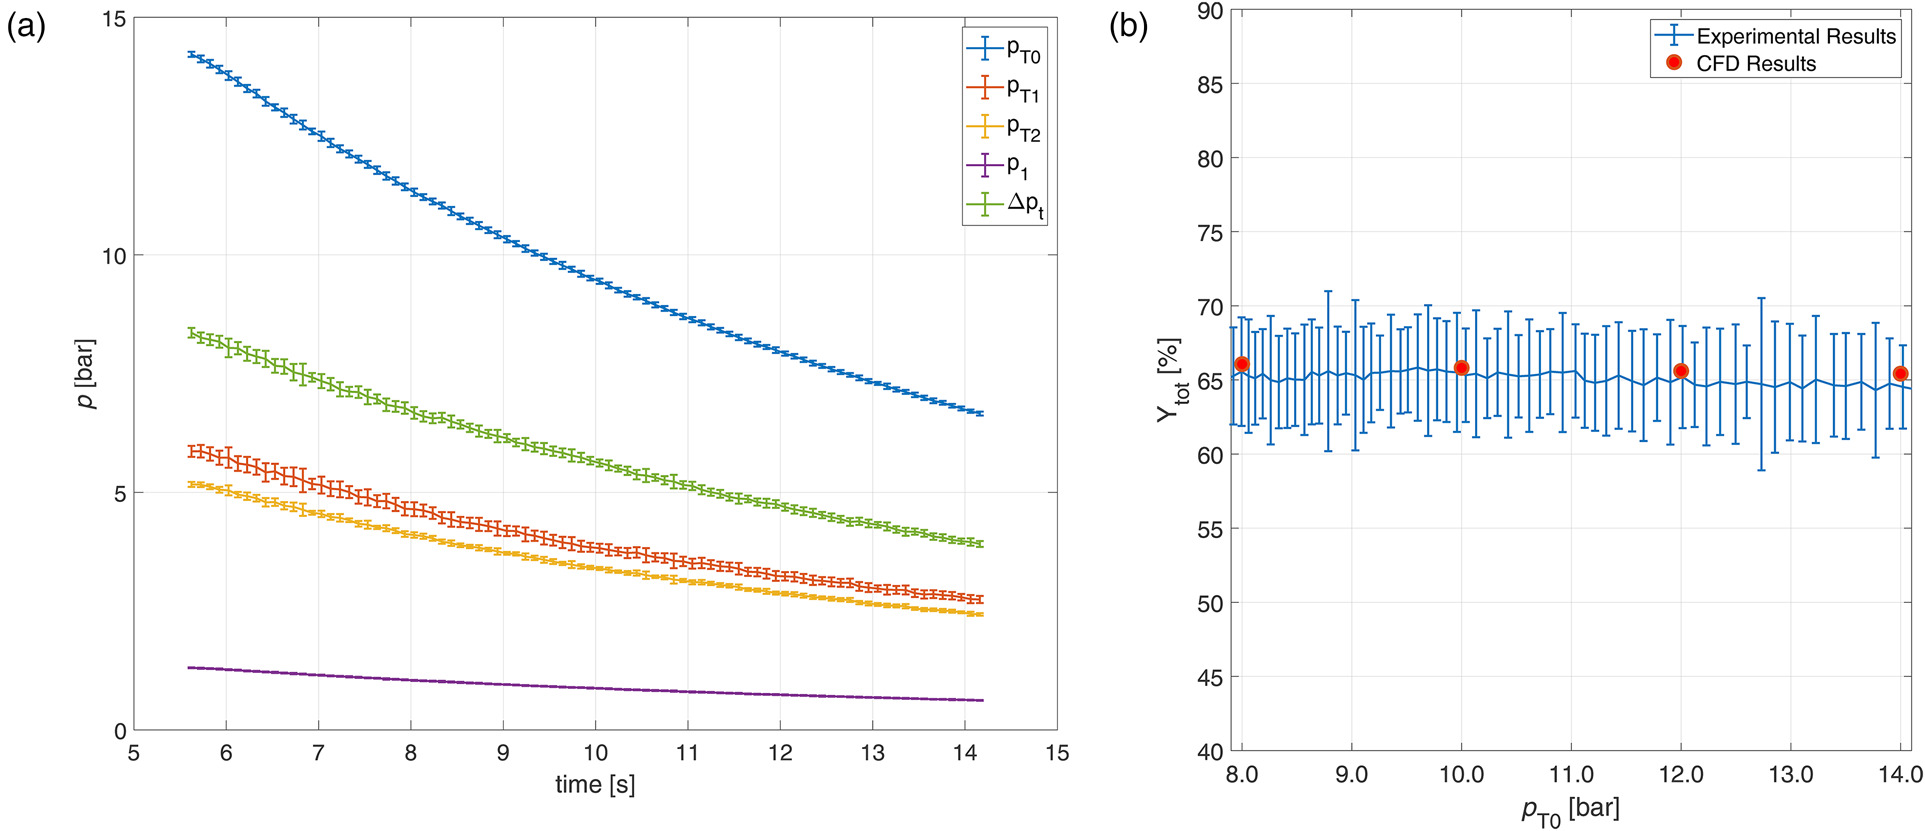
In the plot, four points extracted from CFD simulations carried out at different upstream total conditions are reported as well. Though the resulting propagated standard deviation shows moderately high values, it is important to recall that every error-bar can be interpreted as a Gaussian distribution with the most probable values around the central point. Therefore, an excellent agreement between experimental and numerical data can be deducted from the plot, confirming the validity of the test setup and of the assumption of normal shock in front of the probe head.
Conclusions
This paper reports implementation and results of an innovative experimental campaign on a supersonic turbine linear cascade for ORC applications, operating with the siloxane MM. A blowdown wind tunnel was exploited as test facility and the test section was carefully designed to include both the cascade and the measuring system. The latter was conceived to acquire the upstream total conditions, to evaluate the static pressure evolution through the blade channels and to compute the total pressure losses across the cascade measuring both downstream static and total pressures. Moreover, for a deeper investigation of the flow field, schlieren visualizations were performed during each experiment. The design process and the test assessment were tackled through an extensive exploitation of CFD simulations, which were mostly performed on a 2D domain representative of the midspan section, exploiting state of the art models to characterize the thermodynamics of MM. The aim of the experiments here presented was to fully characterize the flow field across the cascade, comparing experimental data with CFD simulations results, and to verify the consistency of the flow field in presence of the total pressure probe downstream the cascade. A set of preliminary tests were performed with nitrogen, to examine the measurement strategy and to carry out a first analysis through experiments which are less time consuming and comparable with simulations based on the ideal gas thermodynamics. Excellent results were found in terms of both test repeatability and cascade periodicity. Moreover, the comparison between the measured and the CFD simulated flow field showed very good agreement, through both in-channel pressure acquisitions and density gradient visualizations. The main experiments were then carried out with MM as working fluid, exploring expansions processes characterized by initial values of ZT0 as low as 0.65. Outcomes similar to ones described for nitrogen were achieved, confirming the excellent test repeatability and the good prediction of the flow field through CFD simulations. A second analysis was then executed, with both working fluids, inserting the total pressure probe downstream the cascade in the two most representative measuring points, namely the central blade wake and the centre of the lower channel. These tests allowed to achieve two important results. Through MM experiments, the lack of influence of the probe on the flow field was assessed, showing the equivalence of the measured pressures with and without the probe. Nitrogen tests were, additionally, employed to verify the assumption of normal shock in front of the probe head: solving the shock balance equations, the measured quantities allowed to retrieve the total pressure losses across the cascade. These were compared, in the wake position, to CFD simulation results, showing excellent agreement.
In conclusion, the results here reported are considered fully satisfactory, confirming the validity of the design of experiment and providing interesting insights on the non-ideal gas behaviour during the expansion process. These experiments establish a solid basis on which it is possible to build a full campaign for cascade loss characterization.