
Introduction
Currently many researchers investigate power cycles with supercritical CO2 (sCO2) as a working fluid. Several publications suggest that these power cycles have potential to achieve higher efficiency and flexibility while featuring simpler and more compact cycles (e.g. Ahn et al., 2015; Brun et al., 2017). Moreover, they can be used for various applications, such as waste heat recovery, fossil fuel or solar power plants. One special application, however, is the use in a novel emergency heat removal system for nuclear power plants. This system is called the supercritical CO2 heat removal system (sCO2-HeRo) and consists of a simple Joule cycle. It is retrofittable to existing nuclear power plants and removes residual decay heat from the nuclear core in case of a station blackout (Benra et al., 2016). The experimental observations serving as foundation for the analysis in this paper are made in the sCO2-HeRo and the follow-up sCO2-4-NPP project. For this system, the compactness and simplicity of the cycle are key requirements and lead to the application of sCO2 as working fluid. Increased simplicity means the reduction or simplification of the auxiliary systems, such as the inventory control for regulating the mass of CO2 in the cycle. Simplification is also interesting for sCO2 power cycles in other applications as it may be a driver for the reduction of system costs. Furthermore, it is important to understand cycle behavior when inventory control fails. Therefore, it is also interesting for large power systems such as the one investigated in the sCO2-Flex project. Both, the benefit for the simplification of sCO2 cycles and for the failure analysis of the inventory control serve as motivation for the following analysis. It studies the effect of the change of static compressor inlet temperature by adjusting the cooling power on its inlet pressure with constant mass of CO2 in the cycle.
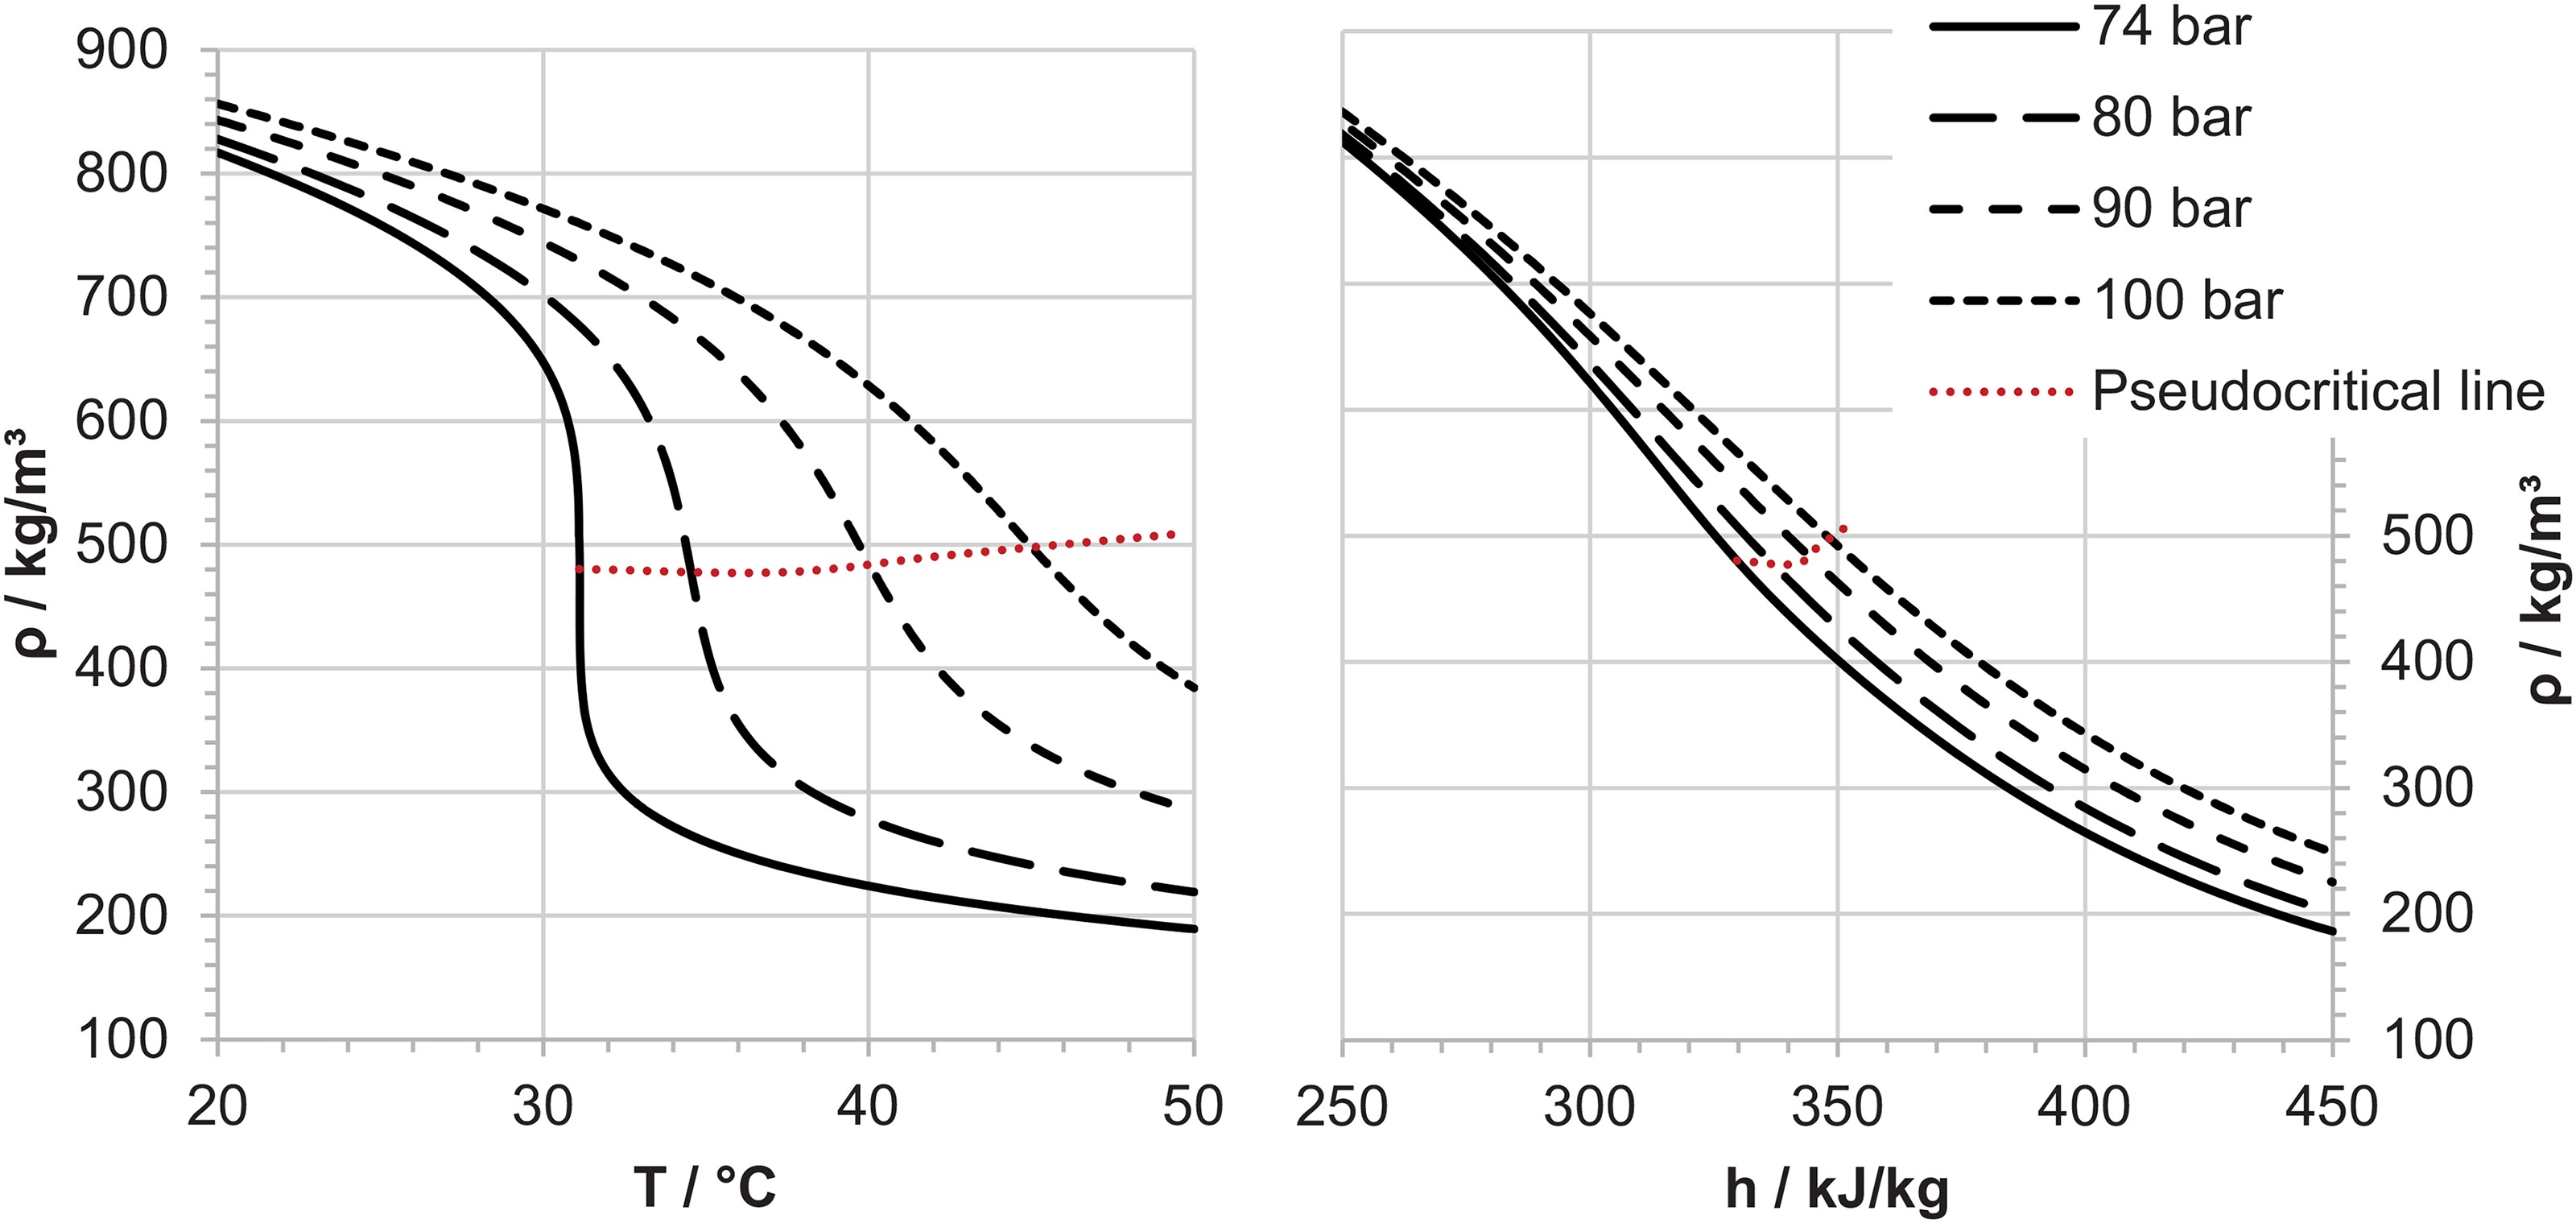
The sCO2-HeRo system is also supposed to be robust while the compressor works close to the (pseudo-)critical point. Close to this point, which is the intersection of an isobaric (black) and the pseudocritical (dotted red line) line in Figure 1 defined by the local maxima of isobaric heat capacity, sCO2 shows large gradients of e.g. density upon static pressure and temperature (Figure 1, left). Therefore, it is crucial to understand the influences on the compressor inlet conditions which determine the performance of the compressor. In a previous study, the authors showed that even though large gradients in e.g. density upon static pressure and temperature in the pseudocritical region exist (Figure 1, left), a change of cooling power will not lead to sudden changes of compressor inlet density. That is presented in Figure 1 on the right (Hacks et al., 2019a). Because of the almost linear trend of specific enthalpy and density even in the pseudocritical region, there are no sudden changes of compressor pressure ratio. However, the previous study is limited to a shift of compressor inlet conditions at constant pressure only. This requires a well-designed inventory control or a certain volumetric design meaning the distribution of components’ internal volumes within the cycle. Thus, this study will expand the previous knowledge by analyzing the compressor inlet pressure for a change of its specific inlet enthalpy with a constant mass of CO2 in the cycle. It is based on the observation that during compressor tests in two different sCO2 cycles a change of cooling power in the HeRo loop caused a substantially larger pressure drop in the cycle than in the SUSEN loop. Since in both cases only the cooling power was varied, it is postulated that the change of the compressor inlet pressure with respect to its static inlet temperature (or specific inlet enthalpy) depends on the different volume ratio of the cold and hot side in the cycles.
Figure 1.
sCO2-properties – density as function of static temperature (left) and specific enthalpy (right) (Hacks et al., 2019a) with separation in liquid-like and gas-like region by the pseudocritical line (Kiran et al., 2008).
Model of closed sCO2 loops
The previous section points out that the change of the compressor inlet pressure depends on the volumetric design. This is true for any closed cycle (Vtot = const.) with constant internal mass of the working fluid (mtot = const.). To visualize this, Figure 2 shows a simple sketch of a cycle with condition 1 being the compressor inlet and condition 3 being the turbine inlet. Further it presents a simple volumetric model dividing the cycle into a hot and a cold volume. Following this approach the mass distribution only depends on the size and the conditions in these two volumes. Thus, the conservation of mass in the whole system is expressed by its volumes V and mean densities
Figure 2.
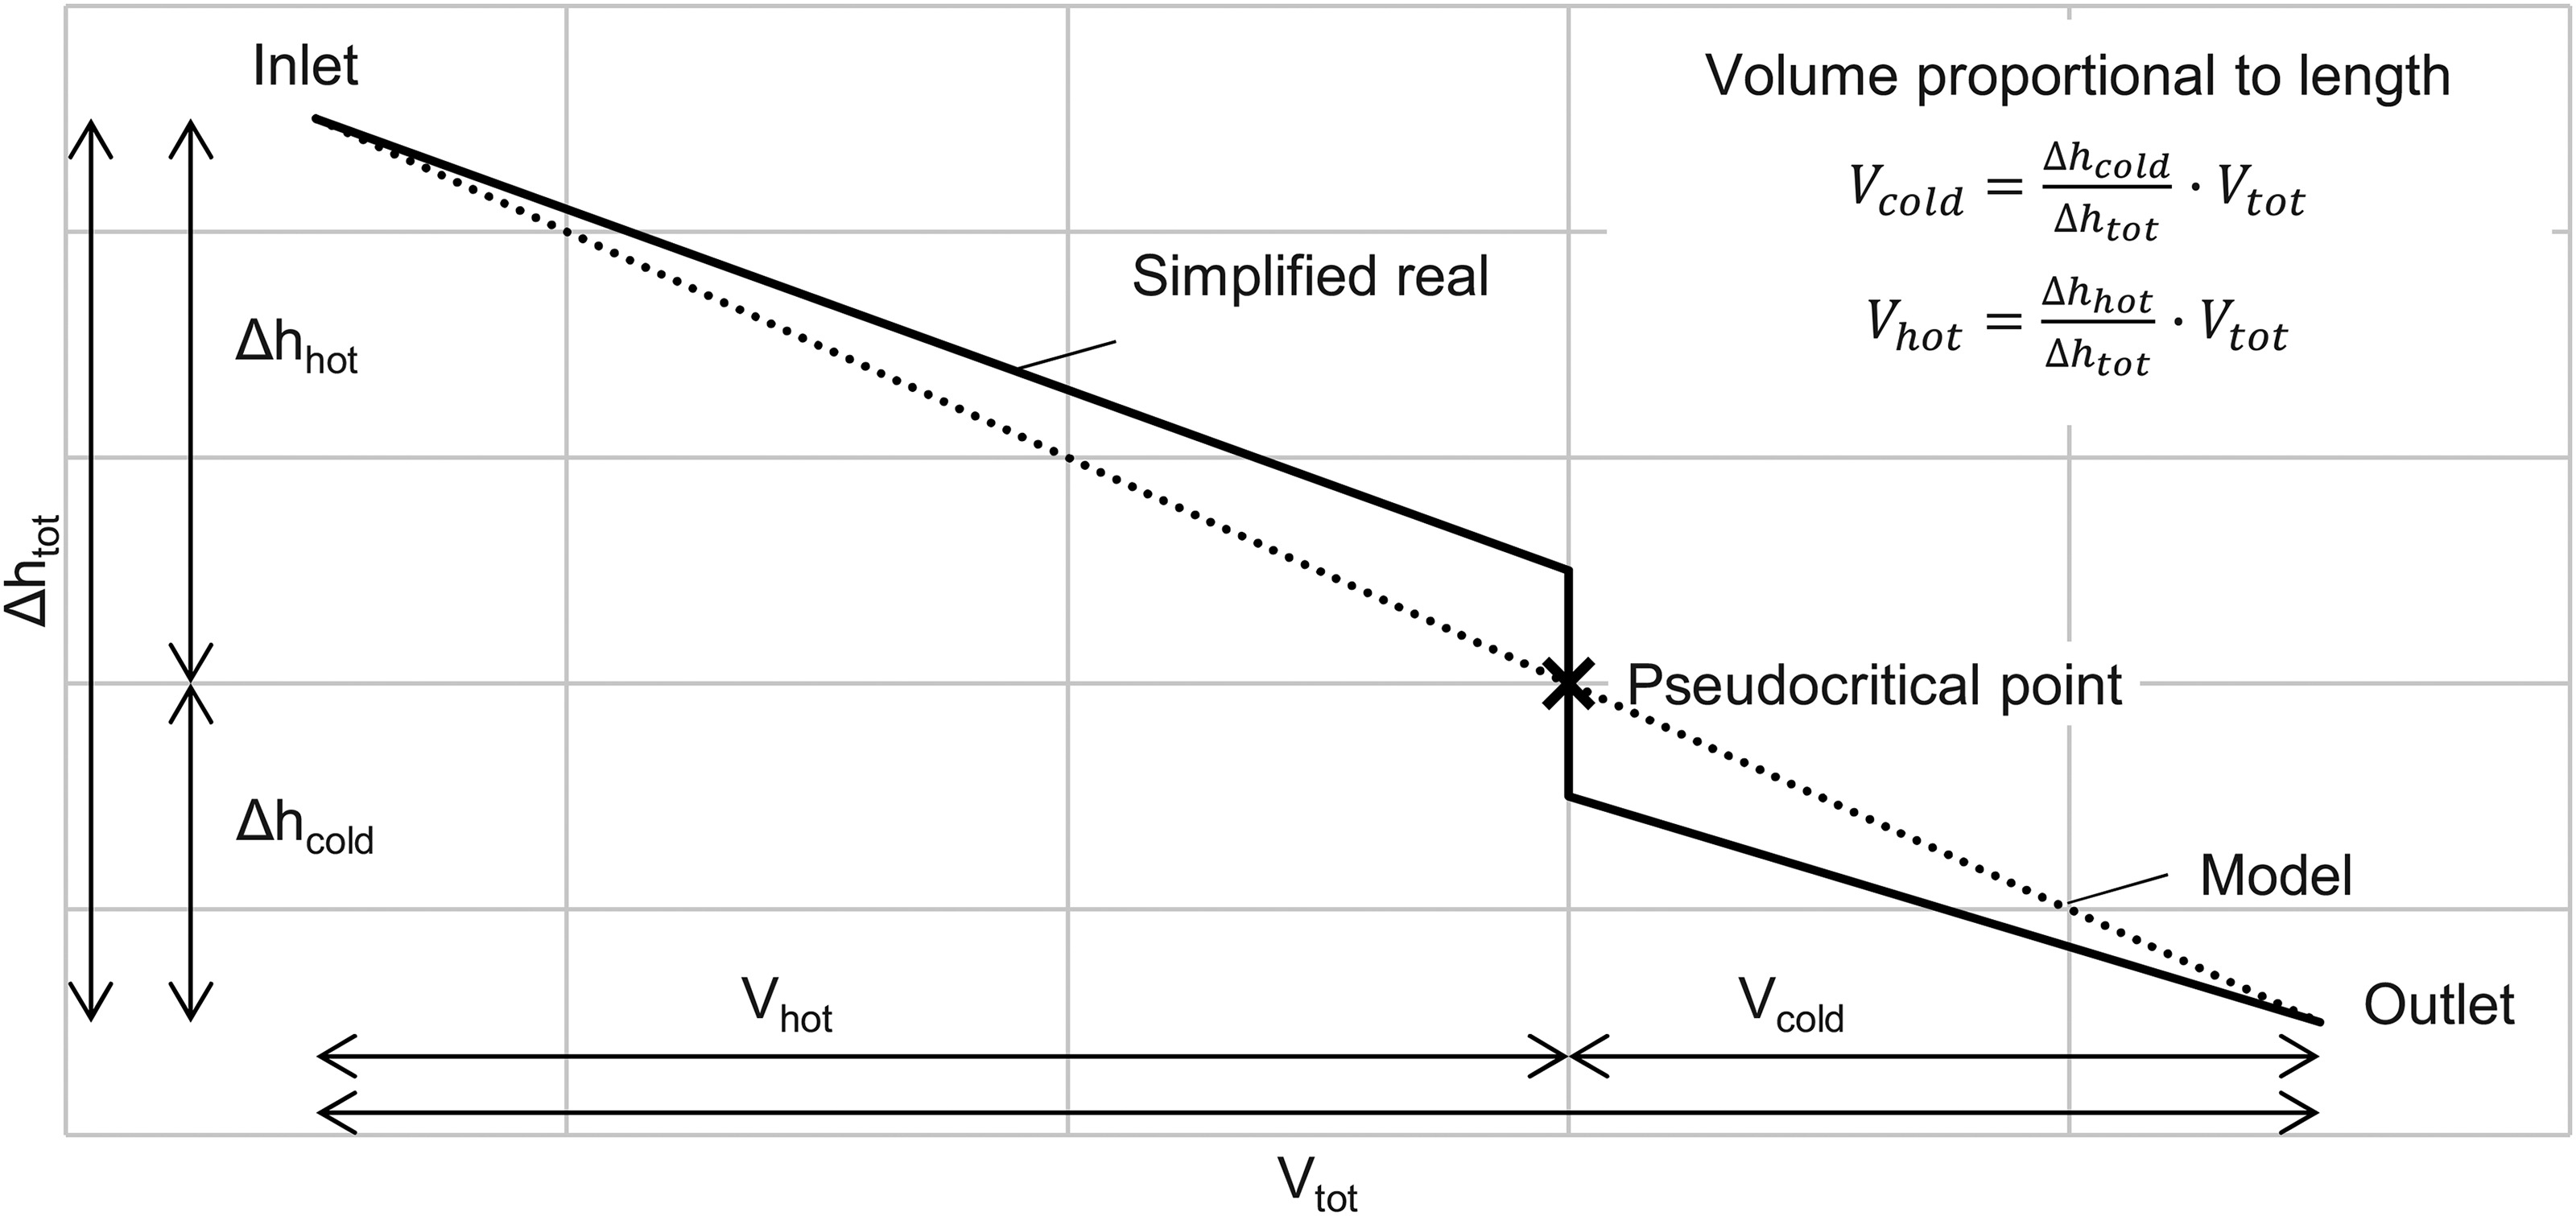
Simple closed Joule cycle (left) with indication of the volume distribution according to the simplified two-volume model (right).

Using Equation 1, the change of mean density on the cold side from a condition I to a condition II is calculated.
Comparing both conditions in Equation 2 shows that a change of density from condition I to II in the cold volume is directly linked to the change of density in the hot volume by the factor of the volume ratio. To accomplish the change of density, mass shifts from one section to the other. While the shift of mass and the change of density for certain volumes is straight forward, two challenges remain. First, the desired result of the model is the pressure change rather than the density change. Thus, the pressure is computed from density and temperature by Equation 3. The fluid properties are accounted for by the constant specific gas constant R = 188.92 J/kgK and the compressibility factor Z to account for the deviation of sCO2 from the law of ideal gases. The latter, is in the region of 0.2 at the compressor inlet and approaches unity at the turbine inlet.
The second challenge is the specification of the effective hot and cold volume as well as the related thermodynamic conditions inside. The volume of the sCO2 cycle is determined by the cooler and heater because the internal volume of the turbomachinery and pipes is comparatively small and thus neglected. However, the effective hot and cold volume do not directly coincide with the volume of the heater and cooler respectively as indicated by the blue and red line in Figure 2. This is because the heating process starts from the cold compressor outlet while the cooling process starts from the hot turbine outlet. Since most sCO2 cycles feature a compressor operating in liquid-like sCO2, the cold and hot volume represent the fraction of the cooler and heater volume in liquid-like and gas-like sCO2 respectively. It remains to be determined how to separate the hot and cold volume.
For this purpose a cooler with constant cross-sectional area is assumed. This means the volume is proportional to the length. The change of specific enthalpy in the cooler is approximated by a linear function. It is postulated, that the high heat capacity and the high heat transfer coefficient, presented by Wahl et al. (2019) at the pseudocritical line causes a very steep slope of the linear function. Thus, a change from liquid-like to gas-like conditions or vice versa is assumed to be spontaneous and to require negligible heat exchanger volume as sketched in Figure 3. Due to this natural barrier, the pseudocritical point is used to distinguish between the cold and hot volume which are occupied by liquid-like and by gas-like sCO2. As an additional simplification, the slope of the change of specific enthalpy is assumed to be constant for both cold and hot volume (dotted line in Figure 3). Therefore, the actual size of both volumes is determined by the lever rule (see Figure 3). The same applies to the heater. If information about the heat transfer is available, this can be used to define different slopes for the cold and hot volume to calculate the two volumes more accurately. Applying this, the overall effective cold volume is calculated by Equation 4 as sum of the portions of the cold volume in the cooler and heater. An analogue procedure applies to the effective hot volume.
In order to define the properties that serve as an input to the model, one needs to consider that this model is meant to be used from the very start of the cycle and component design. Therefore, it is based on the parameters known at this stage which are the compressor and turbine inlet conditions and the volumes of the cooler and the heater. Since the compressor and turbine are part of the cold and hot volume respectively, the compressor inlet condition 1 and the turbine inlet condition 3 are used as reference for the cold volume and the hot volume only. This simplifies the model and avoids averaging. Furthermore, the difference of specific enthalpy of cooler and heater may be assumed to be equal to
Comparison of the experimental observations and model predictions
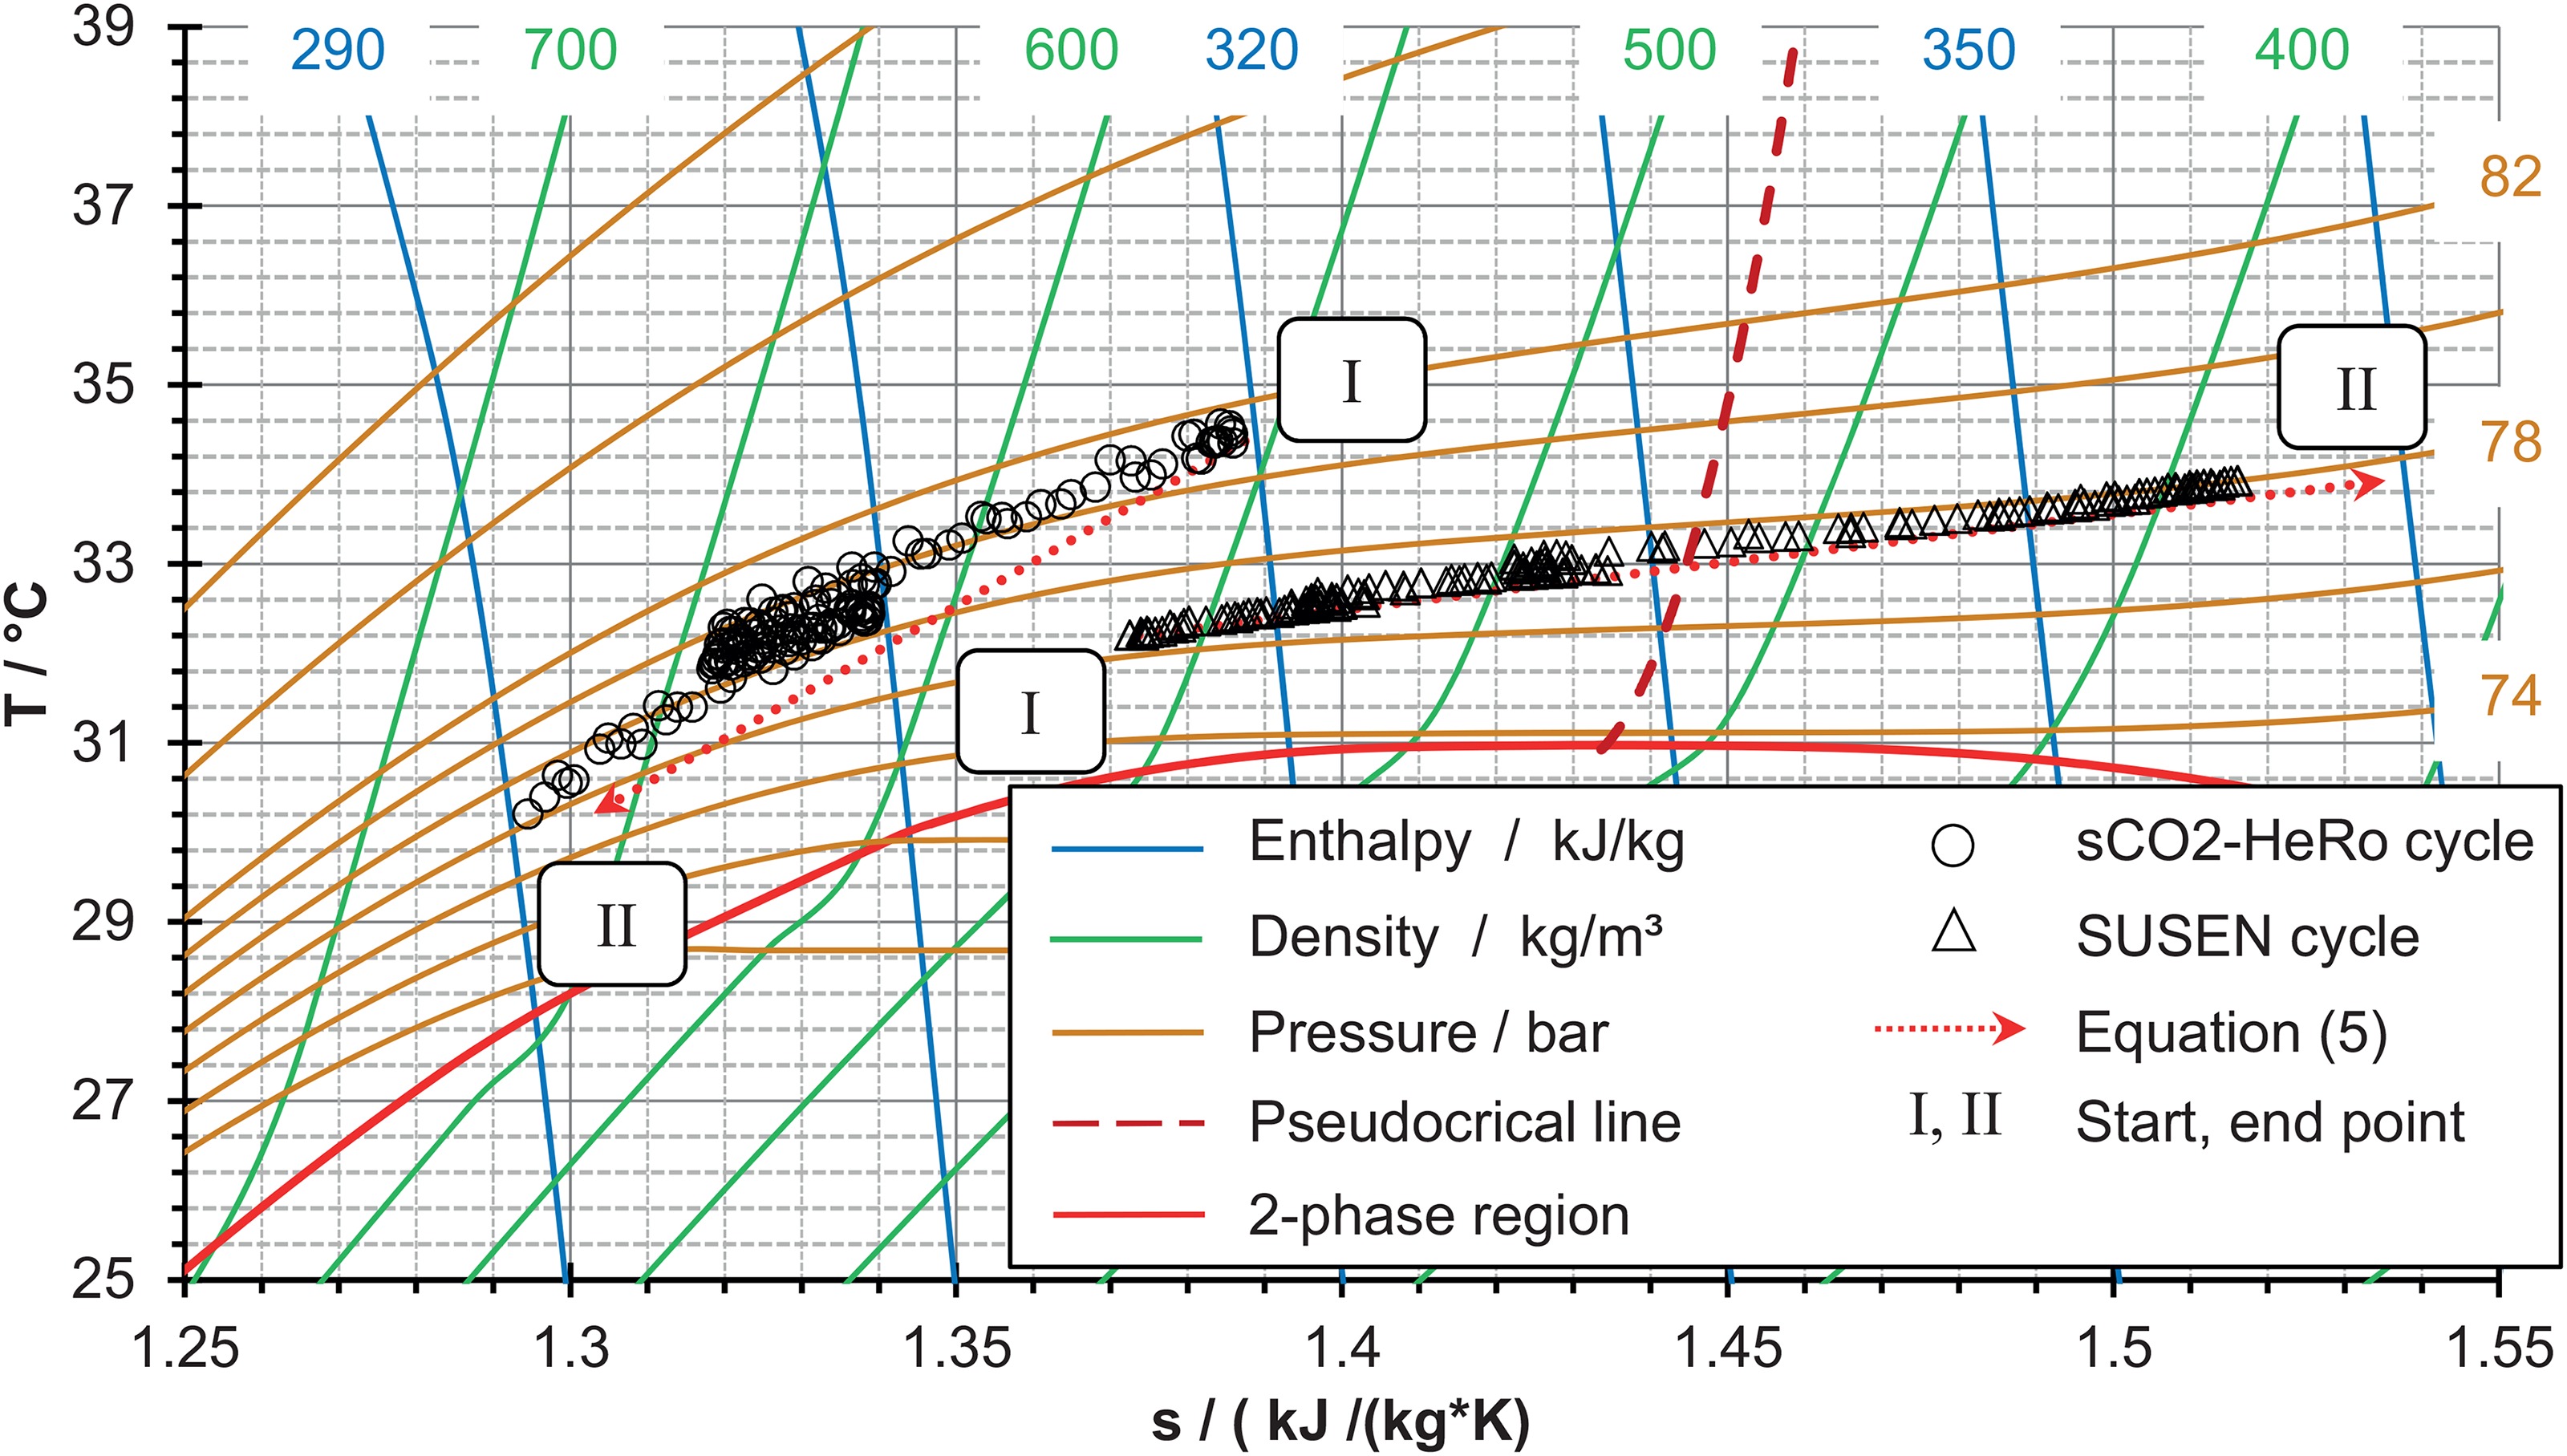
This study is based on the fact that the design of the HeRo loop leads to a substantially different change of compressor inlet pressure upon change of cooling power compared to the SUSEN loop. Figure 4 shows two sets of measurements depicting the compressor inlet conditions in a Ts-diagram as well as their prediction by the model in Equation 5. While the first set of measurements from the SUSEN loop is related to the change of compressor inlet density during reduction of the cooling power, the other set of measurements is taken from the HeRo cycle for an increase in cooling power. In both cases, the cooling power is changed without change of the mass of CO2 in the cycle (no inventory control) to proceed from the start condition I to condition II. Even though the measurements do not start from the same condition and the direction of change of cooling power is different, it is obvious that the change in cooling power has a different effect on each cycle. Figure 4 shows a pressure difference of about 6 bar for a change of specific compressor inlet enthalpy of 29 kJ/kg in the HeRo cycle and only 2 bar for a change of 44 kJ/kg in the SUSEN cycle. Therefore, the design of the two cycles, described in detail by Hacks et al. (2019b) (HeRo) and Vojacek et al. (2018) (SUSEN) and more specific the larger volume of the cooler in the HeRo loop (40% vs. 4% of the overall cycle volume in the SUSEN loop), causes the larger pressure drop in the HeRo cycle. The model results represented by the red dotted arrows in Figure 4 show only a slight deviation from the measurements in condition II. The deviations for the HeRo cycle are slightly larger due to a pressure vessel (Hacks et al., 2019b) buffering a small amount of CO2 at the compressor inlet, which slightly contradicts the assumption of no inventory control. Considering the simplicity of the model and that it is meant to be used early in the design process, the model is assumed to be valid and can be used for further investigations.
Figure 4.
Compressor inlet conditions in a Ts-diagram for a change in specific inlet enthalpy of 29 kJ/kg (HeRo) and 44 kJ/kg (SUSEN, Hacks et al., 2019a) compared to the modeling results of Equation 5.
Theoretical analysis for variation of compressor inlet conditions
Figure 4 shows two examples for the effect of the volumetric design (SUSEN and HeRo loop) on the change of compressor inlet pressure. To investigate possible variations of the compressor inlet conditions for other volumetric designs, the extrema of Equation 5 need to be analyzed. Assuming a constant pressure ratio and constant turbine inlet temperatures, two extreme cases exist. The first case, Vhot/Vcold → ∞ means that Equation 5 considers only the turbine inlet condition 3 which is assumed to be constant. This results in an isobaric shift of the inlet conditions of the compressor if the cooling power and thus the compressor inlet temperature is changed. The negligible shift of mass from the cold to the hot section does not cause an increase or decrease in density. The second case, Vhot/Vcold → 0 means that Equation 5 only considers the compressor inlet condition 1. Therefore, it causes an isochoric change of compressor inlet conditions as the hot section is very small compared to the cold section and allows no mass to flow from the cold to the hot section. This is also very obvious in Equation 2. Therefore, the pressure needs to rise or drop. This means, that starting from a certain design point, as condition I, the inlet conditions can only move to two regions depending on whether the cooling power is increased or decreased. Both are depicted in Figure 5 as areas shaded in blue and red indicating an increase or decrease of cooling power respectively. They show the possible direction of change of compressor inlet conditions starting from an arbitrary design point in the liquid-like CO2 region. The areas are confined by the black line indicating the isobaric change of inlet conditions and a blue and red line showing the isochoric change of inlet conditions for a certain change of specific compressor inlet enthalpy by variation of cooling power. Additionally, the length of the isochoric and isobaric lines represent the same change of specific compressor inlet enthalpy. The dashed lines in Figure 5 show how the compressor inlet conditions change for four different volume ratios to visualize how much the pressure depends on the volumetric design. A large cold volume means that an increase of cooling power will cause the inlet conditions to quickly drop in the 2-phase region. On the other hand, a decrease of cooling power may cause a strong pressure increase which may interfere with the maximum allowed cycle pressure. Furthermore, a small cold volume means that the change of inlet conditions will be closer to an isobaric line causing the inlet conditions to move to the liquid phase if temperature is lowered. The cold and hot volume are determined by Equation 4 which takes into account both the physical cooler and heater volume as well as the design points of compressor and turbine inlet. Therefore, a behavior close to isobaric is achieved for a small cooler and a large heater but also if the turbine inlet temperature is high. Isochoric behavior requires a large cooler and small heater together with a low turbine inlet temperature.

Summary and conclusion
This paper investigates the change of compressor inlet pressure caused by a change of cooling power in a closed sCO2 loop lacking an inventory control. Understanding the cycle behavior without inventory control is advantageous for the design of simpler cycle layouts or in case of inventory control malfunctions. Measurements show a larger pressure change related to variation of specific enthalpy at the compressor inlet in the HeRo loop compared to the SUSEN loop. Due to the lack of inventory control, the mass of CO2 in the cycle as well as the cycle volume is constant. Therefore, the pressure change between two stationary conditions only depends on the shift of mass from the cold to the hot section and vice versa. The pressure change can be calculated by the presented model. Therefore, small ratio of hot to cold volume relates to an almost isochoric shift while a large ratio will cause an isobaric shift of the compressor inlet conditions. This means that the inlet conditions of the compressor may only shift in a certain direction in a Ts-diagram, depending on the volume ratio. In case of a small ratio of hot to cold volume, this may cause the compressor inlet pressure to rise to a level violating the maximum allowed pressure if the cooling power decreases or to drop to subcritical 2-phase conditions if the cooling power increases. For the latter case, the conditions tend to shift to the liquid phase if the volume ratio is large. Operation of the compressor in liquid or 2-phase conditions causes a different response and thus will have a substantial influence on the cycle operation which needs to be considered in the design phase. The model allows to use initial design parameters to estimate the change of compressor inlet pressure for change of its inlet temperature by the change of cooling power. It considers the cooler and heater volume and the compressor and turbine inlet design point. Thus, it allows to consider the possible range of compressor inlet conditions right from the start in the cycle layout and component design for missing or malfunctioning inventory control. Lastly, it contributes to the development of simpler and more cost effective sCO2 cycle designs considering component internal volumes.