
Introduction
Ingress of hot gases into the cavity or wheel space between the rotor and the stator is an important issue to the turbine designer (Dahlqvist, 2017). The gas at the turbine inlet has high kinetic and thermal energy and ingress is detrimental to the operational quality and durability of highly-stressed rotating components. Designers use various counter measures to prevent or minimize this phenomenon. Relatively cool air diverted from the compressor is used to pressurize the wheel space and reduce ingress. Also, rim seals have been introduced at the wheel space periphery to find an optimal condition since purge flow interaction with mainstream flow in the annulus can lead to reduced stage performance in terms of efficiency, as has been investigated by (Dahlqvist, 2017; Dahlqvist and Fridh, 2017). Scobie et al. (2016) reviewed the ingress phenomenon from various test rigs and an orifice model was established to relate the seal effectiveness to the purge flow. Shear and the interaction between stationary and rotating components can lead to the development of large scale unsteady flow structures (Beard et al., 2017). These instabilities can be rotationally driven and associated with the disc pumping effect, or pressure driven and associated with pressure asymmetries in the annular gas path with vanes and blades on the stator and rotor respectively (Camci et al., 2019). Studies have been conducted to estimate the rotational instability frequency and structure, in order to physically link these structures to their causal phenomenon. Two of the popular postulated theories are that Taylor-Couette and/or Kelvin-Helmhotz phenomena are the driving mechanisms for these instabilities (Horwood et al., 2019). Horwood et al. conducted their study in collaboration with KTH using a replica of the cavity geometry used in the current study. Recently, a different mechanism involving the development of inertial waves was identified as more probable cause of instability (Gao et al., 2020). The number of instabilities and their rotational frequency relative to the disk has been shown to be a function of the purge flow rate. These instabilities exist in cases under rotationally-induced ingress with no vanes or blades, and also under externally-induced ingress with vanes and blades present as has been shown in Savov et al., 2016.
The present work deals with correlating and comparing the behavior of the seal effectiveness with a collaborating university using a geometrically identical test rig but with operating conditions over a wide range of rotational Reynolds numbers and Mach numbers. Here the effect of flow coefficient (CF) on ingress is investigated. Additionally, unsteady pressure measurements have been conducted to assess the influence of CF on the rotational structures discussed above. The investigation includes a study of the pitch-wise variation in order to examine the growth and decay in amplitudes of these rotational structures.
Methodology
The experimental facility that has been used is the cold flow Test Turbine Rig at the division of Heat and Power Technology, KTH. The single-stage setup consists of 42 stacked prismatic stator vanes with a positive lean, 60 rotor blades of high pressure gas turbine stage design, and a chute seal at the periphery of the wheel-space between the rotor and the stator. The turbine receives the inlet flow from a screw compressor achieving a maximum pressure of 4 bar(a) at a nominal annular mass-flow rate of 4.7 kg/s. Figure 1 is a sectional view of the stage geometry illustrating the essential measurement points. The arrows indicate the annular (larger arrow) and purge flow (smaller arrow) inlets and flow direction.
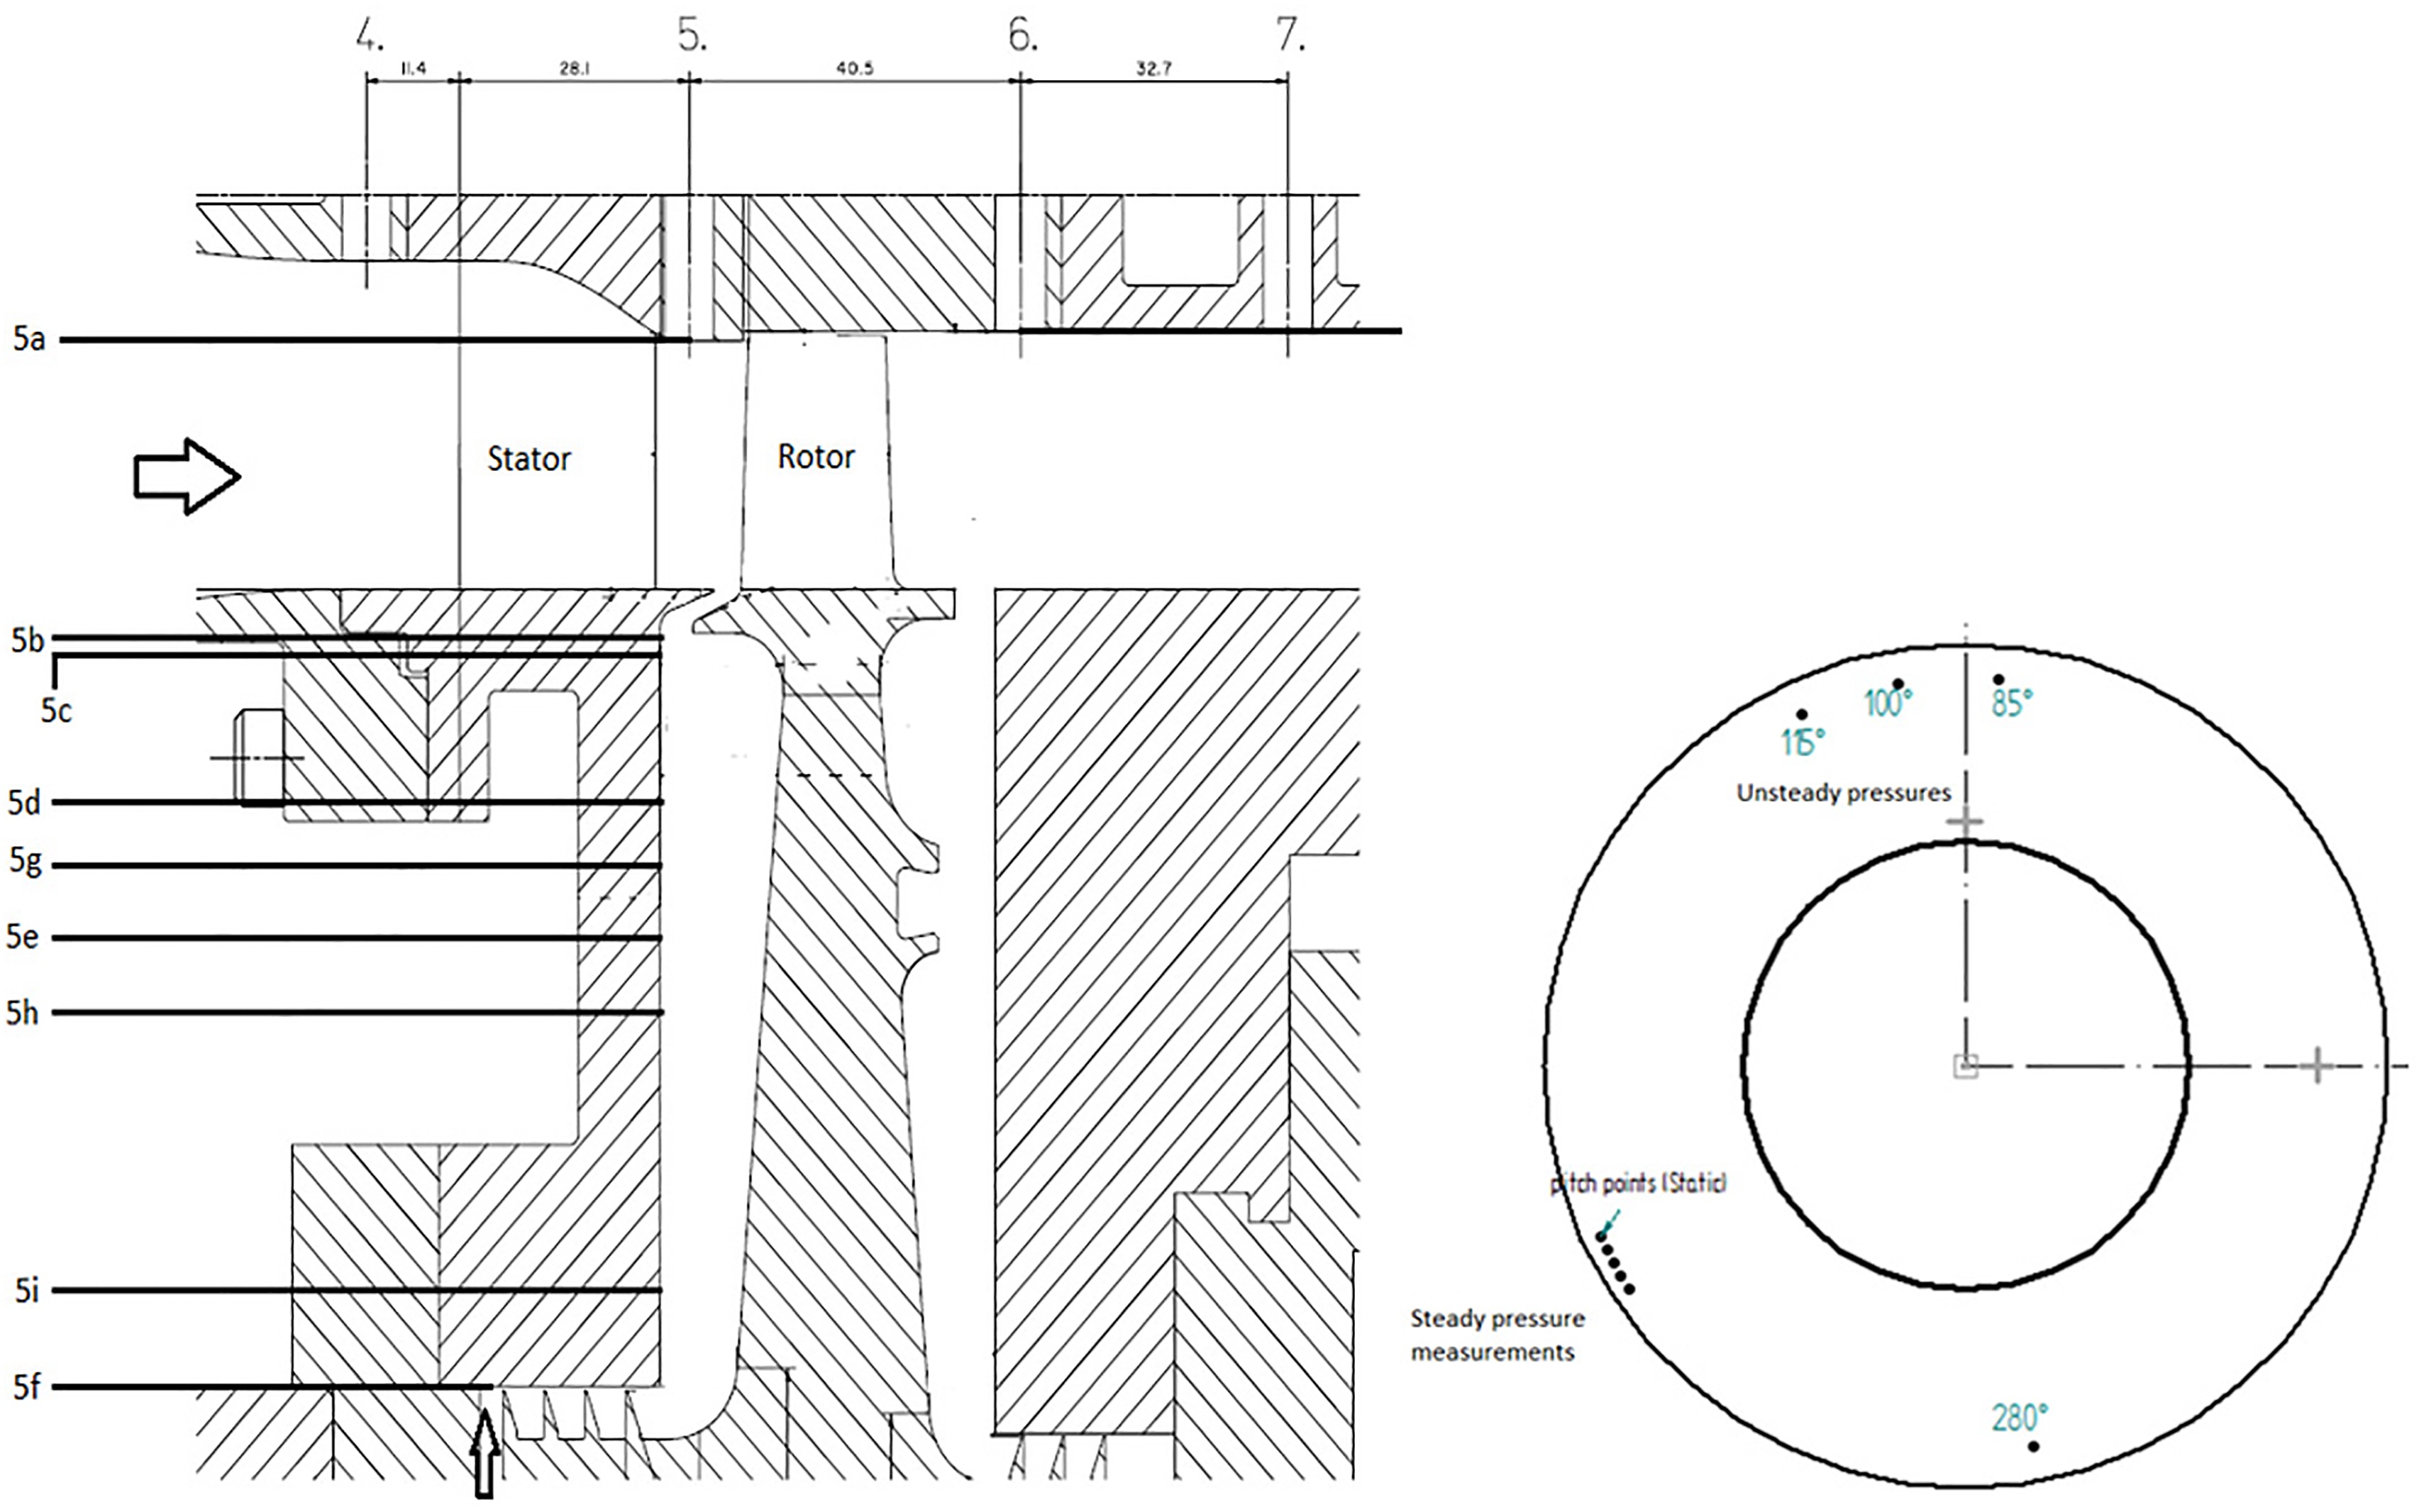
Steady measurements of effectiveness are made using static pressure taps on the stator wall within the cavity.
The measurement location 5f corresponds to the lowest radial measurement near the purge inlet at 55% hub radius.
The measurement location 5d, 5g, 5h, 5i correspond to 86%, 78%, 73%, and 61% of the hub radius respectively.
The measurement location 5b is the highest position for measurement of static pressures within the cavity at 98.3% of the hub radius. At this position there are five pitch-wise positions relative to the vanes corresponding to one stator vane pitch of 8.57°. These are shown in the circumferential view in Figure 1.
Unsteady measurements are made using DTS high acquisition system with XCS-062 Kulite pressure transducers, which were set at a sampling frequency of 500 kHz. The data was recorded in voltage and translated to pressure using sensor calibration coefficients. The pressure transducers are flush mounted and were not subject to a dynamic calibration. The bandwidth chosen before filtering the data was less than 250 kHz, in order to avoid inaccuracies from aliasing. The Kulite sensors had natural frequencies at approximately 275 kHz, which also lay outside the zone of interest for all the unsteady analysis.
The measurement location 5c is at 94.2% of hub radius, within the cavity on the stator side. This position also has four pitch-wise positions: three are at circumferential intervals of 15° between 85 and 115°; the fourth transducer is located at 180° shift from the one at 100°.
The measurement location 5e is the lower cavity position at 75% of hub radius.
Positions 5a and 6a correspond to unsteady measurements locations near the casing.
Table 1 shows the operating conditions for the experiments. The purge flow was introduced into the wheel-space from a separate air supply system controlled via three Bronkhorst mass-flow meters. The density ratio (between annular main flow at section 5 and cavity purge flow) varied between 0.985 and 0.998, assuming ideal gas behaviour in these operational conditions. For the effectiveness measurements, CO2 was seeded into the cavity purge such that it was always at 1% mass fraction of the total purge mass flow. The static pressure taps were used to extract the CO2 concentration on the stator using a Rosemound NGA Gas Analyzer.
Table 1.
Operating conditions.
In this study the purge flow (Φ0) is normalized for calculations as shown below. Note that all symbols are defined in the nomenclature.
The concentration of CO2 was measured by the NDIR (non-dispersive Infra-Red) method, which involves the measurement of concentration by the absorption of infra-red energy by the gas molecules. The concentration effectiveness is defined as follows:
Here the purge inlet concentration (ca) is based on measurements conducted at 5f in Figure 1, which is immediately upstream of the labyrinth seal at the inlet of the wheel-space cavity. Further concentration measurements were obtained over a range of static-pressure taps to determine the radial distribution of effectiveness. The uncertainty for concentration measurements is discussed in the Appendix.
The operating points specified below are achieved at a stage pressure ratio (static – static denoted as Π) of 2.12 across the sections 4 and section 7 shown in Figure 1. The flow coefficient has been changed by altering the rotational speed of the turbine. The change in swallowing capacity of the turbine at different flow coefficients resulted in small changes in the mass-flow rate, but this was maintained at close to 3.57 kg/s. With the change in flow coefficient and flow capacity there is a tendency for the pressure ratio to change, this was avoided by careful control of a downstream exhaust fan and upstream valves to ensure fixed pressures at section 4 and 7 for defining the correct operating points.
The effectiveness is directly related to metal temperature, and hence stress and operating life. Here effectiveness was measured from concentration measurements, which are not available in the engine. Appropriate purge flow rates have been determined to seal the wheel-space. From a practical perspective, the engine designer must translate pressure differences between the rim seal and wheel-space entrance to an equivalent effectiveness over a range of purge.
A consequence of the methodology is that CF (which is defined in Equation 4 shown below) could not be completely independently controlled in terms of Mach number (M) and Rotational Reynolds number (Reφ), as slight variations have been shown in Table 1 for the Mach number in absolute frame of reference.
Below it is shown that the effectiveness measured in the wheel-space and the number of rotating instabilities is broadly independent of M and Reφ. Note that the independence of effectiveness with Reφ has been well documented – see (Scobie et al., 2016) and (Horwood et al., 2019). The definition of rotational Reynolds number is:
Results and discussion
Steady results
This section discusses steady measurements, assessing the degree of ingress in terms of concentration effectiveness (ε) defined by Equation 3 – see equations below the nomenclature. For the given vane and blade, and chute-seal geometries tested here, effectiveness is investigated in terms of the following non-dimensional parameters: non-dimensional purge flow (Φ0), radial position on the stator (r/b), circumferential position relative to the vane (θ), and flow coefficient (CF). All parameters are defined in the nomenclature.
The variation of concentration effectiveness with flow coefficient for the chute seal is shown in the Figure 2. Here the non-dimension purge flow was set at Φ0 = 0.05. Also shown in the in the Figure is the deviation of relative flow angle at the rotor blade inlet, Δβ. This provides a physical representation of the change in flow coefficient, where the deviation is calculated from the design operating point: Δβ = 0 at CF = 0.35.
Figure 2.
Variation of seal effectiveness with changing flow coefficients at a normalized purge flow rate of Φ0 = 0.05.
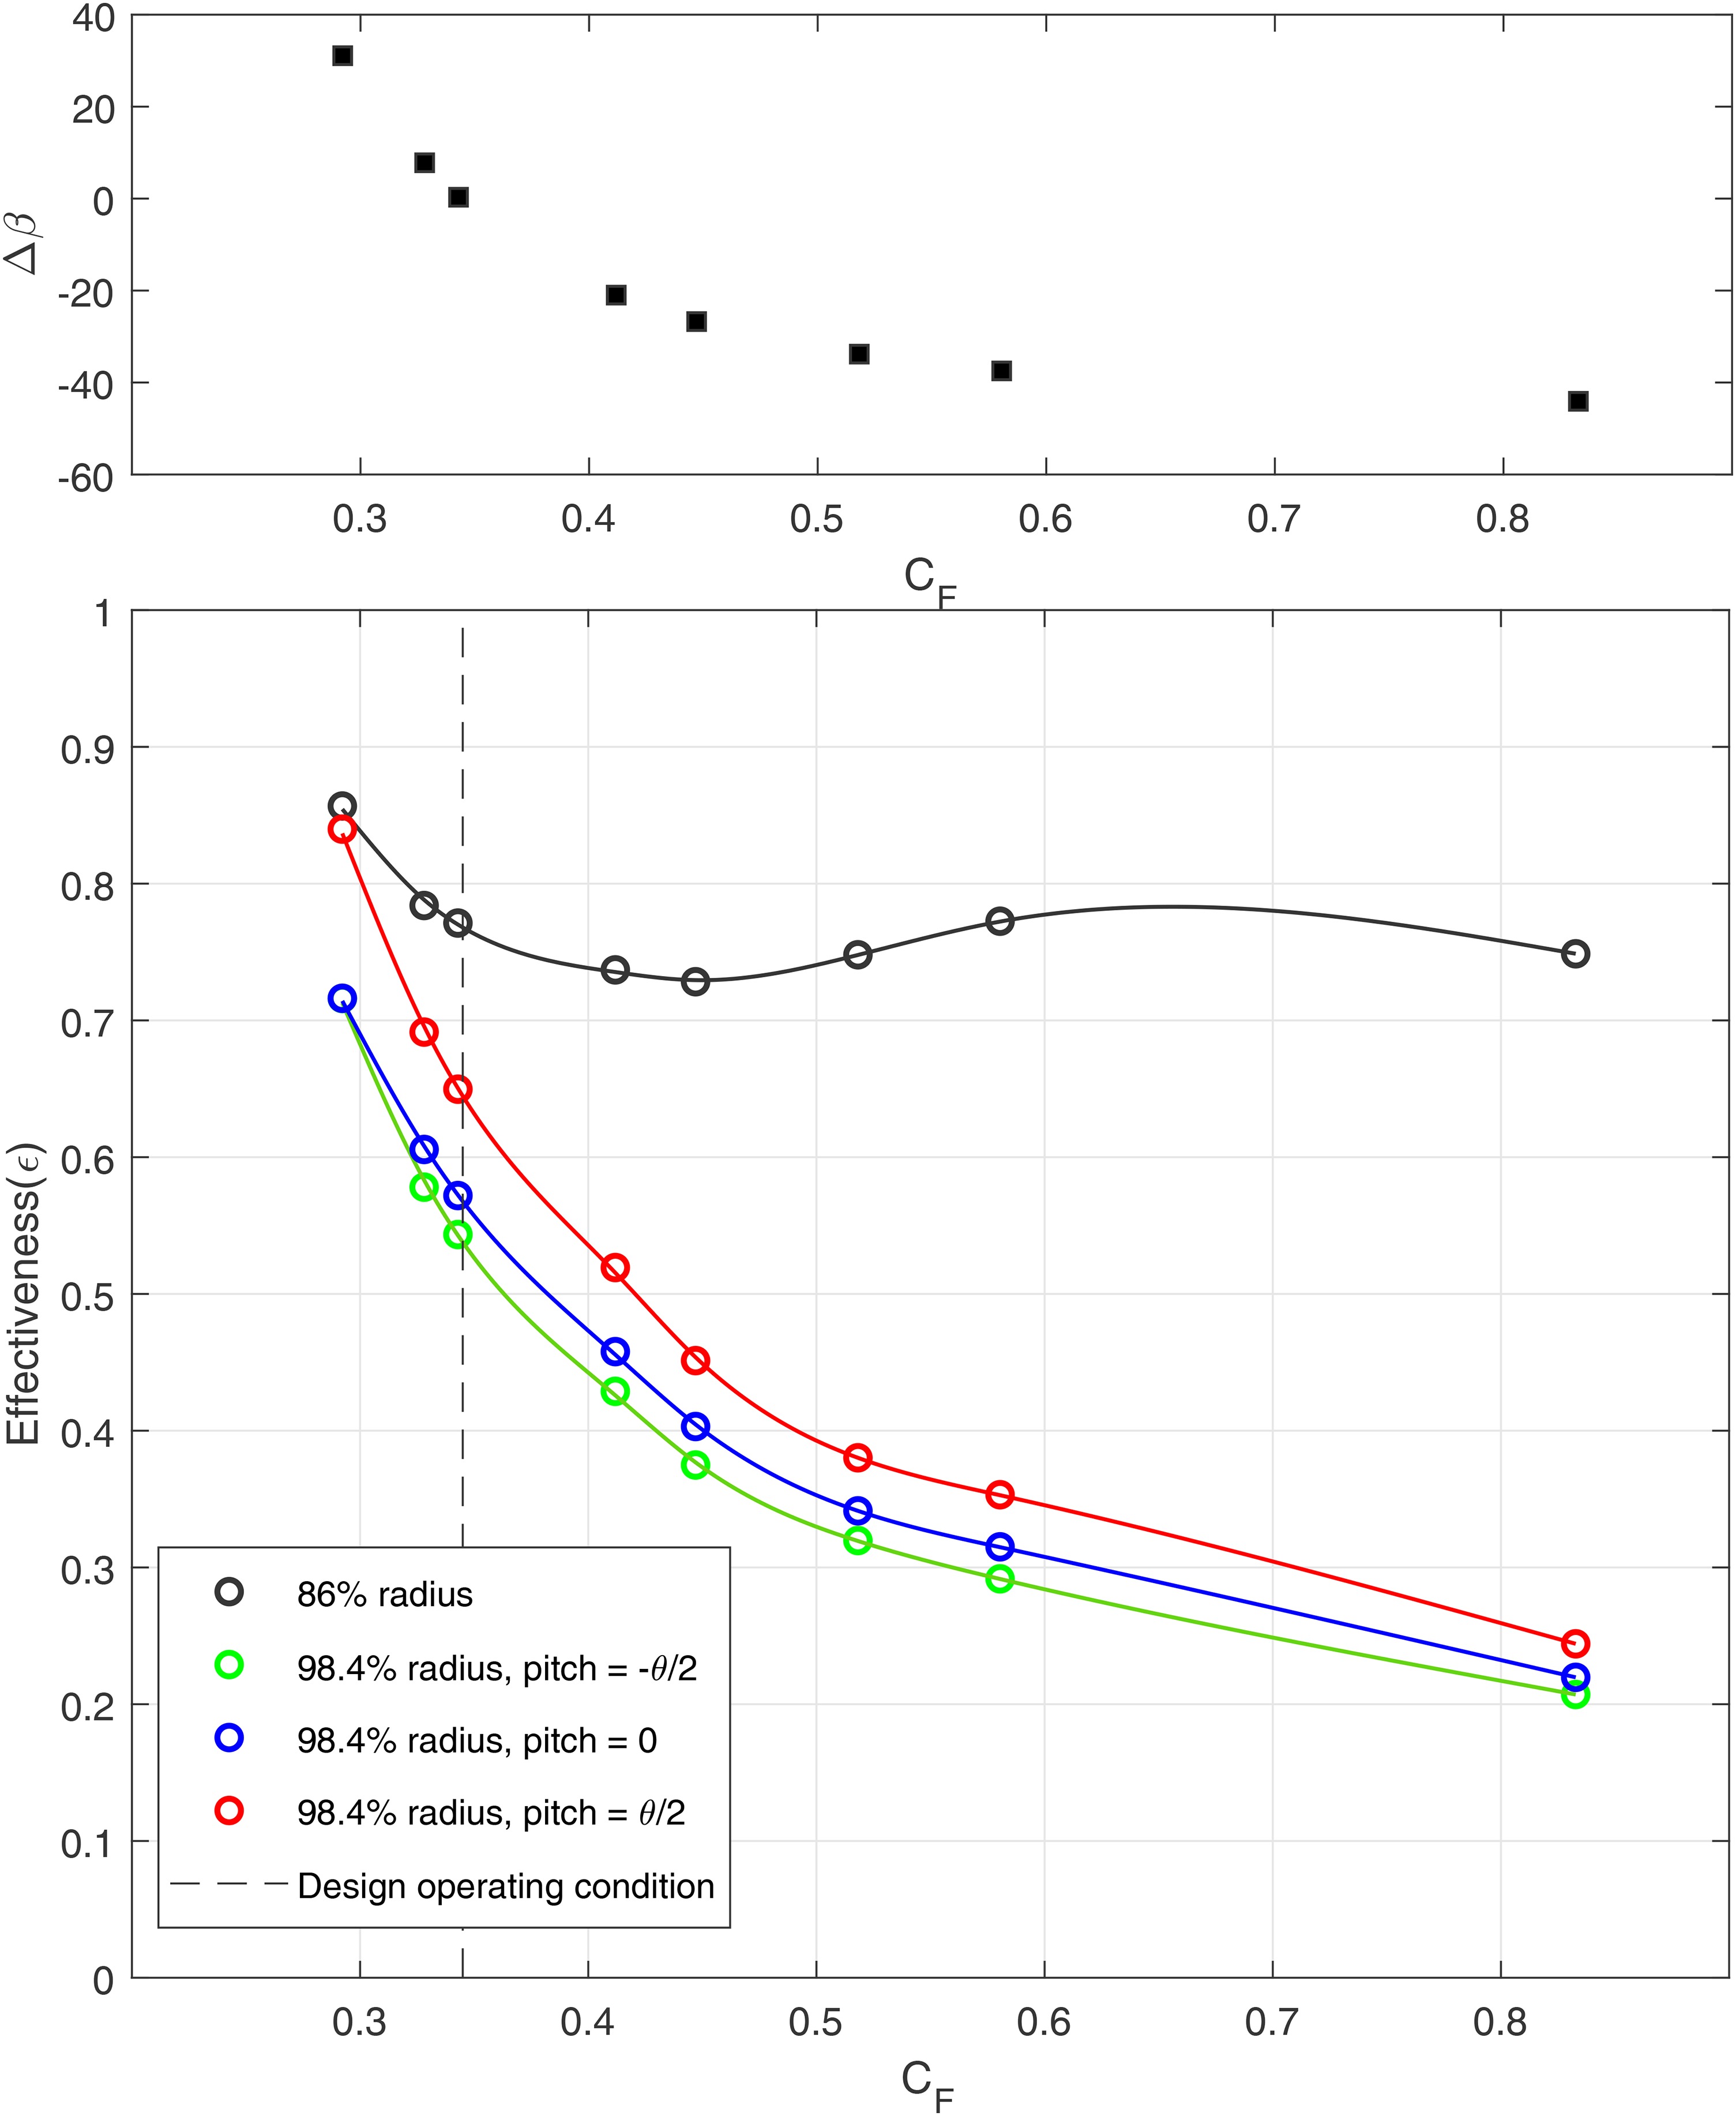
As would be expected, the degree of ingress is higher at larger radius (r/b = 0.984). Effectiveness is larger at 86% hub radius. At high radius the effectiveness of the chute decreases monotonically with increasing CF. There are differences in effectiveness depending on the pitch-wise positions, revealing an asymmetry related to the relative position of the vane.
At the lower radial position, r/b = 0.86, Figure 2 reveals a minimum at CF = 0.45, followed by a small increase in effectiveness with increasing CF. Note however that for CF > 0.45, Δβ > 35° and the stage is operating at conditions far from the design point. Figure 3 shows the effect of increased purge at r/b = 0.86. As expected, the effectiveness increases with increasing purge as the wheel-space is pressurized and ingress is reduced. Also the magnitude of the variation of effectiveness with CF decreases as ingress is suppressed. The value of CF for the minima of effectiveness increases with increasing purge as has been evident in Figure 3. High effectiveness is indicative of a reduction of ingress due to presence of the purge flow pushing out instabilities from the chute seal and reducing the pressure deficit within the cavity.
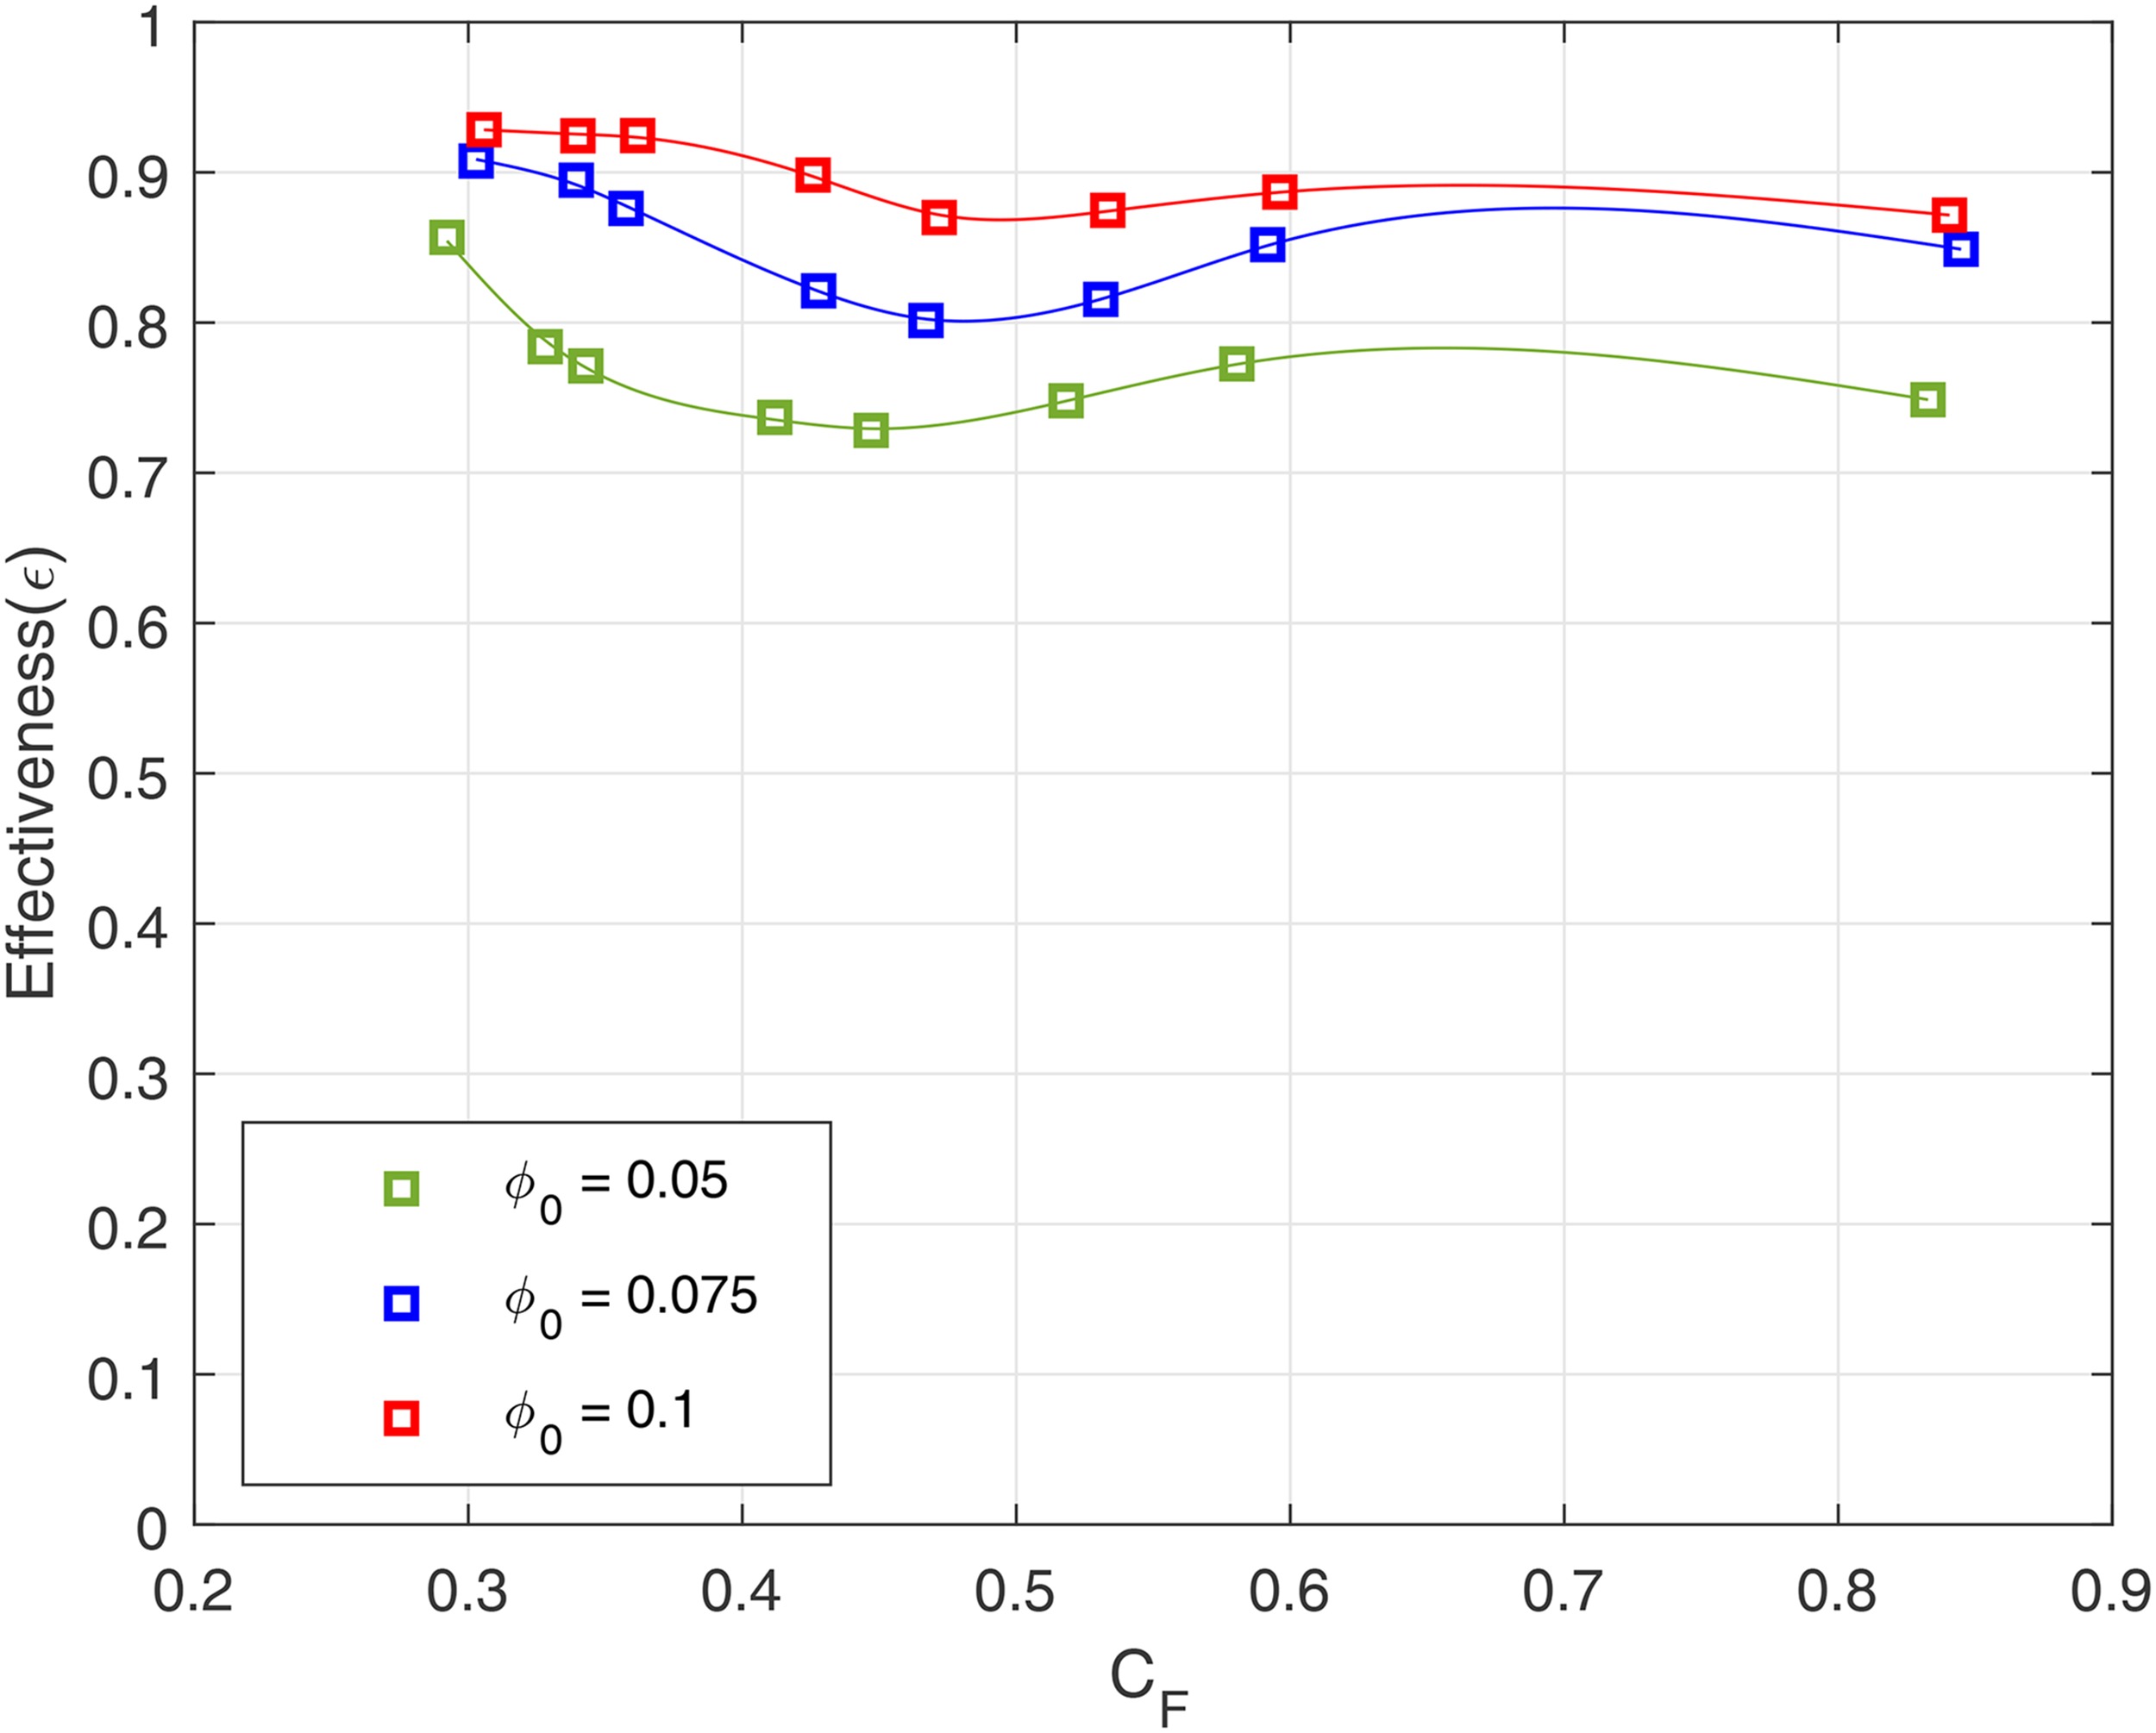
Figure 3 illustrates a slight increase in ineffectiveness at the 86% radial position for CF > 0.45. For CF < 0.45 the trend is reversed. A similar trend was observed by (Savov and Atkins, 2017) for higher flow coefficients between 79% and 93% radius irrespective of the vane exit Mach number.
This increase was linked to the reduction of dominant rotational effects with reduced disk rotational speeds, which in turn reduced mixing near the seal and thereby reduced ingress transport deep into the cavity. This would ensure that deeper portions of the cavity might recover some effectiveness due to radial penetration of ingestion with a constant purge flow.
Figure 4 shows the variation of pressure coefficient within the cavity with CF, see Equation (6)
Figure 4.
Radial variation of pressure coefficient with flow coefficient for a constant normalized purge flow of Φ0 = 0.1, inside the cavity.
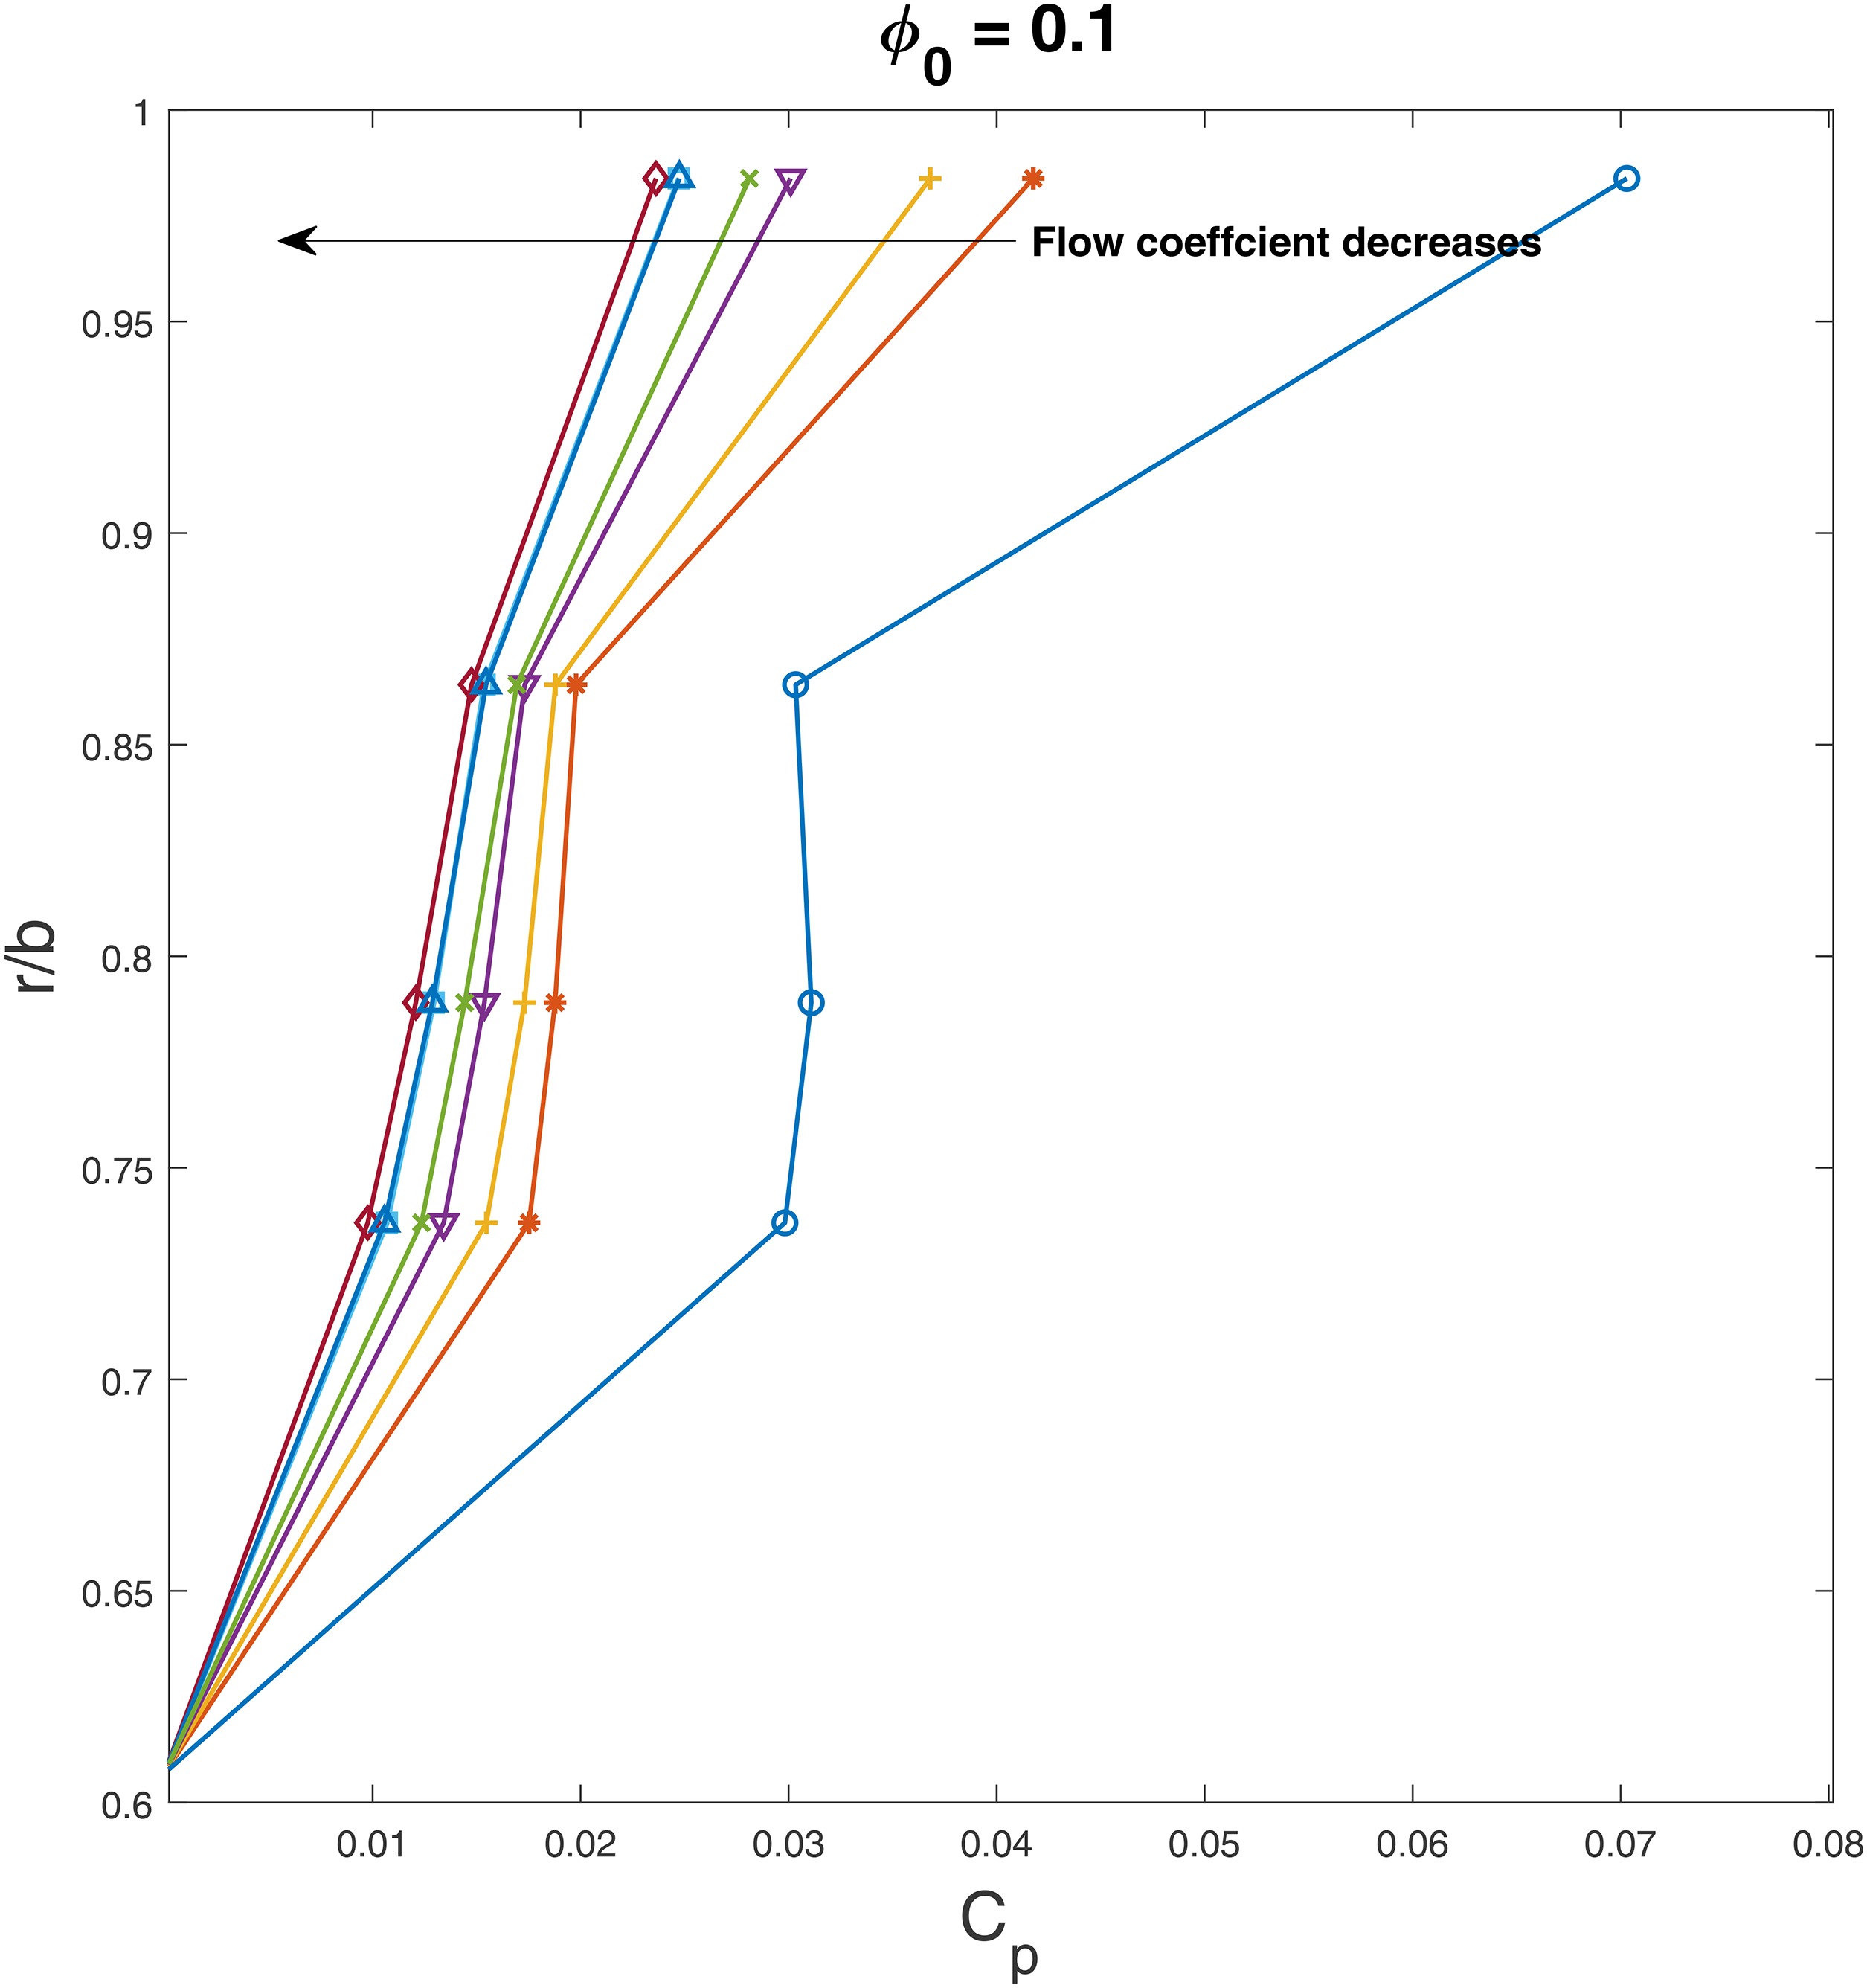
With a decrease in flow coefficient there is a reduction of pressure coefficient gradient with the radius, which is an indication of a pressure deficit within the cavity. A similar trend was observed by Horwood et al. (2019) with varying purge flow rates, where higher purge flow rates had similar impact on the pressure distribution within the cavity. Consequently, at lower flow coefficients the effectiveness increases as it would while increasing the purge flow. This behavior can be attributed to the reduction of ingress, especially the externally induced part which involves stator wake and rotor upstream pressure field effects.
The pressure distribution in the annulus is changing with CF as will the interaction of the mainstream and egress with the rotor blades as Δβ changes. Both KTH and Bath have shown
The gap in these plots for 0.59 < CF < 0.85 is because operating points were restricted to avoid large mechanical vibrations.
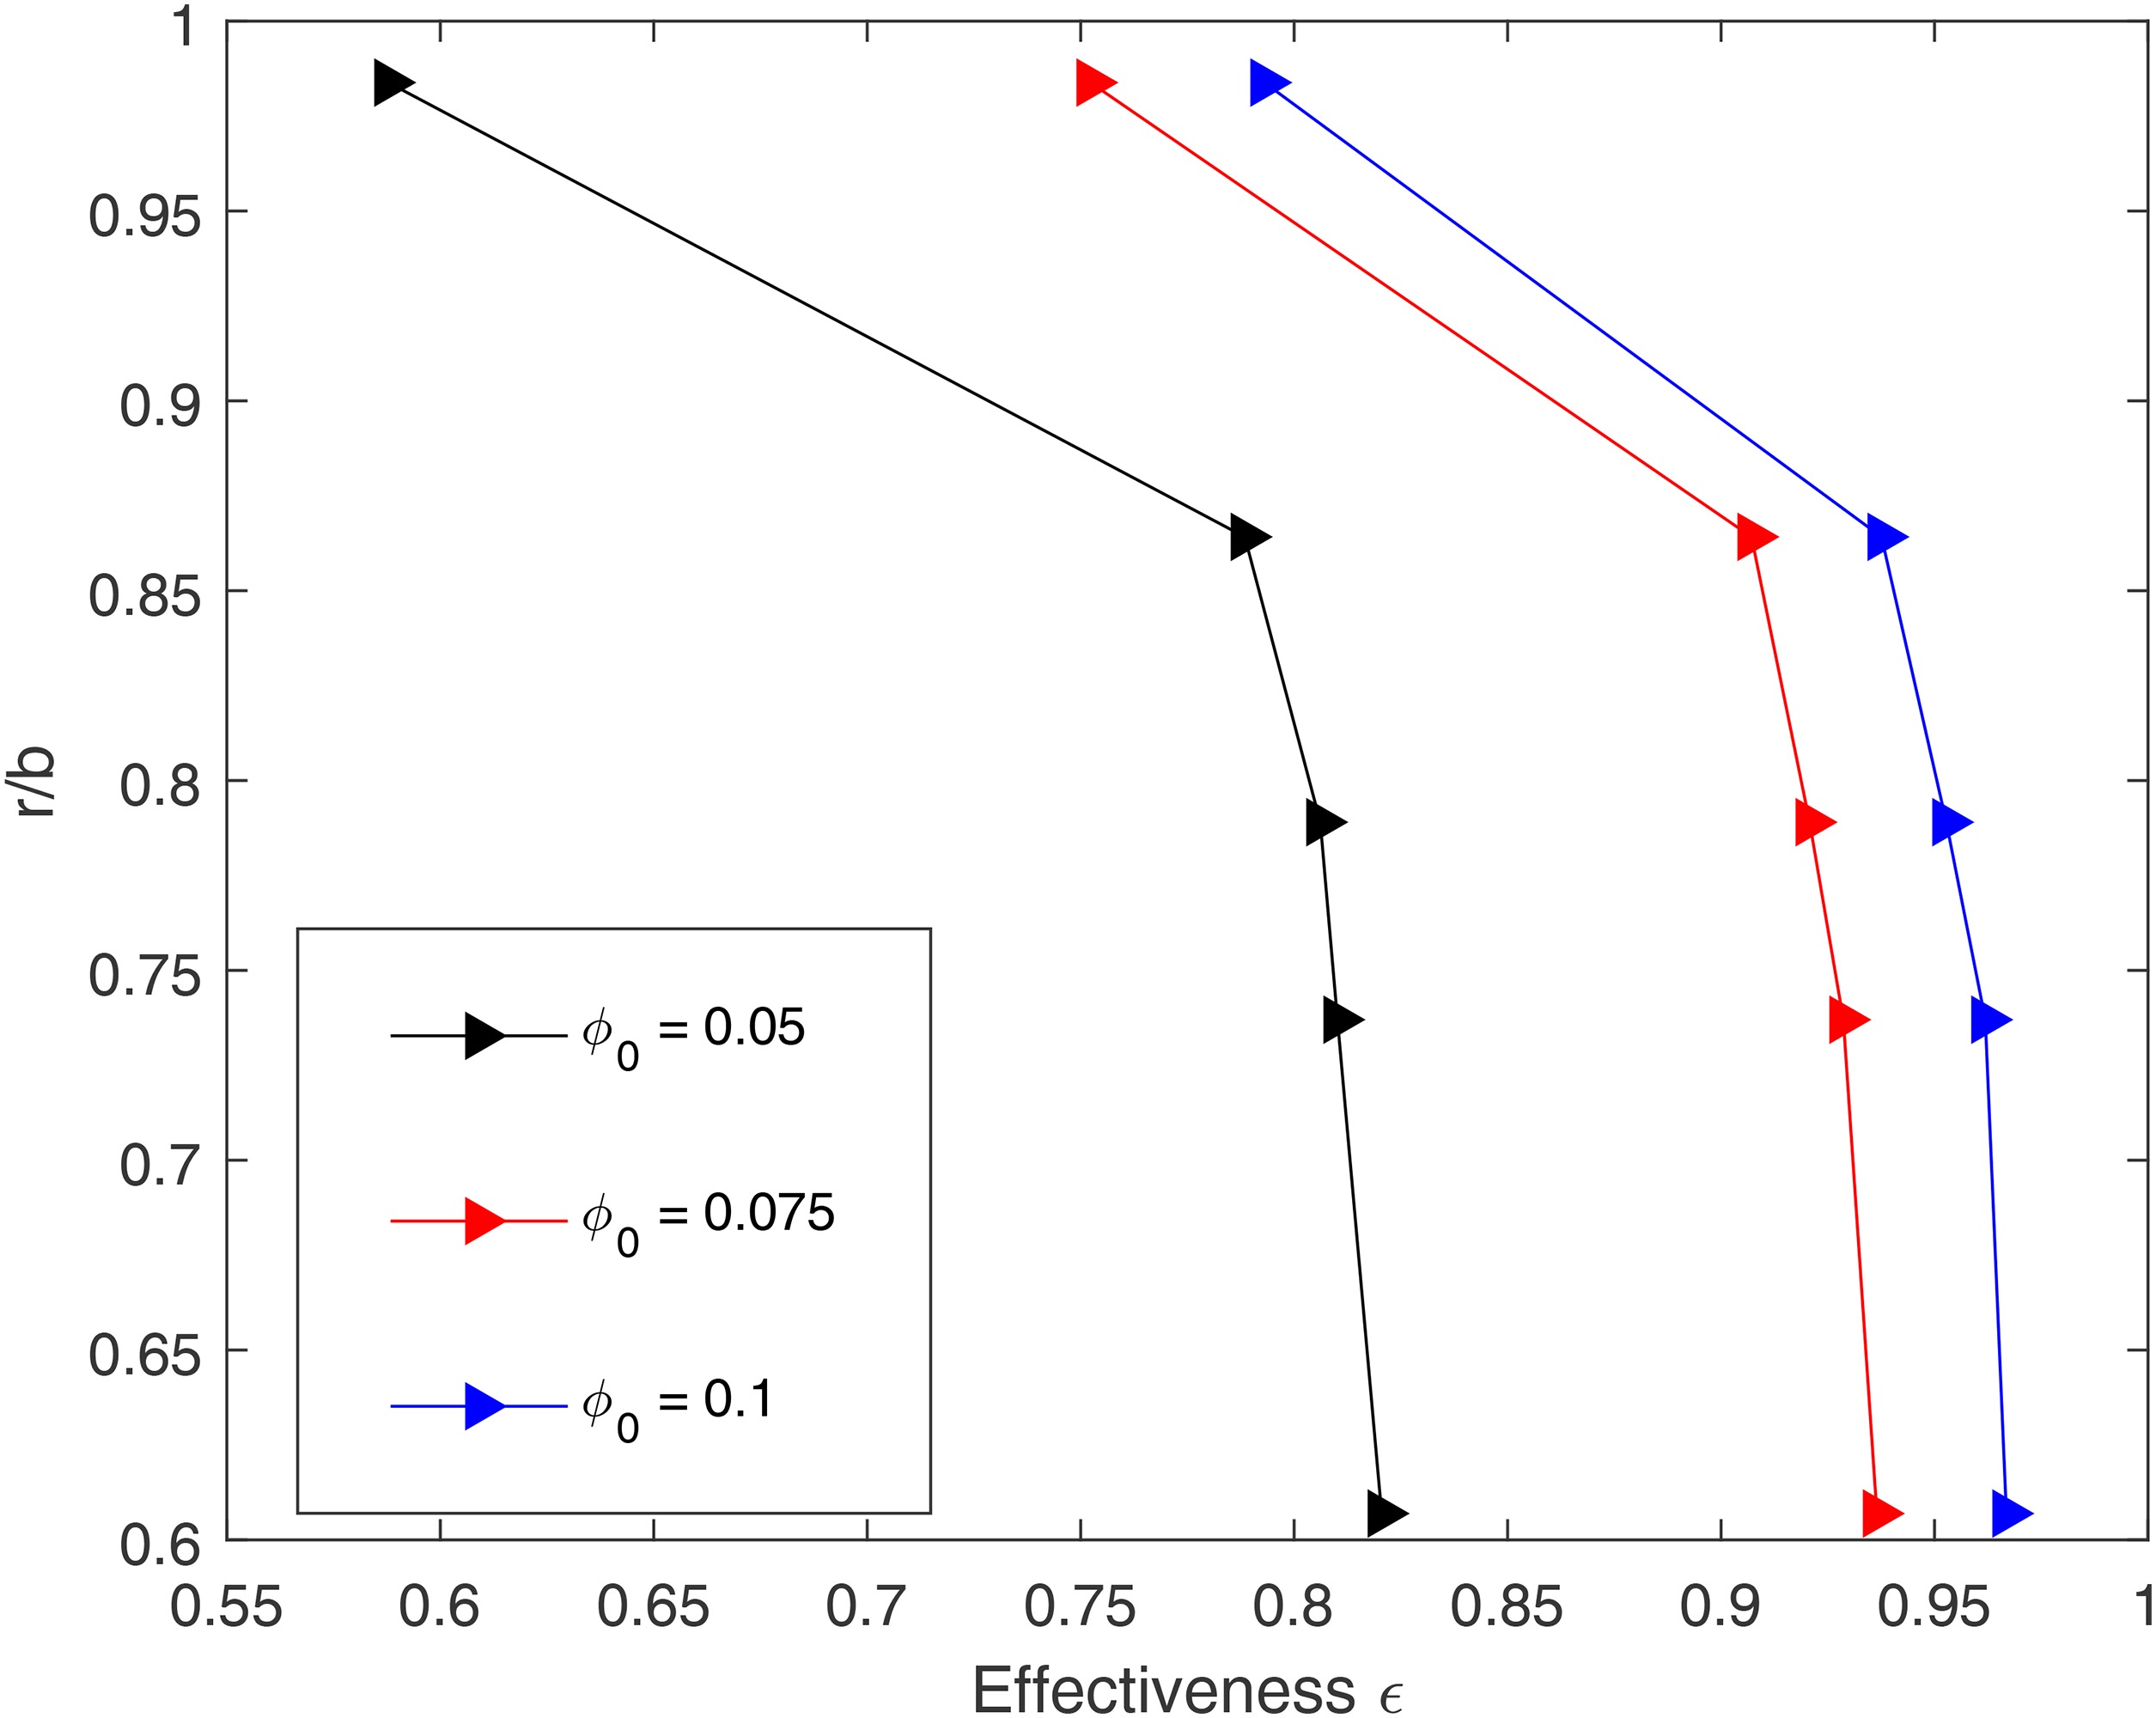
Figure 5 also depicts the variation of effectiveness with radius (normalized), the effect of pushing instabilities out of the cavity and reducing pressure deficit is evident as the effectiveness increases with purge flow. But the gradient of effectiveness change is much higher for radius greater than 85% in comparison to between 60% and 80% radius. This trend is very similar to findings from (Horwood et al., 2019; Robak et al., 2019), which is attributed to the high possibility of impingement of the rotor boundary layer on the stator wall for a chute seal. A consequence of this would be a larger mixing region with interaction between the ingested flow and purge flow pumped thorough the rotor boundary layer.
Figure 5.
Effectiveness variation with radius, at different purge flow rates at a specific CF = 0.35.
The Figure 6 shows the variation of effectiveness with non-dimensional purge flow rate at two radial locations. Here two different pressure ratios were used to create two stator exit Mach numbers at a constant flow coefficient, CF = 0.35. At low radius, effectiveness is seen to increase monotonically with purge. At high radius there is an inflection in the curve, similar to that observed by (Horwood et al., 2019). The sealing effectiveness is usually slightly lower for the higher Mach (higher Reϕ) case as had been observed in (Savov and Atkins, 2017).
Figure 6.
Variation of effectiveness with purge flow for CF = 0.35 at different Reϕ and vane exit Mach number.
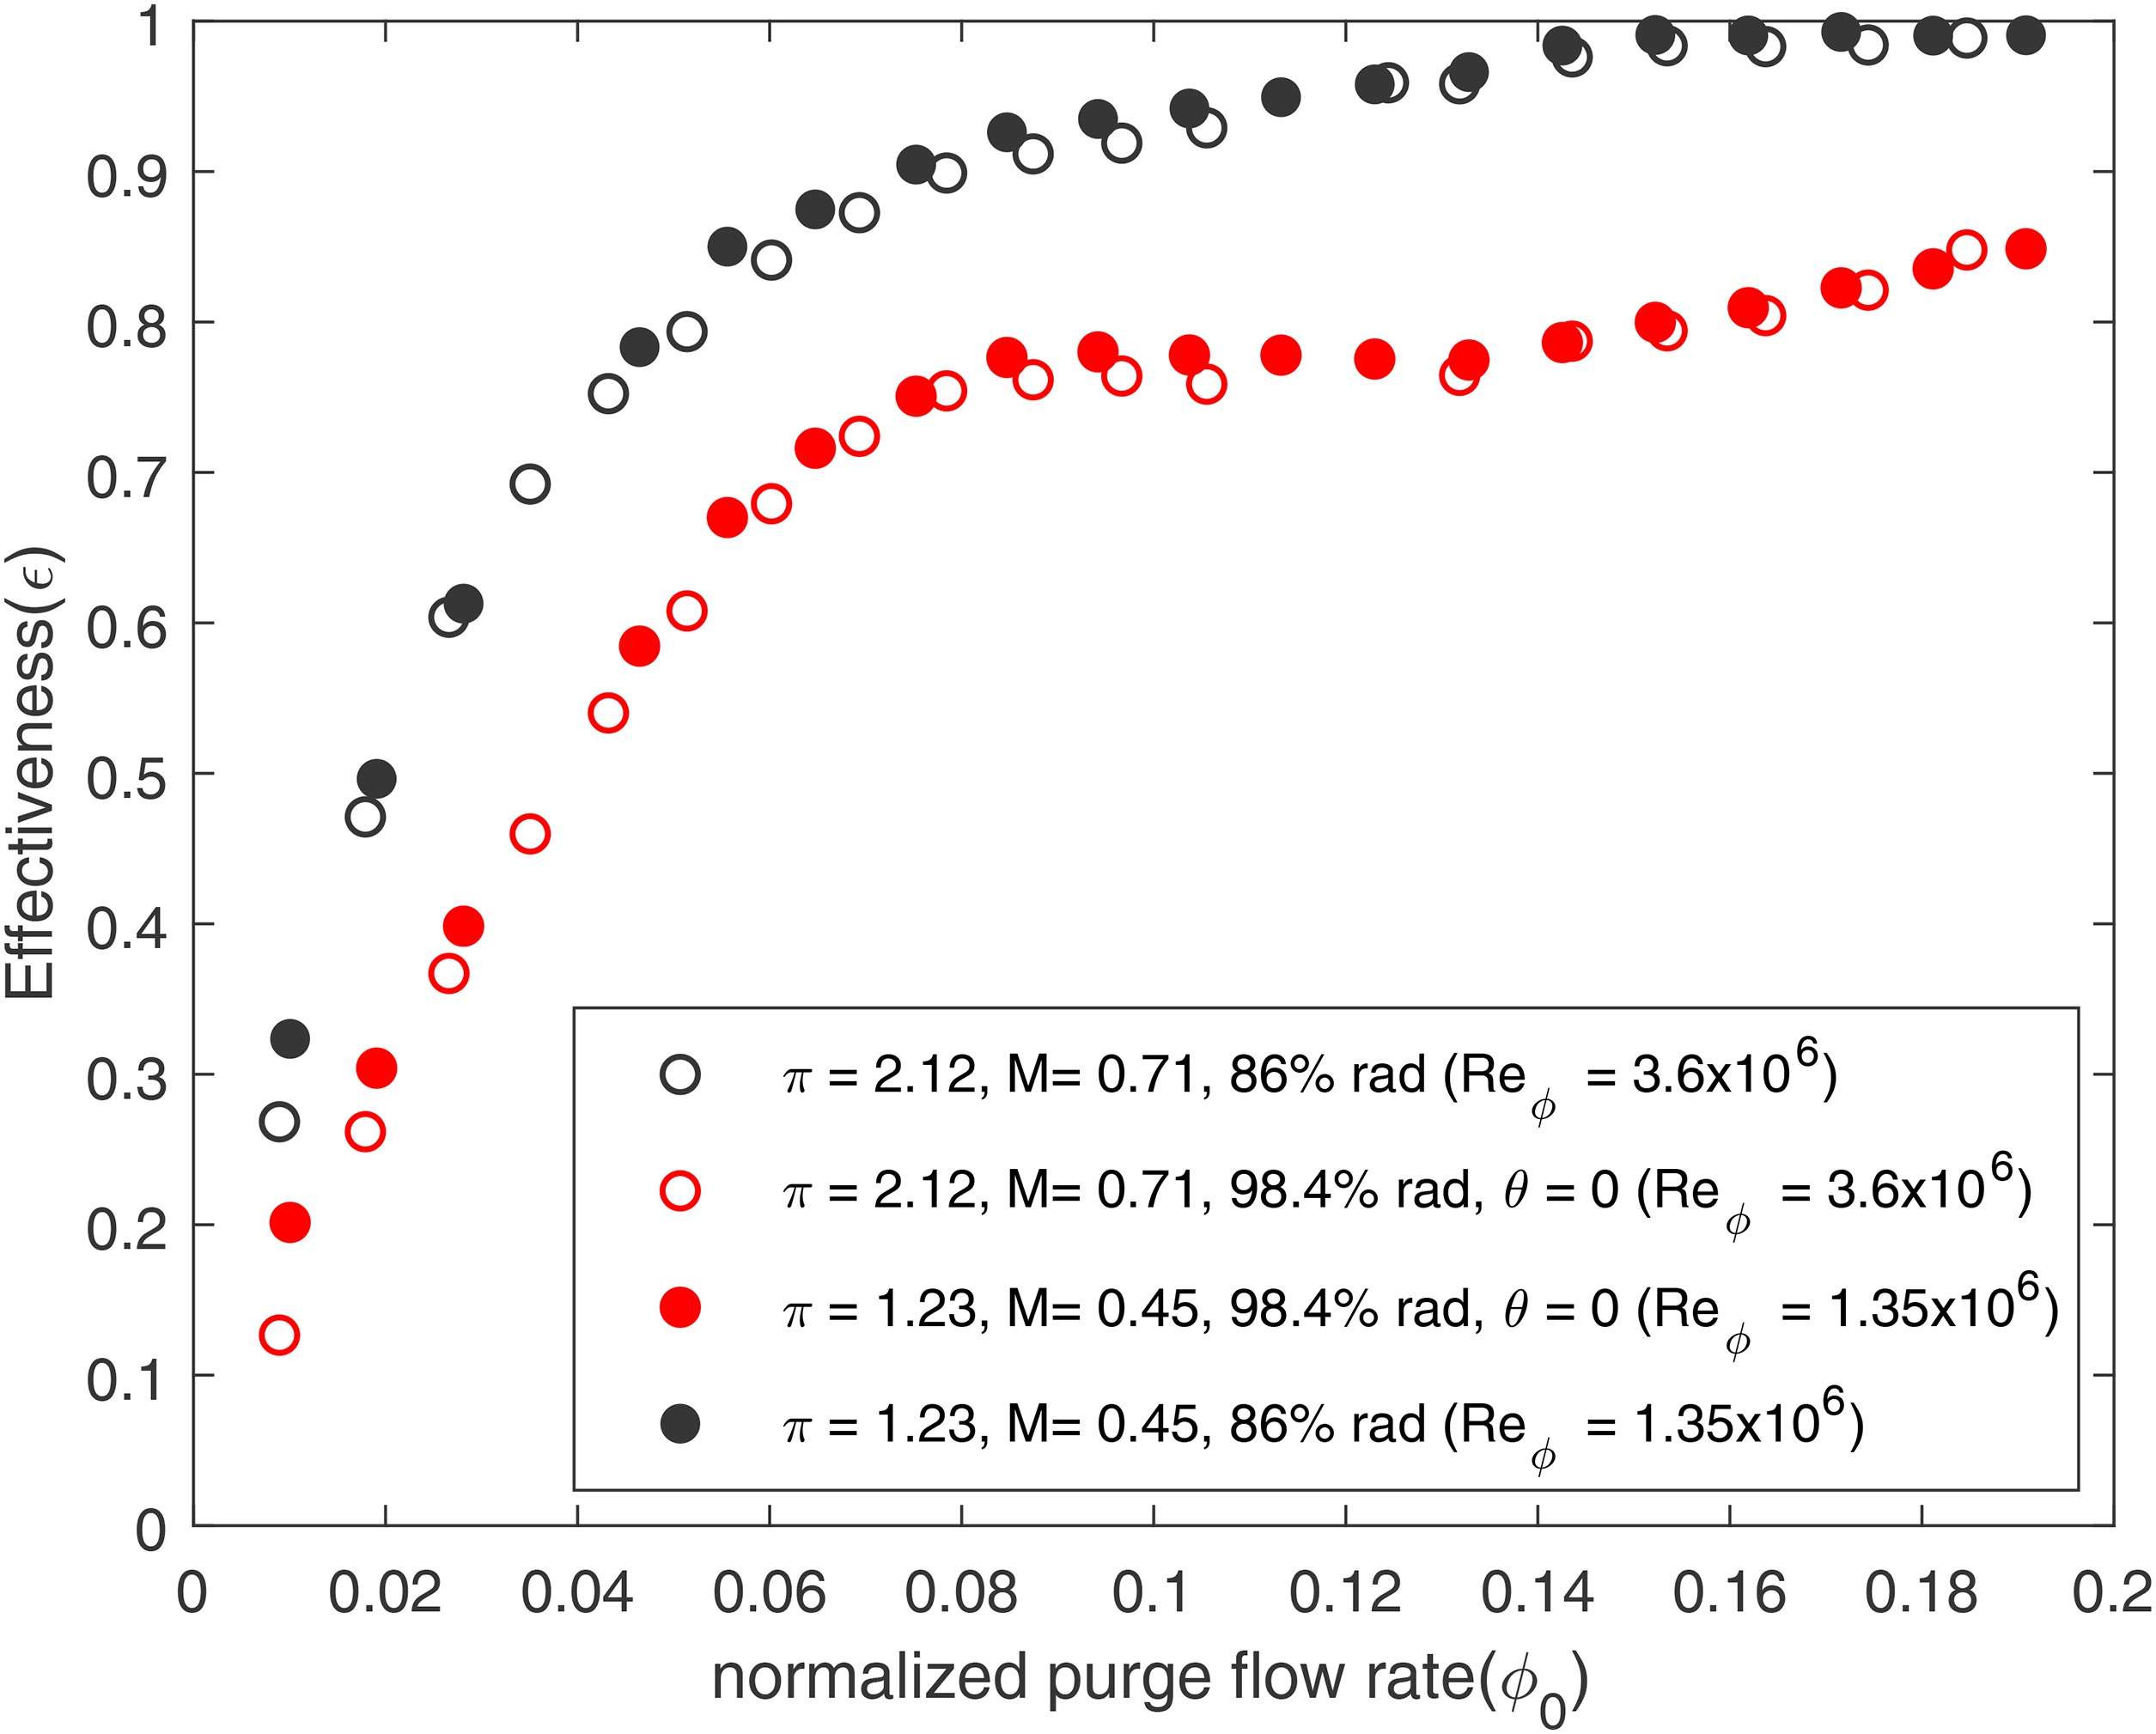
This was attributed to the possible reduced viscous damping at higher Reϕ resulting in more mixing. However, the difference in the effectiveness is generally within the measurement uncertainty, except for very low normalized purge flows of below 0.025. Thus, for this specific flow coefficient both Mach number and Reϕ independence (weak sensitivity of effectiveness) is observed.
Unsteady results
The unsteady experiments were conducted at operational conditions identical to the steady tests. The sampling frequency was set at 500 kHz. The unsteady data was pre-processed before conducting Fourier transforms. They were filtered using an FIR low-pass filter of 200 kHz inside the cavity. The sampling rate was checked by resampling the signal to ensure that it is accurate enough to capture the behavior of the disturbances. The truncation of the signal was also controlled to avoid the introduction of divergence by cutting off random time instances. Hence, depending on the disk rotational frequency the signal is truncated at exactly the maximum number of time periods that can be fit into 13 s of recording time.
The primary region of interest are the frequencies below the blade passing frequency (BPF), which corresponds to 60 (number of rotor blades). These are the frequencies that have been identified by (Horwood et al., 2019) and have been correlated to rotational instabilities that occur between 15 to 25 times the disk frequency. These frequencies have also been used to create notch filters, in order to get an accurate correlation between adjacent signals for tracking the rotational structures within the cavity.
Figure 7 depicts the unsteady pressure coefficient computed from the raw pressure data and the normalised frequency f/fd with the x-axis limited to the second harmonic of the BPF. Similar plots were generated the purge flow rates of Φ0 = 0.075 at four different flow coefficients with rotational speeds of 4,500, 7,250, 10,700, and 11,500 rpm (corresponding CF values shown in Table 1) to span the operational range of the turbine at equal intervals – however, the gap between 7,250 and 10,700 was intentional to remove any structural interactions, especially around 9,000 rpm, since the 1st bending mode of the blades occur at 18 nodal diameters.
Figure 7.
Fast Fourier Transform at 94% hub radius and pitch of 280° at CF = 0.35, R e ϕ = 3.54 × 10 6
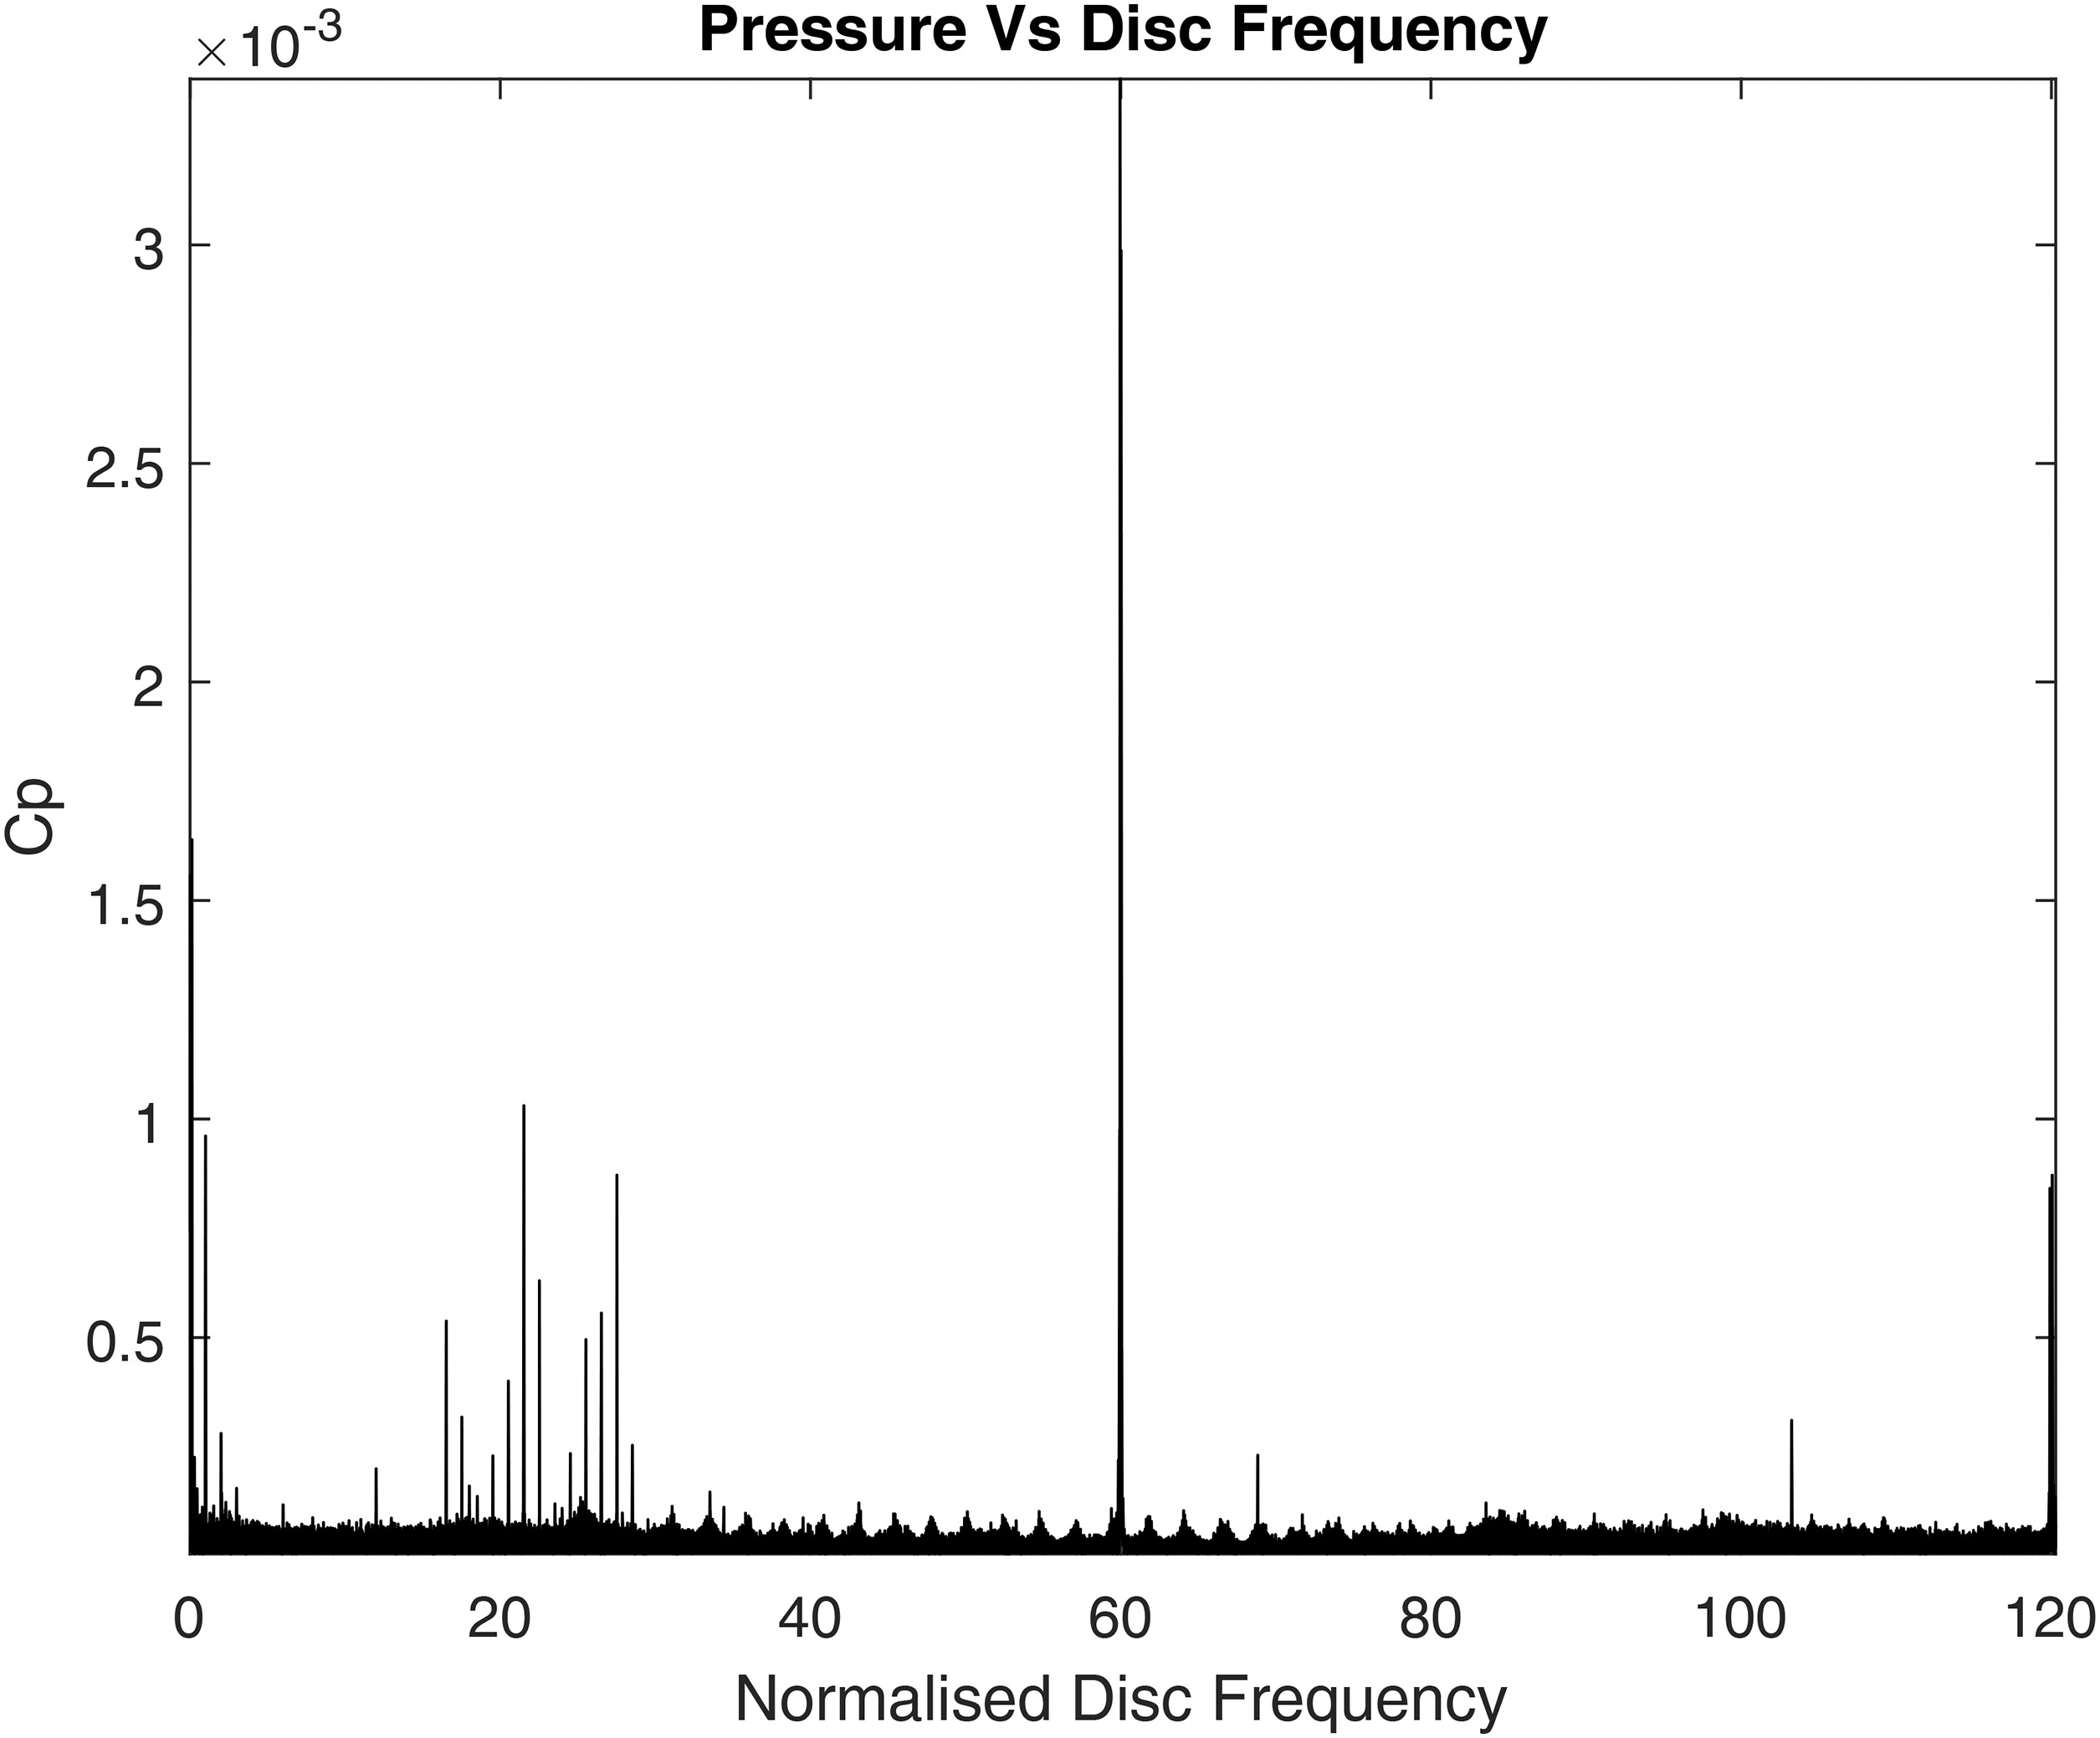
Note the data in Figure 7 suggests that there are large-scale structures present between f/fd ∼ 18 and 26, and that these are unsteady, and possibly changing in count number (N) with time. A similar phenomenon was also reported in (Horwood et al., 2019). There are slight variations that can lead to slight shift in frequencies as they are recorded over 13 s; for the design operating point this comprises of approximately 2,270 rotor revolutions. This is one of the reasons why multiple peaks have been recorded within the aforementioned range of interest.
In Figures 7, 8 and 9, CP is the unsteady pressure magnitude normalized as shown in Equation (7):
Figure 8.
Fast Fourier Transform at 94% hub radius and pitch of 280° at CF = 0.35, R e ϕ = 3.54 × 10 6
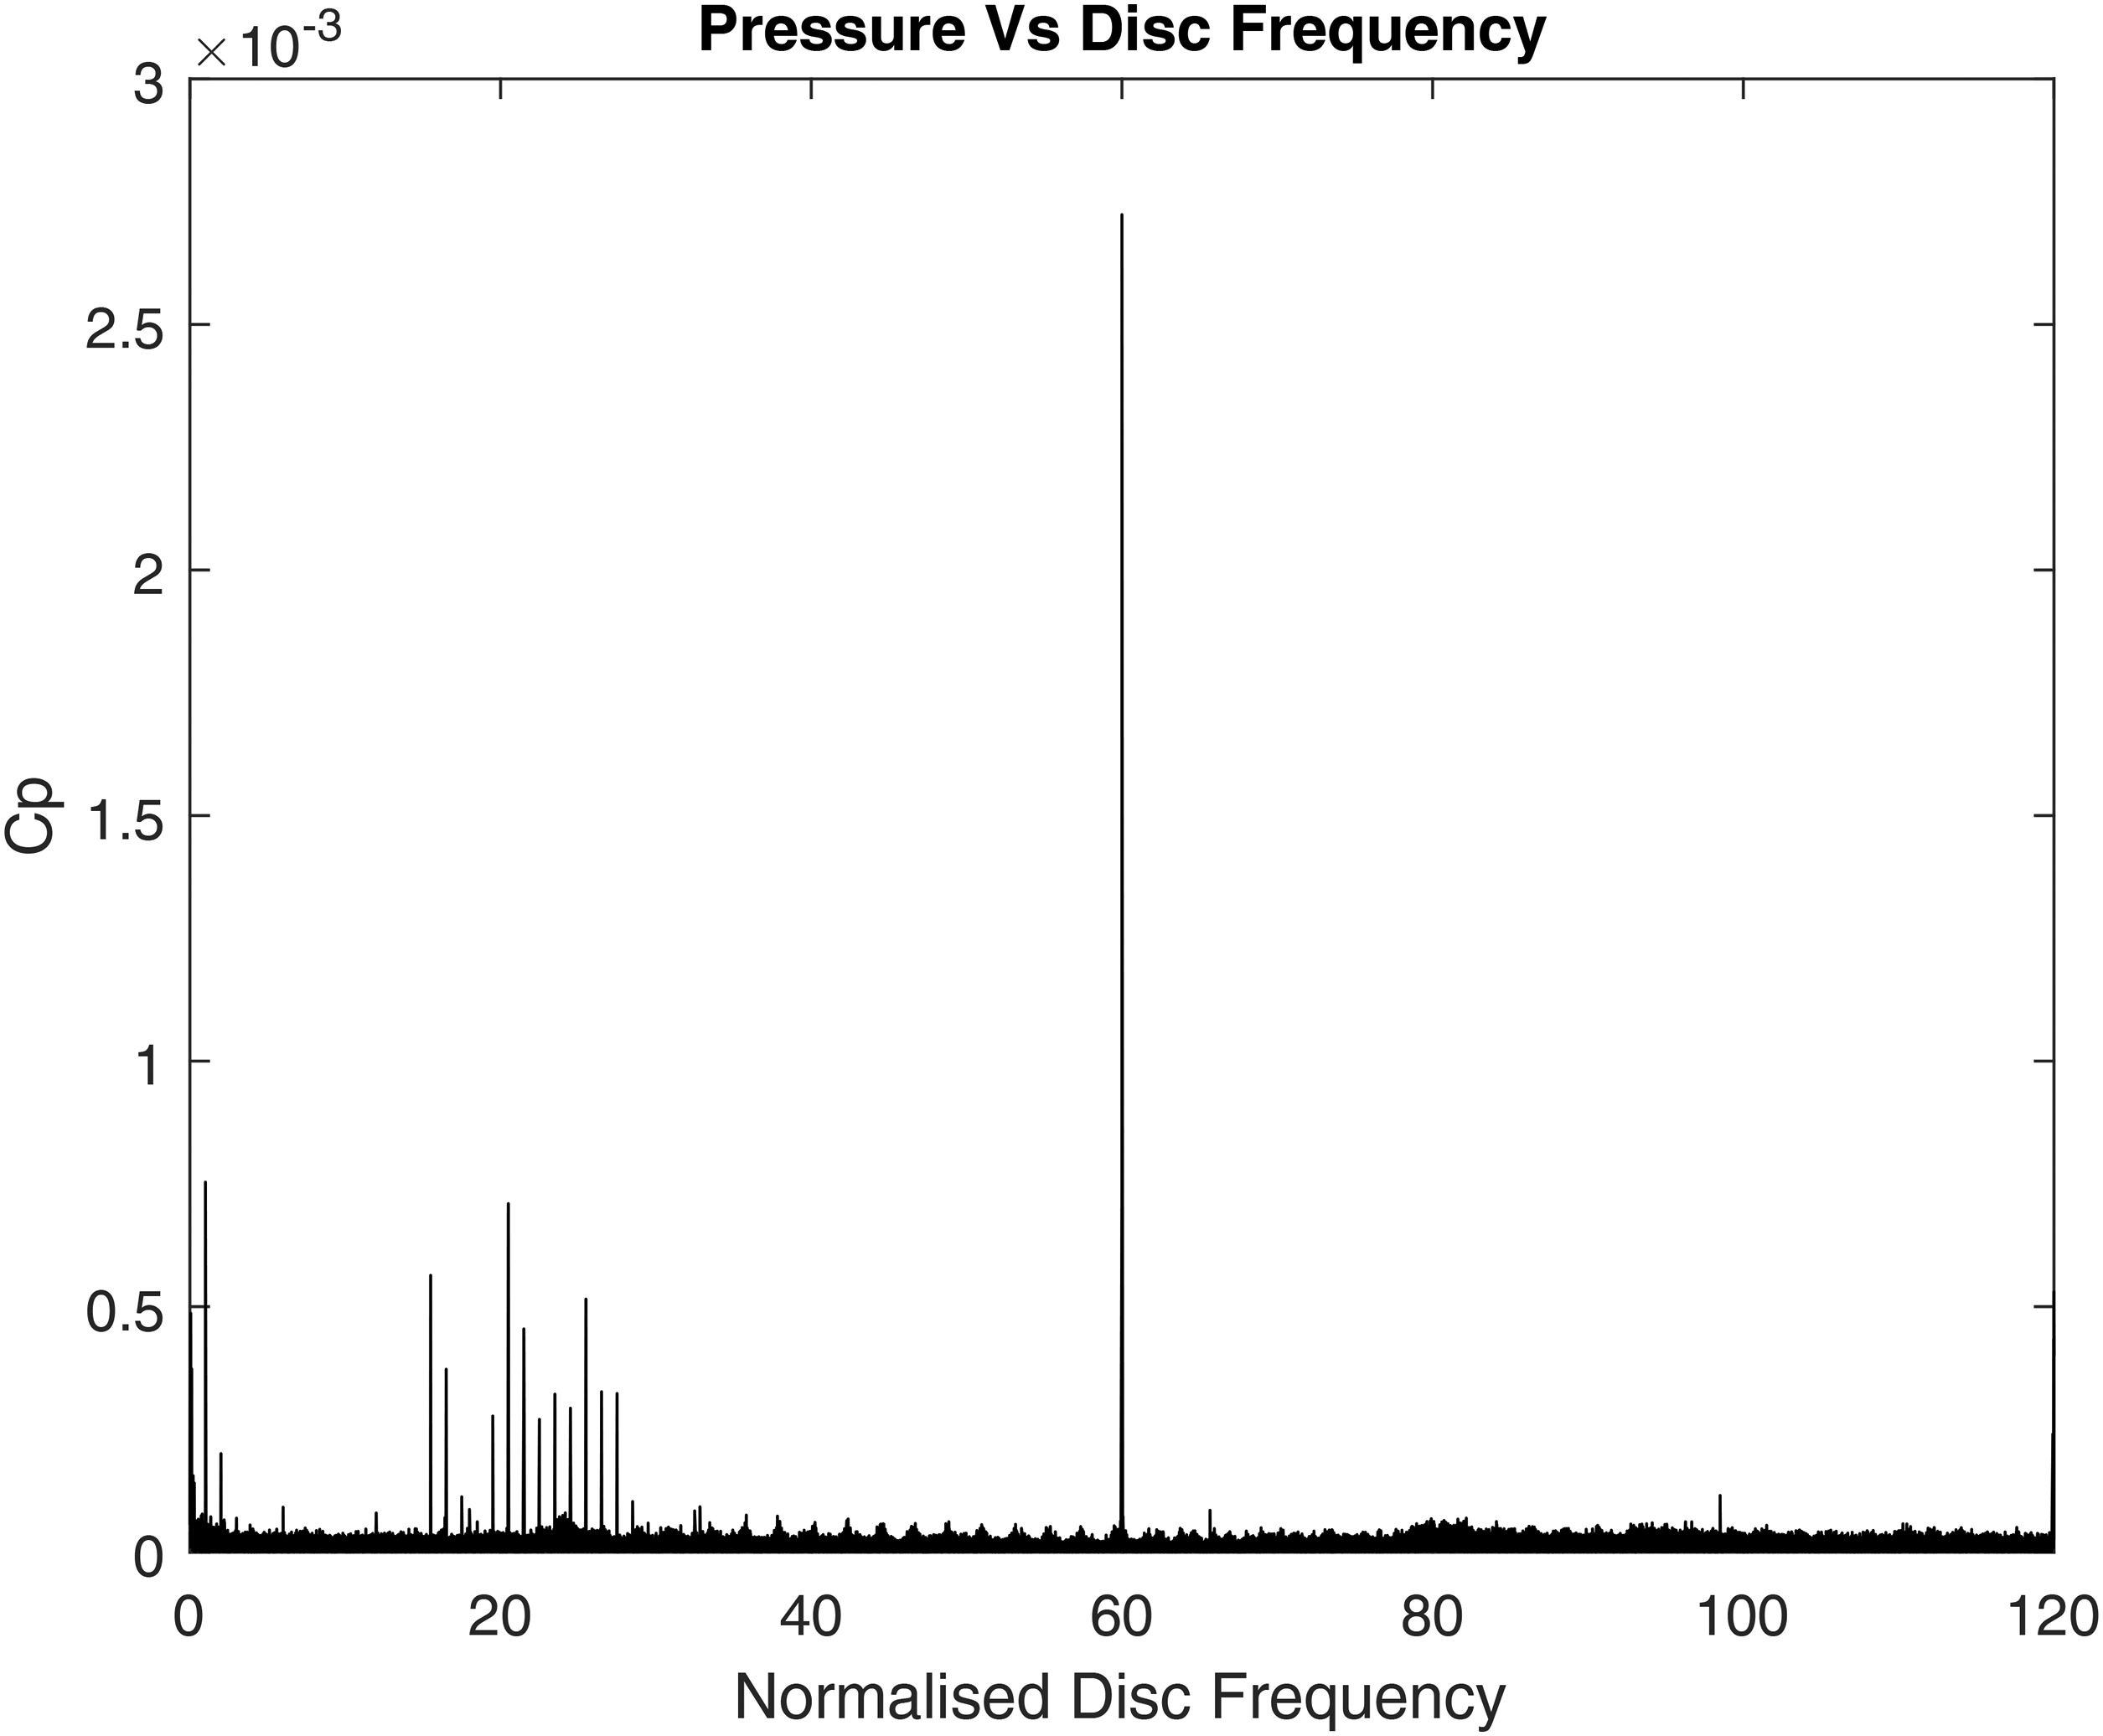
Figure 9.
Fast Fourier Transform at 94% hub radius and pitch of 100° at CF = 0.35, R e ϕ = 3.54 × 10 6
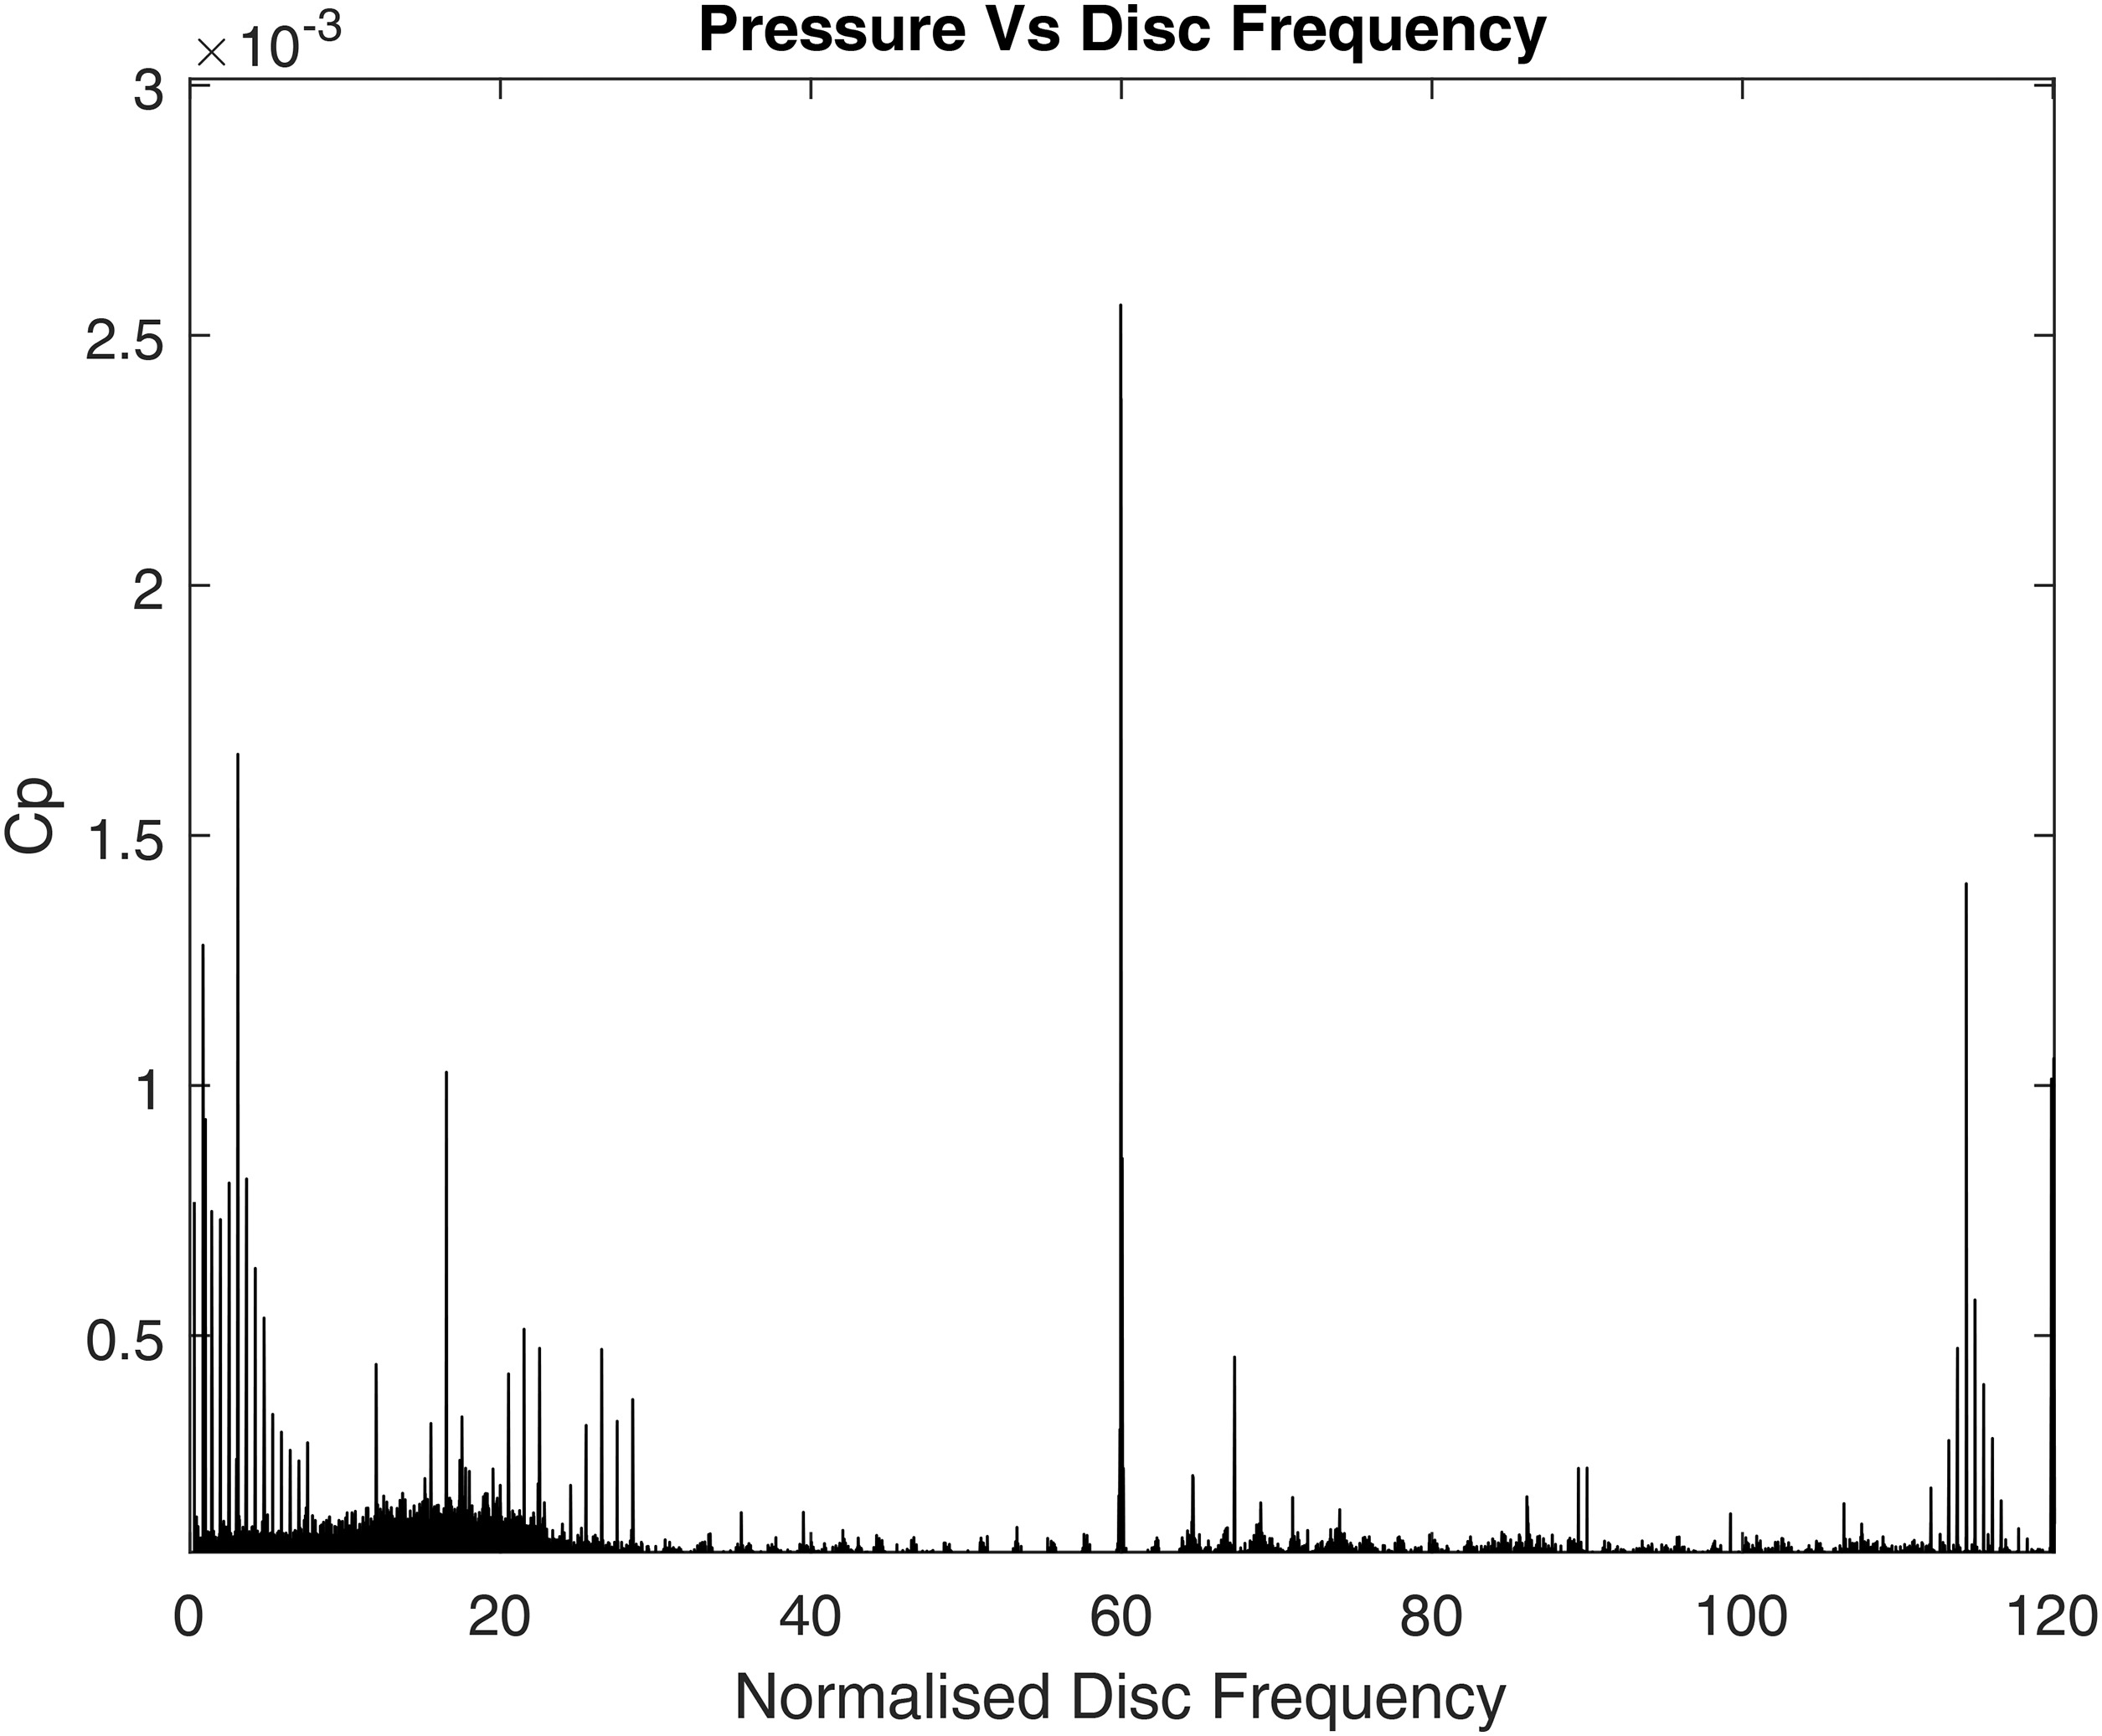
In all the FFTs the BPF is the most dominant response, however the disturbances below the BPF have been quite consistent with the range of interest of 18–26 f/fd. There is evidence of reduction of the magnitude (intensity) of the disturbance peaks due to introduction of higher purge flow from Φ0 = 0.05 to Φ0 = 0.075, through the cavity at the design flow coefficient of 0.35. A similar phenomenon was observed by (Horwood et al., 2019).
Having conducted similar analysis for all the pitchwise measurement locations, perturbations 15–25 and 27.5–30 times the disk rotational frequency revealed periodic growth and decay of amplitude every 15° between the pitchwise distributed transducers.
Additionally there are disturbances in the lower frequency range of 1–8 f/fd and higher range of 110–115 f/fd. These can be witnessed as more pronounced in Figure 9, but these disturbances although are prominent change in frequency with change in rotational speed, which could be indicative of physical interference from local or surface imperfections rather than fluid structures. The disturbances between the range of 18–26 also showed periodic growth and decay especially for the transducer pitch positions of 85°, 100° and 115°, which can be seen while comparing the FFTs from Figures 7 and 9.
However, at the 280° position shown in these figures the disturbances decay in strength particularly the lower range disturbances between 0.5–10 f/fd and the higher range disturbances (close to second harmonic of BPF) are almost completely damped, which suggest that if there are rotational structures moving at these frequencies, they are inconsistent and discontinuous as they get dissipated while travelling along the circumference of the wheel-space cavity near the chute seal. The disturbances close to the second harmonic of BPF could be a possible resultant of harmonics and non-linear combinations of the low frequency disturbances. But similar to the lower frequencies this is also inconsistent over the pitch change of 180° and hence they have not been attributed to any specific consistent rotational structures during the correlation process.
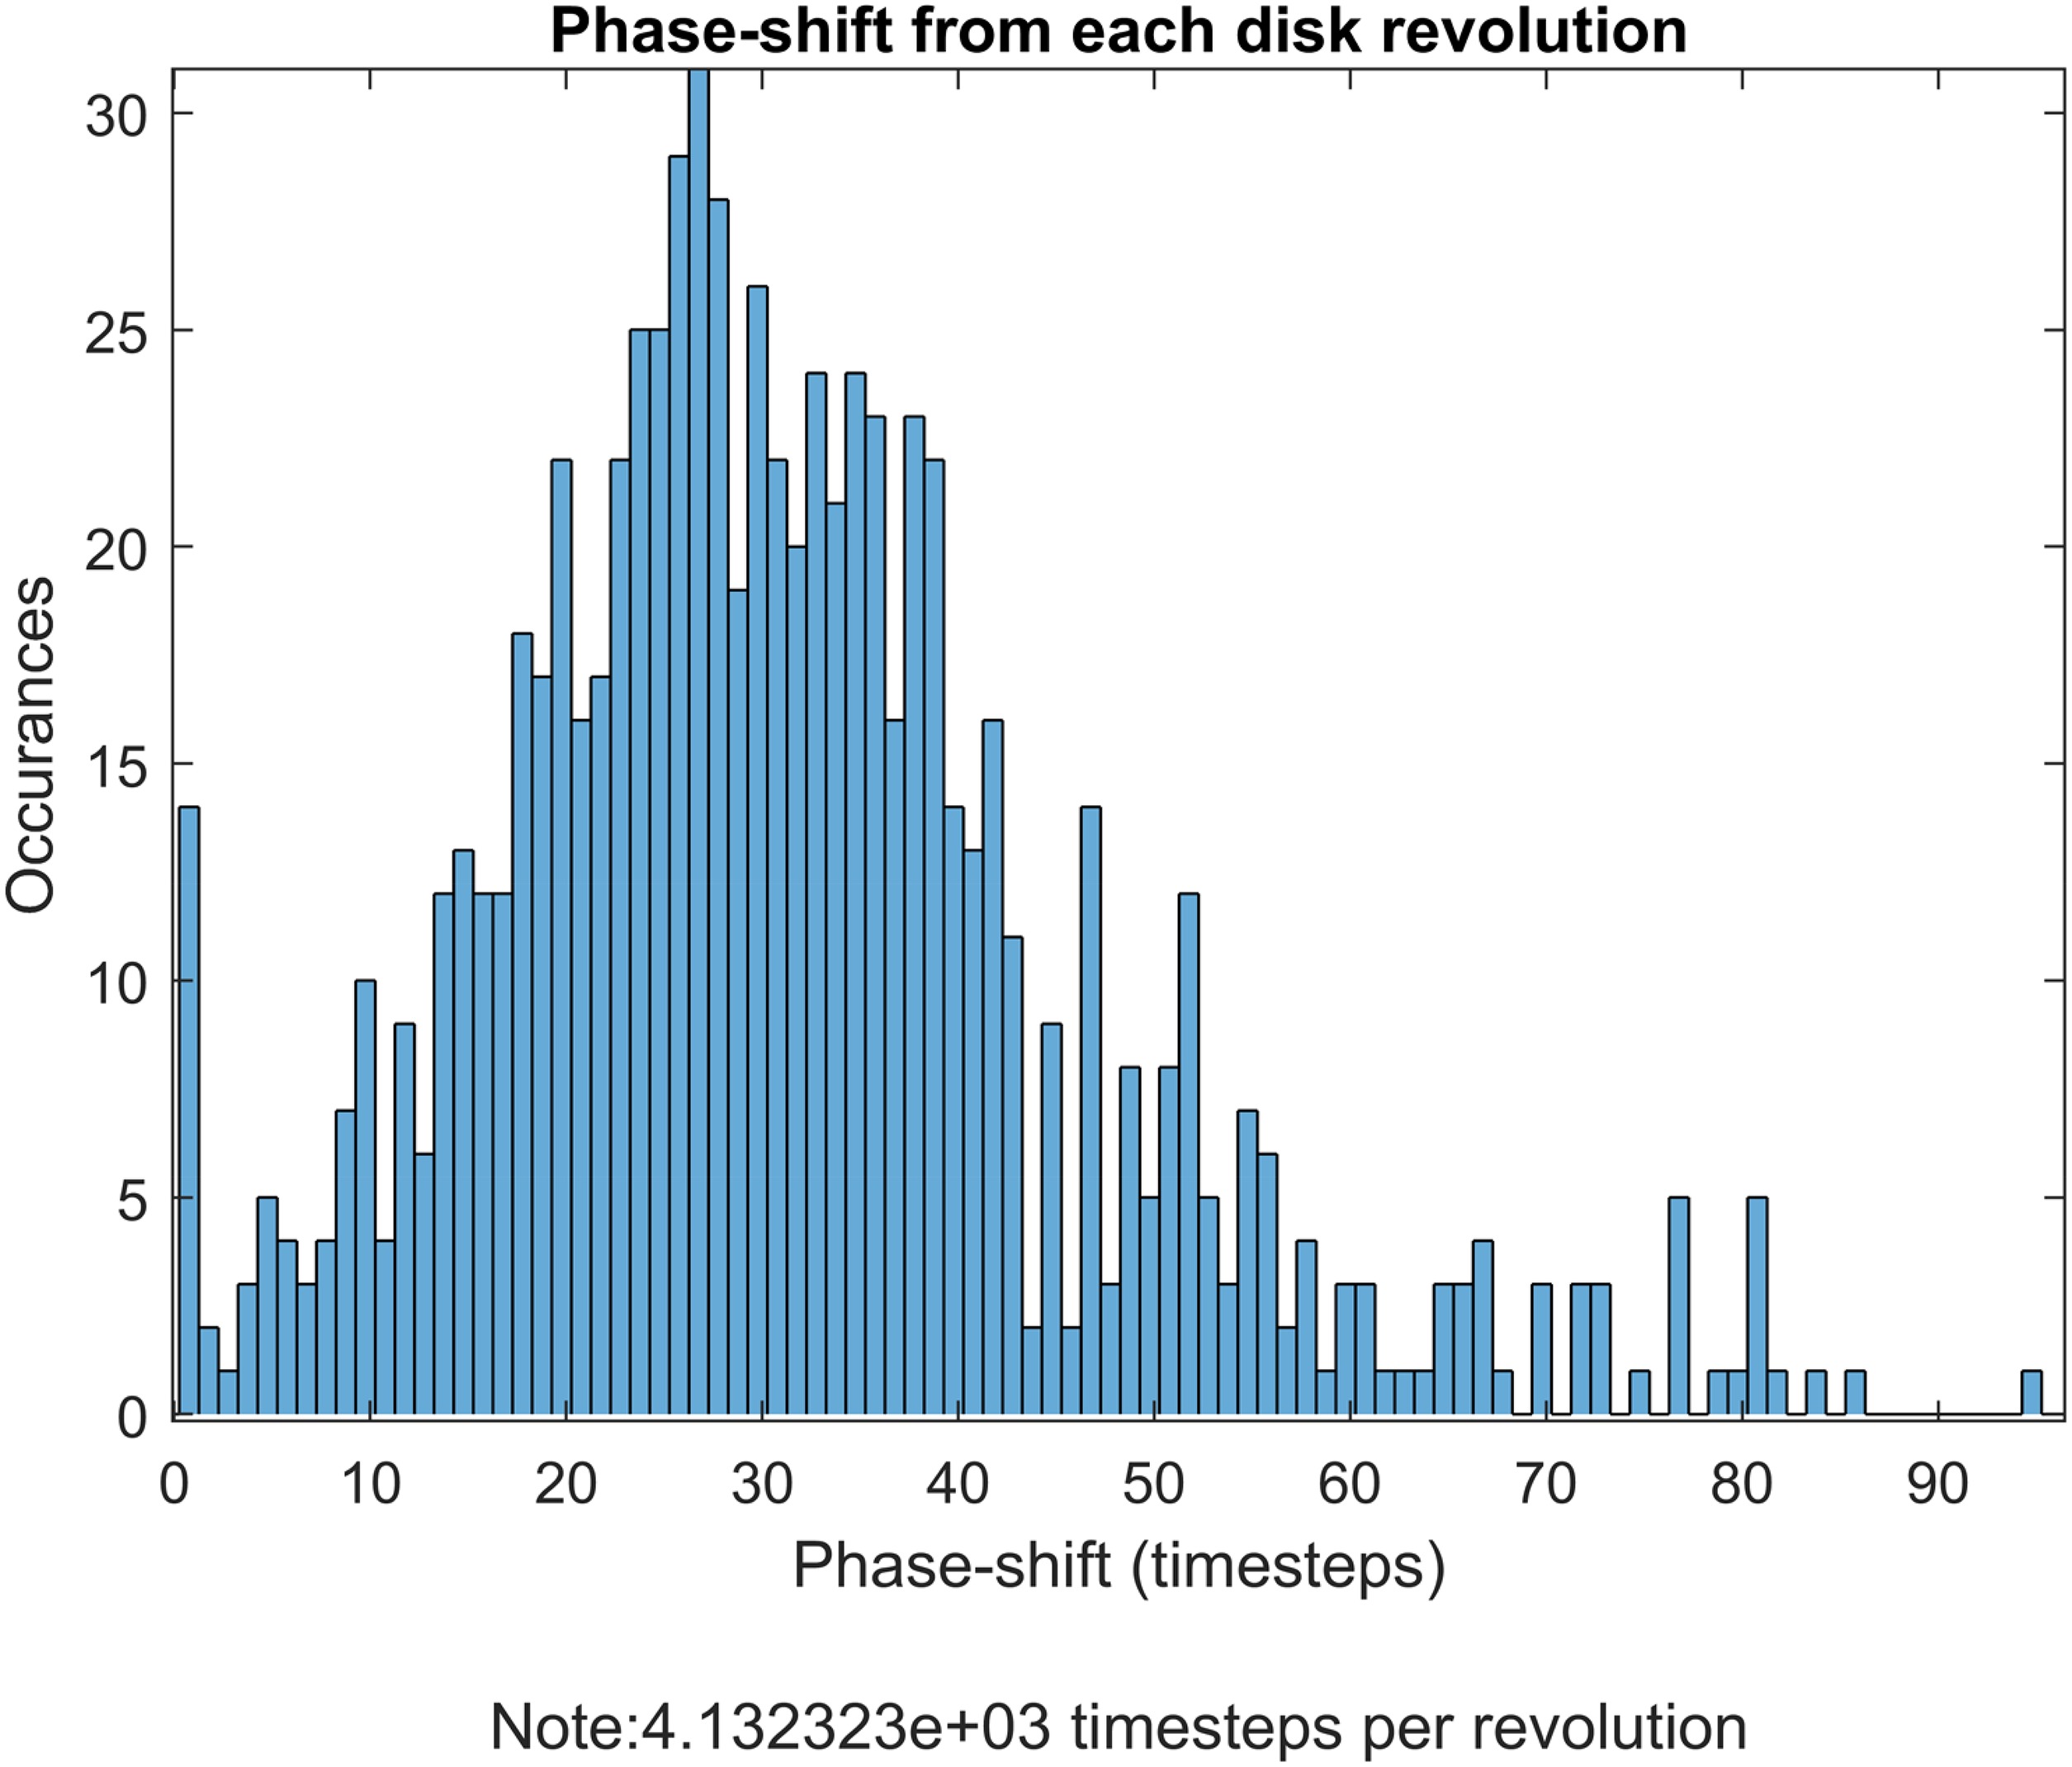
The unsteady flow structures close to the chute seal have been further investigated using cross-correlation between the circumferentially placed sensors at 85°, 100°, 115°, and 280°. This cross correlation is based on the phase difference between signals as explained by (Beard et al., 2017). A histogram was created using a cross-correlation algorithm for every rotor time period of revolution and for 800 revolutions. In each revolution the maximum correlation value and the associated phase was extracted. The lag time between the two signals was computed from this information along with the sampling frequency of the sensor, which was 500 kHz.
The histogram shown in Figure 10 was utilized to estimate the number of peaks found within each interval of normalized lag time.
Figure 10.
Histogram of number of samples associated with the phase shift between the two signals analysed over 800 rotor revolutions at CF = 0.35, R e ϕ = 3.54 × 10 6
The lag time was used to calculate the rotational speed of the rotating structures, following the method of Beard et al. These cross correlations were primarily conducted using a notch filter, where the frequency of interest was specified and a bandwidth of one disk rotational frequency provided a more accurate correlation. Eventually a scatter plot was created (see Figure 11) where the normalized lag time is distributed in intervals based on the frequency, or frequency range, of interest. Hence the maximum lag time is always computed for every revolution from the histogram and this lag time is normalized by the disk rotational frequency. Subsequently, this operation is repeated for all the possible pairs of the circumferential pitch positions. The vertical axis of Figure 11 represents the angle between these possible pairs of measurement points, and the normalized lag time is distributed on the horizontal axis. The diameter of the scatter points are an approximate representation of the amount of correlation with that specific time lag, i.e. the number of samples (or peaks) passing between those sensors with the calculated lag time.
Figure 11.
Scatter plot for cross-correlation between all pairs of sensor combinations for normalized purge flow of Φ0 = 0.05 at CF = 0.35 (10,600 RPM).
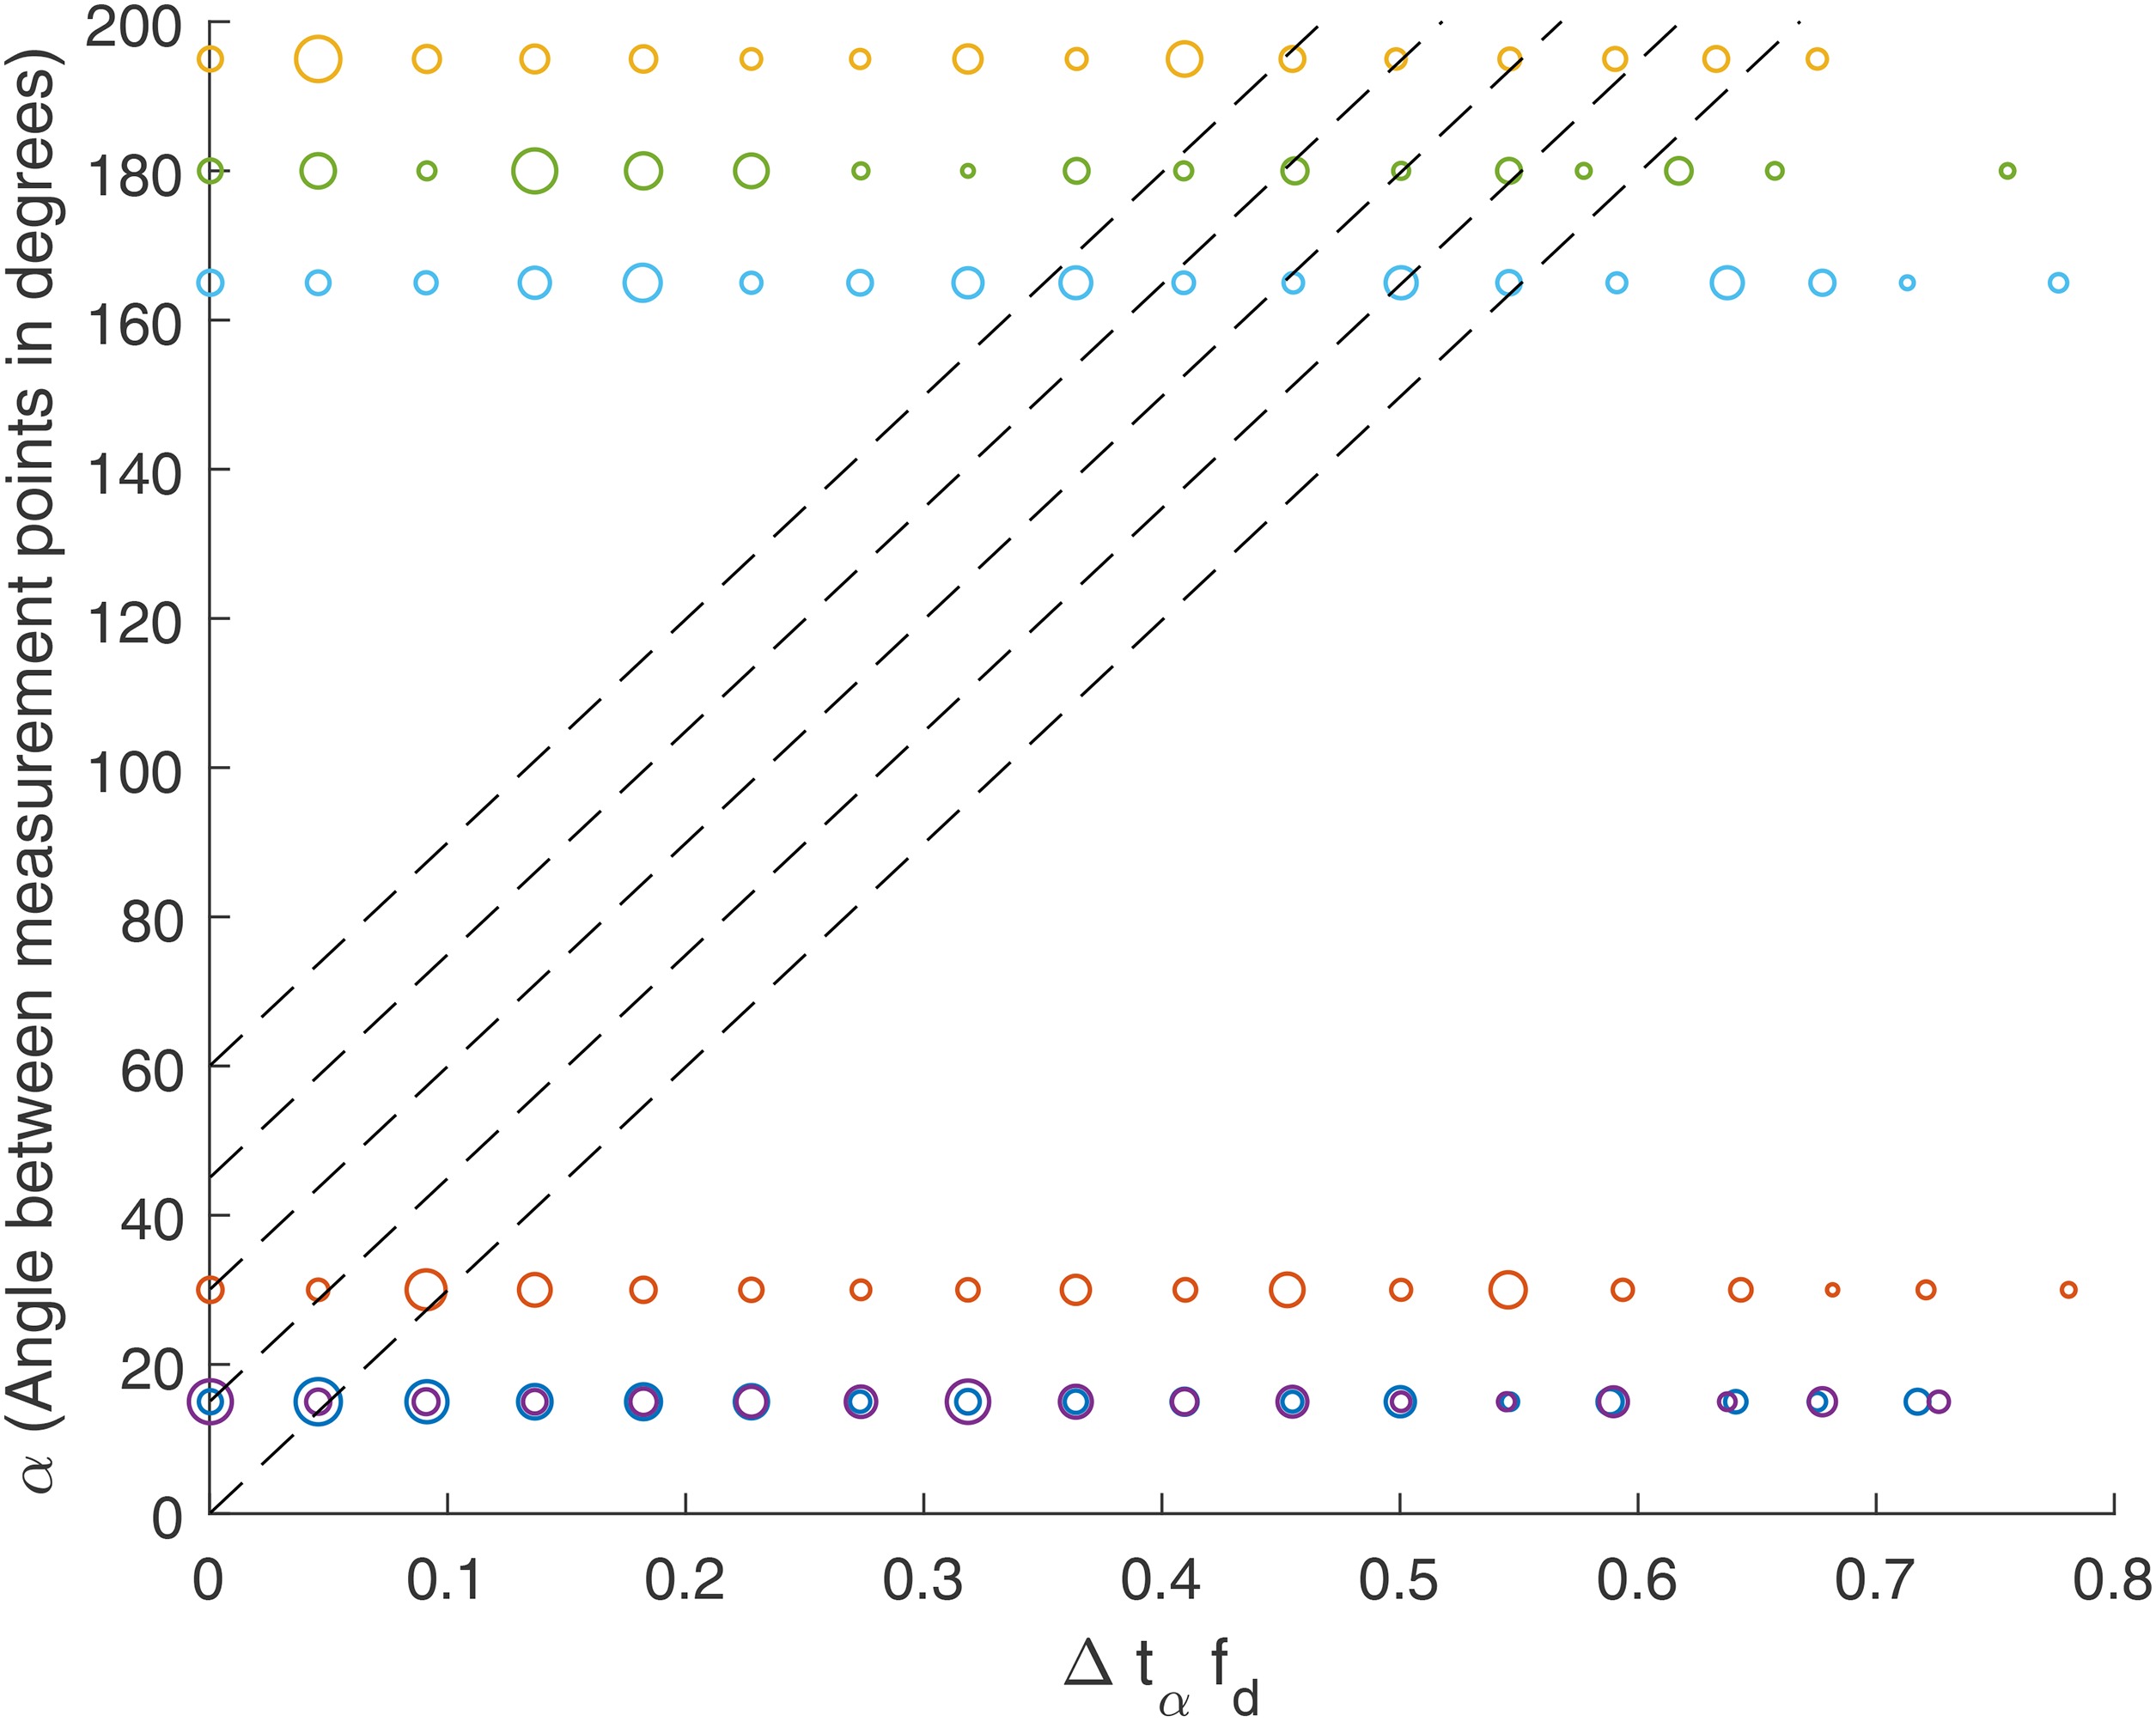
Following Beard et al., the slope of the dotted lines joining the correlated values between the pitch-wise sensor pairs is used to calculate the rotational speed of the structures. The number of structures is computed by the vertical distance between the intersections of these lines with the correlation values.
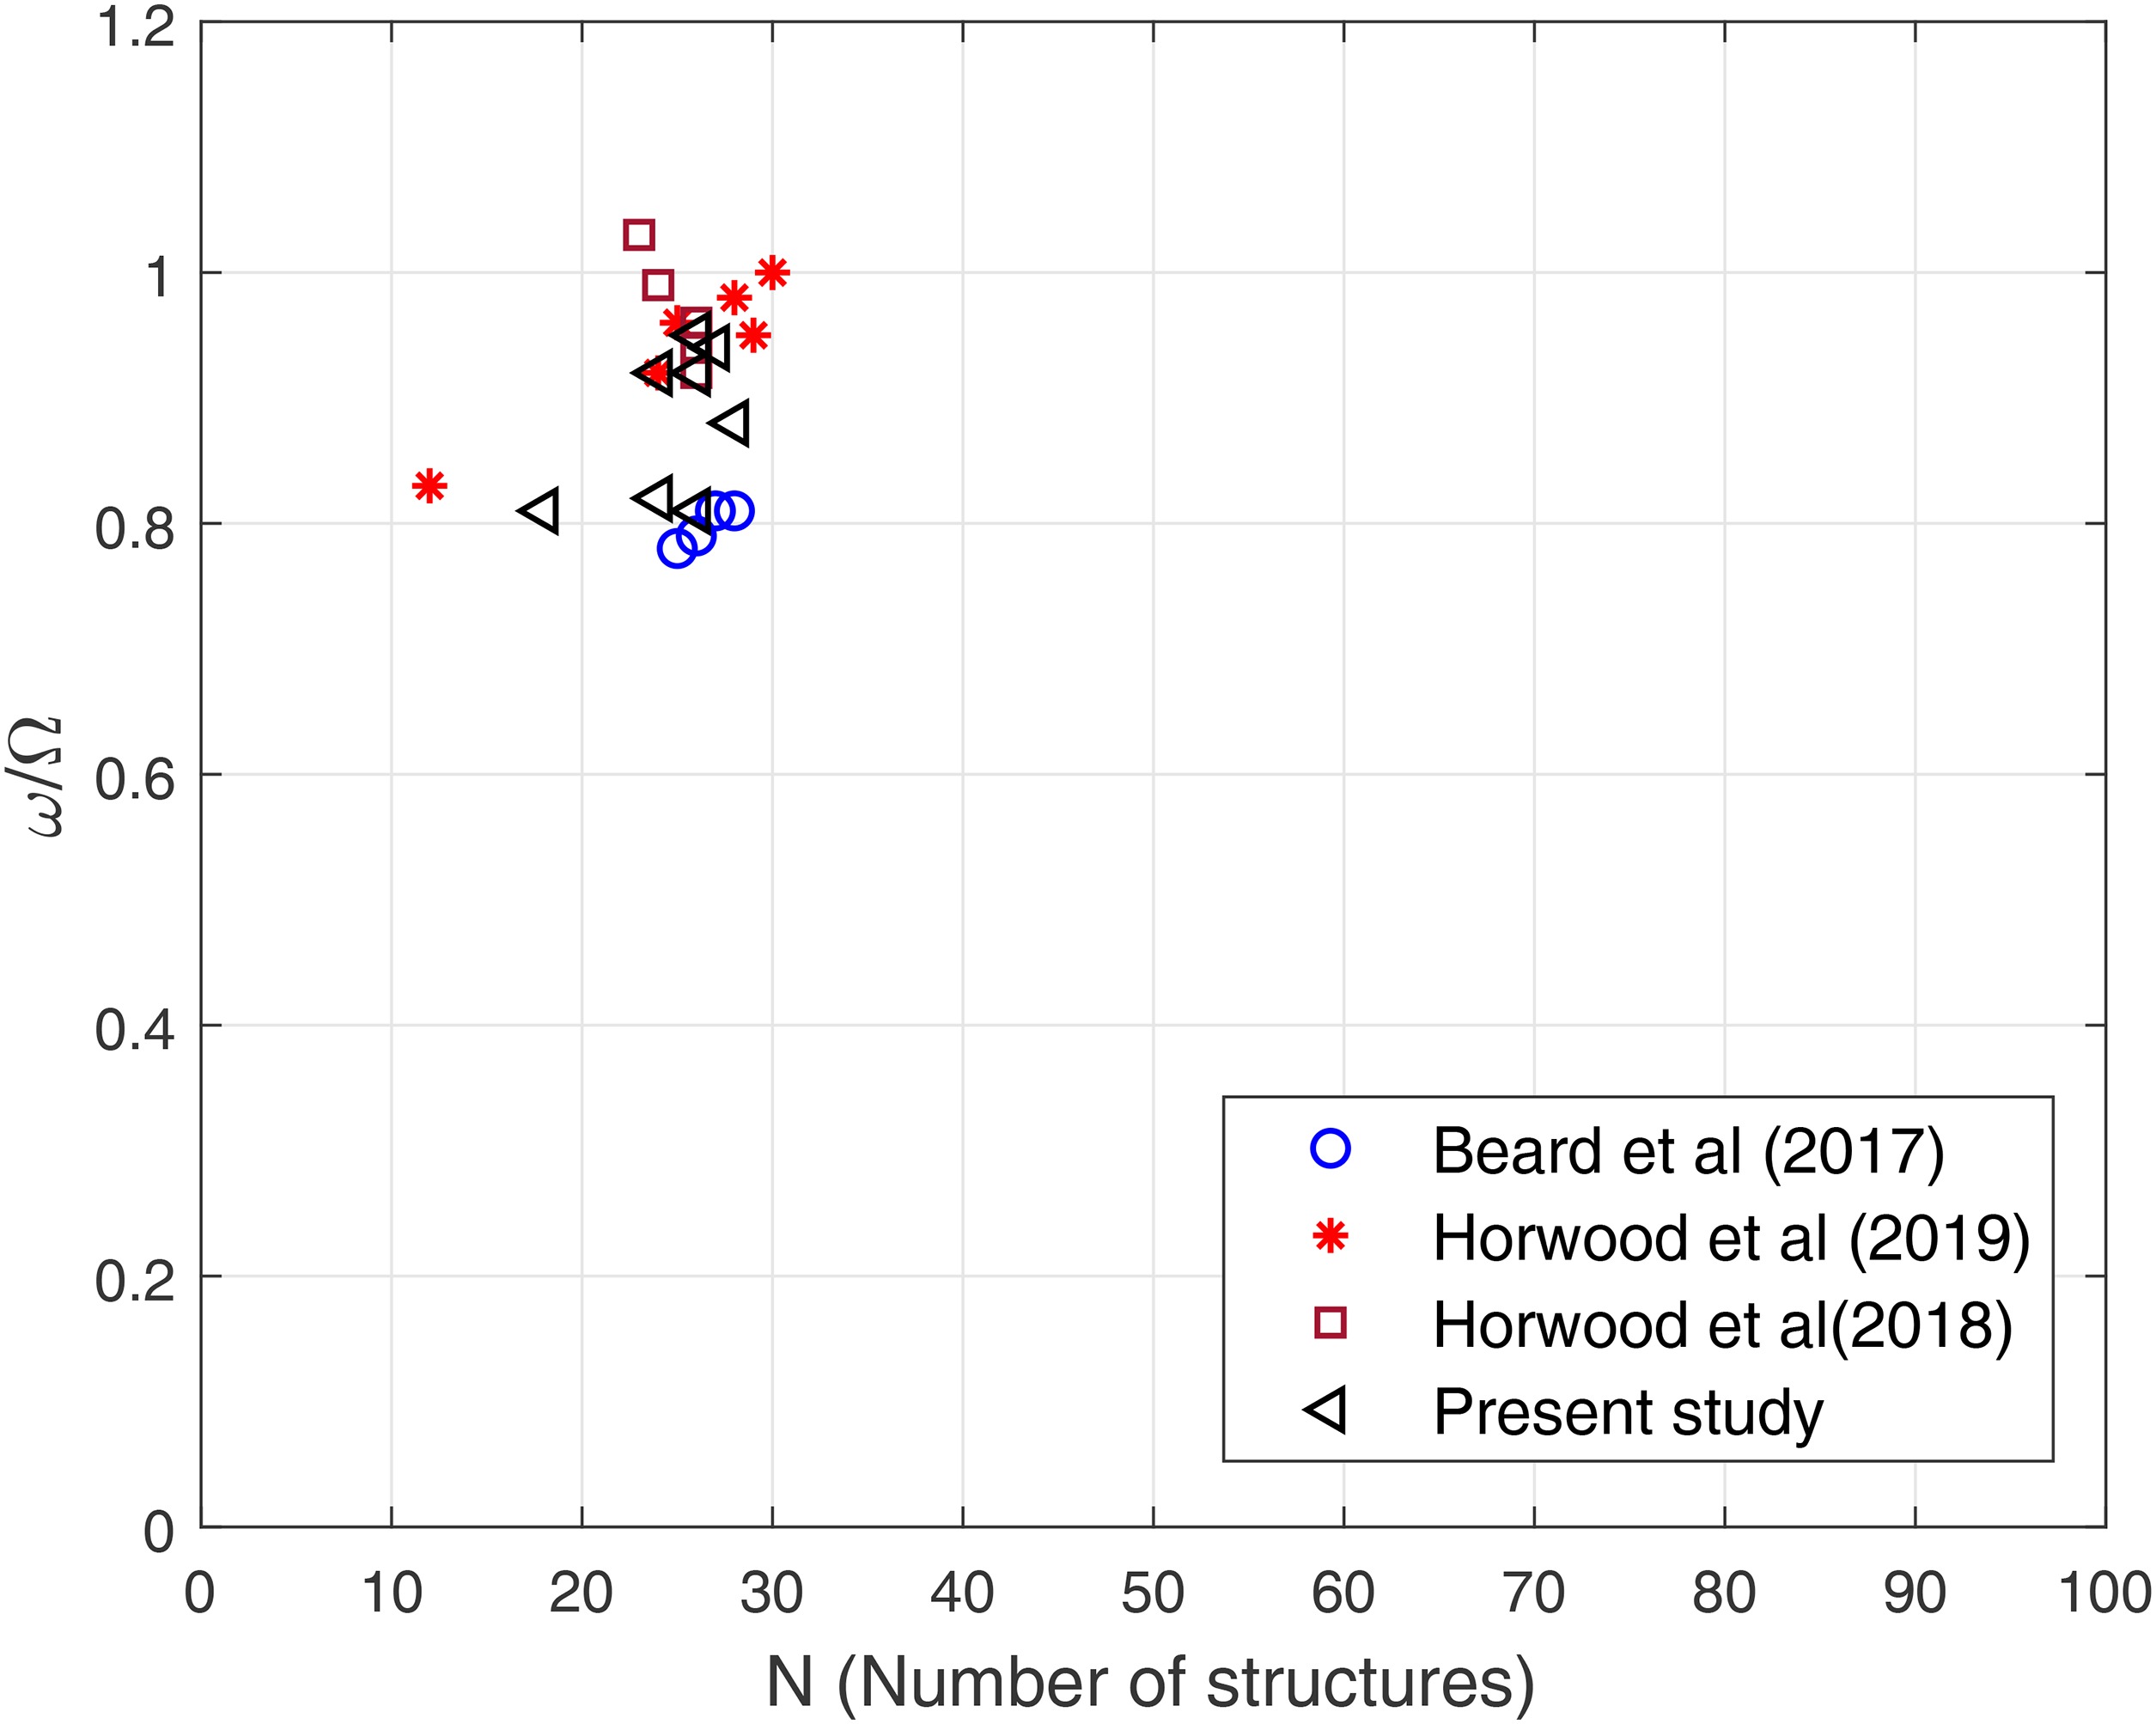
The correlation method based on the scatter plots were conducted for four different flow coefficients and for the two normalized flow rates of Φ0 = 0.075 and 0.05, respectively. The outcome from the analysis is provided in Table 2. The results are in accordance with previous published data (Beard et al., 2017; Horwood et al., 2019). The number of structures and their rotational speed are broadly similar to the published data.
Table 2.
Rotational speeds and number of large scale flow structures for various flow coefficients and purge rates.
Large scale flow structures were reported by (Horwood et al., 2019) for purge flow rates of 0.05 and 0.075 at CF = 0.35 and
Conclusions
An experimental investigation has been performed using a single stage turbine with a chute seal at the cavity periphery over a range of flow coefficients and purge flow rates.
Effectiveness of the chute seal is strongly dependent on purge flow rate and flow coefficient, CF. However, at high purge flow rates the sensitivity of effectiveness to CF reduces.
Effectiveness is weakly influenced by the rotational Reynolds number for a fixed purge flow rate and vane exit Mach number.
The effectiveness is sensitive to radial positions within the cavity and close to the chute seal the effectiveness is sensitive to the circumferential position relative to the vane.
The amplitudes and rotational speeds of these disturbances have been observed to be slightly reduced with increased purge flow rates.
The number and rotational speed of the unsteady structures (N and ω/Ω) are weakly sensitive to CF and consistent with measurements from other researchers (Beard et al., 2017; Horwood et al., 2019; Horwood et al., 2018; Chew et al., 2019).
Future work should investigate the disturbances for frequencies greater than the BFP, considering the possibility of stator wake vortex shedding. Such phenomena create frequencies identified to exist within the Strouhal number range (with significant intensities/ amplitudes) based on the stator-vane trailing-edge thickness.