Introduction
In 2014, the European Commission published its Energy Strategy 2030 09, which targets 27% of all energy consumed in EU to be renewable by 2030. The transition of the energy sector towards increased penetrations of renewable power will pose major challenges and opportunities for OEMs and utilities. Since renewable power cannot be dispatched, conventional power plants will face more cycling operation to accommodate variability in renewable production. At the same time, reduced wholesale electricity prices associated with the increased penetration of renewables necessitates lower marginal costs and therefore higher baseload and partload efficiencies of conventional power plants. Thus it is crucial for OEMs and utilities to quantify the financial benefits of new technologies and retrofit upgrades that enhance either flexibility or efficiency of the engines.
Several studies have investigated the impacts of increased renewable penetrations on operation and financial performance of conventional power plants 05, 21, 18, 23. A common limitation among all these prior studies is the aggregation of the power system to the level of countries or regions, assuming a lossless “copper plate” transmission system within the aggregated regions. However the performance of an individual power plant is significantly influenced by the topology and sufficiency of the adjacent transmission system, as well as by the presence of renewable installations like wind farms or solar arrays nearby. Hence, a more detailed power systems simulation model, which resolves the individual power plants within the power system, is required to reliably and quantitatively assess the impact of increased renewable penetration on the operation of individual conventional power plants. Therefore within this work, a novel power systems simulation framework, which simulates the operation of actual power plants within the transmission system, is applied. The goal of this work is to assess the impacts of increased baseload and partload efficiencies on cycling operation and financial performance of individual conventional power plants in central Europe in 2030.
Methodology
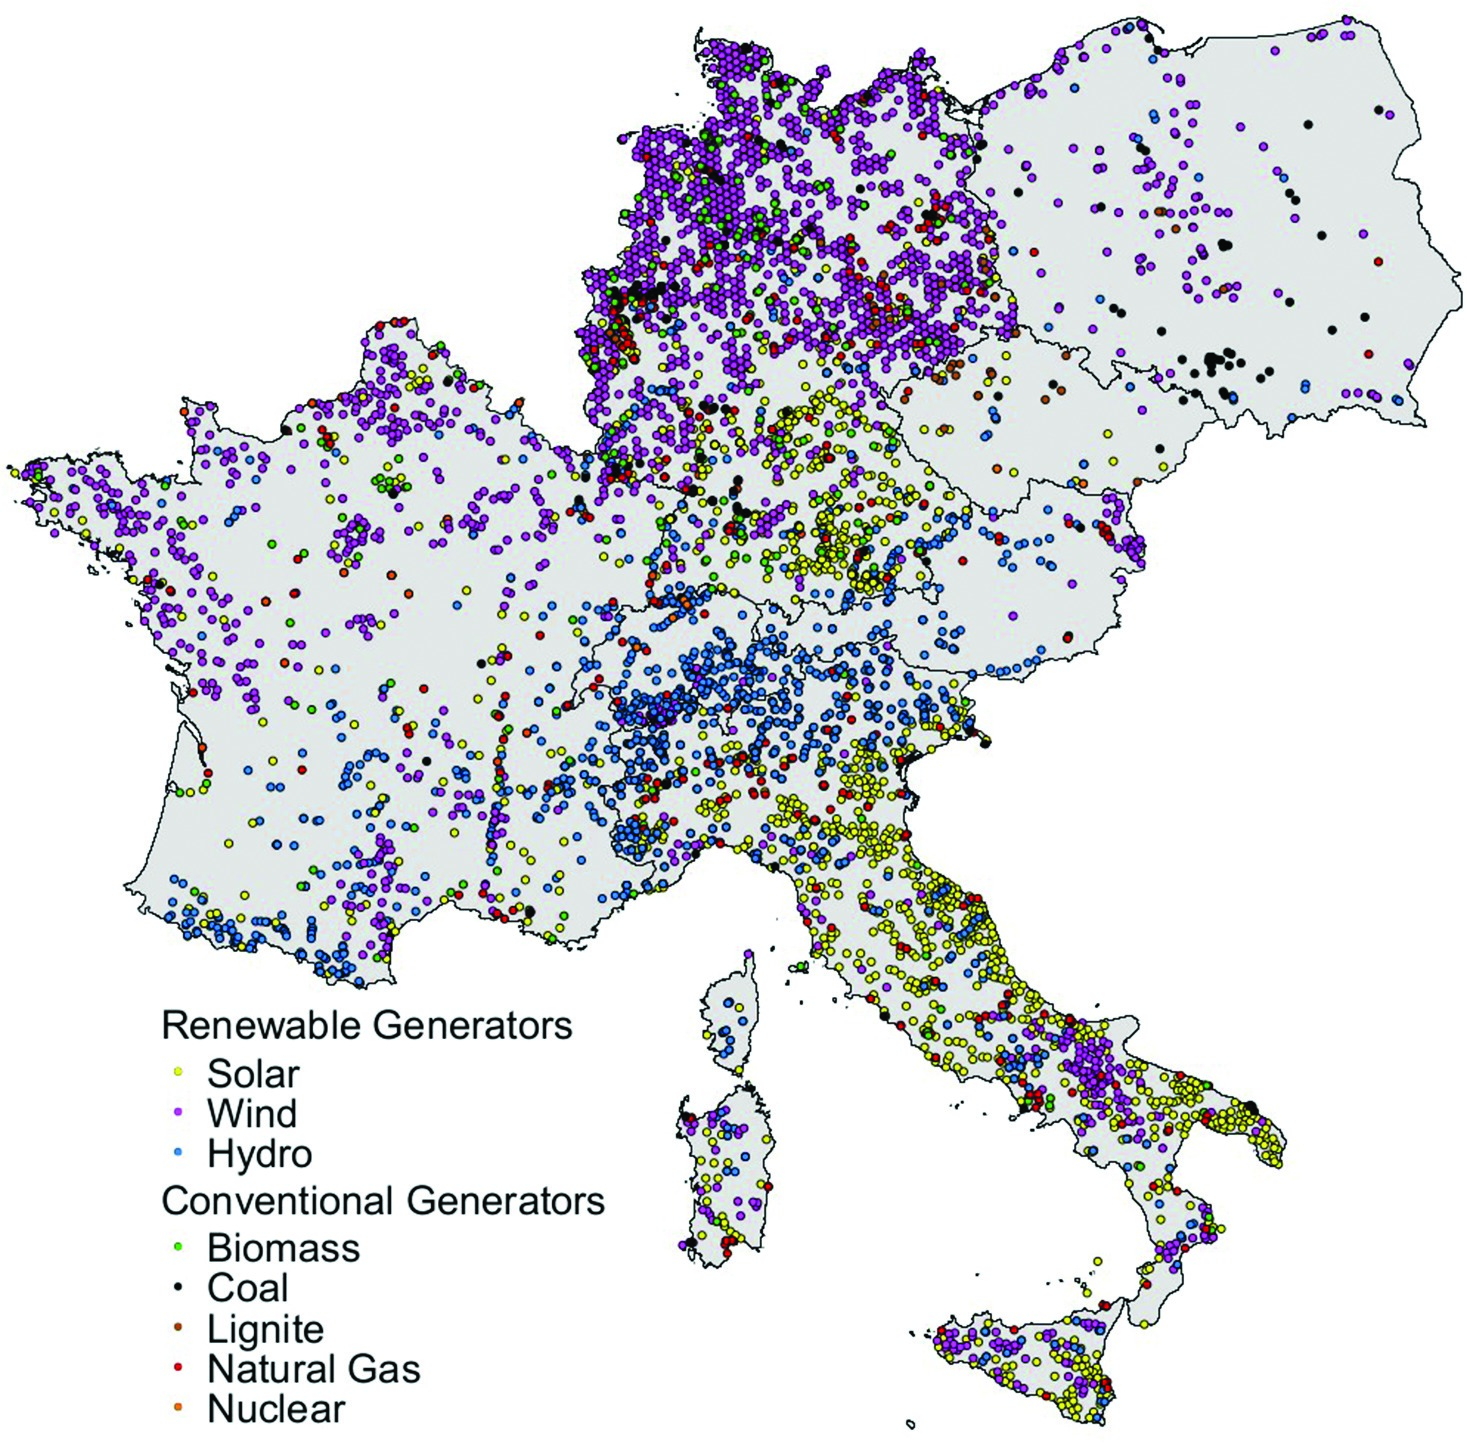
Our in-house power systems simulation framework EnerPol 19, 06 is applied in this work. Within EnerPol, a detailed geo-referenced representation of the central European power systems is the basis of hourly, chronological AC optimal power flow simulations. The generation model comprises 5,000 individual power plants, distinguishing between conventional and renewable power plants. Detailed thermodynamic models are applied to incorporate conventional power plants’ baseload and cycling operation, as well as costs and constraints of ramping 07. The exact geographic locations of the power plants are used in the model, as shown in Figure 1. The hourly energy production of solar and wind power plants is derived from in-house meso-scale weather simulations. The transmission system model consists of 3,000 high voltage transmission lines and 2,000 substations, as shown in Figure 2. The hourly cross-border power flows to the non-simulated neighboring countries are derived from ENTSO-E statistics 04 and are distributed across the tielines proportionally to the tielines’ capacity ratings. The hourly end-user electricity demand is differentiated by the consumer groups of households, industry, commerce and transportation and is spatially allocated with respect to each consumer group’s density distribution. The resulting hourly electricity demand is aggregated to the nearest substation. More information about the applied simulation framework is given by the present authors in 07.

Improved partload and baseload efficiencies for selected power plants
To investigate the impacts of increased partload and baseload efficiencies on the operational and financial performance of conventional power plants, a set of 45 coal and natural gas combined cycle (NGCC) power plants, whose characteristics are summarized in Table 1 and whose locations are shown in Figure 3, are considered to be upgraded in 2030. These power plants cover a wide range of nameplate capacities so that the effects of increased penetration of renewables on representative conventional power plants can be investigated. To minimize the influence of one upgraded power plant on other upgraded power plants, the power plants have geographically dispersed locations, as shown in Figure 3. In total, the upgraded power plants represent 5% of the total installed generation capacity in central Europe.

Table 1.
Characteristics of coal and gas power plants that are upgraded in this work.
| Number of upgraded power plants | Capacity [MW] | Total Capacity [GW] | |
|---|---|---|---|
| Coal | 18 | 105–1730 | 11.6 |
| Gas | 27 | 86–1040 | 12.8 |
Within the simulation framework, merit order dispatch is used for each hour to determine the most cost-effective power plant portfolio that satisfies the corresponding power demand. An increase in either partload or baseload efficiency reduces a plant’s marginal cost of power production; hence the power plant is dispatched more frequently as its marginal cost is lower on the merit order curve. While an increase in baseload efficiency results in the power plant being dispatched more in baseload, an increase in partload efficiency enables the power plant to gain market shares during periods of low prices, whereas without the increase of the partload efficiency, it would not have been profitable to dispatch the power plant. This simulation framework therefore represents an operational response to increased efficiency, which realistically simulates power plants’ operation in the real wholesale market.
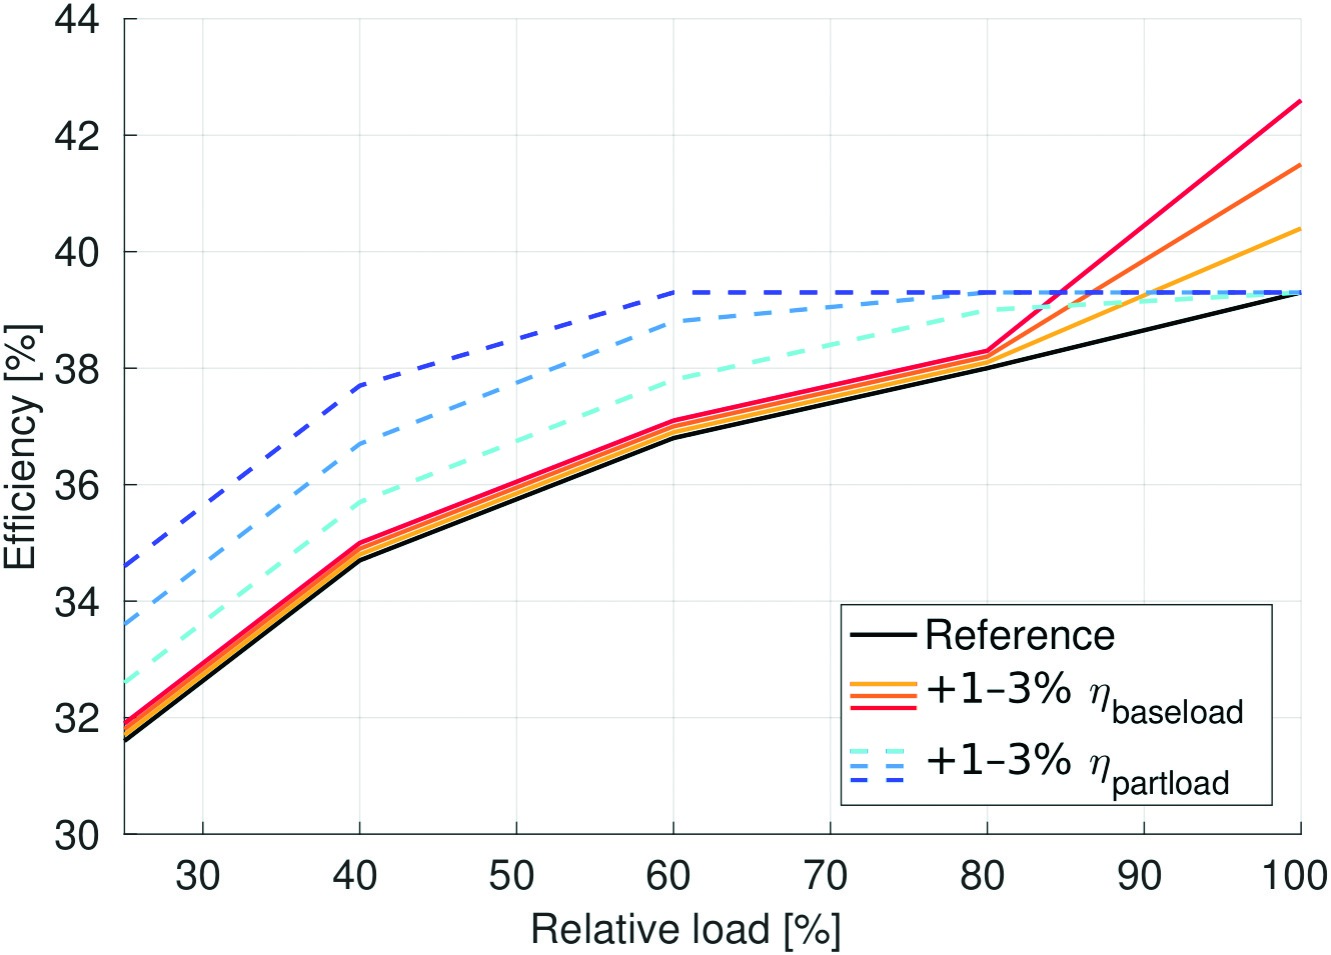
For each of the upgraded 45 power plants, the efficiency curves are adapted to reflect the assumed increase in partload or baseload efficiency, as shown in Figure 4. To enable an assessment of the impacts of different extents of efficiency improvements, the baseload and partload efficiencies are increased by 1%, 2% and 3%. The efficiency curves for the baseload efficiency increase scenarios are adapted only in the 100% load point, to enable a clear distinction in simulation results between partload and baseload efficiency increases.
Power system of central Europe in 2030
The 2030 power system model is derived as follows from the 2013 model that is described above. The power demand is scaled proportionally with the projected developments in population for all simulated countries 22. Projections for increased penetrations of renewables are obtained for the year 2020 from the national renewable energy action plans of the simulated countries 01, 02, 14, 15, 16, 17, 03. These 2020 projections are extrapolated to 2030 to obtain the generation model of the 2030 baseline scenario. A summary of actual and derived renewable capacities and predicted population developments is given in Table 2.
Table 2.
Actual and predicted installed renewable capacities and population developments for 2013 and 2030.
A complete phase-out of nuclear power by 2030 is considered for Germany, which is in accordance with political targets 10. For Switzerland, a phase-out of all nuclear power plants except for NPP Leibstadt is used. The installed capacities of coal, lignite and gas power plants for the 2030 reference scenario are not varied from the 2013 capacities. A coal price increase of 26% and a gas price increase of 14% compared to 2013 are anticipated for 2030 12. As more stringent CO2 restrictions are anticipated for 2030 08, the price of CO2 certificates is considered to increase from 6 €/tCO2 (in 2013) to 20 €/tCO2 (in 2030).
The total annual costs of cycling are derived from unit-specific cycling costs, which are based on actual US power plants 13 and are summarized in Table 3. The cycling cost factors of Table 3 are applied to derive the annual cost of cycling for each upgraded coal and NGCC power plant.
Results and discussion
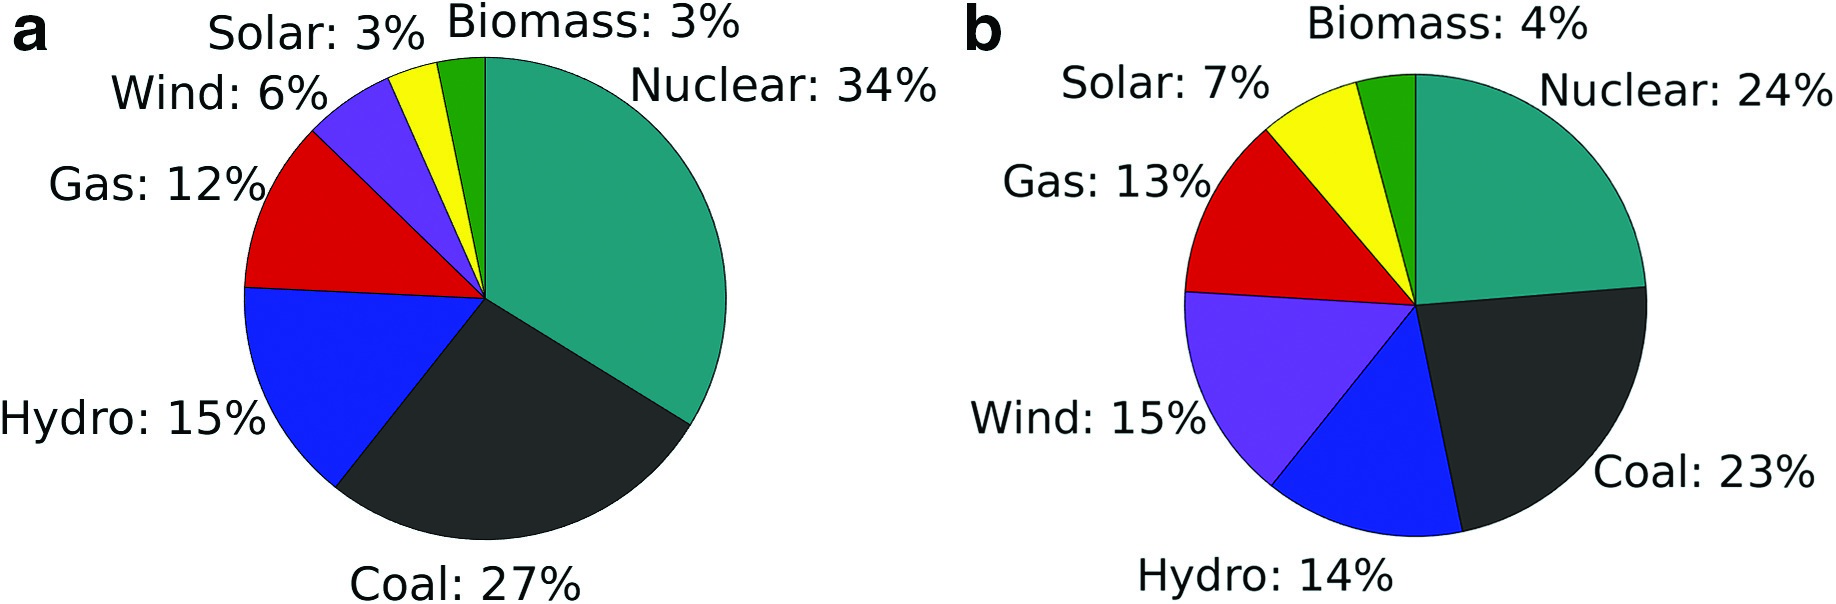
Figure 5 and Figure 5 show the simulated market shares of the different generation technologies across Europe for 2013 and the 2030 reference scenario. As one would expect, the market shares of the renewable power sources are significantly increased in 2030 compared to 2013. The market share of wind is increased from 6% to 14%; the increase for solar power is 3% to 7%. At the same time, coal power is replaced by gas power due to the increase in CO2 emissions prices, which causes coal to lose market share (27% to 23%) and gas to gain slightly (12% to 13%). The market share of nuclear power is significantly reduced (34% to 24%) due to the nuclear phase-outs in Germany and Switzerland by 2030.
Figure 5.
(a) Market shares of power generation technologies in 2013. (b) Market shares of power generation technologies in 2030.
This market shift from dispatchable, baseload nuclear power to non-dispatchable wind and solar power results in new opportunities and challenges for coal and gas power plants. Table 4 summarizes the operational statistics for the selected set of power plants (see Figure 3 in the years 2013 and 2030. In Table 4, power ramps are classified as “load following” when ramping more than 25% of the plant’s nameplate capacity within an hour, and as “grid balancing” ramps otherwise.
Table 4.
Annual operational statistics for the upgraded power plants in 2013 and 2030.
| 2013 | 2030 | |
|---|---|---|
| Capacity factor | ||
| Coal | 0.36 | 0.24 |
| NGCC | 0.15 | 0.26 |
| Number of starts | ||
| Coal | 26 | 65 |
| NGCC | 243 | 280 |
| Number of load following ramps | ||
| Coal | 30 | 65 |
| NGCC | 344 | 660 |
| Number of grid balancing ramps | ||
| Coal | 503 | 1,100 |
| NGCC | 724 | 683 |
As Table 4 shows, the upgraded coal power plants face major financial setbacks in the reference scenario of 2030. Besides having a reduced capacity factor (0.36 to 0.24), which corresponds to less electricity sold on the market, both starts and ramps are doubled since the coal power plants have to adjust to the increased variability of renewable power flows. The upgraded NGCC power plants also cycle more, especially as regards load following ramps. But at the same time, the NGCC plants achieve higher capacity factors (0.15 to 0.26), which signifies higher potential for revenue of the NGCC plants in 2030.
Comparing results for coal and NGCC power plants
Table 5 provides a summary of annual revenues, averaged over all upgraded power plants, distinguished by coal and NGCC power plants. In this work the revenues are presented per MW of nameplate capacity, termed “capacity-specific revenue,” in order to provide a consistent comparison of the upgraded power plants.
Table 5.
Impact of increased efficiencies on annual capacity-specific revenue (million €/MW) of upgraded power plants.
| Baseload efficiency increase | Reference | 1% | 2% | 3% |
| Coal | 0.27 | 0.30 | 0.37 | 0.41 |
| NGCC | 0.32 | 0.33 | 0.34 | 0.38 |
| Partload efficiency increase | Reference | 1% | 2% | 3% |
| Coal | 0.27 | 0.28 | 0.29 | 0.29 |
| NGCC | 0.32 | 0.35 | 0.38 | 0.41 |
The annual revenues of the upgraded power plants in the 2030 reference scenario are 0.27 m€/MW and 0.32 m€/MW for coal and gas, respectively. This is at the upper end of today’s price ranges, which historic data shows to be in the order of 0.27 million €/MW for coal 11, and 0.24 to 0.34 million €/MW 20 for NGCC, since price increases are assumed for coal, gas and CO2 emissions certificates, which increase the electricity price across the European power system. It can be seen, that the selected NGCC power plants achieve on average higher capacity-specific revenues than the selected coal power plants. This is because the coal price is assumed to increase more (+26%) than the gas price (+14%) until 2030, and because the increase in CO2 prices shifts market shares from coal towards NGCC plants, as the capacity factors in Table 4 also indicate. Furthermore, as can be seen from Table 5, there is a fundamental difference in operational requirements between coal and NGCC power plants in 2030: While the upgraded coal power plants profit significantly from increased baseload efficiencies (0.27 to 0.41 m€/MW), there is only a small increase in revenues for coal plants from increased partload efficiency (0.27 to 0.29 m€/MW). On the contrary, NGCC plants profit slightly more from increased partload efficiencies (0.32 to 0.40 m€/MW) than from increased baseload efficiencies (0.32 to 0.38 m€/MW).
This effect is can be seen in more detail in Figure 6 and Figure 7, which shows the capacity-specific revenue for all efficiency scenarios for the investigated coal (Figure 6) and NGCC (Figure 7) power plants as a function of the capacity factor in the reference scenario.
Figure 7.
Annual capacity-specific revenue (m€/MW) as function of reference scenario capacity factor for upgraded NGCC power plants in 2030, for increased baseload (Figure 7a, top) and partload (Figure 7b, bottom) efficiency.
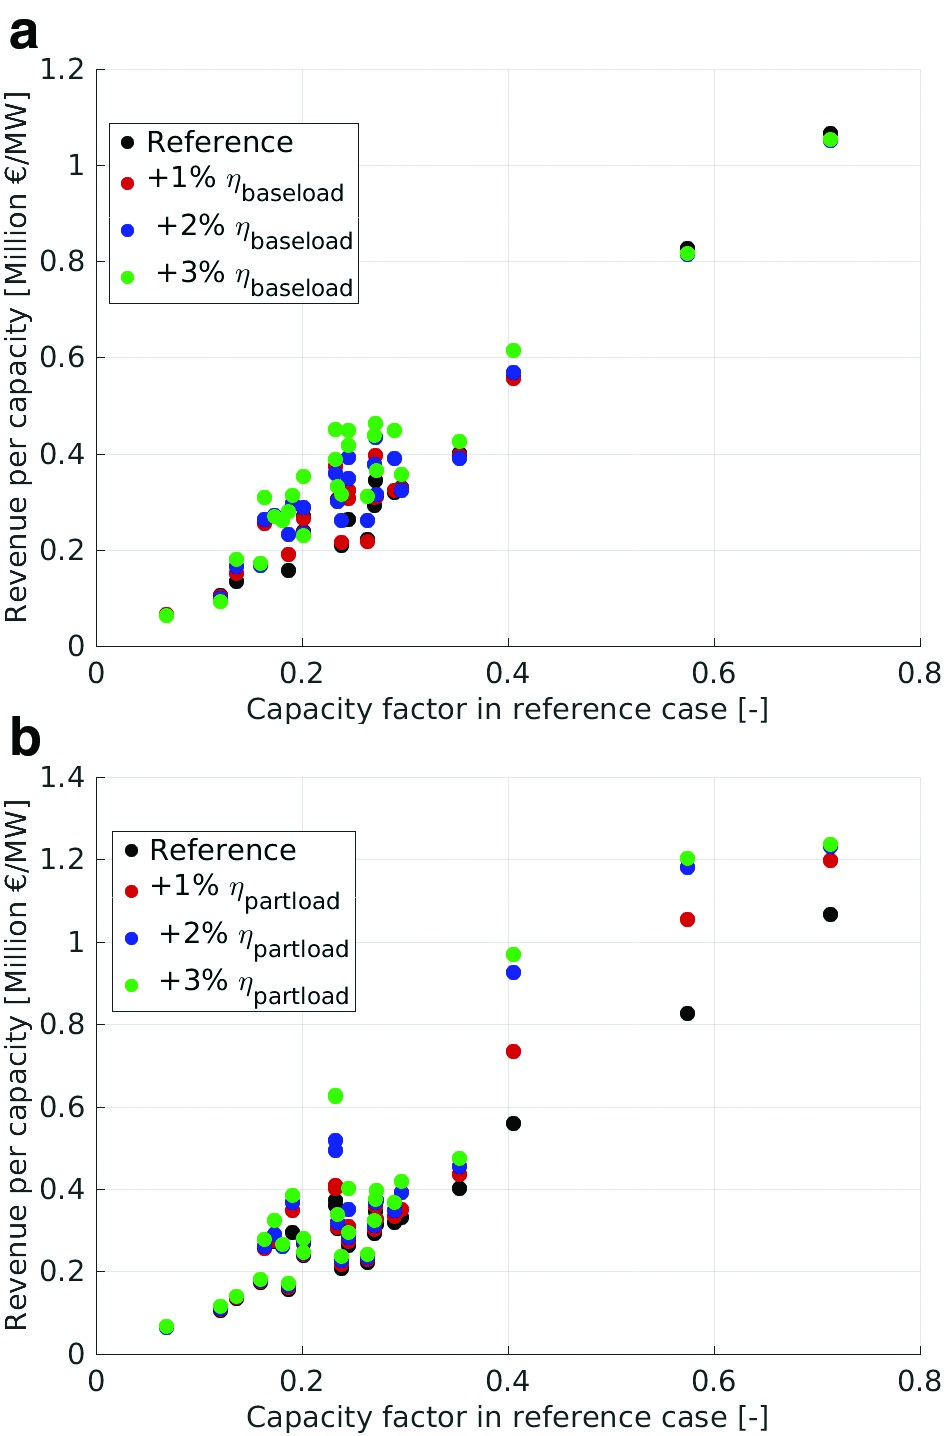
Figure 6.
Annual capacity-specific revenue (m€/MW) as function of reference scenario capacity factor for upgraded coal power plants in 2030, for increased baseload (Figure 6a, top) and partload (Figure 6b, bottom) efficiency.

As Figure 6 shows, there is an increase in revenues for coal power plants with increasing baseload efficiency. This is mainly because coal power plants, which had only achieved intermittent load capacity factors in the range of 0.2 to 0.4 in the 2030 reference scenario, now have more opportunity to run in baseload, which increases their revenue. The few coal power plants, which have not achieved any significant market penetration in the reference scenario (capacity factor below 0.15), do not profit from increasing baseload efficiencies, as they are not cost effective enough to penetrate the market at all, independent of any efficiency increase. Figure 6 shows that there is consistently little impact of increased partload efficiency on coal power plant revenue. This is because the partload efficiency increase slightly increases the profitability during partload operation, yet does not enable the plants that run in intermittent operation to move towards more baseload operation.
Figure 7 and Figure 7 show an opposite effect for NGCC plants compared to coal plants (Figure 6). There is only a moderate increase of revenues for NGCC plants with increasing baseload efficiencies (Figure 7); the main increase is seen for NGCC plants that ran in a capacity factor range of 0.2 to 0.4 in the reference scenario. However with increasing partload efficiency (Figure 7), it can be seen that there is a significant increase in revenue for several NGCC plants, while many other plants are not affected at all. Since this discrepancy cannot be explained only in terms of the operating regime of the NGCC plants, it is interesting to assess the role of the power plants’ geographic location in this trend.
Impact of instalment location of NGCC power plants on revenue increase
The results of Figure 7 are disaggregated to the country level in Table 6. It can be seen that NGCC power plants in Germany benefit most from increasing baseload efficiency (+29% revenue increase), while the highest increase in revenue from a partload efficiency increase is seen for NGCC power plants in Italy (+37%). This effect is explained in more detail in Figure 8 and Figure 9. Figure 8 shows the average weekly fluctuation of power production for the upgraded NGCC power plants in Germany and Italy in the reference scenario for 2030. Figure 9 shows the relative fluctuation of combined wind and solar power production for an average week in Germany and Italy. It is evident that the NGCC power plants in Italy have to adjust to market fluctuations more frequently and more heavily than the NGCC power plants in Germany (Figure 8). This is because there is a higher relative fluctuation of renewable power production in Italy compared to Germany (Figure 9). The direct influence of renewables on the operation of NGCC can be seen most clearly during noon hours, where NGCC in Italy have to reduce their power production to accommodate the peaks in solar power production. The relative fluctuation of renewables is lower in Germany than in Italy because in Germany, the share of renewables is split evenly between wind and solar (see Table 2) whereas in Italy, there is three times more solar power than wind power. Since the power production of wind power plants varies less than for solar power plants, the overall renewable power production is less variable in Germany than in Italy, as Figure 9 shows. The standard deviations of relative power production are 0.42 for Germany and 0.82 for Italy. Consequently, the standard deviation of relative weekly power production by NGCC power plants is 0.14 in Germany, and 0.19 in Italy. Therefore, the increased variability of renewable power production requires NGCC in Italy to cycle more, which leads to a higher benefit of increased partload efficiencies compared to NGCC in Germany, as seen in Table 6.
Figure 9.
Relative weekly power production of renewable capacities in Germany and Italy, for 2030 reference scenario.
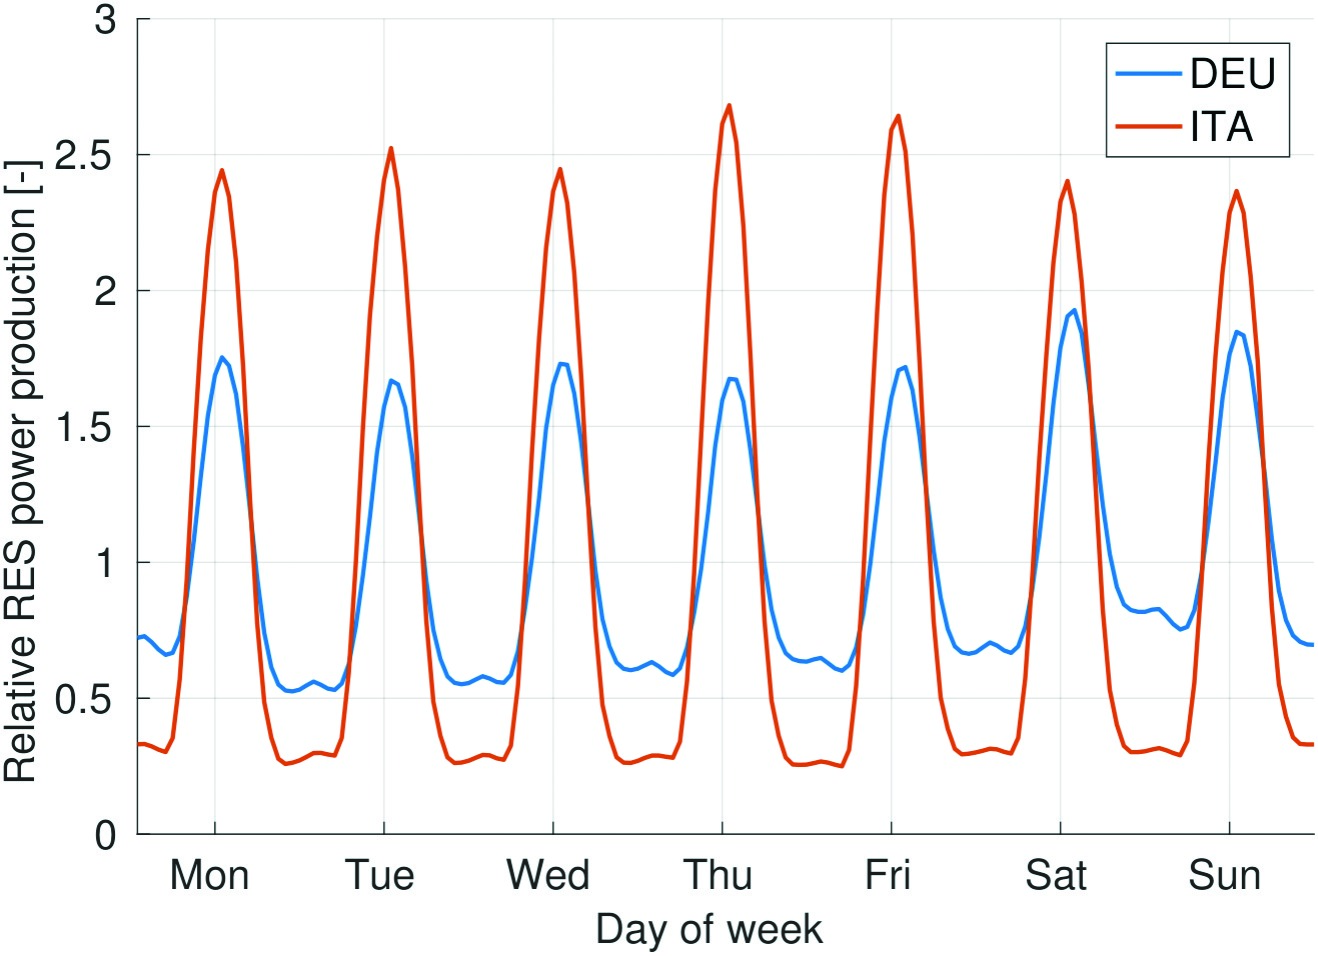
Figure 8.
Relative weekly power production of NGCC power plants in Germany and Italy, for 2030 reference scenario.
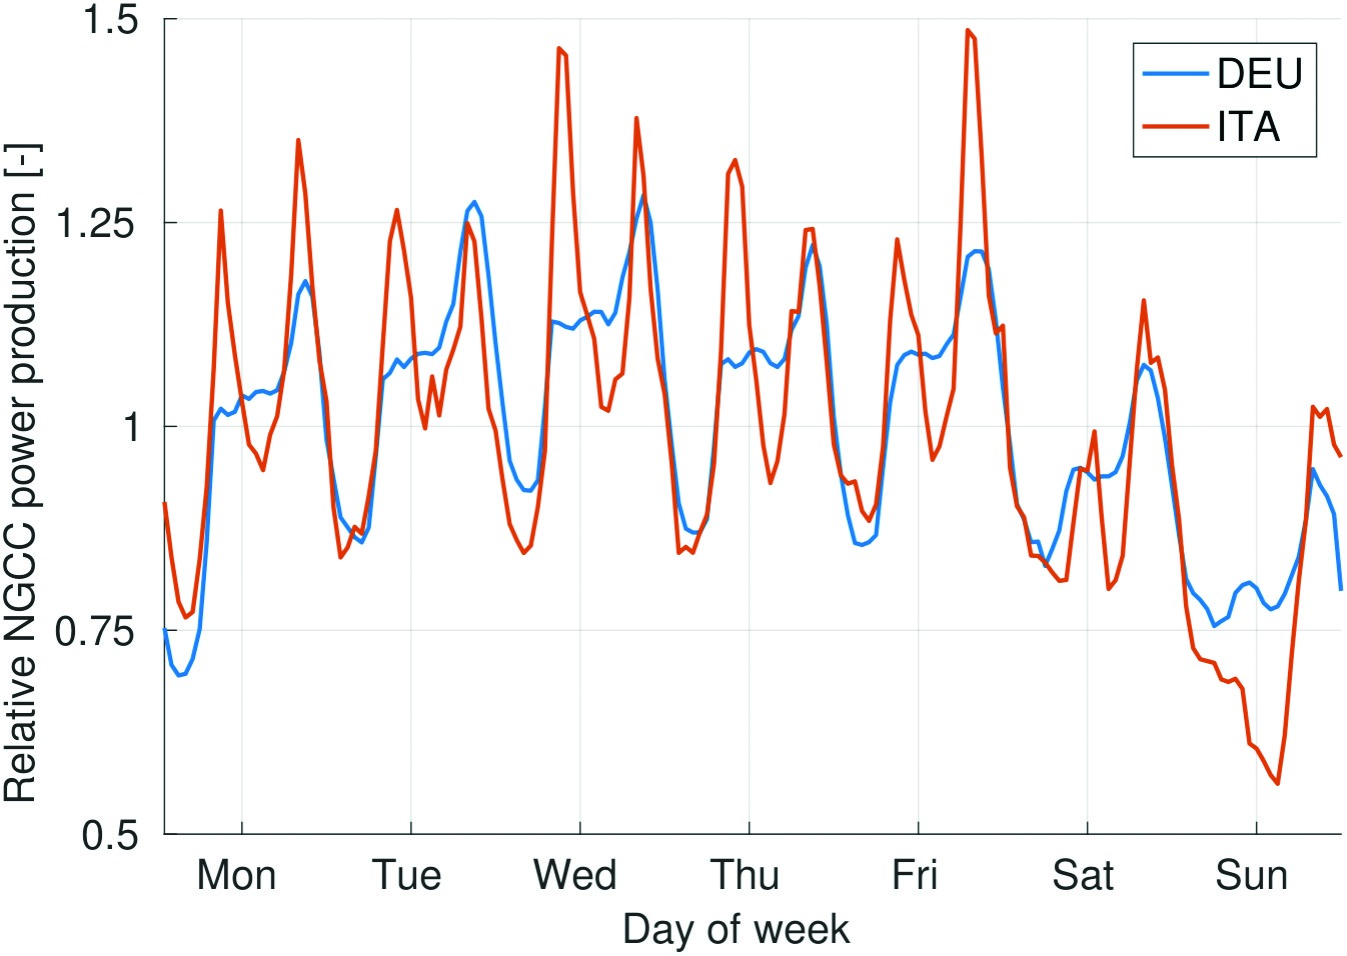
Table 6.
Impact of efficiency increases on relative increase in capacity-specific revenue compared to 2030 reference scenario for NGCC power plants in France, Italy and Germany.
| Baseload efficiency increase | 1% | 2% | 3% |
|---|---|---|---|
| France | +4% | +6% | +9% |
| Italy | 0% | +2% | +10% |
| Germany | +3% | +13% | +29% |
| Partload efficiency increase | 1% | 2% | 3% |
| France | +2% | +4% | +5% |
| Italy | +11% | +25% | +37% |
| Germany | +4% | +10% | +16% |
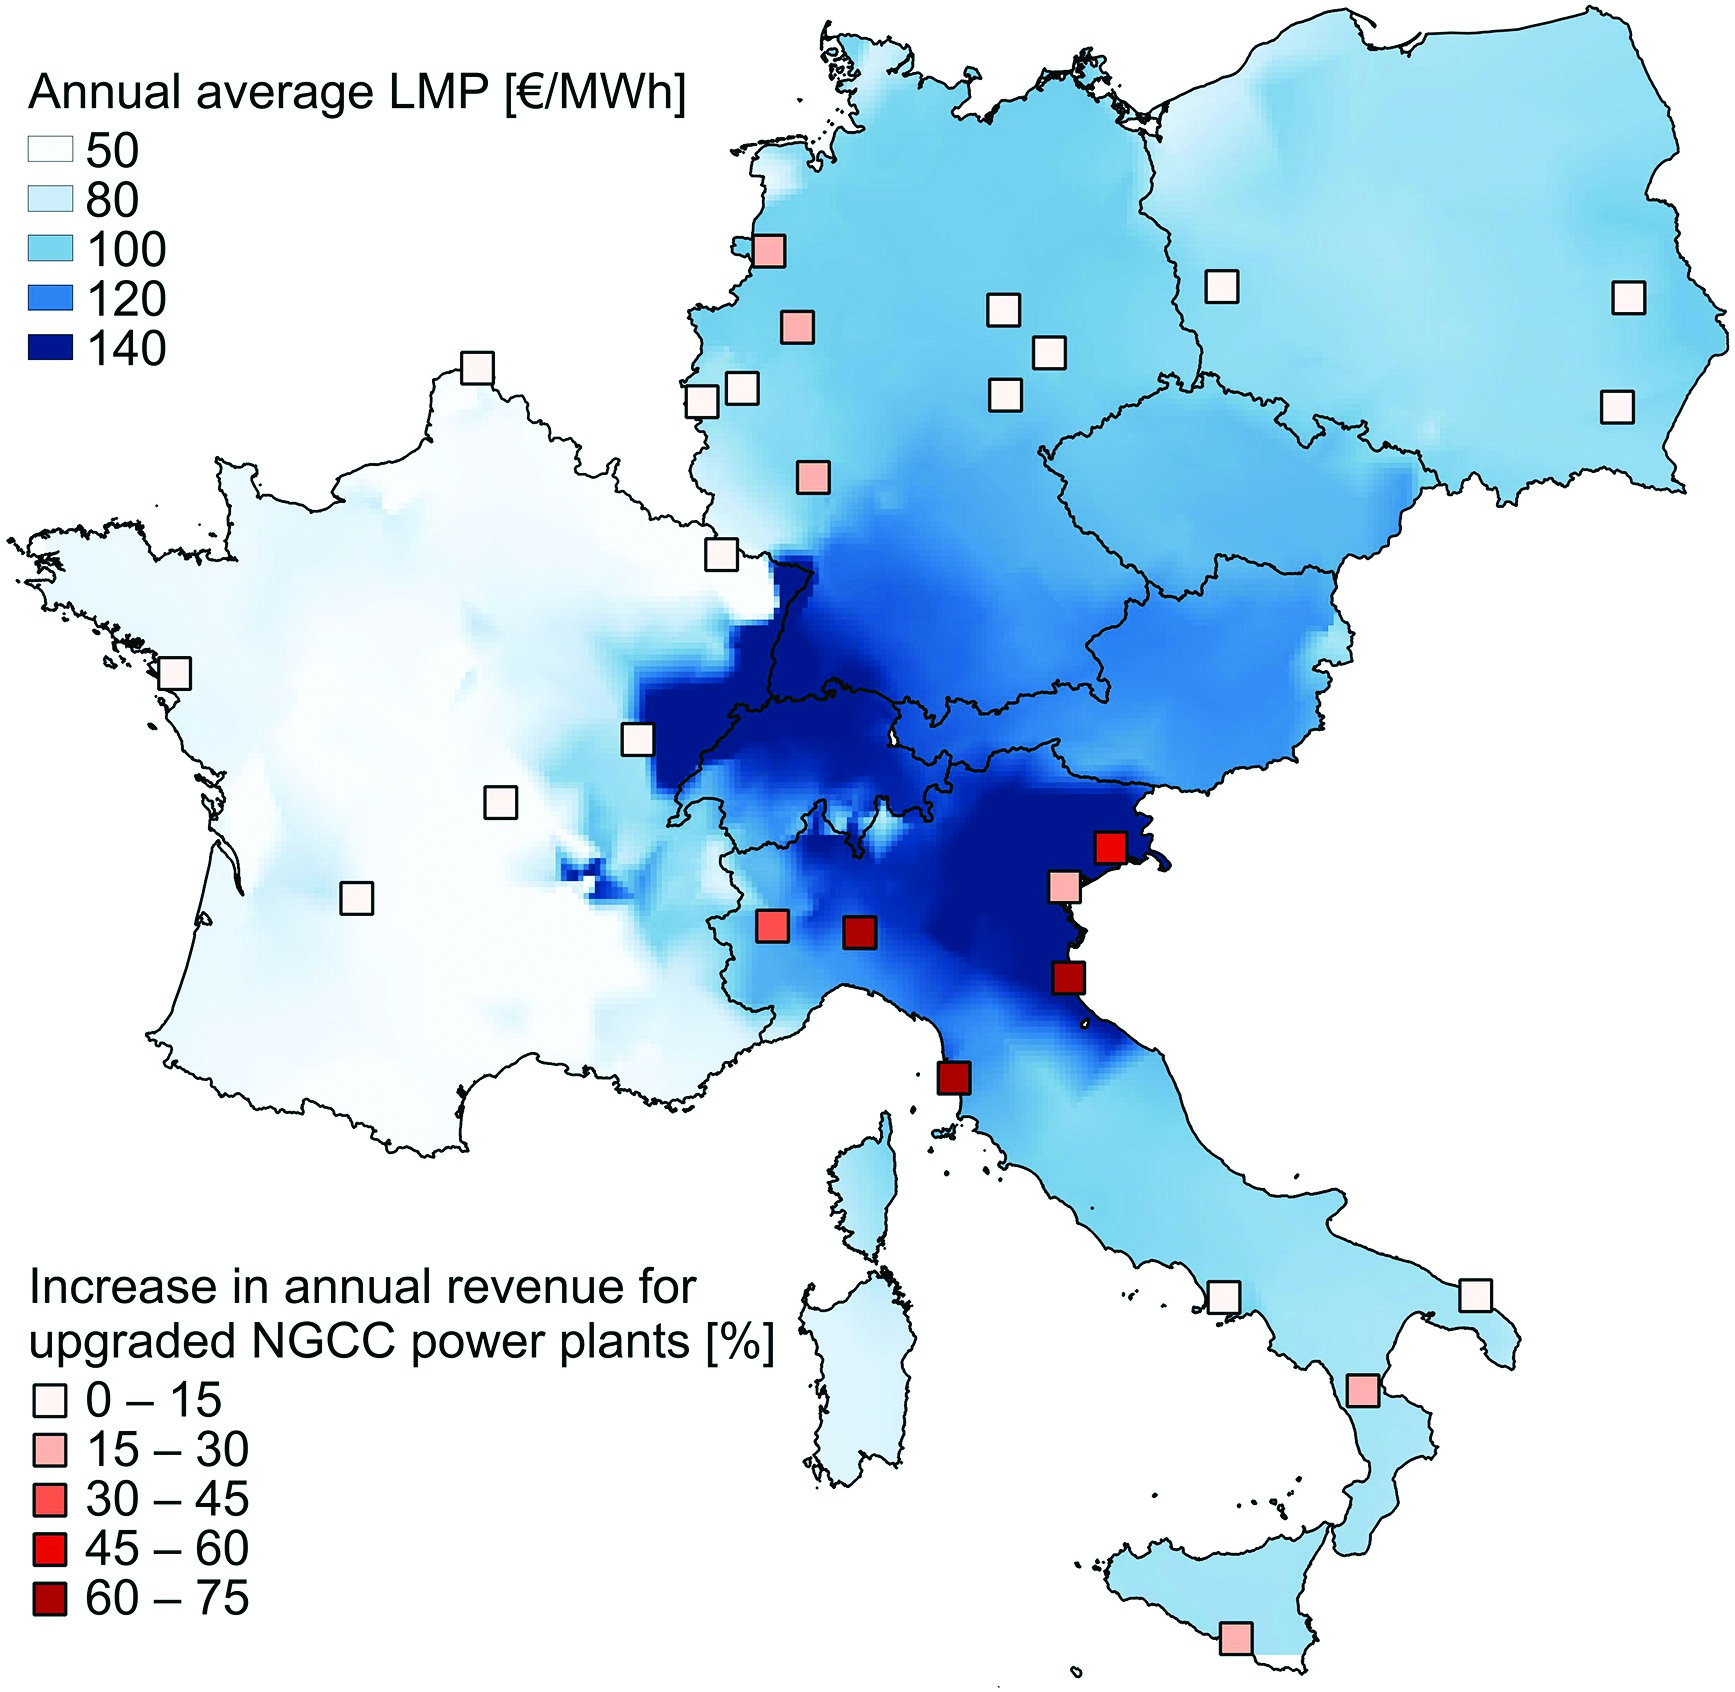
In Figure 10, the annual average locational marginal electricity prices (LMPs), in blue coloured contours, and the relative increase in revenue for the 3% partload efficiency increase case of all upgraded NGCC power plants, red coloured symbols, are shown. The plotted average LMP values are calculated as averages of the hourly LMPs at each substation throughout the year; values for locations between two substations are interpolated accordingly. It is clear that the NGCC power plants most positively affected by the partload efficiency increase are located in northern Italy, which coincides with the locations with the highest electricity prices. This is because in the high-price region of northern Italy, NGCC power plants have to cover most of the load, which includes frequent ramps to adjust to the fluctuations in demand and solar power production. Since the NGCC power plants in northern Italy encounter more ramps and more partload operation than NGCC power plants in other regions of Europe, NGCC power plants in Italy benefit most from a partload efficiency increase.
Financial comparison of revenue effects and cycling effects
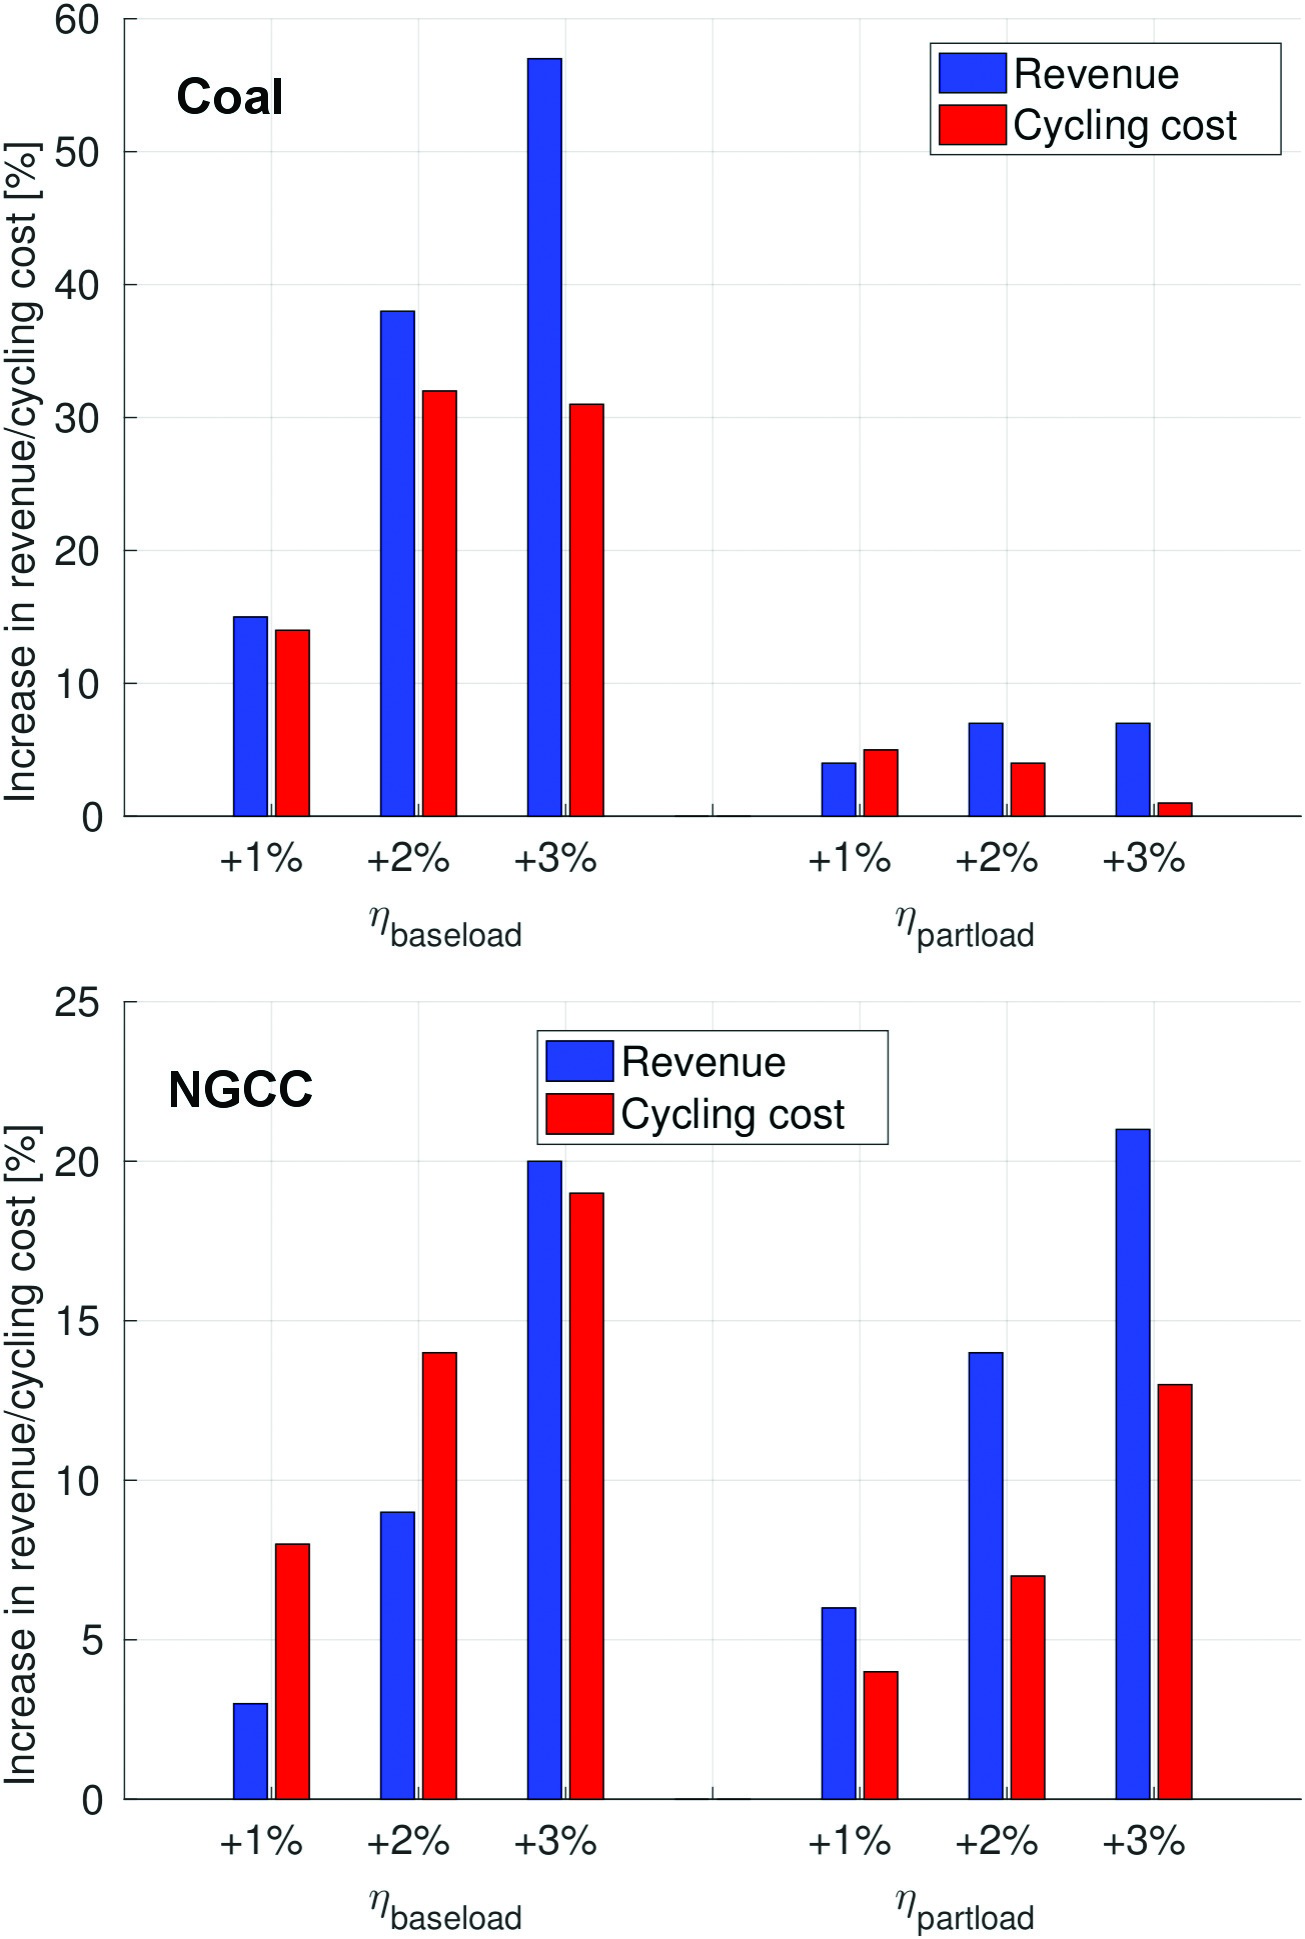
As seen in Table 4, the conventional power plants will not only encounter new revenue opportunities in 2030, but also significantly increased numbers of starts and ramps to accommodate the increased penetration of non-dispatchable renewables in the central European power system. The relative change in annual cycling cost compared to the 2030 reference scenario is shown in Figure 11 together with the relative change in revenue for each efficiency increase scenario. It is evident that for the most beneficial efficiency improvements (baseload for coal power plants and partload for NGCC power plants), the revenue increase outweighs the increase in cycling cost, yielding an overall positive balance. Only for the case of an increase in baseload efficiency of NGCC power plants is the increase in cycling cost higher than the increase in revenue; this is due to a significant increase in load-following ramps of the corresponding NGCC plants. This underlines again, that for NGCC power plants an increase in partload efficiencies is more beneficial than an increase in baseload efficiency.
Conclusions
Our in-house bottom up power systems simulation framework EnerPol is applied in this work to assess the impact of increased baseload and partload efficiencies on operational and financial performances of coal and NGCC power plants in the central European power system of 2030. Within this simulation framework, all conventional power plants are being simulated individually, which enables unique insights into the effects of improved efficiencies on power plant operation.
The simulations show that compared to 2013, cycling operation is significantly increased for both coal and NGCC power plants in 2030. This is due to the significant increase in penetration of fluctuating renewables such as wind and solar. Additionally, the investigated coal power plants are found to lose 50% capacity factor because of assumed increases in coal prices and CO2 emissions costs, which indicates a financially critical situation for coal power plants in central Europe by 2030. The increase of baseload and partload efficiencies is shown to have varying effects for coal and NGCC power plants. While the investigated coal power plants benefit heavily from increased baseload efficiency (+57% revenue for 3% baseload efficiency increase scenario), the NGCC power plants are found to benefit more from increased partload efficiencies (+21% revenue for 3% partload efficiency increase). This is due to the different roles of coal and NGCC power plants in the high-renewable European power system of 2030: While both coal and NGCC power plants face more cycling operation to adjust to the fluctuating renewables, coal power plants are operated more in baseload operation whenever profitable. NGCC power plants however, especially those in northern Italy, face more partload operation, since being the major source of operational flexibility to balance the increasing penetration of solar power in Italy. The relative increase in cycling cost is found to be below the relative increase in revenue for all cases except small baseload efficiency increases of NGCC power plants, which underlines the financial viability of the investigated efficiency increases.
The results in this work show that conventional power plants still have a market in 2030, despite significantly increased penetration of renewables and increased prices of fuel and CO2 certificates. In general, the market is found to favour investments in new NGCC capacities over new coal capacities, due to the NGCC’s improved operational flexibility and reduced CO2 intensity. But this work also highlights the necessity for OEMs and utilities to prepare for new challenges in high-renewable energy systems. Compared to today, both coal and NGCC power plants will face significantly increased cycling operation, which causes the need for more resilient power plant components and adjusted maintenance intervals. With increasing renewable penetration, the volume of the ancillary services market will increase, which will favour technical solutions that reduce the incurred costs and damages of frequent load cycles. This will require improved control and reduction of thermal gradients in the engine. Component designs like stack dampers reduce heat losses in CCGT HRSGs after shut-down and therefore shift the starting regime from cold to less damaging warm and hot starts. Improved thermal stress controllers enable more aggressive ramping of gas and steam turbines while maintaining all damage-relevant stress levels.
Utilities will seek to maintain or increase their market shares in the increasingly competitive electricity market. Baseload and partload efficiency increases are shown to be very effective measures to improve existing and future coal and NGCC power plants’ financial performance. For coal power plants, retrofit upgrades increasing the baseload efficiency, such as flue gas heat recovery systems or coal drying systems, yield the most beneficial financial performances. For NGCC power plants, partload efficiency increasing technologies, such as variable-pitch inlet guide vanes and inlet air preheating systems, deliver the best financial results. Notwithstanding this general trend, this work also shows that utility preferences can differ widely depending on the market the power plant is intended for — while NGCC power plants in Italy profit heavily from partload efficiency increases, gas power plants in Germany profit most from improvements in baseload efficiencies. This discrepancy is driven by the variability in power production of each country’s renewable energy portfolio. Since all central European countries have different renewable action plans based on domestic policies and abundance of renewable resources, OEMs will need to offer a wider and more modular range of technical solutions to meet the needs of all customers across central Europe. This diversification of customer needs implies increased investment risk for the OEMs, as more technical solutions will be developed for a smaller group of target customers for each individual solution. In consequence, OEMs will have to increase the capital requirements presented to customers in order to compensate for the additional risks.