Introduction
The integration of a SOFC in a gas turbine cycle brings the advantage of an extremely high electrical efficiency that cannot be achieved by a gas turbine alone. In particular, efficiency on coal syngas could be competitive with combined cycles, and, especially for small size plants, this type of system promises the highest conversion efficiencies 06, 12, 10, which translates to reduced emissions and noteworthy economic benefits.
Compared to a standalone fuel cell, hybridization with a gas turbine introduces additional opportunities. Gas turbine capability for quick load following can improve system flexibility 07, 02; furthermore, degradation phenomena in the fuel cell can be mitigated by shifting the power production from the fuel cell to the turbine 13.
Useful lifetime in SOFCs is currently limited by several mechanisms that degrade fuel cell performance over time and bring the cell to failure 15. Those phenomena are related to presence of impurities in the fuel, temperature fluctuations, high operating current density or high fuel utilization (FU) 04, 09, 08. The necessity of replacing the fuel cell stack every few years in a power plant is a major limitation for such a technology, since the cost of the stack is currently in the order of 2–3 k$/kW 03. More sophisticated materials that could reduce degradation would also increase the cost even further.
In a hybrid system, operating strategies exist to extend fuel cell useful lifetime 13, 18, which would have a great impact on system economic feasibility. The flexibility and reliability introduced by the gas turbine could potentially accelerate SOFCs market penetration. The purpose of this work is to assess the economic benefits of fuel cell gas turbine hybridization, including the impact on fuel cell life time.
This study was conducted to compare a standalone SOFC stack and a hybrid system over a period of 20 years, assuming a constant power production. The same assumptions were used for both systems, to evaluate the relative difference in terms of economic parameters such as Payback Period (PBP) and Net Present Value (NPV). This analysis showed how the PBP can be halved and NPV can be doubled in a hybrid system thanks to the synergistic integration of SOFC and gas turbine.
Hybrid system description
The configuration of a generic gas turbine fuel cell hybrid system is illustrated in Figure 1: for sake of simplicity, such layout omits many details necessary for plant control and/or fuel pre-processing. The air is compressed and pre-heated in the exhaust gas recuperator, then flows into the cathode side of a high temperature fuel cell, in this case a SOFC. Here the air reacts with the fuel on the anode side to generate electrical power via electrochemical reactions. The main reactions that take place in a natural gas fueled system are presented in Equations 1–4. For this work, a coal-derived syngas was used which did not contain methane. However, Equations 2–4 are still valid.
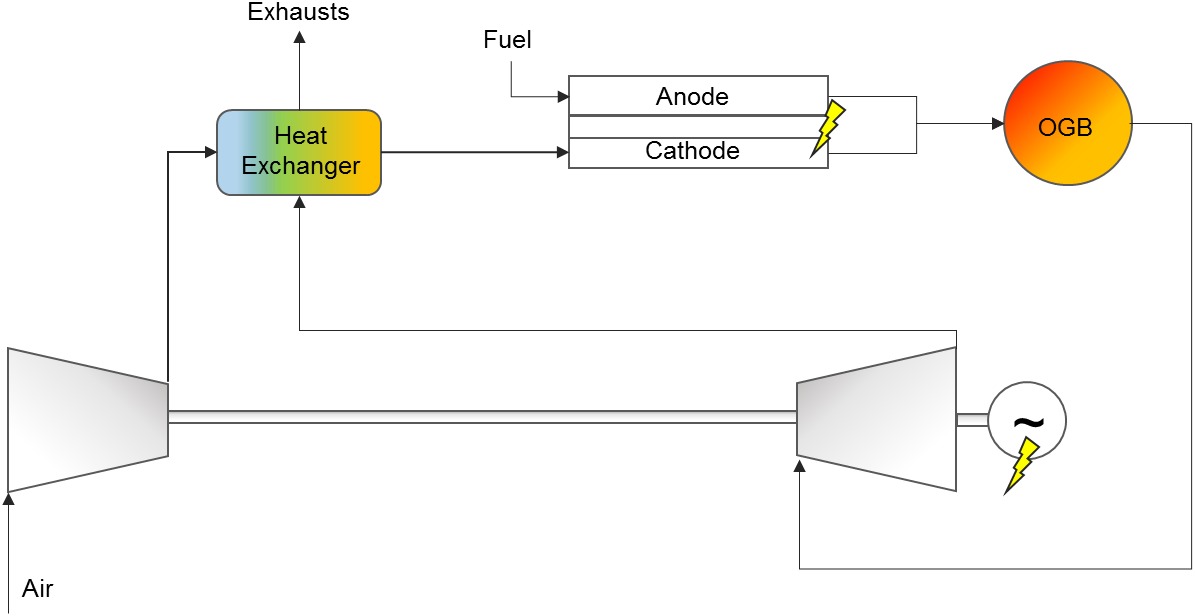
If natural gas is fed to the SOFC, a pre-reformer is generally required, which employs the steam from anode off-gases for the steam reforming reaction (1): pre-reformer and anode off-gas recirculation are not illustrated in Figure 1.
Cathode and anode exhausts then mix in an off-gas burner (OGB) where the unutilized fuel is completely oxidized. The high-temperature and high-pressure gas expands in the gas turbine, which produce additional power and drives the compressor. Finally, turbine exhaust gas feeds the heat exchanger where the heat is recovered to pre-heat SOFC inlet airflow.
Model description
The fuel cell real-time model represented a planar, anode-supported SOFC, described in 05. Cell voltage was calculated according to Equation 5 from the ideal Nernst potential (Equation 6) and subtracting all the lost terms: activation polarization (Equation 7), ohmic polarization (Equation 8), and diffusion polarization (Equation 9).
The thermal output from the fuel cell system included the heat transferred from the stack to the airflow and the heat generated in the OGB from combustion of the unutilized fuel. Thermal output was expressed as shown in Equation 10. In particular, enthalpy increment in the OGB was calculated according to Equation 11.
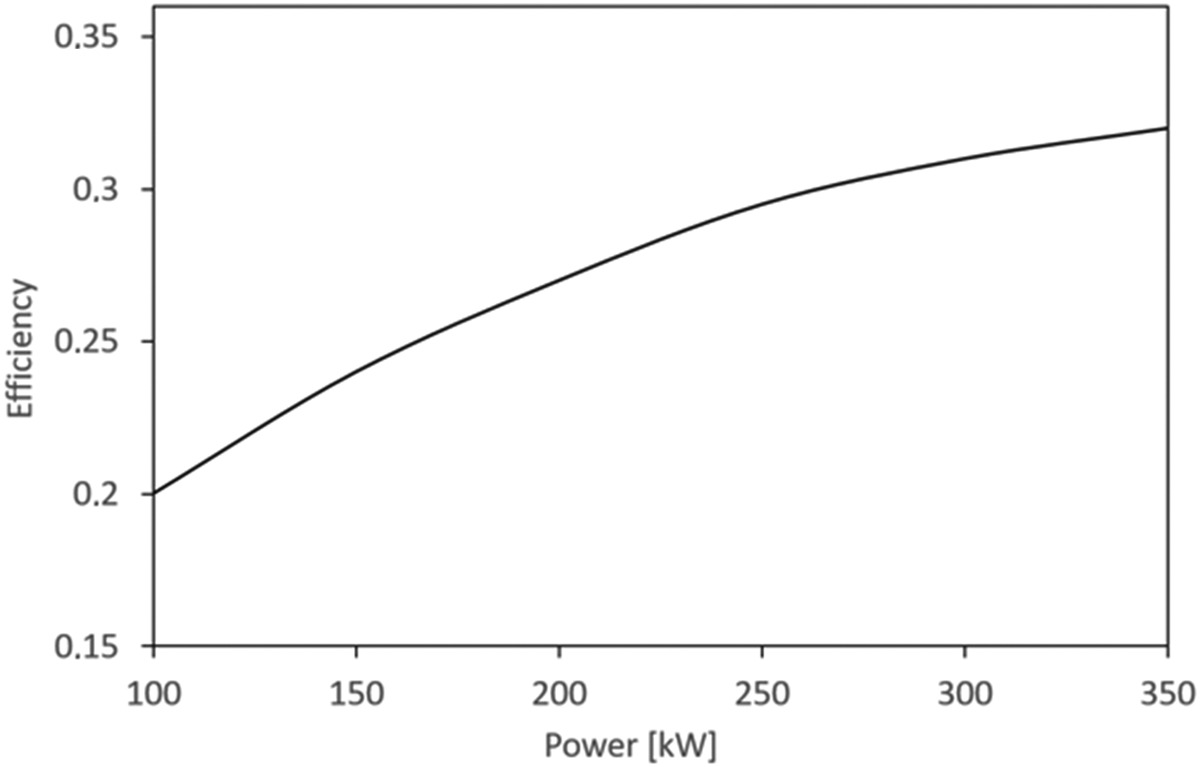
In the hybrid system model, SOFC thermal output was recovered by the gas turbine and converted into electrical power, as shown in Equation 12. Gas turbine cycle efficiency was mapped as a function of the gas turbine power (PGT) as depicted in Figure 2. For this work, only an empirical black-box model of the recuperated gas turbine cycle was employed, because the focus was on the evaluation of system power and efficiency for the economic analysis.
Fuel cell performance degradation was taken into account with an empirical degradation factor, which related voltage decrement to operating temperature, current density, and FU as illustrated in Equation 13 16. The empirical degradation model was discussed in details in 16.
Degradation factor (or degradation rate) was incorporated into the total ohmic losses according to Equation 14 to simulate a reduction in operating voltage over time.
Constant speed operation was considered for the turbine, hence pressure variations were neglected. Since for this preliminary work, the gas turbine was a map-driven model, detailed thermo-and fluid-dynamics information were not considered, which could impact on turbomachinery or heat exchanger lifetime. This level of details could be included in a future work for more accurate analysis.
Methodology
Operating strategy
For this study, the system was assumed to produce a constant base load for 8,760 h per year, without considering startup and shut down that would accelerate fuel cell degradation. Part-load operations were not considered here for simplicity. A control strategy was implemented for the standalone SOFC stack and the hybrid system to maintain constant power production over time while the fuel cell was degrading 18. In the standalone SOFC, the current was increased over time to compensate for voltage decay and the FU was kept constant by increasing the fuel flow accordingly. As the current increased, cathode airflow was incremented to control the temperature difference between cathode inlet and outlet and reduce thermal stresses in the electrolyte. This was assumed to be carried out by a blower consuming 10% of nominal SOFC power. Plant end of life was defined as the voltage dropped to zero.
The gas turbine of the hybrid system introduced one more degree of freedom, because total system power could be maintained by modulating turbine load. The size of the stack and the turbine was assumed the same, and the stack started with producing 100% of its nominal power while the turbine worked at around 40% of design power. No action was performed to keep constant SOFC power, in contrast, the load on the turbine was incremented over time to meet the power demand of 480 kW from the system. This could have been done either by injecting auxiliary fuel into the OGB downstream the stack or by increasing the fuel flow on the anode side of the fuel cell: the latter option was chosen, as efficiency is positively impacted. Moreover, such operation had the benefit of lowering the FU, improving Nernst potential, and reducing some of the degradation mechanisms in the cell. The cell current was decreased to keep constant voltage and let power degrade. This strategy was proved to potentially extend fuel cell lifetime 08, 16. Plant end of life was defined as fuel cell power decreased to 30% of nominal power.
For thermal management of the SOFC, cathode airflow had to be reduced in this case. A bypass valve (not reported in Figure 1 was modeled using an empirical transfer function found in a previous work 17. Since the turbine speed was considered constant in this work, the bypass valve was used to regulate cathode airflow. The bypass diverted airflow from compressor discharge to turbine inlet, reducing cathode airflow, turbine inlet temperature, exhaust gas temperature, and cathode inlet temperature (Zaccaria et al., 2016). The effect on pressure drop change was not analyzed in this work.
Summarizing, in the hybrid system more flexible operations were possible providing the following advantages compared to the standalone SOFC:
Cell current could be reduced, decreasing degradation and keeping constant voltage;
SOFC power was not required to be constant because extra power could be generated by the gas turbine;
Fuel cell thermal management did not require additional energy consumption because cathode airflow was provided by the compressor and not by a separate blower; in addition, regulating airflow with the bypass valve was beneficial to decrease exhaust gas temperature, which tended to increase as the load on the turbine increased;
System efficiency was higher, which was expected to have a positive effect on economic results.
Test conditions
The initial conditions for the simulations are presented in Table 1. The size of the systems was chosen based on SOFC state of the art, considering distributed generation applications. For a consistent comparison, a case was considered where initial current density and FU were the same in the standalone stack and in the hybrid system. However, for completeness, other four cases were investigated for the standalone fuel cell at lower current densities. The purpose was to find an economic optimum for the standalone system and compare hybrid system performance with both cases: same initial conditions scenario and best case scenario for the standalone configuration. Initial cathode airflow value was changed in these five cases to keep the same initial temperature increase of 100°C across the cell.
Table 1.
Initial conditions.
A summary of the control strategies for the two systems is shown in Table 2. Proportional-integral controllers were employed, and tuned with a simple trial and error procedure. As stated before, fuel cell current was manipulated so to keep either the stack power (standalone cases) or the cell voltage (hybrid system case) constant.
Assumption for the economic analysis
A preliminary economic analysis was performed to estimate the economic performance of the fuel cell in a standalone and in a hybrid system configuration, including the different stack life times due to the different plant features. Some basic assumptions were considered as reported in Table 3. A feed-in tariff (0.14 $/kWh) was considered for the electricity assuming subsidies to favor an early market penetration of SOFC systems. For the stack cost, an optimistic value was employed, which represented a DOE target 14. The effect of increasing the stack cost to more realistic current prices was also investigated.
Table 3.
Economic assumptions.
| Component | Cost |
|---|---|
| SOFC stack | 400 $/kW for a stack size of 330 kW 14 |
| Gas turbine | 700 $/kW (Rosa do Nascimento et al.) |
| Exhaust gas recuperator | 50% turbine cost (Rosa do Nascimento et al.) |
| SOFC blower | 10% stack cost 01 |
| SOFC inverter | 10% stack cost 01 |
| Annual maintenance | 3% capital investment |
| Electricity price (feed-in tariff) | 0.14 $/kWh |
| Fuel price | 0.1 $/kg |
| Discount rate (to actualize cash flows) | 0.01 |
In addition to these costs, a complete replacement of the stack was considered when necessary. In particular, for the standalone stack, the end of life meant the failure of the stack (when the voltage dropped zero). In the hybrid system, the stack was replaced when the turbine reached design power condition, because total system power could not be maintained constant after that point unless increasing SOFC power.
The economic benefit was evaluated in terms of PBP, NPV at 20 years, and Internal Rate of Return (IRR), calculated according to Equations 15–18. Hence, such parameters included as many fuel cell stack replacements as necessary.
Results and comparison
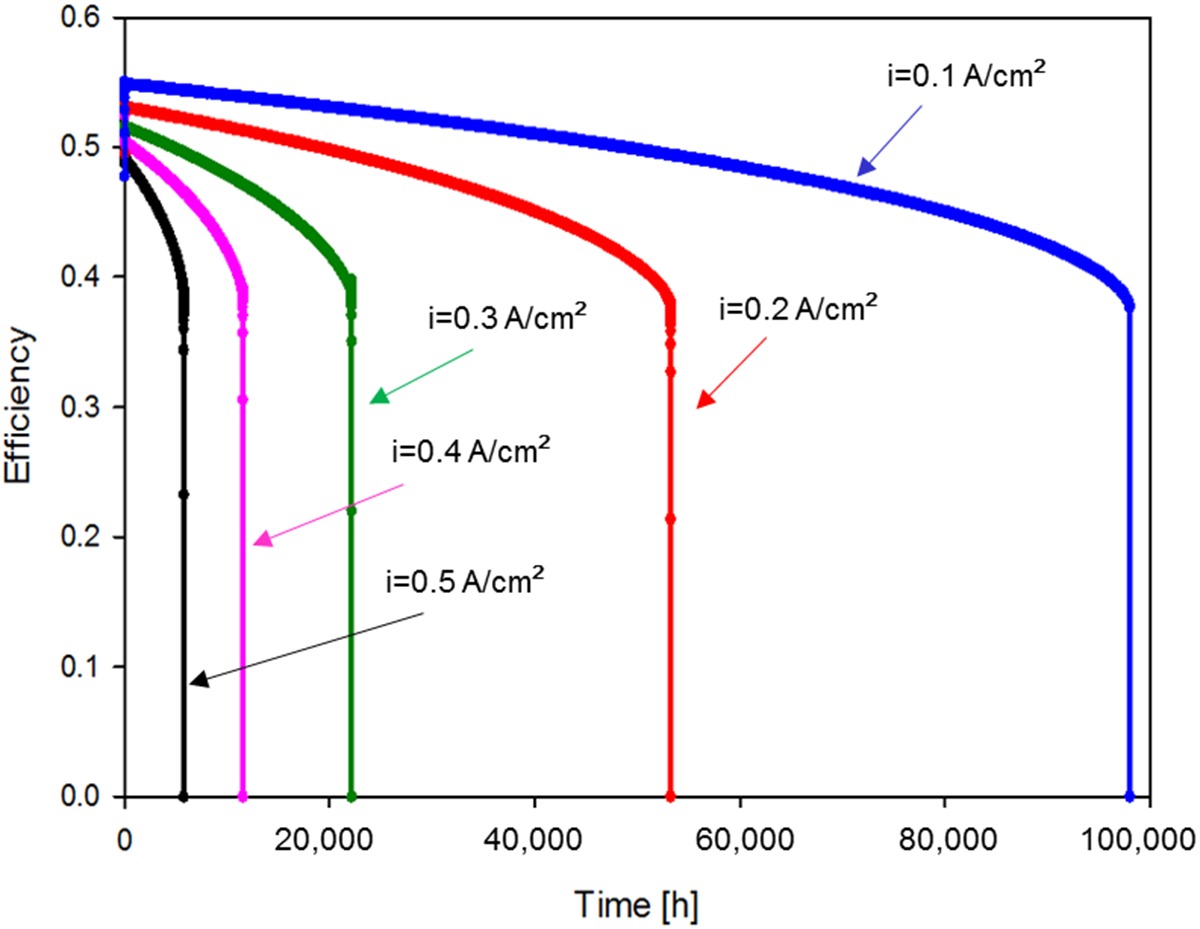
First of all, for the standalone SOFC stack with constant power output, five cases were analyzed and compared. The initial current density was varied from 0.5 to 0.1 A/cm2. Consequently, the nominal power was varied from 330 to 71 kW. The stack size was assumed the same, with a design capability of 330 kW, with the advantage of extending the life of the fuel cell and reducing the number of replacements when the power density is kept lower. Obviously, there was expected to be a trade-off between sold electricity and fuel cell lifetime. FU was kept 80% in all the case studies. Figure 3 presents stack power over time in the five cases.

As shown in Figure 3, the benefit of decreasing the power density in terms of fuel cell lifetime was substantial. Initial degradation rate was reduced from almost 1% per 1,000 h of the first case to 0.13%/1,000 h. Stack efficiency over time is presented in Figure 4.
Figure 4.
Efficiency trend over time for the standalone stack at different initial current densities.
In terms of PBP, reducing the power density had the negative effect of decrementing the annual cashflow (CFN) and the positive consequence of replacing the stack less times over the plant lifetime. For example, in the case with lowest current density, the stack should be replaced once every 11 years. Hence, the cost of the stack would have a great impact in determining the most beneficial strategy.
With a stack cost of 132,000 $, the case at highest current density was not economically feasible, since the cashflows were negative throughout the system lifetime. Table 4 shows PBP, NPV, and IRR, where the case at 0.2 A/cm2 appeared to be the most economically advantageous. Further reducing the power density, PBP started increasing again, indicating that there is an optimal value of current from an economic point of view.
Table 4.
PBP, NPV, and IRR for the standalone stack at constant power with different initial current densities.
| Initial current density [A/cm2] | Lifetime [yr] | PBP [yr] | NPV [% capital cost] | IRR |
|---|---|---|---|---|
| 0.5 | 0.7 | — | −538 | −0.075 |
| 0.4 | 1.3 | 26.5 | −1.5 | 0.165 |
| 0.3 | 2.5 | 7.3 | 114.2 | 0.188 |
| 0.2 | 6 | 6.3 | 181 | 0.214 |
| 0.1 | 11.2 | 11.2 | 63.8 | 0.106 |
If the stack cost increased to 1,000 $/kW at 0.5 A/cm2, for a total cost of 330,000 $, only the two cases at lowest current density gave a positive PBP, equal to 53 years for 0.2 A/cm2 and 91 years for 0.1 A/cm2. In that scenario, NPV at 20 years would be negative, respectively −74% and −78% of the initial capital cost (which is now approximately three times higher). A current stack price of 3,000 $/kW, which brought the total cost to 990,000 $, did not give positive PBP or NPV for any current density.
In the hybrid system, stack power was reduced due to the decrement in stack current to keep constant voltage. At the same time, turbine power increased, as shown in Figure 5 where hybrid system and two standalone cases are compared. Stack lifetime was longer in the hybrid system configuration compared to the optimum standalone configuration.
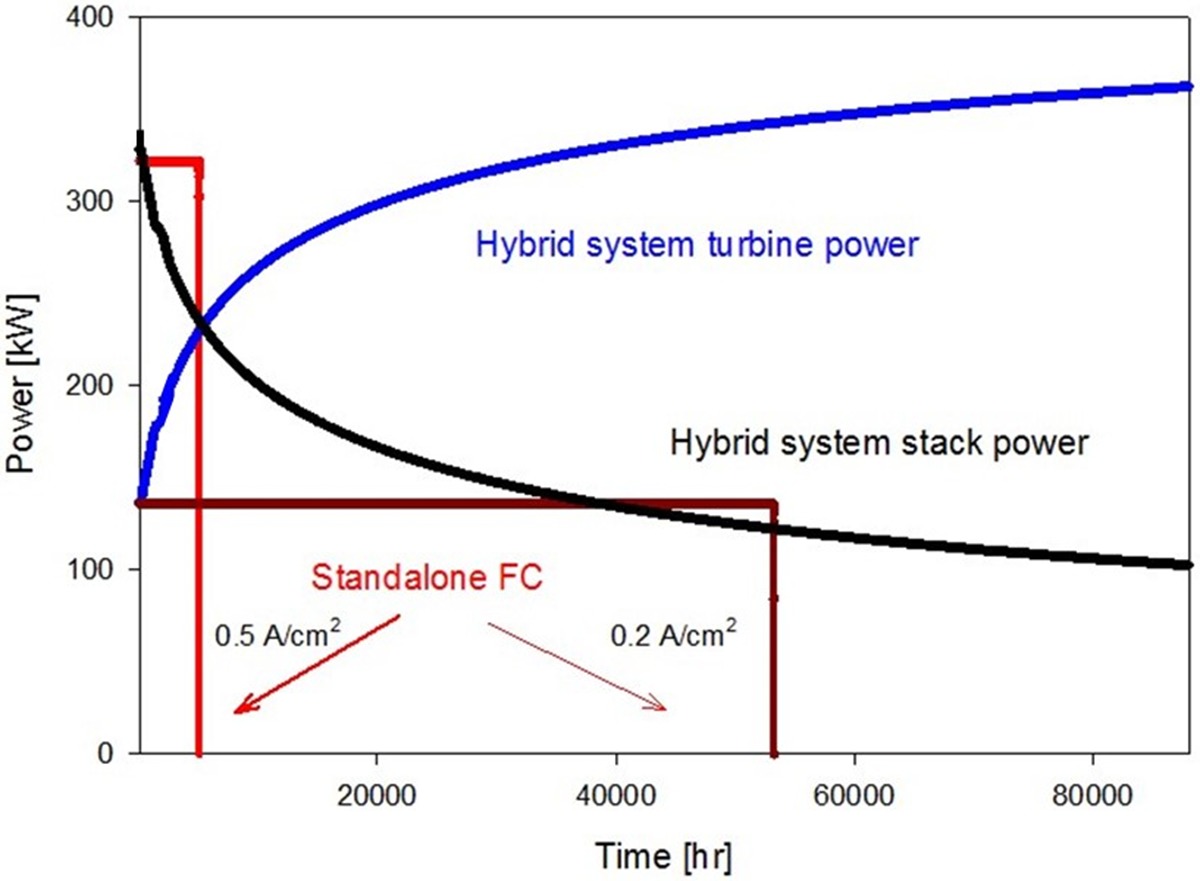
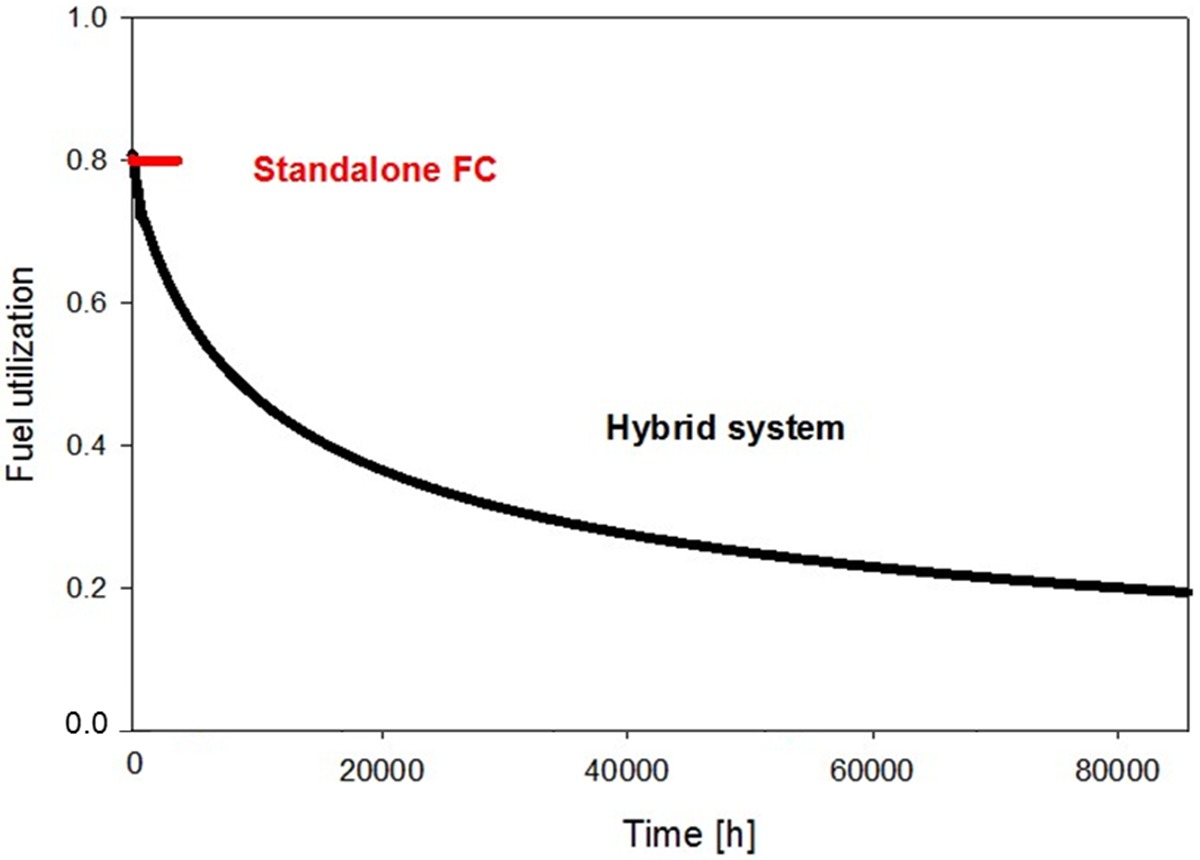
Figure 6 presents FU trend over time in the two systems. FU was calculated as the ratio between consumed fuel (in terms of H2 and CO molar rates) and inlet fuel molar rate. In the standalone stack, FU was kept constant in every case to avoid fuel starvation when the current increased. In the hybrid system, FU decreased as consequence of the decreasing current and increasing fuel flow. This operating strategy brought additional benefits to stack performance, as previously discussed.
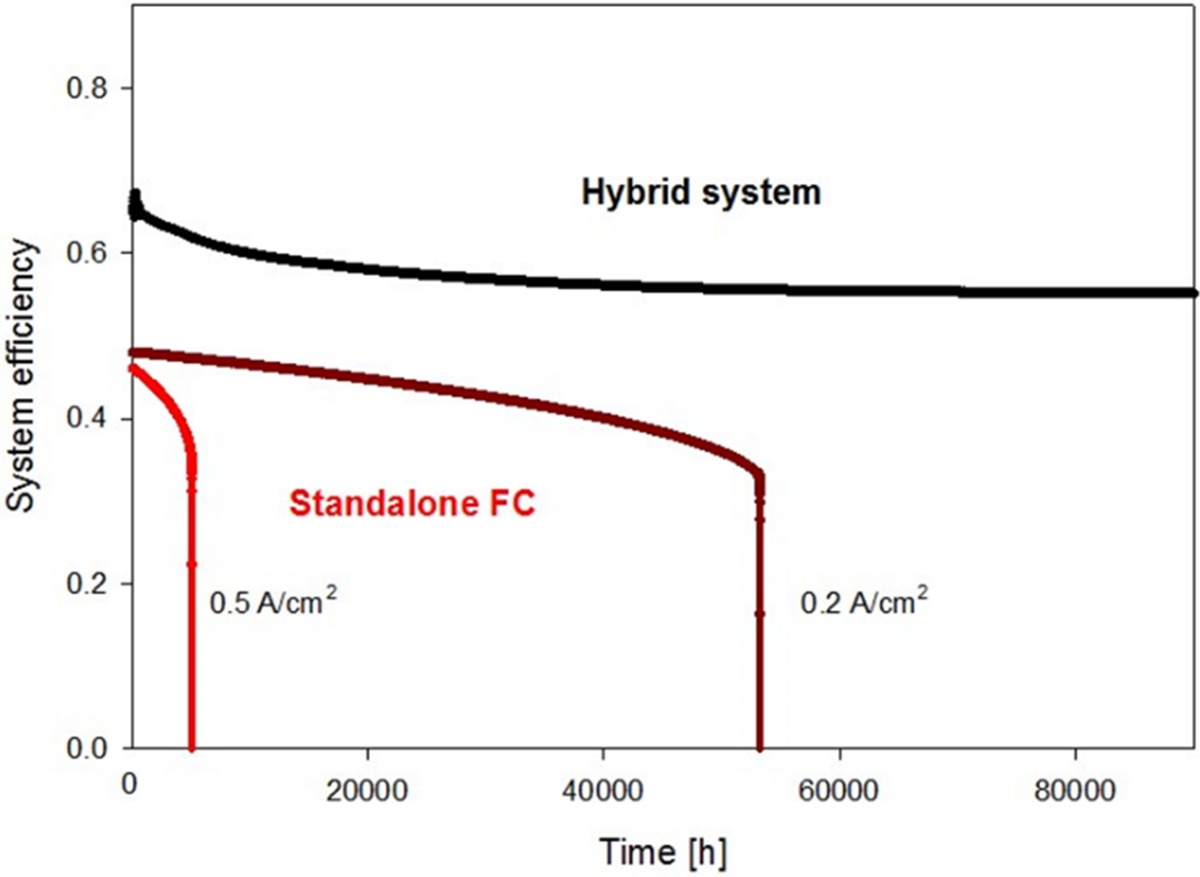
In Figure 7, system efficiency is compared for the two configurations. Hybrid system efficiency is the contribution of SOFC and gas turbine efficiencies. The latter was fairly low at the beginning of plant lifetime because the turbine worked in off-design conditions, and it gradually increased over time offsetting SOFC efficiency decay. For this reason, the global efficiency was maintained almost constant over the entire time. The great difference compared with the efficiency drop in the standalone stack resulted in better economic performance.
The results for the hybrid system are shown in Table 5. The economic benefit compared to the standalone stack was evident. In particular, in the hybrid system, the results were not significantly affected by the stack cost. This was because the stack was replaced only once every 11 years and because of the gas turbine contribution on total power production and total system efficiency.
Table 5.
PBP, NPV, and IRR for the hybrid system.
| Stack cost | Stack lifetime [yr] | PBP [yr] | NPV [% capital cost] | IRR |
|---|---|---|---|---|
| 400 $/kW | 2.9 | 416 | 0.33 | |
| 1,000 $/kW | 11.3 | 3.3 | 365 | 0.29 |
| 3,000 $/kW | 5.2 | 189 | 0.21 |
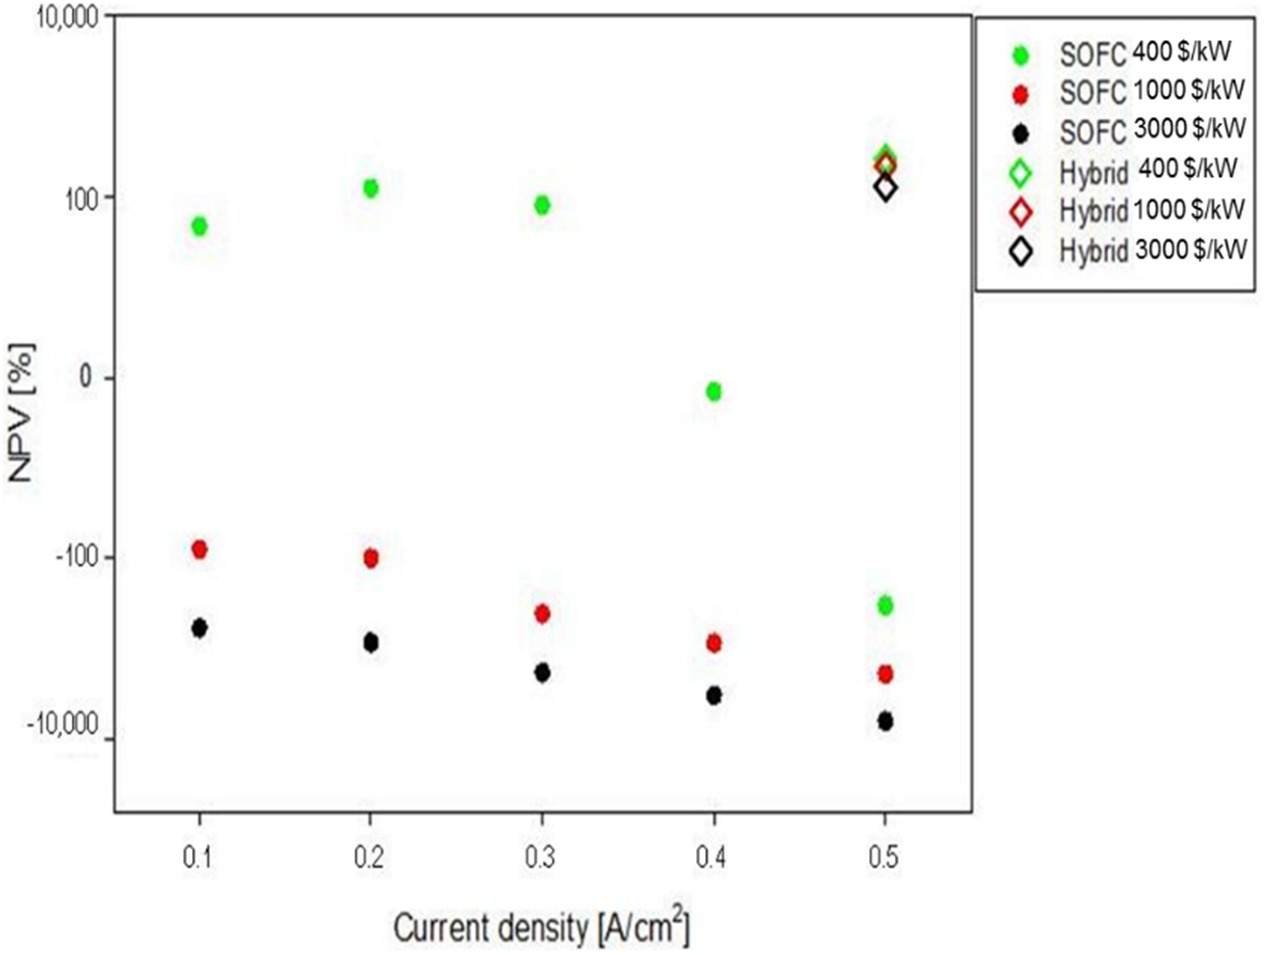
This simplified analysis showed how, with these assumptions, the PBP would be halved in a hybrid configuration with respect to the most advantageous standalone case. The very low dependence on stack cost indicates that an early adoption of SOFC technology would be possible at current cost and voltage degradation rate thanks to the hybridization with gas turbine systems. Figure 8 illustrates the dependence of NPV on current density and stack cost for the standalone SOFC and the hybrid system.
Conclusions
In this work, the impact of fuel cell degradation on the economics of the system was analyzed comparing a standalone SOFC and an advanced hybrid plant where SOFC was coupled with a gas turbine. The integration of these two different technologies favored a high system efficiency over time despite fuel cell performance degradation. The flexibility added by the gas turbine allowed an operating strategy that extended fuel cell lifetime and improved system performance. The economic results showed that the PBP for the hybrid system was half and NPV doubled compared to the SOFC best-case scenario, while the IRR increased by 54%.
In the standalone SOFC system, operating life could be extended oversizing the stack at constant power demand, which made economic results extremely dependent on stack cost. An optimal value for operating current density was found around 0.2 A/cm2. In contrast, in a hybrid system, part of the power could be produced by the most reliable component, varying the power share between fuel cell and turbine as the first one degraded. This fortunate integration doubled SOFC lifetime compared to the standalone best case and significantly improved economic results with no substantial dependence on the stack cost. Hence, hybridization with a gas turbine could facilitate early market penetration of SOFCs, at current costs and performance degradation rates. As such, the higher initial capital investment would be compensated by higher efficiency and less frequent replacements of the stack.
NOMENCLATURE
CFN
Annual cash flow [$]
FU
Fuel utilization factor
NPV
Net present value [$]
OGB
Off-gas burner
PBP
Pay-back period [yr]
SOFC
Solid oxide fuel cell
TCI
Total capital investment [$]
TPB
Triple phase boundary
Cf
Fuel consumption [kg]
Cmain
Maintenance cost [$]
cp
specific heat [J/kg K]
Eel
Electricity production [kWh]
F
Faraday’s constant [C/mol]
G
Gibbs free energy [kJ]
H
specific enthalpy variation from 298 K [kJ/kg]
i
current density [A/cm2]
i0
exchange current density [A/cm2]
IRR
Internal Rate of Return
Mass flow rate [kg/s]
n
number of transferred electrons
molar rate [mol/s]
Pel
Electricity price [$/kWh]
Pf
Fuel price [$/kg]
PGT
Gas turbine power [kW]
p
pressure [bar]
Fuel cell thermal output [kW]
R
Area specific resistance [Ω m2]
Rg
Ideal gas constant [J/mol K]
rd
Degradation rate [%/kh]
T
Temperature [K]
t
time [h]
V
Voltage, overpotential [V]
x
mole fraction
α
charge transfer coefficient
η
efficiency
ν
stoichiometric coefficient