
Introduction
In general, the developmental process for a commercial aircraft, from the initial design concept to its certification and entry into service takes several years. The same is true for its accompanying propulsion system. Furthermore, they tend to remain in service for a few decades after coming onto the market. Consequently, an aircraft type certified in 2021 might still be operational in 2050. In order to achieve the ambitious environmental goals of the Flightpath 2050 vision (Advisory Council for Aeronautics Research in Europe, 2011), radical new solutions for aircraft propulsion systems are needed in less than an aircraft's life cycle. For this reason, the development of these new aircraft and propulsion systems have to begin immediately.
Many propulsion systems which differ from conventional combustion-based engines—including internal combustion engines and gas turbines—have been already investigated. The first small all-electric short-range aircraft, with restricted mission capabilities, received its type certificate from the European Union Aviation Safety Agency in 2020 (Pipistrel Group, 2020). Despite some new commuter aircraft concepts (Eviation, 2020; Zunum Aero, 2020) no aircraft in this segment with a turbo-, all-electric or hybrid propulsion system has entered the market yet. In this respect, it will be a long time before electrified single-aisle aircraft could enter into service.
When considering different propulsion systems, aircraft designers have to conduct a number of studies in order to identify the optimum solution for the given mission. For commercial aircraft, only gas turbine engines have been relevant over the last decades. In this domain, besides GasTurb (GasTurb GmbH, 2020), other preliminary design tools like GSP (NLR - Royal Netherlands Aerospace Centre, 2020), NPSS (Southwest Research Institute, 2020), and PROOSIS (EA Internacional, 2020) are also being offered commercially. Several modules for the modeling of electric components were developed in NPSS (Perullo et al., 2014) and PROOSIS (Athanasakos et al., 2020). The same applies to a number of multi domain simulation programs (Sielemann et al., 2020; Kang et al., 2021). Commonly, it is up to the user to integrate different modules into the propulsion system in a sensible way. Based on GasTurb, the authors of this publication have developed modules for the simulation of electric components with the same fidelity as the conventional engine components. These modules can be used for modeling all relevant types of turboelectric and hybrid aircraft propulsion systems. The GasTurb software is unique in that it comes with preconfigured propulsion architectures, to support performance and pre-design studies. Complete electric powertrains are provided to the user, which are readily usable and can be combined with almost any gas turbine architecture. One of these combinations is the partial turboelectric propulsion system architecture, which therefore could be investigated in a level of detail that has not been described before.
Aircraft and propulsion system concept
According to the Committee on Propulsion and Energy Systems to Reduce Commercial Aviation Carbon Emissions (2016), more than one third of the CO2 emissions from global commercial aviation is generated by single-aisle aircraft. Because of their significance, prior to the work for this paper, Bauhaus Luftfahrt investigated hybrid propulsion systems for these aircraft. For example, Vratny and Hornung (2018) investigated a 180-passenger aircraft with a range of 1,300 NM. They compared the energy consumption of a conventional aircraft, using two geared turbofans, to a parallel hybrid aircraft with two additional electrically driven fans. The electric fans were wing-mounted and for the battery a gravimetric energy density of 1,000 Wh/kg was assumed. In comparison to the geared turbofans, the hybrid propulsion system was not able to reduce the energy required for the mission. In order to lower the energy demand, instead of simply replacing conventional engines, the propulsion system also needs to be closely integrated. In this context, integration is intended to bring about a beneficial interaction between the propulsion system and the other aircraft parts, especially with regard to aerodynamics. During aircraft design, this requires close communication between aircraft and propulsion system designers. Following the study carried out by Vratny and Hornung (2018), this paper focuses on single-aisle aircraft. Initially, the same top-level aircraft requirements (TLARs) were also used. However, for this paper an integrated propulsion system architecture and a lower design cruise Mach number were selected. This selection will be explained in the following paragraphs.
Geared turbofan engines are currently the most advanced propulsion technology for commercial single-aisle aircraft. However, the use of turboprop engines opens up further potential to reduce fuel consumption when a technologically appropriate design flight Mach number below 0.7 is accepted. Moreover, this propulsion technology favors the use of wingtip propellers, as the operational regime of the constant speed propellers facilitates the easy transfer of large amounts of power. Research activities by Strack et al. (2017) from the German Aerospace Center have shown that a regional aircraft with a turboprop engine-based hybrid electric propulsion system can bring about a slight reduction in the mission fuel and energy demand while the aircraft's maximum takeoff mass (MTOM) remains almost constant. The combined parallel and series hybrid propulsion system for the concept aircraft includes wingtip propellers. Similar results have been found by Antcliff and Capristan (2017) and Blaesser and Frederick (2020) from NASA, who have investigated a regional aircraft with a parallel hybrid propulsion system including wingtip propellers. Both studies of German Aerospace Center and NASA assume that the battery has an energy density of 500 Wh/kg. However, for the propulsion of the aircraft class studied in this paper, significantly higher power is required than for regional aircraft. The anticipated battery mass would drastically increase the MTOM. For this reason, we concluded that, for a medium-term application, partial turboelectric propulsion using wingtip propellers is a more promising option. As such, a partial turboelectric propulsion system consisting of advanced turboprop engines and electrically driven wingtip propellers was evaluated. Although a higher design range would be more favorable for this propulsion system architecture, it was kept constant for two reasons. The first one is to pursue the research question of Vratny and Hornung (2018) and the second one is to assess a lower-boundary design range. For the evaluation in the case study, a conventional turboprop baseline aircraft is compared to a derivative with the partial turboelectric propulsion system, see Figure 1. Both aircraft have to fulfil the same TLARs, which can be found in Table 1. Based on the goals mentioned at the beginning of this paper, the entry into service is projected for 2035.
Figure 1.
The partial turboelectric aircraft with advanced turboprop engines (blue), featuring mechanically driven main propellers and generators, and the electrically driven wingtip propellers (green).
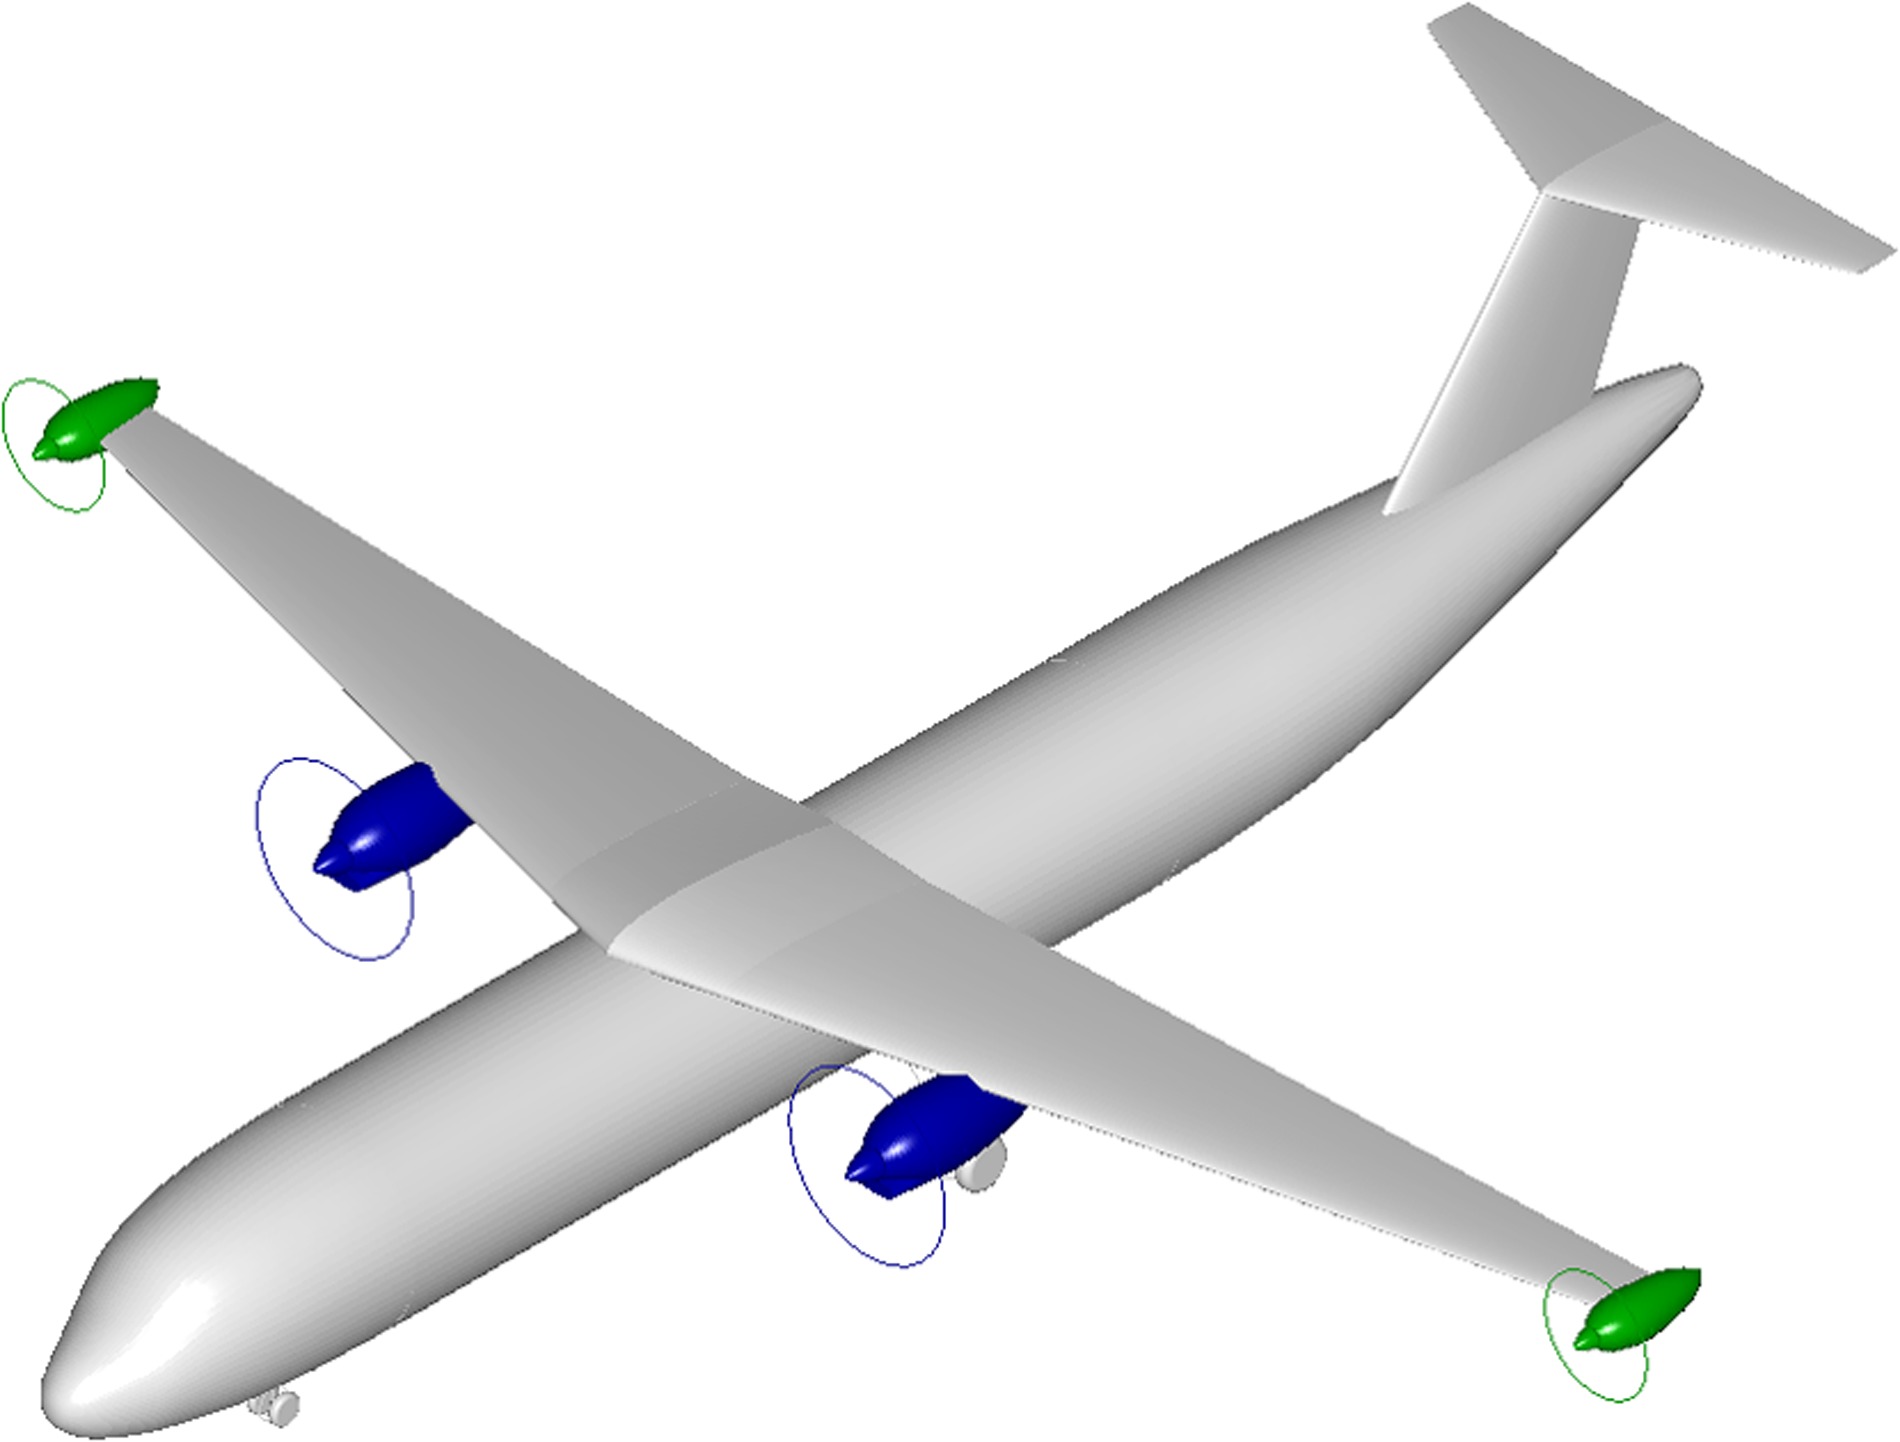
Table 1.
Top-level aircraft requirements.
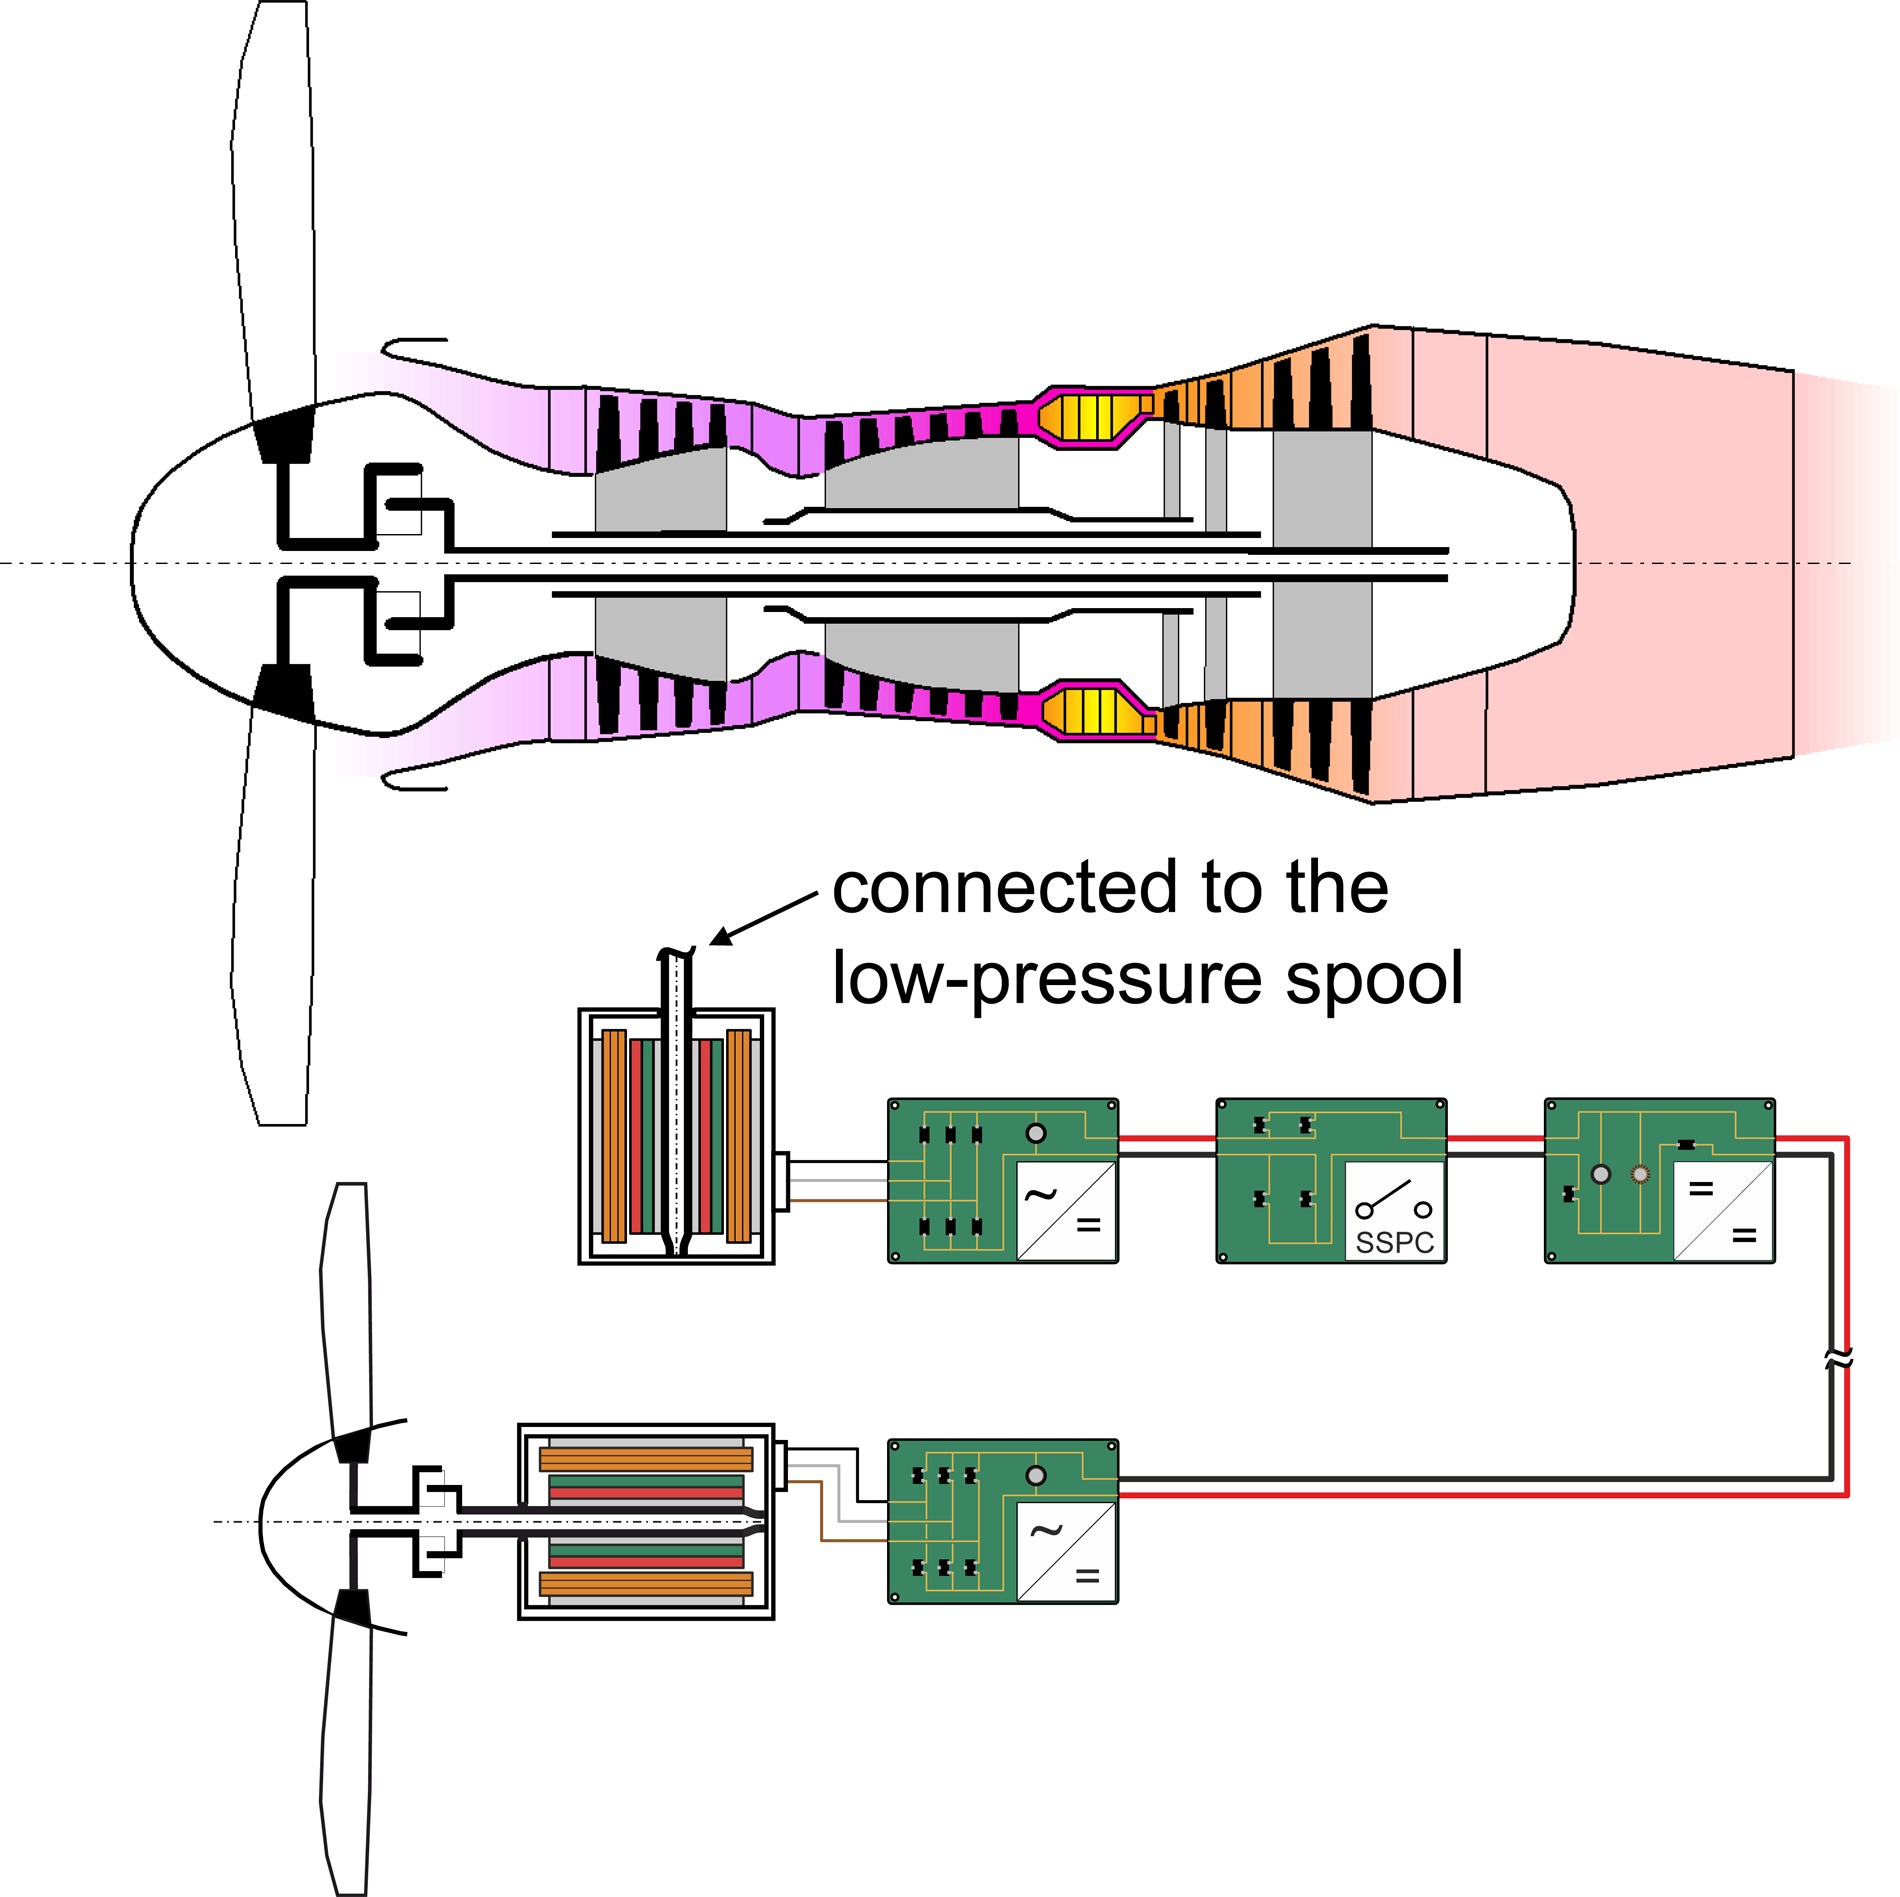
A diagram of the partial turboelectric propulsion system is shown in Figure 2. The upper part of the figure shows the rather conventional advanced turboprop engine. The lower part of the figure shows the electric part of the propulsion system, hereafter referred to as electric powertrain, which is used to drive the wingtip propeller. The generator of the electric powertrain is directly connected to the free power turbine of the engine, which also drives the main propeller via a gearbox. A more detailed description of the electric powertrain is presented in the modeling section below. Due to the all-electric subsystems of both the baseline and the partial turboelectric aircraft, the baseline and the advanced turboprop engines are presumed to feature bleedless designs. Instead of bleed air demand, the aircraft have an increased electric power demand for their subsystems. This additional demand is the same for both aircraft and is also covered by the turboprop engines. In this way, the aircraft and propulsion concept is set. In the following section, the methodology used will be explained.
Methodology
The first subsection describes the modeling of the aircraft and the modeling of the propulsion system, including its individual components. The modeling forms the foundation for understanding the preliminary partial turboelectric propulsion system design process. This process is explained in the ensuing subsection.
System and component modeling
In order to describe the dimensions, masses and characteristics of the aircraft and the propulsion system during the design process, models are needed. The scope of these models must be aligned with the tasks within the scope of the preliminary design. For the aircraft modeling only a short overview is given. The individual propulsion system components—both those of the gas turbine and those of the electrical system—are represented by analytical equations in mathematical-physical models. As for the aircraft, only a brief introduction is given for the gas turbine modeling. The focus is on the electric powertrain, for which a detailed description is provided.
Aircraft modeling
The aircraft design software Pacelab APD (PACE Aerospace Engineering & Information Technology GmbH, 2012) was used as the central integration platform and development environment for the various disciplines which are typically involved in conceptual and preliminary aircraft design. This software is mainly based on well-known semi-empirical methods developed by Raymer (2006) and Torenbeek (2010). It was extended with more sophisticated methods, as presented by Gologan (2010), Seitz (2012), Pornet (2018), Vratny (2019), and also with mass estimation methods from Arbeitskreis Masseanalyse des Luftfahrttechnischen Handbuchs (2008). They are applied to calculate the aircraft's aerodynamics, geometries, masses and to analyze their performances. To coincide with the entry into service in 2035, technological improvements are anticipated for the structure and aerodynamics of the aircraft, as well as in the material science domain.
The propeller sizing is closely coupled to the aircraft sizing and the mutual interference of the propellers and the wing. Therefore, the propellers were modeled in the aircraft domain. Since the partial turboelectric aircraft features wingtip propellers to reduce fuel consumption by lowering the aircraft's induced drag, the set of methods described had to be extended with a method which is capable of predicting this aerodynamic effect. No literature about a comparison of the predicted and actually measured induced thrust for comparable geometries and flight conditions as used in the case study was found. However, the work of Loth and Loth (1984), resulting in analytical formulae to account for the induced thrust created due to the utilization of wingtip propellers, was found superior compared to the simplified correlations presented in other publications. E.g., the correlations of Miranda and Brennan (1986) only apply to a distinct flight state, geometry, and performance setting. In contrast, the physics-based formulae from Loth and Loth (1984) are solved by providing information about the atmosphere, the aircraft's flight condition, the wing geometry, the operating conditions, and geometries of the propellers. Consequently, equations based on these formulae were integrated into Pacelab APD in line with the fidelity level of the methods already used. Nevertheless, the uncertainties in the validity of the associated predictions must be kept in mind and resolved in future work but were found acceptable as the case study presented in this paper is meant to be a software and capability demonstration.
Propeller modeling
The propeller calculations carried out follow the methodology presented in the GasTurb manual (GasTurb GmbH, 2020). Here, the actual propeller performance is predicted using a propeller map from Wainauski et al. (1987), which applies to prop-fans with flight Mach numbers similar to 0.68 from the TLARs. This map is scaled to match the desired propeller design at top of climb (TOC) and used for off-design calculations.
Gas turbine modeling
The gas turbine modeling is accomplished by using the GasTurb performance calculation software. This has been described in several papers by the software developer Kurzke (2007). During the design phase, the engine's dimensions and mass are determined. Equally to the propeller, the gas turbines for the paper were designed at TOC. The engine's off-design characteristics are estimated using scaled component maps. Detailed information about the general modeling can be found in the software manual (GasTurb GmbH, 2020).
As part of the turboprop engine preliminary design, the turbomachinery components are scrutinized. The compressor efficiency estimations, which are derived from empirical data, as well as the compressor design, are verified with the compressor mean line design tool included in GasTurb using empirical loss correlations. The turbine efficiencies are also derived from empirical data and the turbine stage loadings are checked with respect to their feasibility. Cooling air demand significantly influences the optimal process parameters. For that reason, this must be considered during optimization. The cooling air demands for the high and intermediate pressure turbines are deduced from Grieb (2004). The component efficiencies and the cooling air requirements were adjusted to an anticipated entry into service in 2035.
Electric powertrain
The electric powertrain, see Figure 3, is a crucial subsystem of the partial turboelectric propulsion system and is described in more detail below. It consists of a generator, a rectifier, a direct current (DC) to DC converter, a power controller, an inverter and an electric motor, which drives the propeller. The generator is connected to the low-pressure spool of the gas turbine. Since a coupling of the rotational speeds of the wingtip propeller and the gas turbine is not desired, a variable speed drive is needed.
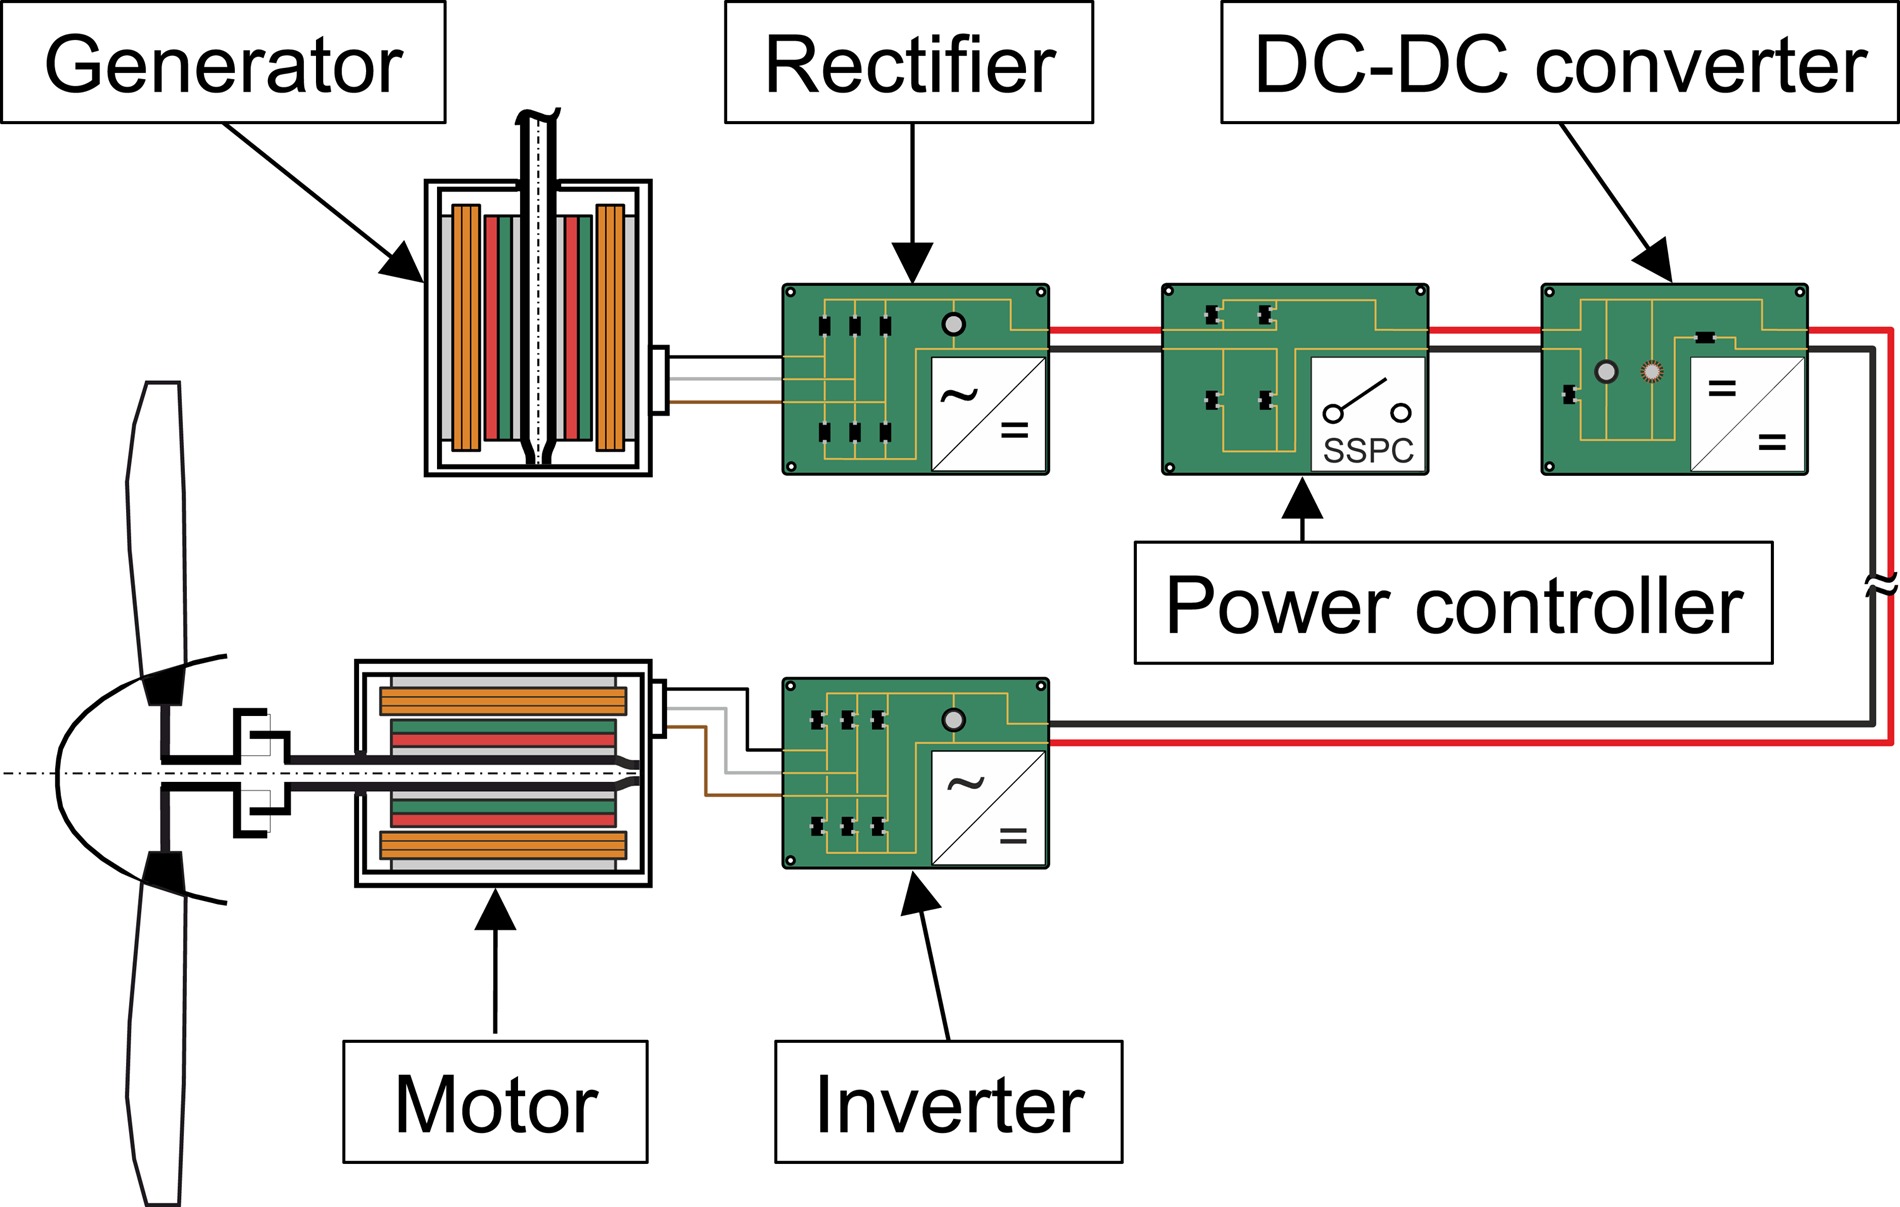
The three-phase alternating current (AC) produced by the generator is converted to direct current by the rectifier. The DC-DC converter then converts the voltage to the necessary voltage level for the inverter. The power electronic components are connected to each other by a DC cable. A DC power controller will work as a circuit breaker in the event of component failures. The inverter is used to convert the DC voltage into three-phase AC voltage for the electric motor. The wingtip propeller is then connected to the electric motor via a gearbox. In this way, the wingtip propeller speed is independent of the turboprop engine's low-pressure spool speed.
Electric component modeling
In order to simulate the electric powertrain, the GasTurb software is accordingly extended with the component models described below. The basic concept for the modeling of the electric components is taken from Vratny (2019).
Electric machines
Due to their power density, the generator and the motor are projected to be permanent magnet synchronous machines (PMSMs). The modeling of the electrical machines is based primarily on Müller et al. (2008). By Köhler and Jeschke (2021) specific additions were made and validated against experimental data from Vollmer (2012). In the implemented model, the required torque and speed are the primary design parameters. The electric and the magnetic loading represented by linear current density and maximum magnetic flux density, serve as input parameters to calculate the required air gap diameter of the machine. In this context, the ratio of the length of the active parts to the air gap diameter also is an input variable. Similar to the air gap diameter, the stator dimensions can be calculated from the electric and magnetic loading. Detailed explanations of the calculations can be found in the aforementioned literature. Copper is chosen as the conductor material. The influence of other conductor materials, such as aluminum or silver, is not investigated. Based on an empirical regression from Köhler and Jeschke (2021) a mean machine density of 1,200 kg/m3 was anticipated for 2035, which in combination with the dimensions of the machine allows for the calculation of machine mass.
To model the operational characteristics of the machine, a map is used. This is in line with the level of detail of the calculations for turbomachinery, where no high-fidelity methods are used either. For this reason, the efficiency of the machine at the design point is an input parameter. Its value is taken from empirical values of similar machines. To calculate the voltage and the current corresponding to the torque and the speed of the operating point, an equivalent circuit is used. Further details of the operational characteristics modeling can be obtained from Köhler and Jeschke (2021).
Power electronics
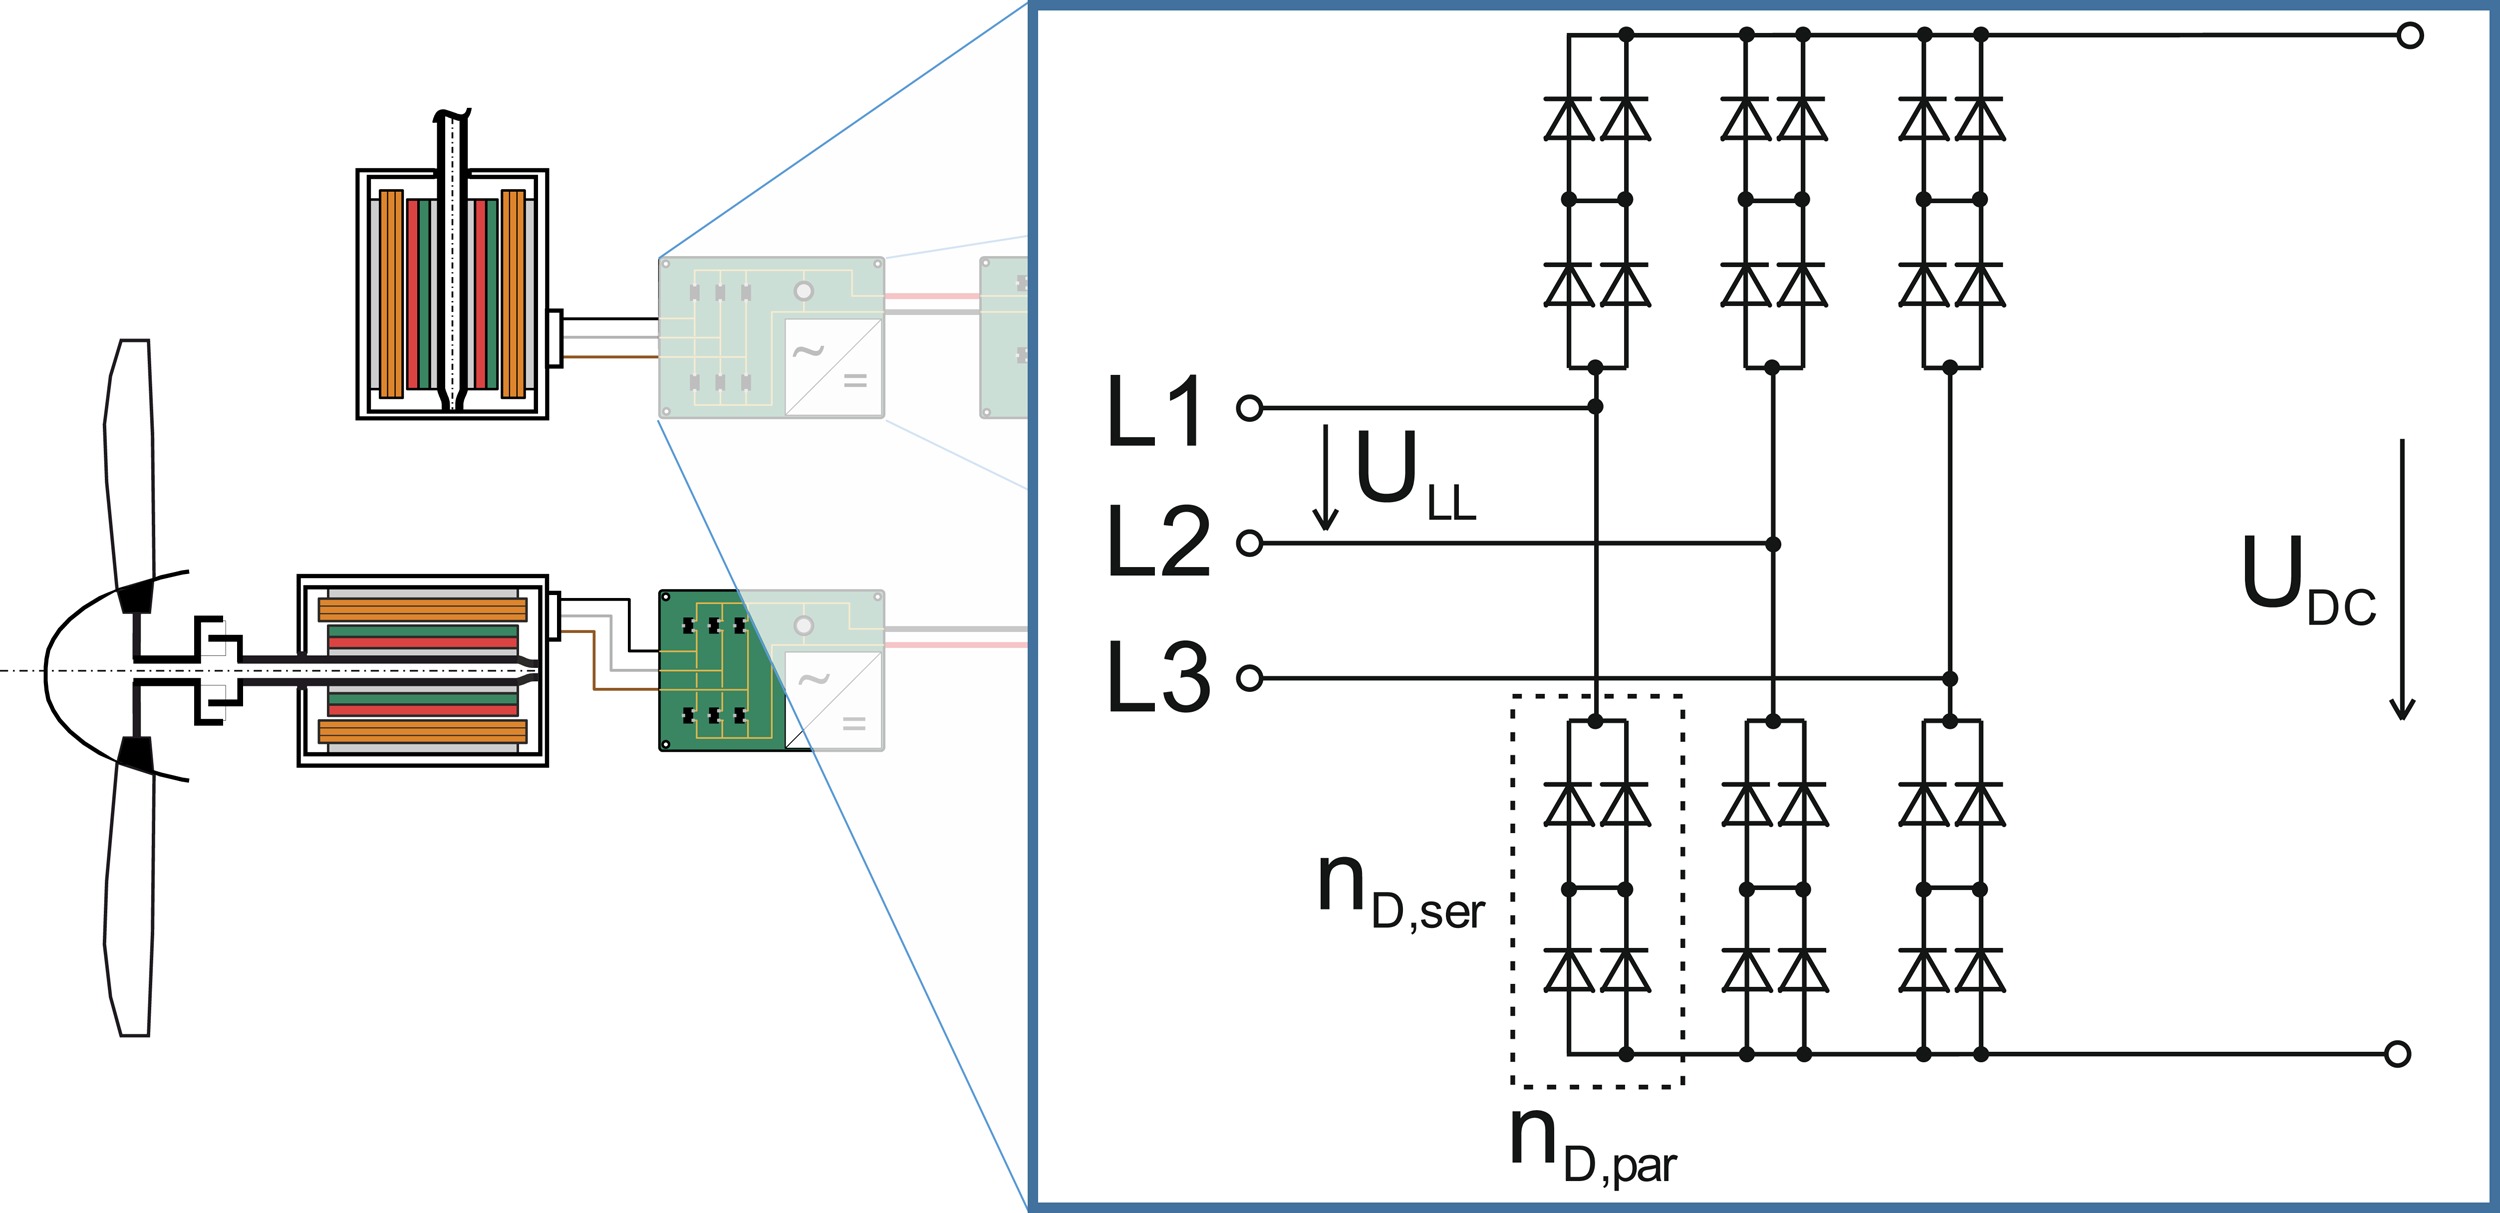
The power electronics components consist of semiconductor devices such as diodes and transistors. Individual semiconductor devices can only switch limited voltages and conduct limited currents. To illustrate the modeling of the power electronic components, the rectifier depicted in Figure 4 is used as an example. Only unidirectional power transfer occurs and the generator spool speed is almost constant. As such, an uncontrolled three-phase bridge rectifier is chosen. The sizing method and the loss calculation for semiconductor devices is basically the same for all of the components. The other power electronics components of the partial turboelectric propulsion system are a solid-state power controller, a DC-DC buck-boost converter and a three-phase inverter. The basic current and voltage calculations in the components are conducted according to Schröder and Marquardt (2019). Semiconductor devices for power electronics are optimized for high voltage and current. Nevertheless, their capabilities are limited. If high currents, which exceed the capability of a single diode, have to be conducted several diodes must be connected in parallel. At high voltages, which exceed a single diode's capability, the diodes have to be connected in series, as shown in Figure 4. So, one of the main tasks in the component design is to determine the number of semiconductor devices in parallel and in series. The DC-DC converter additionally requires an inductor as well as capacitors at the input and output, which smooth out the voltage ripples that would otherwise occur. Having determined the number of semiconductor devices and the sizes of the inductor and the capacitors, the mass of the corresponding component is calculated. To account for additional masses, such as the masses of the casing or of the circuit board, a factor is applied. During the operation of power electronics losses occur. In the models implemented, conduction losses and switching losses are taken into account, both during design and off-design calculations. Blocking losses and driving losses have a much smaller impact in the given application and therefore are ignored. The loss modeling is based on Wintrich et al. (2015) and validated against data from SEMIKRON International GmbH (2020). Semiconductor losses depend on several different parameters. The most significant ones are current, voltage, and switching frequency at the single semiconductor device. Combining the conduction and the switching losses of a single semiconductor device and then multiplying them by the number of devices in the power electronics component, yields its total loss. At system level, the losses show up as a voltage drop. For the inverter calculation the degree of modulation, used for the pulse-width modulation, and the power factor are of additional importance. For the DC-DC converter the duty cycle, as well as additional losses caused by the inductor and the capacitors, have to be considered. The internal topology of the component is determined in the design. The defined number of semiconductor devices in parallel and in series is then taken into account in the off-design calculation (Vratny, 2019).
Due to the complexity of power electronics, several simplifications have to be made for the propulsion system performance simulation. For example, no instantaneous values of current or voltage are passed between the component models, and the temperature of the semiconductors is assumed to be constant. Utilizing the power electronics modeling, different design parameters—which both affect power electronics and electric machines—can be studied. Only in this way a meaningful holistic electric powertrain optimization can be conducted.
DC cable
A DC cable is required for transmitting the electric power between the power electronics components. The cable connecting the DC-DC converter and the inverter is several meters long. Because of its mass it has to be examined in detail. However, the cable mass is smaller than the mass of a single electric machine and the conduction losses of the cable have only a minor impact on the overall system losses. Given the electric power of approximately 1.5 MW or less, the complexity and cooling system mass of a superconducting cable do not seem to be worthwhile. Accordingly, a conventional cable is considered to be sufficient.
The conventional cable model consists of a solid conductor, a surrounding insulation and a sheath which protects the insulation. For the design, a certain current density is prescribed allowing the conductor diameter to be obtained from the current transmitted. A conductor is required for each polarity (+ and −). The insulation thickness depends on the given voltage, the conductor diameter as well as other parameters and is determined using an analytical equation from Cheng (1994). The sheath thickness is chosen according to the usual sheath thickness of similar cables. The cable mass is calculated on the basis of the diameters of the conductor, the thickness of the insulation and the sheath, the material densities, as well as the cable length. In order to calculate the cable's resistance, it is necessary to know its length and the conductor diameter. During off-design operation, the ohmic losses of the cable can be determined using the resistance value from the design calculations. Different conductor materials can be used in the cable model. However, because of disadvantages, such as higher costs or higher losses for some materials, only copper was regarded as conductor material in the investigated powertrains.
Thermal management system modeling
To manage the heat loads from the electric powertrain, a thermal management system (TMS) is required. The detailed system model consists of coldplates for heat acquisition; pipes, ducts, pumps, and fans for heat transport; and a compact heat exchanger for heat rejection. Each component is modeled to a level of detail which allows TMS mass, drag, power, and size to be assessed. The modeling procedure, as well as design and off-design studies of the TMS, have been described in detail by Kellermann et al. (2021).
For the comparison of the baseline and the partial turboelectric aircraft, TMS masses are used. These are the final results based on an optimization towards a target function derived from the aircraft. The setup of the optimization study is also explained in detail by Kellermann et al. (2021).
Preliminary partial turboelectric propulsion system design process
This subsection describes the preliminary propulsion system design process. The preliminary design of the propulsion system is implemented using the models described in the previous subsection. Before the process itself is explained, the used electrification and performance metrics are outlined. Next, the iterative preliminary design process with its interfaces between the aircraft and the propulsion system, as well as the subordinate processes on the propulsion side, will be explained, and finally, the propulsion system's off-design operating strategy will be clarified.
Electrification metric
In order to define the degree of electrification clearly, a distinct metric is necessary. For the design of the partial turboelectric propulsion system, this key metric is the power split
In principle, the equation is applicable over the entire operating range. However, at the beginning of the design process for a partial turboelectric system, the main propeller's maximum shaft power
As power specific fuel consumption
Iterative aircraft and propulsion system design
Properly matching the aircraft and the propulsion system ensures that the propulsion system can fulfill its requirements, while at the same time not being unnecessarily heavy. At the start of the design process, the exact size and mass of both the baseline and the partial turboelectric aircraft are not known. For this reason, empirical values for the baseline aircraft and its propulsion system are used to perform initial mission calculations. After a few iterative calculations, involving the propulsion system mass and dimensions, the shaft power requirements of the conventional turboprop baseline aircraft can be determined.
For the partial turboelectric aircraft, the design process is more complex, due to additional degree of freedom in
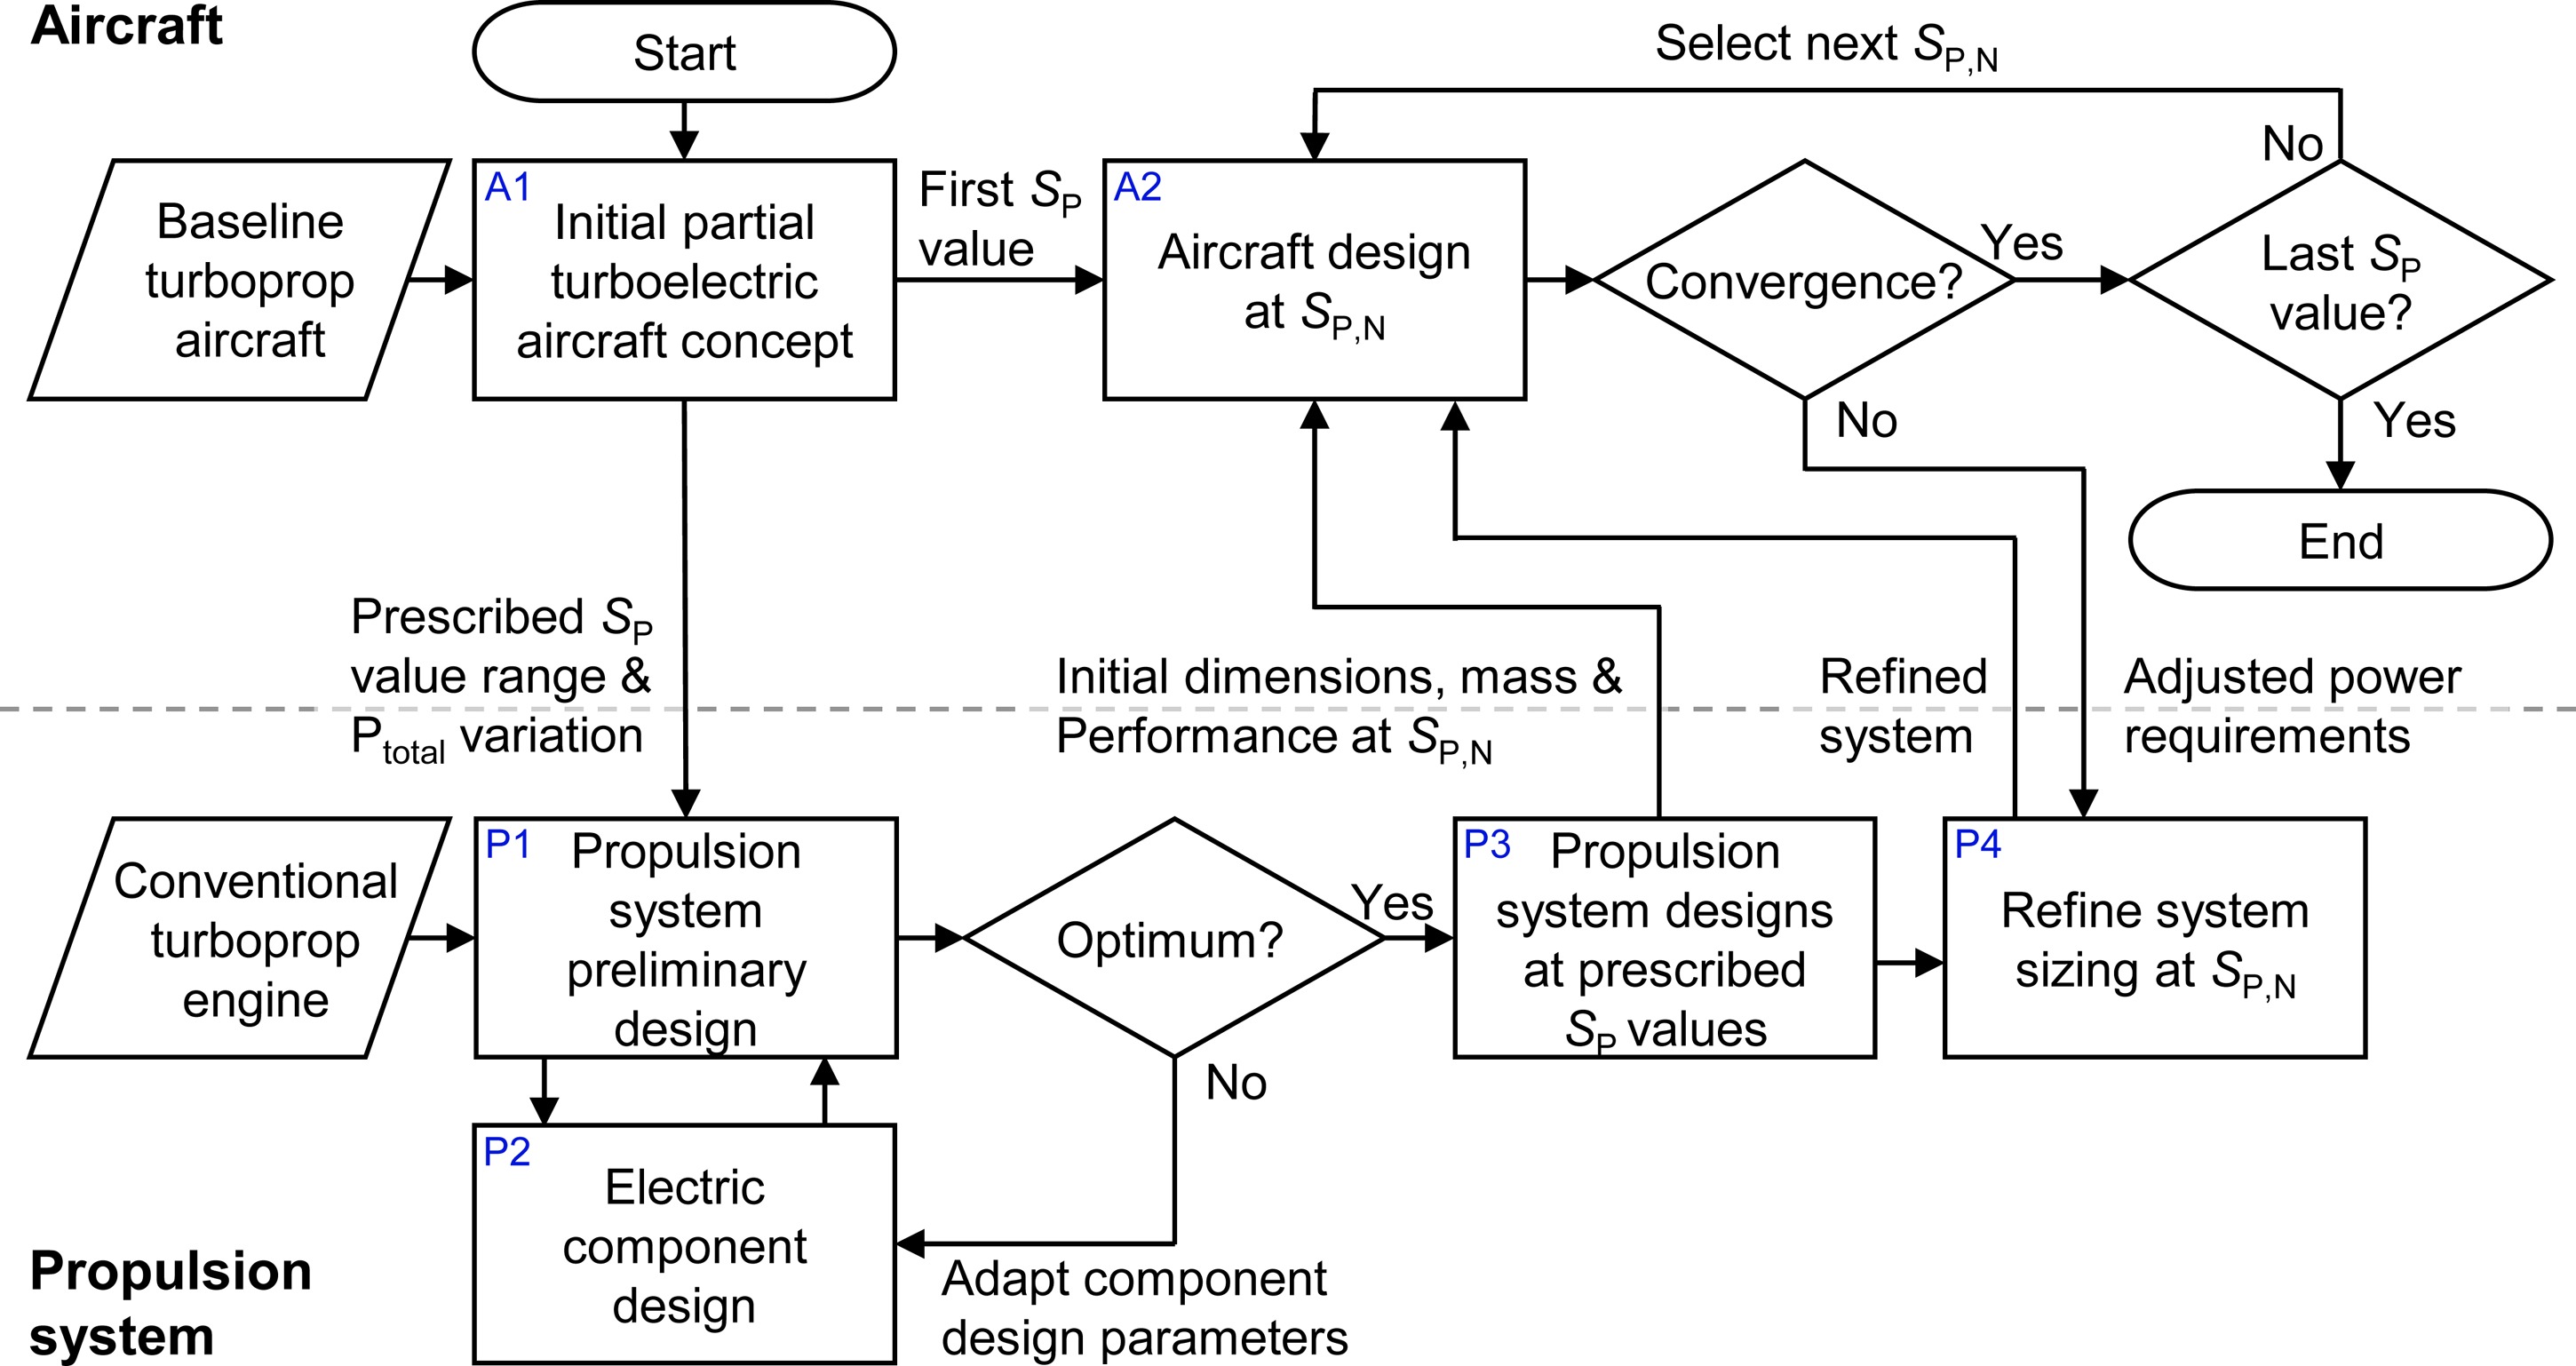
At distinct
Gearbox sizing
The propeller gearbox is an essential part of a turboprop propulsion system and has a significant mass. In a partial turboelectric propulsion system, additional gearboxes might be beneficial despite their masses. The benefit of these gearboxes and the sizing strategy of the main propeller gearbox are discussed here. The mass correlates to a considerable extent with the mechanical power which can be transmitted by the gearbox. To calculate the mass of the gearboxes, a correlation from NASA (Brown et al., 2005) is used.
Wingtip propeller gearbox
The propeller speed depends on its diameter, since the blade tip speed is limited. Raising the motor speed significantly above the propeller speed results in a major reduction in motor mass, which overcompensates the additional gearbox mass. To achieve maximum power density, the optimum motor speeds are often much higher than the feasible propeller speeds. This aspect will be investigated in more detail in the design studies section. For this reason, a gearbox is also used on the wingtip propeller, and the motor speed becomes a design variable. The same mass correlation is applied as for the main propeller gearbox.
Potential generator gearbox
When combining propellers with either electric motors or turbines, using a gearbox is often advantageous. As for electric motors, high speeds are beneficial for the generator's power density. In this regard, the optimum generator design speed would be higher than the low-pressure spool speed, but losses in the electric powertrain increase with higher speed. For this paper therefore, the generator is directly mounted to the spool, omitting the generator gearbox as well as its mass and losses.
Main propeller gearbox
The main propeller gearbox is sized to the operating point with the highest mechanical load. This load occurs at sea level static conditions and is prescribed by the takeoff power requirement. In some operating points therefore, the gearbox limits the maximum power of the gas turbine, or more precisely its torque.
In the case of a partial turboelectric propulsion system, the main propeller gearbox sizing strategy attains additional importance. The question arises as to whether the main engine gearbox should be capable of transmitting the whole gas turbine power in the event of a failure in the electric powertrain. This question also applies to the propeller, since it has to be capable of producing additional thrust from the extra power. For this paper, the main propeller and its gearbox do not include back-up potential for the failure of the electric powertrain, because it is not as critical as the failure of the gas turbine itself.
Electric powertrain
After having discussed the general design process for the propulsion system and the gearbox sizing, the electric powertrain design process is brought into focus. A brief description of the design calculation algorithm in the tool is given next, which is then followed by a short explanation of the off-design calculation algorithm.
Electric powertrain design calculation algorithm
The electric powertrain design is carried out analogously and virtually parallel to the gas turbine design. In the case of the electric powertrain, electric properties, such as resistances, inductances, and capacitances, as well as component masses, are determined. During the design phase, the electric powertrain is considered independently from the gas turbine, that is, the design power off-take of the gas turbine does not necessarily have to match the design generator power.
Each component in the electric powertrain, see Figure 3, is sized for the system's maximum continuous power, taking into account maximum currents and voltages. The design calculation starts with the electric motor. The speed and torque of the electric motor are the input parameters which define the required mechanical power. Subsequently the other components of the electric powertrain are sized according to this initial maximum power requirement, taking into account the accompanying losses.
For the loss calculations of the inverter and the rectifier, AC voltage properties are necessary. For this reason, the generator design calculation has to be performed before the exact power required is known. An iteration is applied to ensure that the electric powertrain's internal power balance is fulfilled. The generator speed is a fixed input parameter during the design calculation. For this reason, the generator's torque is varied during the design iteration process in order to match the motor's power demand. For the propulsion system under investigation, the generator design speed is the same as the gas turbine's low-pressure design spool speed. This seems advantageous for the generator mass and for the off-design performance, since most of the time the spool operates at the design speed.
Electric powertrain off-design calculation algorithm
The power off-take at the gas turbine's low-pressure spool at a certain operating point is predetermined through the off-design operating strategy of the partial turboelectric propulsion system (see paragraph below). With the given power off-take and the known low-pressure spool speed, the generator torque and speed can be calculated. The electric motor speed is an input, since a variable pitch propeller is used. The wingtip propellers are operated at constant speed. Hence, the motor speed is constant as well. The motor torque is iterated to determine the power balance of the electric powertrain, including the electric transmission losses of the system.
Propulsion system off-design operating strategy
To optimize the use of the aerodynamic advantage of the wingtip propeller, it is operated at its maximum continuous power rating, whenever it is possible. Analogous to Equation 1, the power split at any off-design operating point
(3)
However, there are operational limitations to
This is implemented by constantly monitoring the ratio of the maximum mechanical input power of the generator
Preliminary propulsion system design studies
Several parametric studies have been carried out for the partial turboelectric aircraft, the TMS, and the partial turboelectric propulsion system. These were conducted to constrain the respective parameter space and to identify possible optima. For the detailed TMS studies please refer to Kellermann et al. (2021). This section presents results of the studies of the partial turboelectric propulsion system as a stand-alone system not including the TMS. Since it is also a crucial part of the partial turboelectric propulsion system, the design studies for the turboprop engine are included as well. In the graphs below, the baseline parameter values are marked with black crosshairs.
Preliminary design of the conventional turboprop engine
To achieve a high thermal efficiency, a high overall pressure ratio is required. To this end, a three-shaft configuration with a free-running low-pressure turbine driving the propeller was chosen for the turboprop engine. Using data from existing turboprop engines from Jane's Aero Engines (Daly, 2014) and the basic principles of gas turbine design from Walsh and Fletcher (2008) and Grieb (2004), the preliminary design for a current three-shaft turboprop was made. Based on this design, the engine design was adapted to the requirements and entry into service for the reference engine in an iterative process.
Turbomachinery components
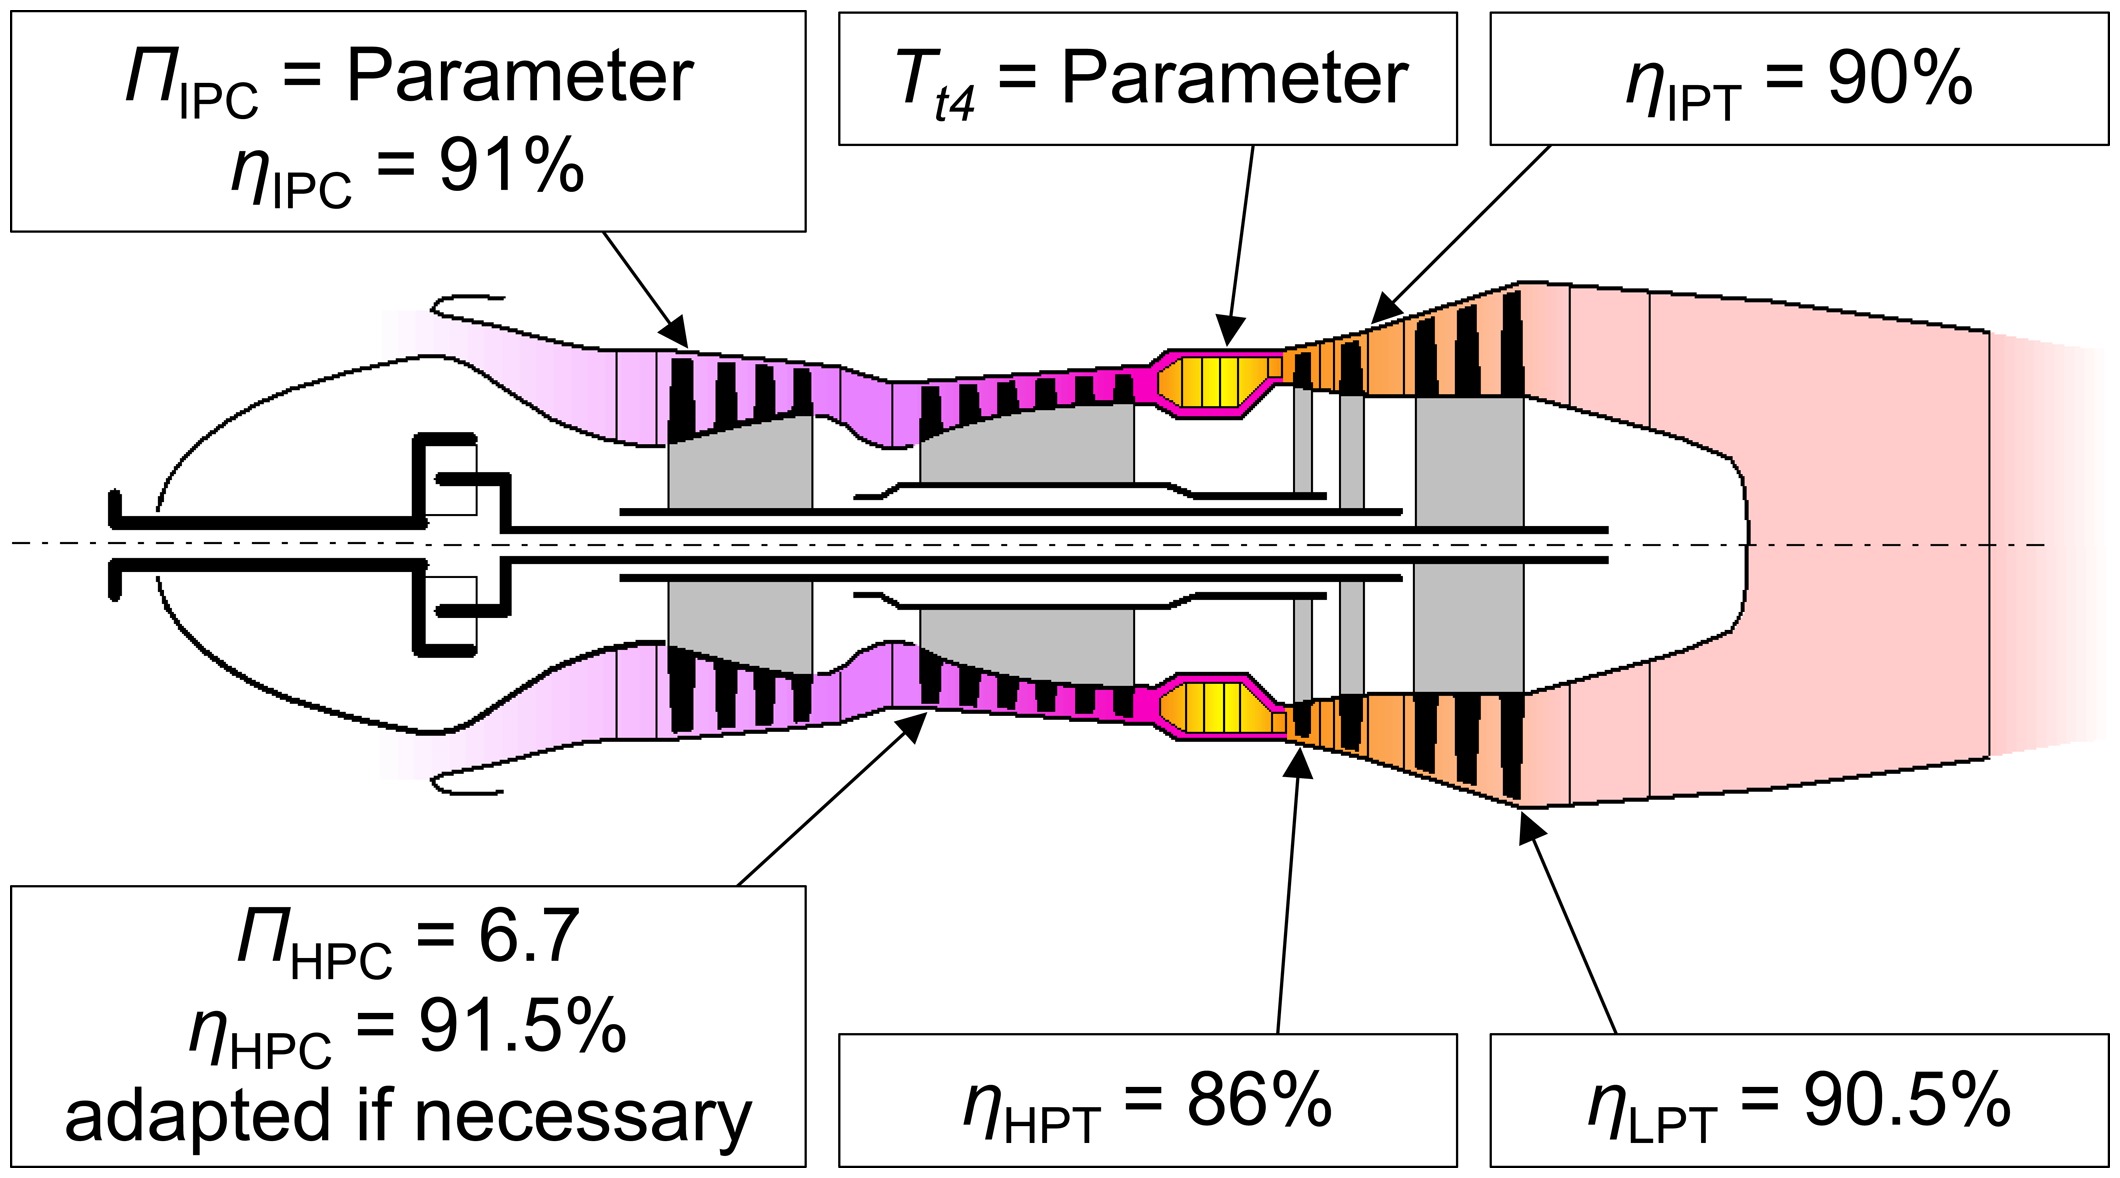
The polytropic efficiencies applied in the final 4,135 kW TOC-power model are shown in Figure 6. The HPC type is not prescribed. It might be strictly axial, as in the Europrop International TP400-D6 turboprop engine, or axial with a final radial stage, comparable to the Ivchenko-Progress D-27 engine (Daly, 2014). The selection depends primarily on the compressor pressure ratio and the mass flow. For decreasing volumetric flow rates, a slight decrease in the HPC efficiency is stipulated. Apart from this, the issue is not examined in any further detail during the preliminary design.
Thermodynamic cycle
The turbomachinery efficiencies are only valid for a narrow range of mass flows and pressure ratios, so by employing the corresponding efficiencies, the thermodynamic cycle is optimized iteratively. While TOC is the design point of the gas turbine, it is mainly operated under cruise conditions throughout the mission. The engine's fuel consumption during cruise is therefore crucial. Figure 7 shows the mid-cruise
Figure 7.
PSFC T t 4
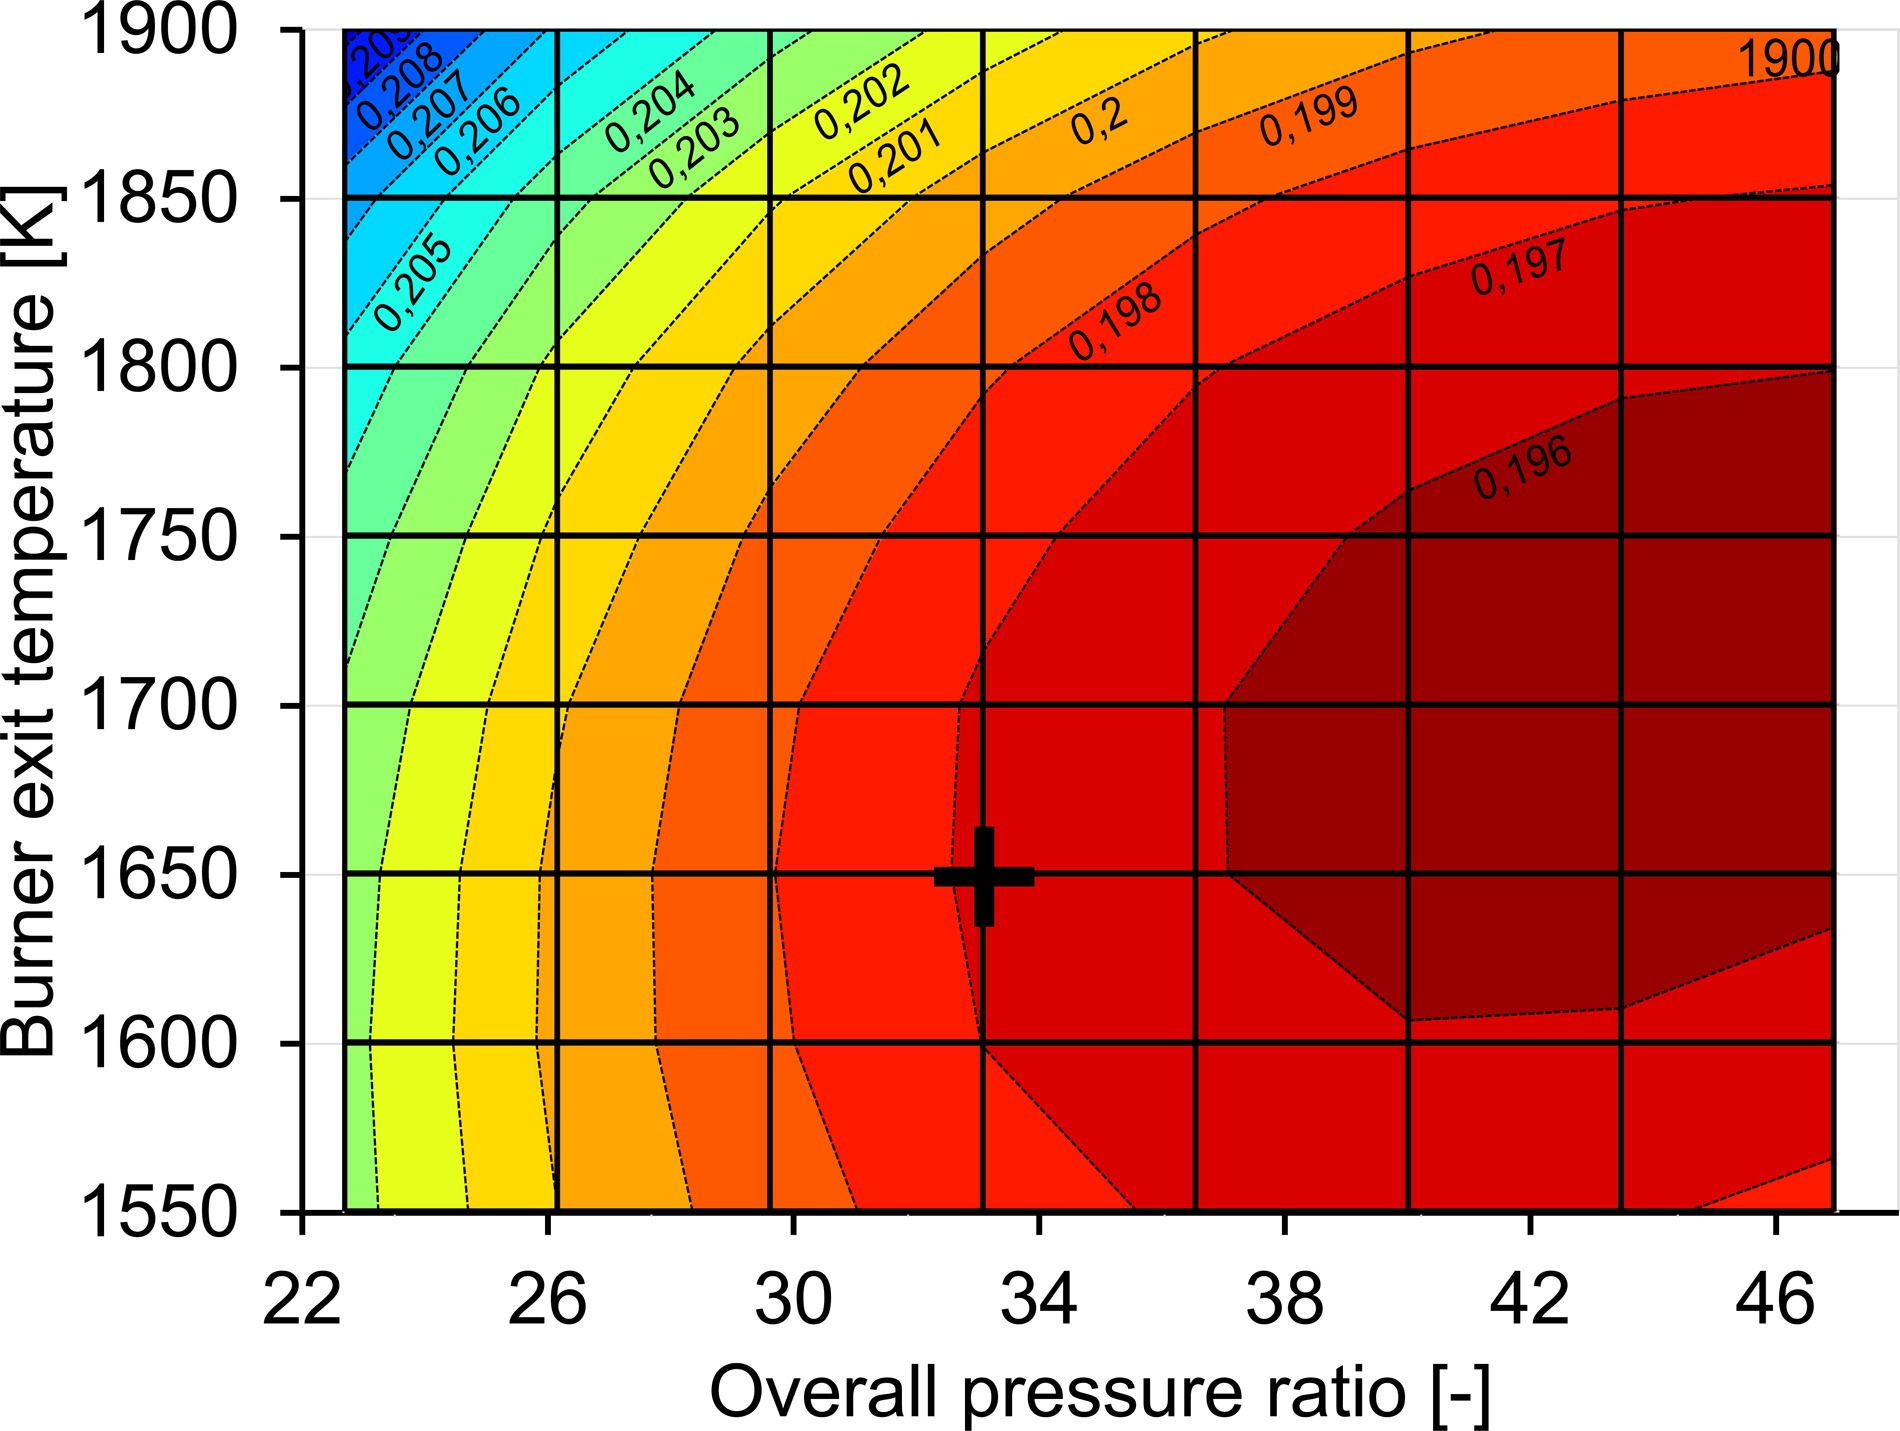
Table 2.
Iteratively determined shaft power requirements at the operating points top of climb (TOC), mid-cruise, and hot day takeoff (HDTO) and the corresponding altitude, temperature deviation from the international standard atmosphere (ISA), and flight Mach number.
| Operating point | Altitude | Mach number | Shaft power requirement | |
|---|---|---|---|---|
| TOC | 10,668 m | +10 K | 0.68 | 4,135 kW |
| Mid-cruise | 10,973 m | +10 K | 0.68 | 2,992 kW |
| HDTO | 1,524 m | +20 K | 0.2 | 7,474 kW |
Baseline aircraft shaft power requirements
The following section describes the requirements for one of the aircraft's two engines. The shaft power requirement at TOC is shown in the first row of Table 2. The mid-cruise power requirement is shown in the second row. As far as the power is concerned, the mid-cruise requirement can be easily fulfilled by the engine. This requirement amounts to only 72.4% of the TOC value at a 2.9% higher altitude. Another important operating point is takeoff, where the highest power demand occurs. Full takeoff power has to be provided at hot-and-high conditions, as indicated in the third row of Table 2. Due primarily to the torque capacity of the propeller gearbox, even at lower altitudes and temperatures, the shaft power of the gas turbine is limited to the value given in Table 2.
Preliminary design of the partial turboelectric propulsion system
As explained in the methodology section, the baseline aircraft's conventional turboprop engine represents the starting point for the preliminary design of the partial turboelectric propulsion system. This means that the final baseline turboprop core engine is used as the initial advanced turboprop core engine for one half of the partial turboelectric propulsion system. As such, for the propulsion system studies in this section, the advanced turboprop engine's
Overall system level
The key system design variable of the partial turboelectric propulsion system is
The main benefit of increasing
The quantities in Figure 8 are plotted over
Figure 8.
Relative Δ P total Δ PSF C total Δ S P
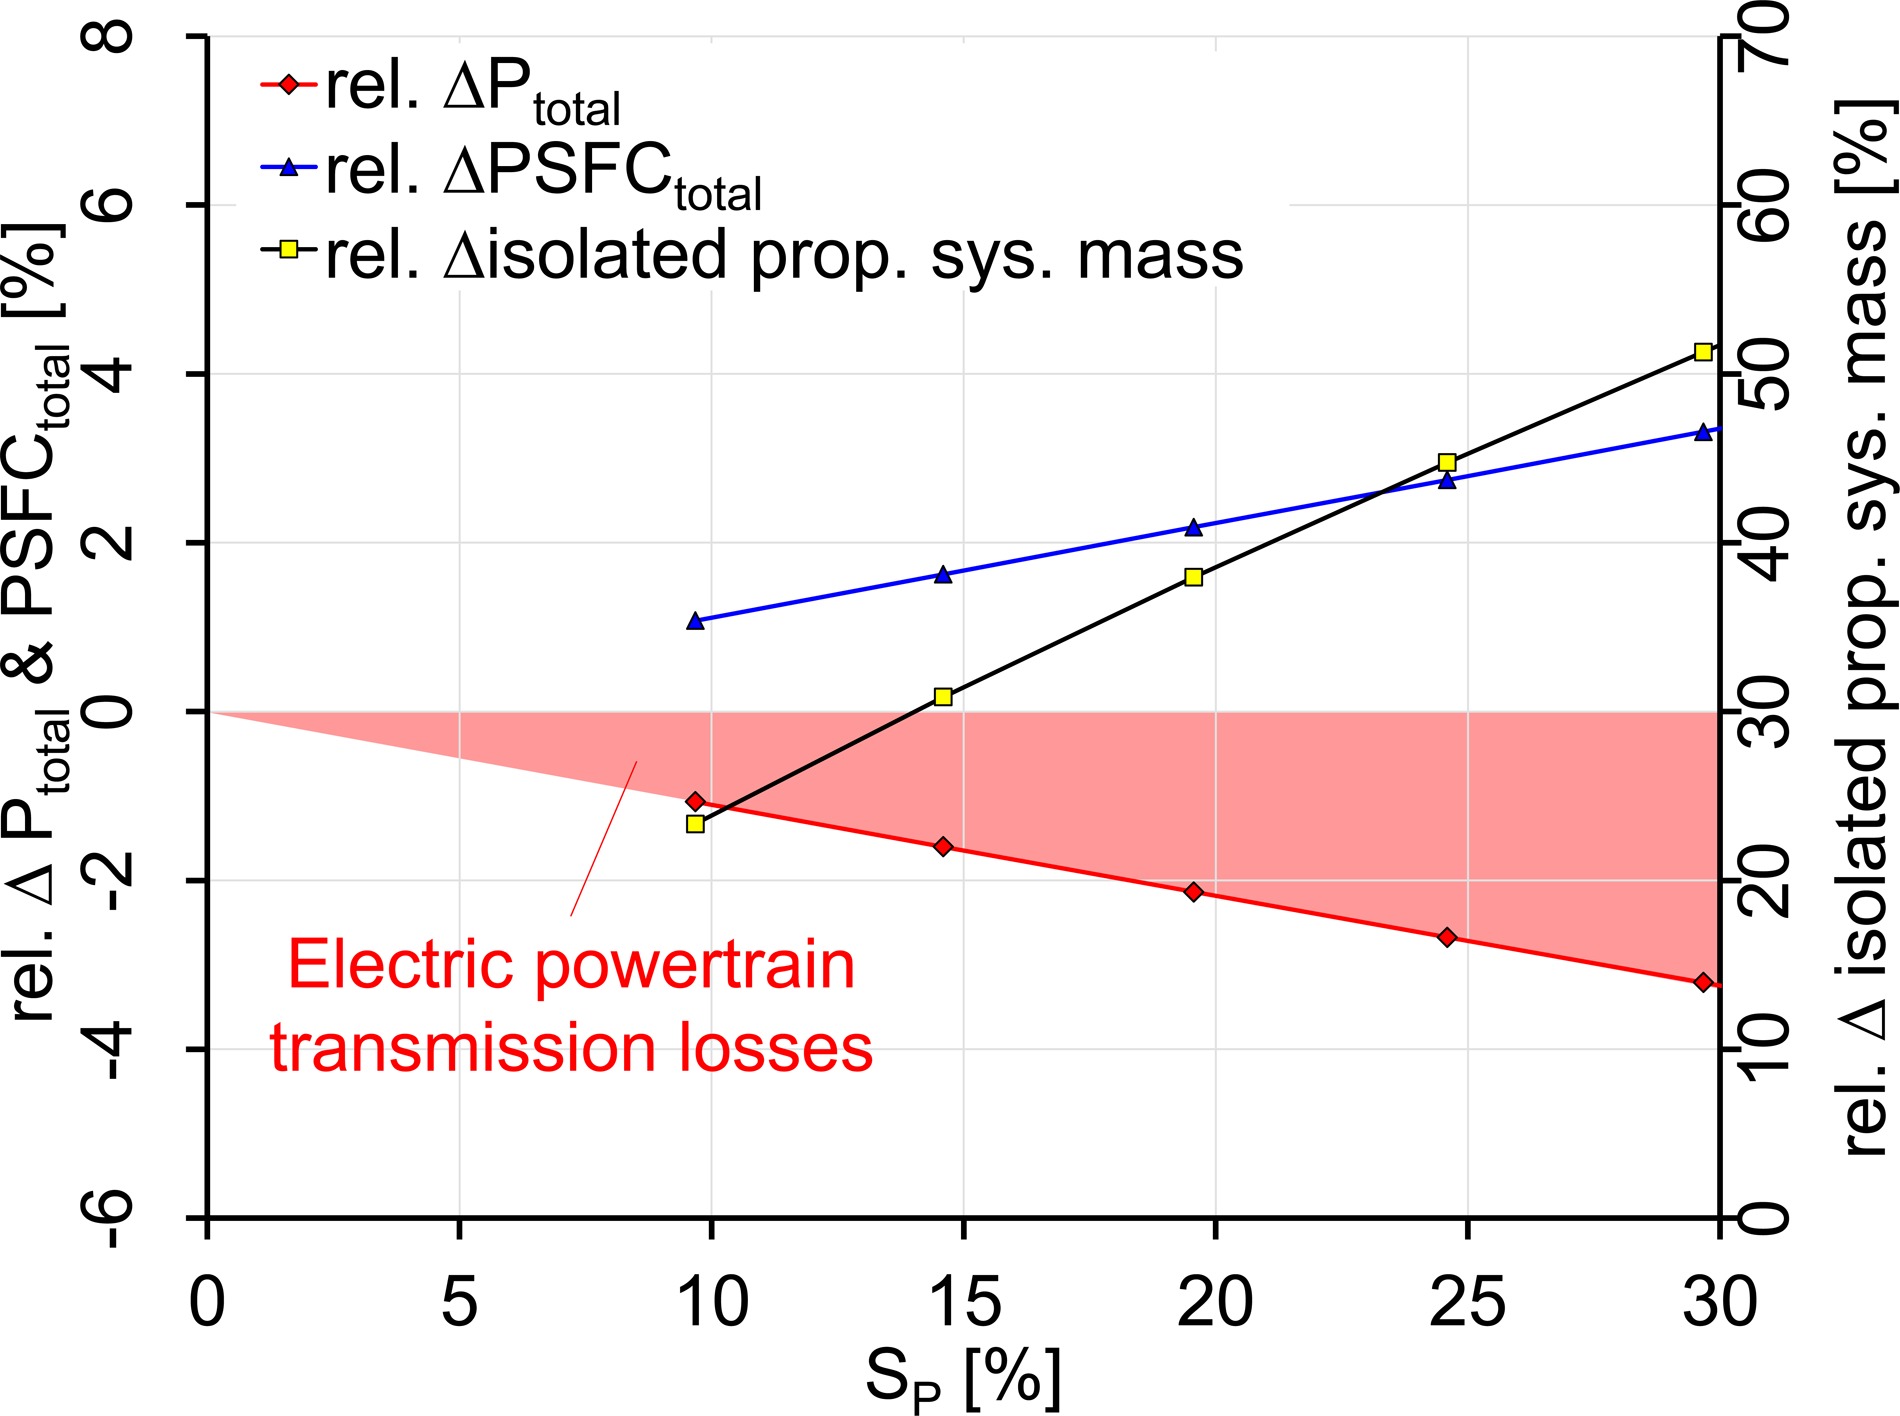
Table 3.
Shaft powers and PSF C total
| SP | ||||
|---|---|---|---|---|
| % | kW | kW | kW | kg/kWh |
| 0 | 4,135 | 0 | 4,135 | 0.1859 |
| 10 | 3,680 | 409 | 4,089 | 0.1879 |
| 20 | 3,236 | 809 | 4,045 | 0.1900 |
| 30 | 2,801 | 1,200 | 4,001 | 0.1921 |
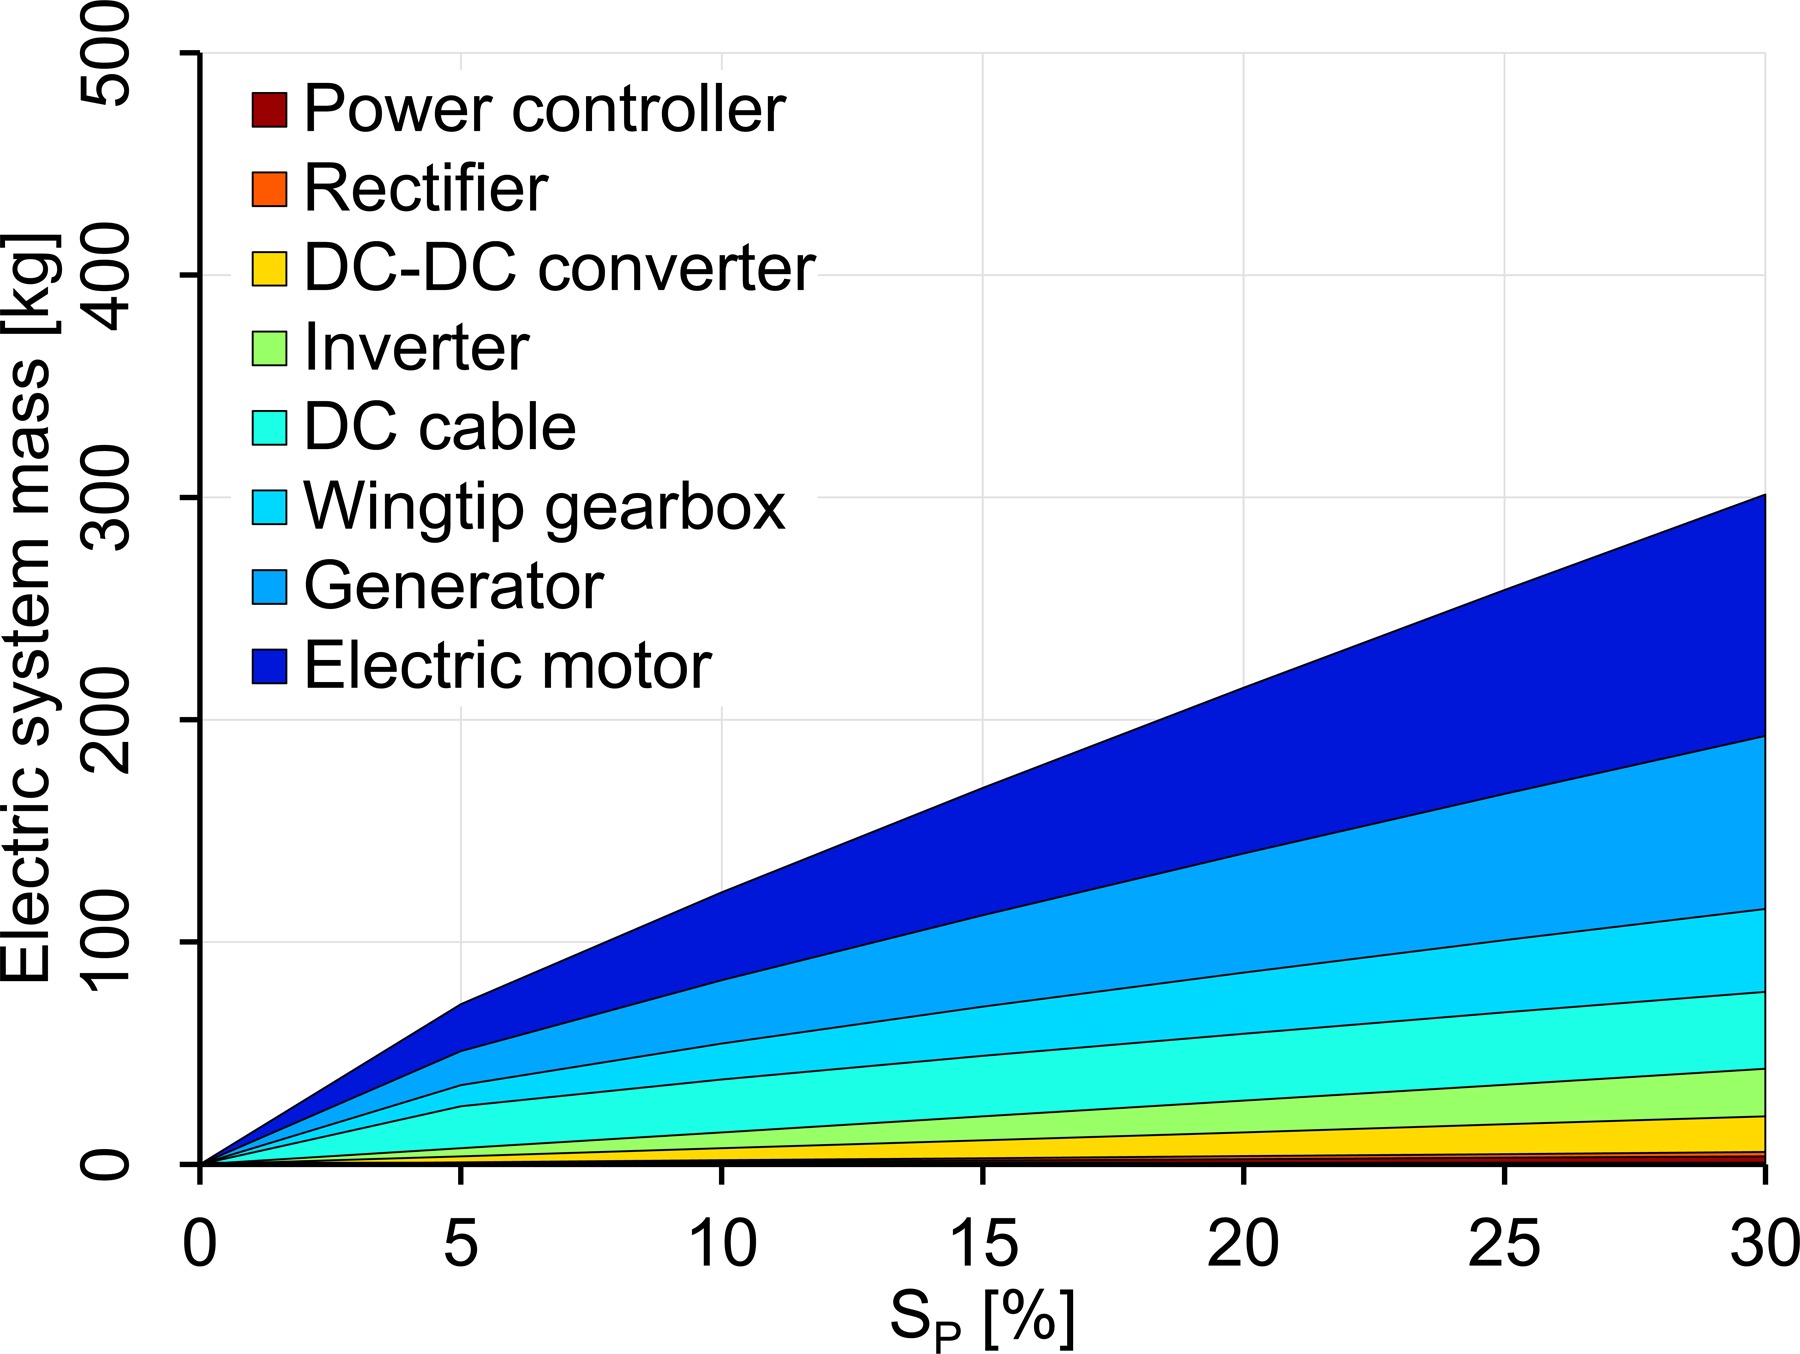
Figure 9 shows masses of the individual electric powertrain components over
Electric machines
The newly developed tool enables the user to optimize the electrical system to the same level of detail as the gas turbine. In order to demonstrate this by way of example, the studies on the electric machines will be discussed in more detail below.
The first study concerns the optimum design speed. Generally, higher speeds of electric machines lead to higher power densities which are desirable for airborne applications. Nonetheless, as speed increases, mechanical losses and stresses grow. Publications in the field of electrical machines have addressed the design limitations. For example, a PMSM with a maximum rotor circumferential velocity of approximately 180 m/s was described by Binder and Schneider (2007). This value is regarded as the upper limit and should not be exceeded during the electric machine design. At even higher speeds, the safe fixture of the magnets can no longer be ensured, at least for inrunner machines.
For the electric machine design several parameters have to be determined. The baseline key design parameters are shown in Table 4. Electric loading, maximum current, and flux density depend on the materials and the cooling technology used (Müller et al., 2008). The copper fill factor and the winding factor depend on the winding technology used. For the power factor, which can be varied in a small range, an empirical value is used. Since detailed efficiency calculations for the machines require high fidelity methods, the design efficiency is an empirical input value. The active length to air gap diameter, the number of pole pairs, and the design speed can be varied across a wide range.
Table 4.
Electric machine baseline key design parameters.
Only the motor will be examined in this first electric machine study, but the same approach basically applies for the generator. The propeller speed is obtained by using a prescribed power loading of the propeller and a given maximum tip Mach number. Taking into account the propeller gearbox losses, the mechanical power of the electric motor can be calculated from Table 3. For SP = 30% the value is 1.21 MW. Starting from the baseline parameters, the number of pole pairs and the design speed are varied. The results are shown in Figure 10. For the mechanical power of 1.21 MW and the parameters from Table 4 at 9,000 RPM, a rotor circumferential velocity of 180 m/s is reached, which marks the upper speed boundary of the study. 3,000 RPM, which is a standard speed for 50 Hz grid applications, marks the lower speed limit. At least one pole pair is needed in an electric motor. Because of the strong increase of system mass when applying a low number of pole pairs, a lower boundary of two pole pairs is chosen. When only Figure 10 is considered, the speed and number of pole pairs should be as high as possible. At the same time, Figure 11 shows that higher speed and higher number of pole pairs lead to lower efficiencies. The reason for this is the increasing electric frequency, which results in higher power electronic losses. Thanks to the high efficiency level of the silicon carbide (SiC)-power electronics used, this effect is not very pronounced. The higher the speed and number of pole pairs, the smaller the gradient of the mass becomes. This leads to a rather conservative compromise in the selected speed of 6,000 RPM and number of pole pairs of 10, resulting in a power-to-weight ratio of 11.0 kW/kg for the motor. In 2019, Siemens AG built a 2 MW machine prototype for airborne application with 261 kg mass and a speed of 6,500 RPM (Anton, 2019), yielding a power-to-weight ratio of 7.7 kW/kg. Integral Powertrain Ltd considers a peak power density of 45 kW/kg to be feasible with high-speed machines (Integral Powertrain Ltd, 2020). Nevertheless, further research and development are needed to achieve the anticipated value for a certified machine in 2035. The high power-to-weight ratio of the projected motor might be achieved by increasing the active length to air gap diameter ratio and, with it, viable motor speeds.
Figure 10.
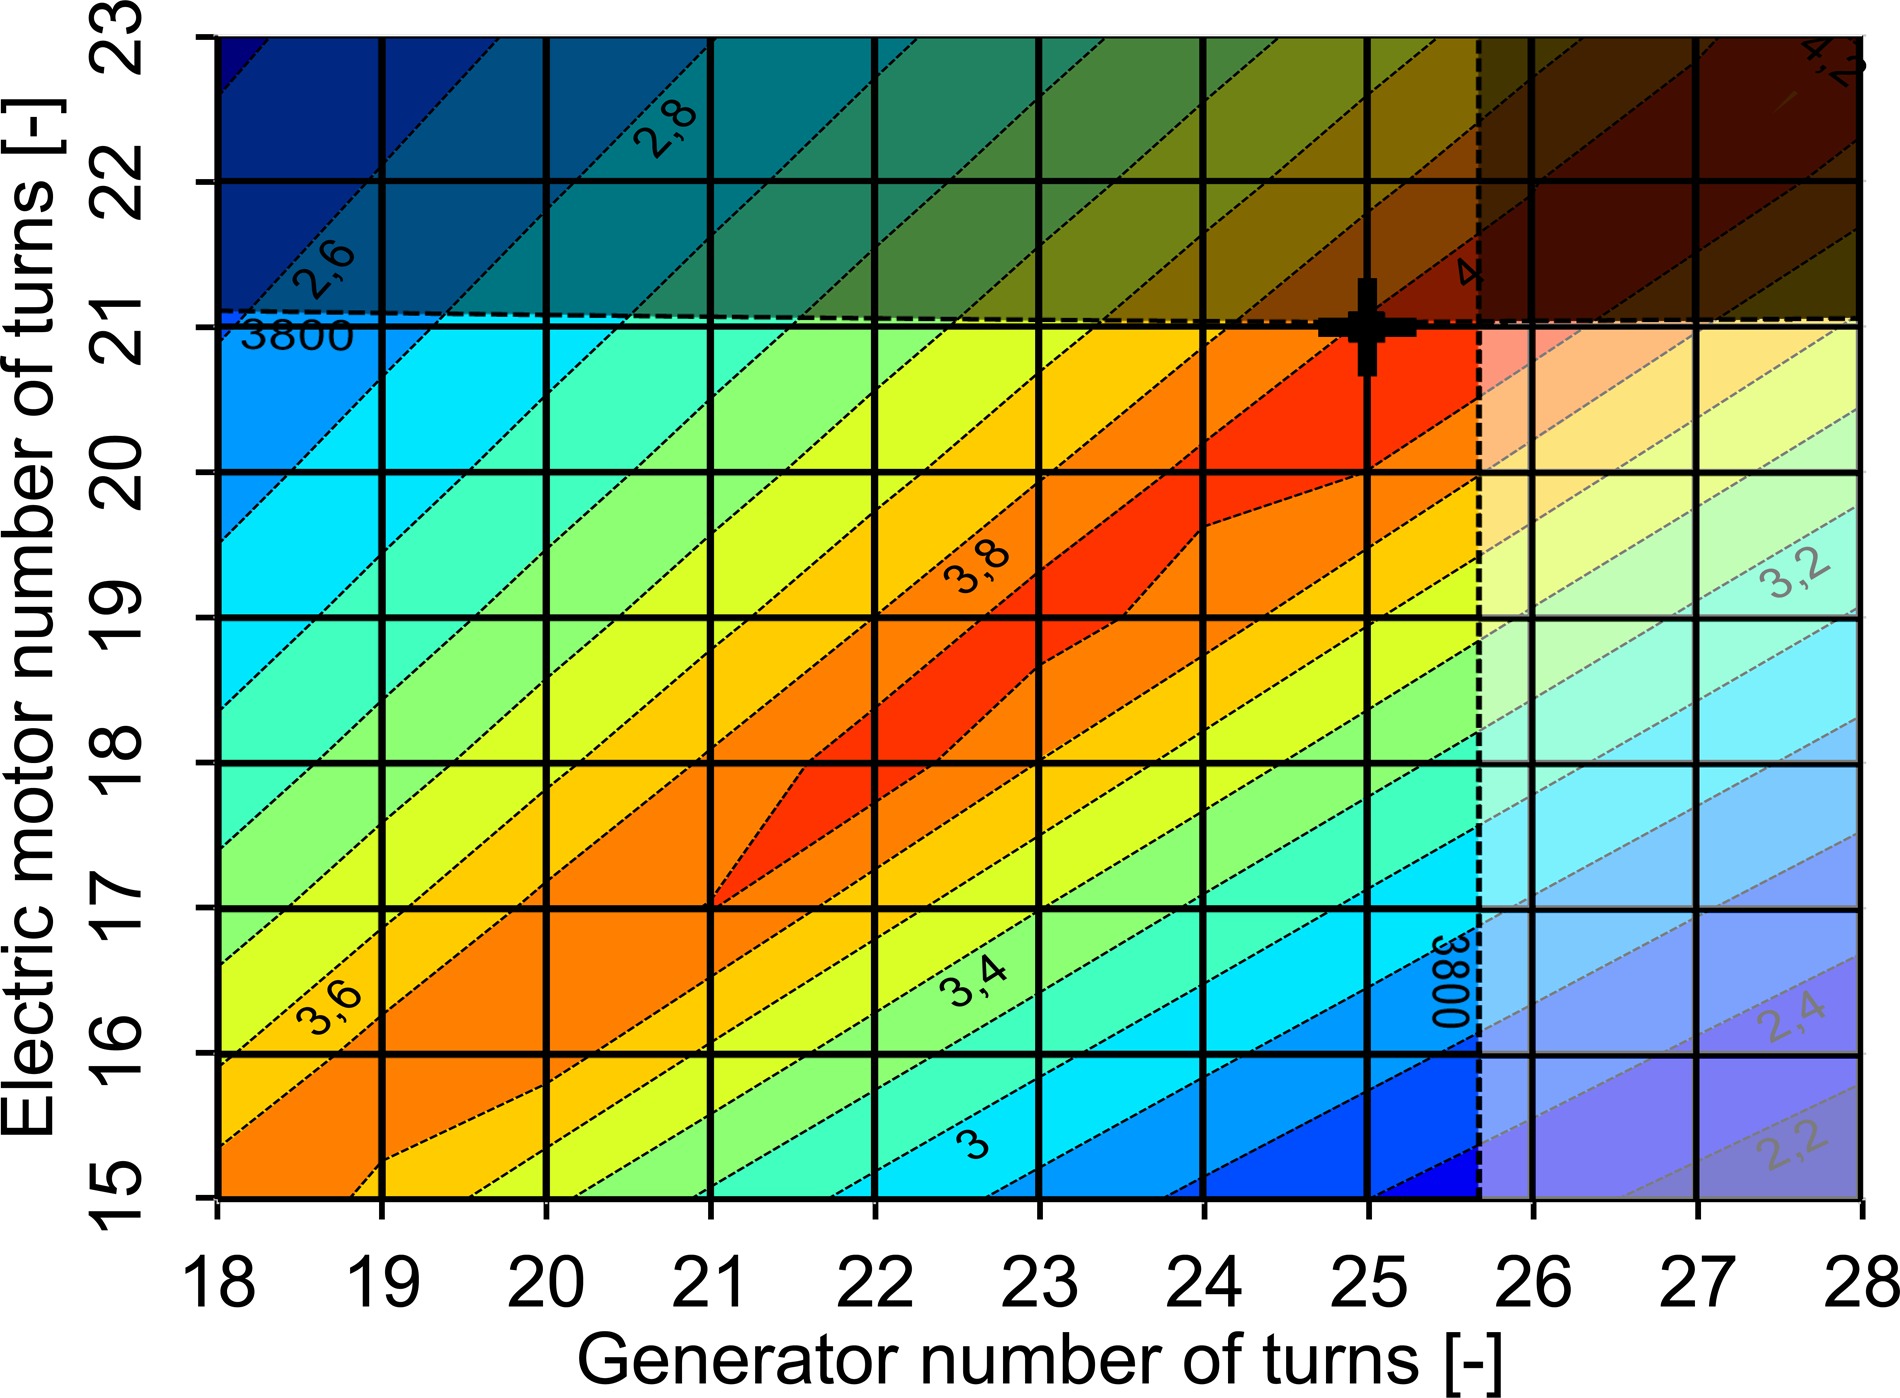
Combined power density of the electric system and the gearbox [kW/kg] as a function of the rotational speed and the number of pole pairs of the electric motor (SP = 30%, DC voltage at inverter inlet and motor efficiency remaining constant).
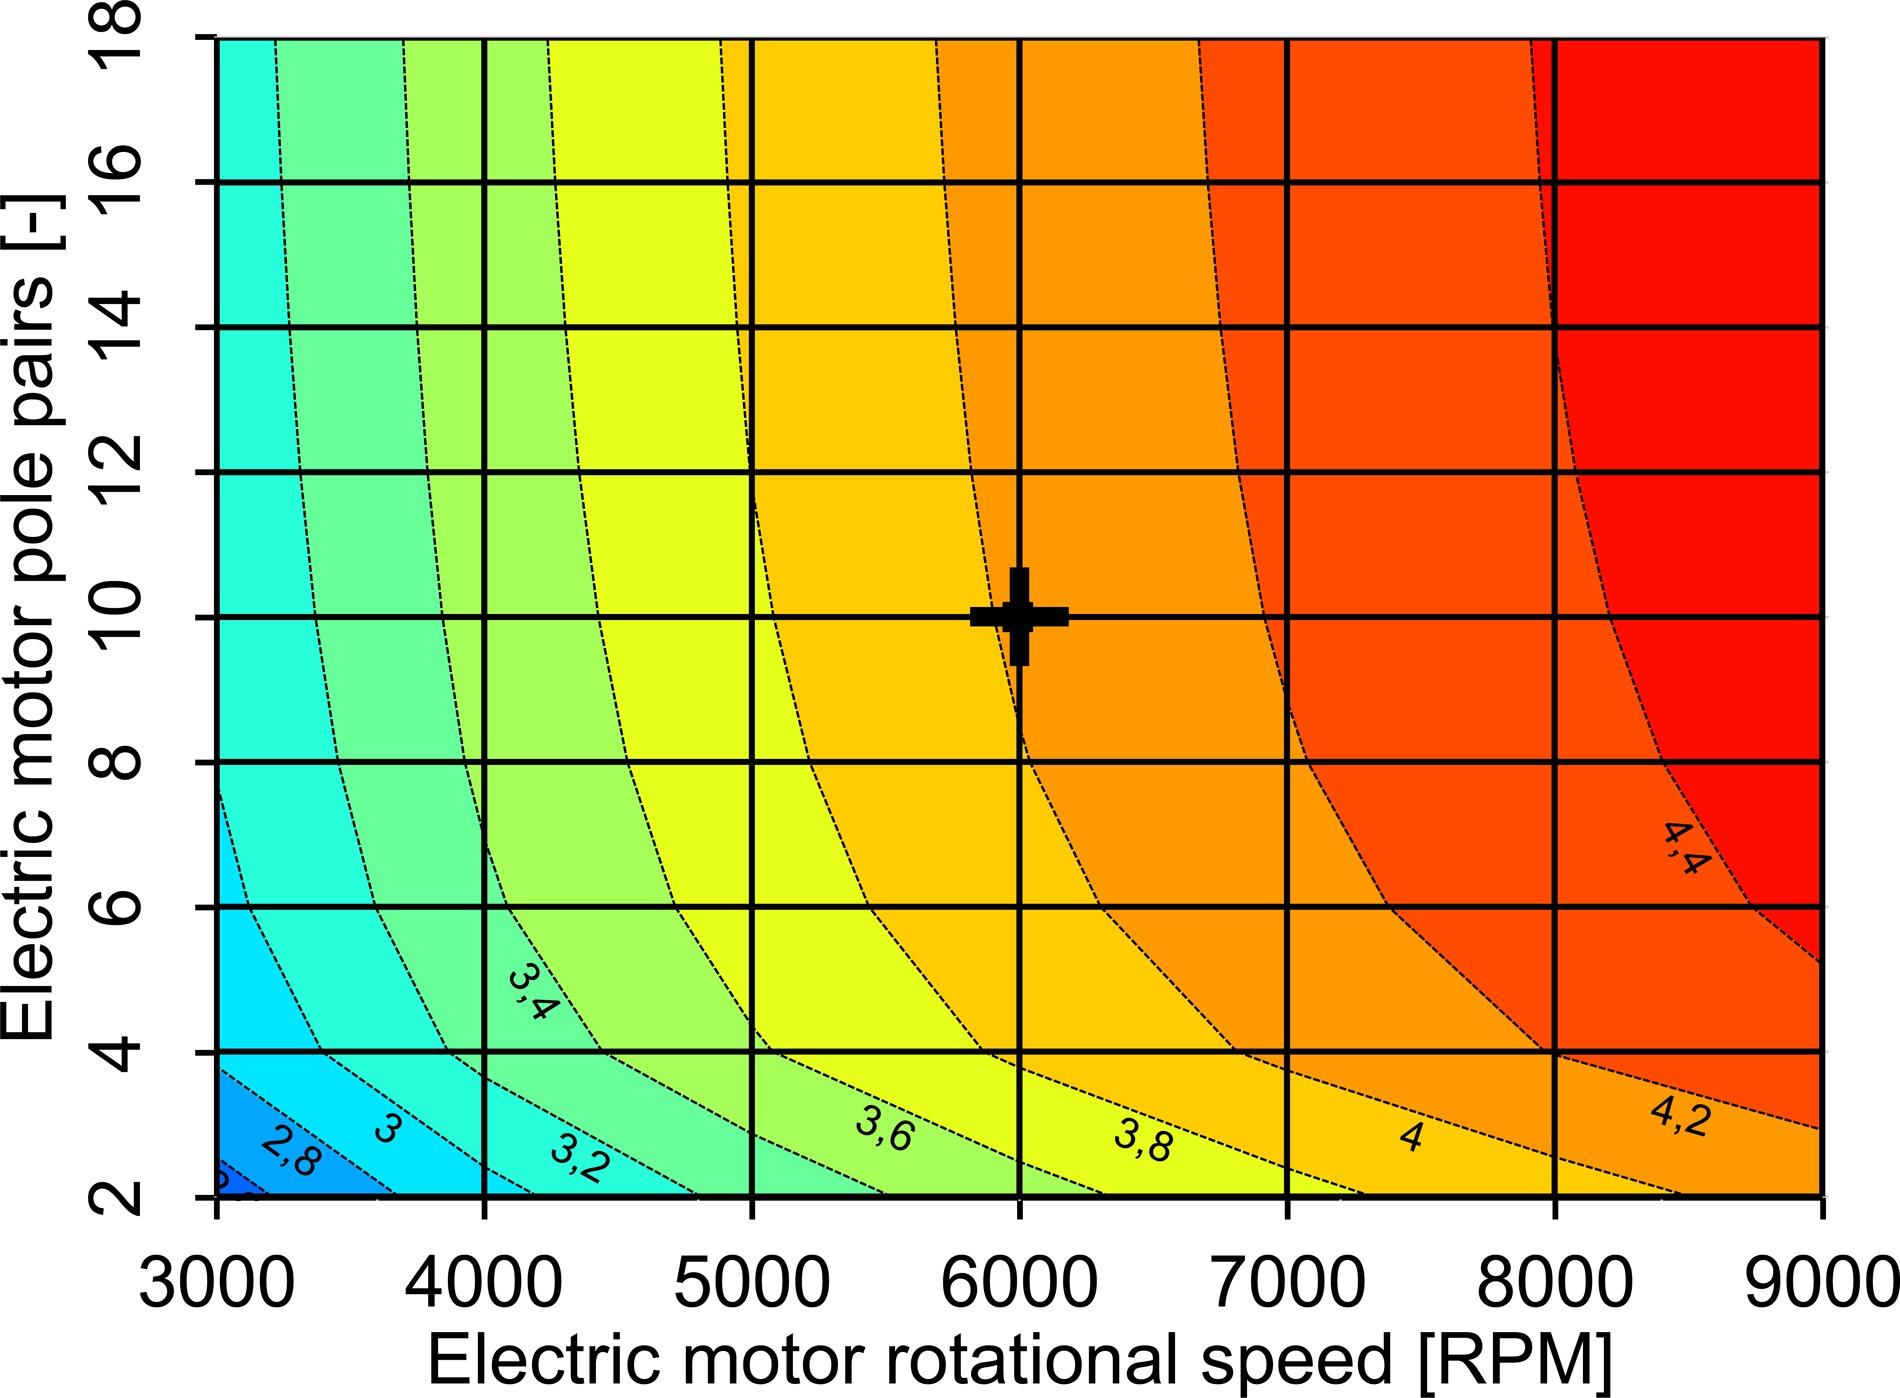
Figure 11.
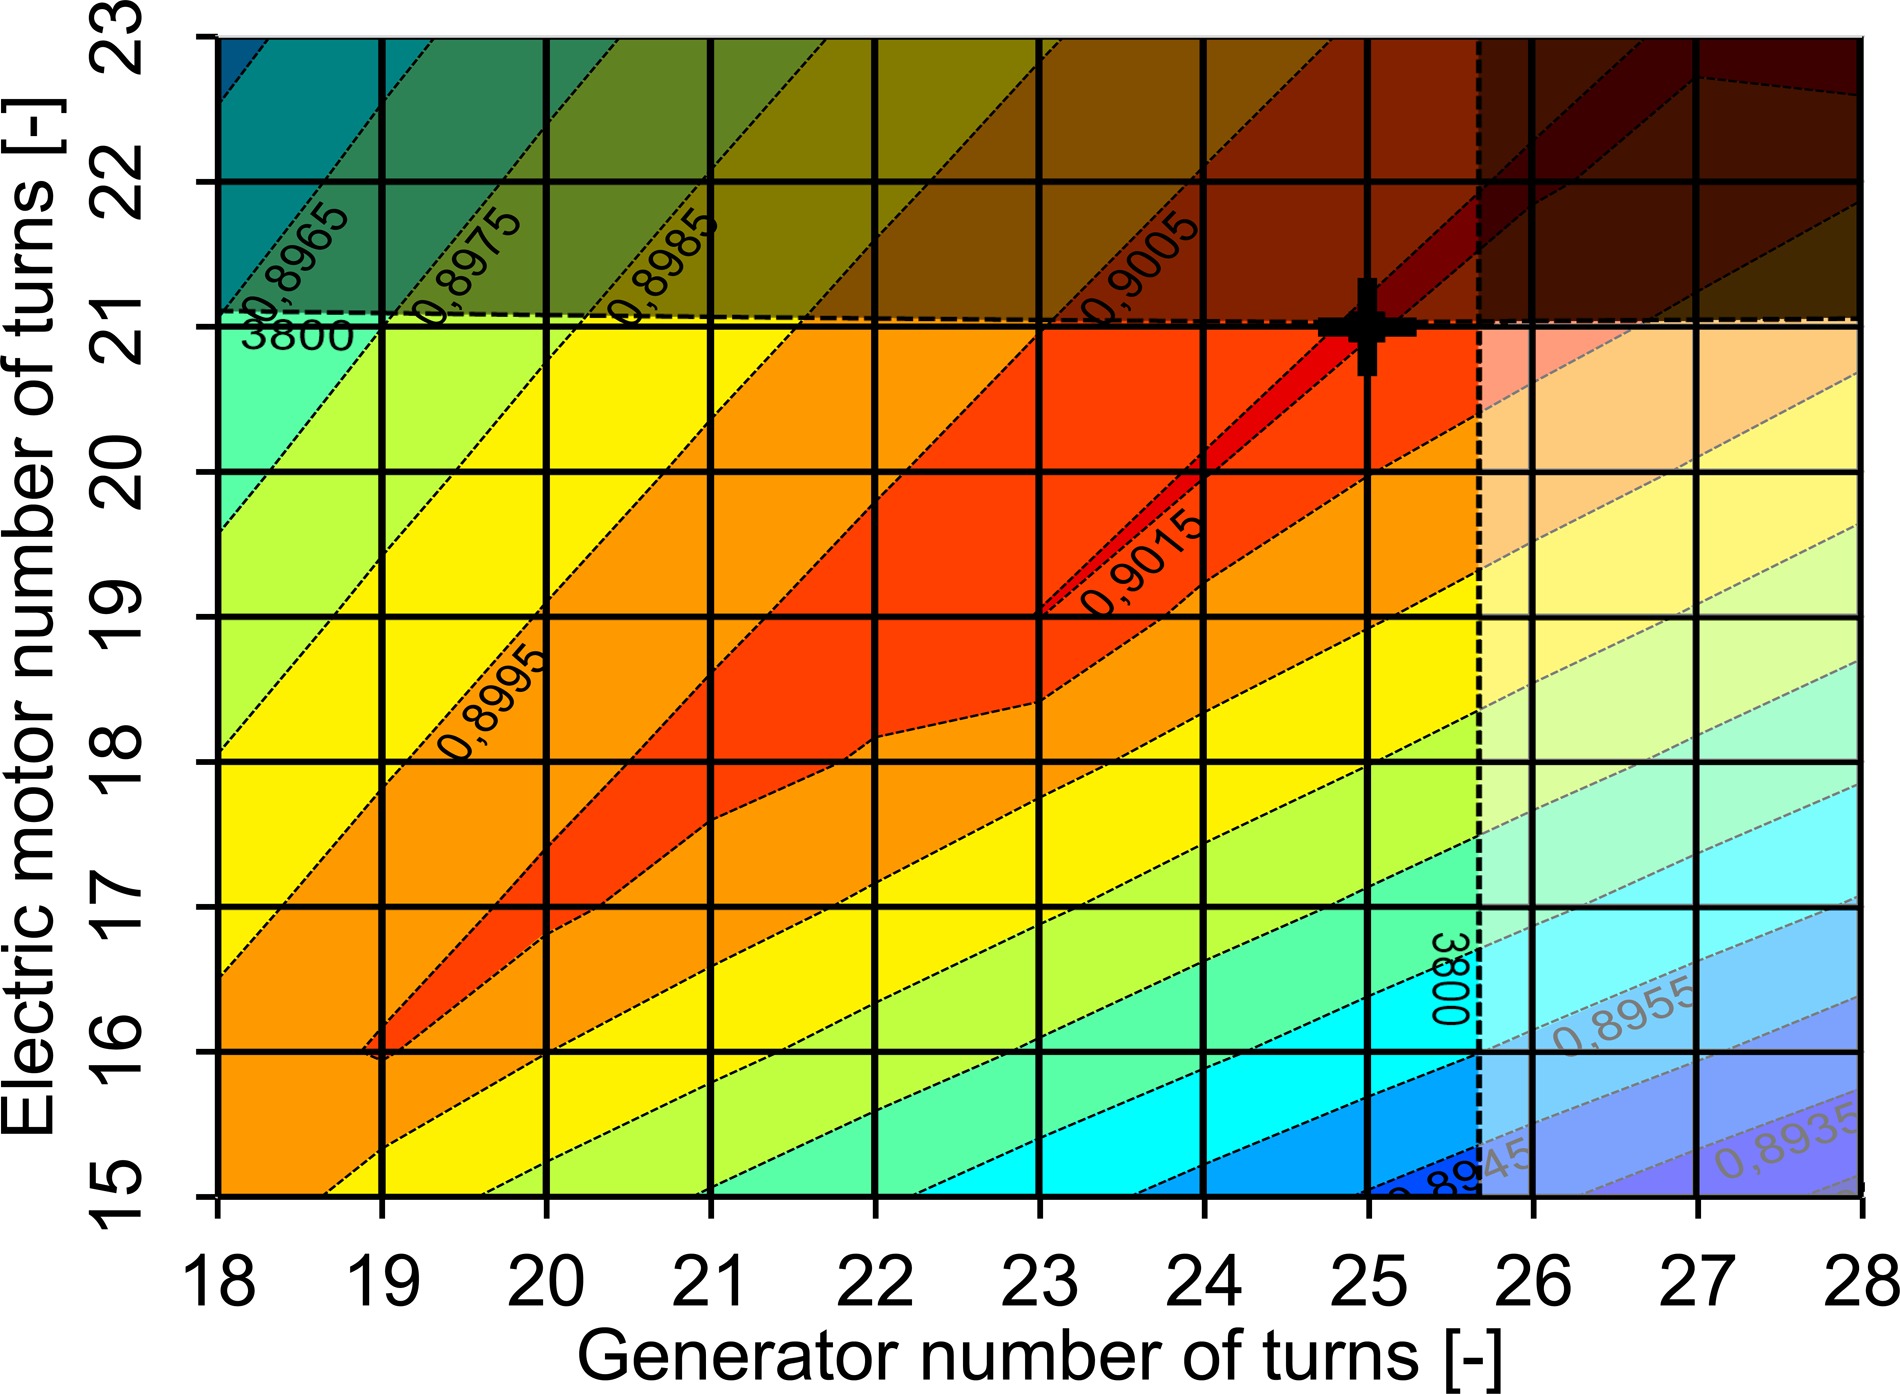
Electric system transmission efficiency as a function of the rotational speed and the number of pole pairs of the electric motor (SP = 30%, DC voltage at inverter inlet and motor efficiency remaining constant).

The second study concerns the system voltage level. The generator output voltage depends on the parameters in Table 4, as well as the generator's number of turns in the winding. In a single-tooth winding, the individual teeth of the stator of the electric machine are wound into a coil using an insulated wire. The number of turns in the coils of electrical machines can be used to adjust the system voltage without changing other machine design parameters. This also applies to a distributed winding. Regarding the number of turns, there is an optimum ratio between the generator and the motor. This can be seen in Figure 12, where the combined power density of the electric system and the propeller gearbox is plotted over the number of turns in the machines. The ratio is optimal when the DC-DC converter has to adjust the voltage between the generator section and the motor section of the electric powertrain as little as possible. This is advantageous, both in terms of system mass and electrical transmission efficiency, see Figure 13, so that the two optima coincide. In principle, a high voltage is beneficial with regard to the system mass. However, according to Wortmann (2018) at approximately 4,000 V the insulation effort is starting to drastically increase. This also affects the cooling of the electric machines and power electronics. Therefore, the maximum permissible DC voltage was limited to 3,800 V for the preliminary design.
Power electronics and DC cable
For the power electronics, SiC-semiconductor devices are assumed, since they cause significantly lower losses than purely silicon-based semiconductor devices. Therefore, each power switch is an SiC-based metal-oxide–semiconductor field-effect transistor (MOSFET). As an example, which also covers the other power electronics components, the key design parameters of the DC-DC converter are shown in Table 5. The semiconductor device parameters, such as maximum voltage, maximum current, energy losses and resistances, are chosen according to a Wolfspeed 1,200 V, 425 A, Half-Bridge Module (Cree Inc., 2020).
Table 5.
DC-DC converter key design parameters.
The same MOSFETs and diodes are used in the inverter. For the inverter, the frequency sampling factor, which describes the ratio of switching frequency and electric frequency is important. A value of 15 is applied for the sampling factor. For the rectifier, only diodes and for the power controller, only MOSFETs are needed. The total masses of the components depend on several additional parts of the component, e.g., the housing. The component mass modeling is calibrated to the Siemens SD104 inverter, which uses a micro channel cooling plate (Siemens, 2018). Studies for the power electronics, e.g., in respect of the optimum switching frequency of the DC-DC converter, are carried out. Their results are used in the component design and system optimization. For the sake of brevity, studies relating to power electronics for propulsion purposes will be released in future publications.
For the DC cable, a direct connection of the inverter close to the wingtip propeller and the DC-DC converter near the advanced turboprop on each wing is projected. This results in a cable length of approximately 10 m. For handling the failure of a single gas turbine (one engine inoperative) an electric cross feed, connecting the advanced turboprop to the wingtip propeller on the other wing, would be advantageous. However, cross feed was outside the scope of this paper and therefore was not investigated.
Comparison of the baseline and the partial turboelectric aircraft
Having completed the preliminary design studies of the propulsion system, corresponding studies of the aircraft—incorporating the propulsion system designs—were carried out. This section presents the relationships between the propulsion system and the associated effects on the aircraft and vice versa.
The unique design feature of the partial turboelectric propulsion system is the utilization of wingtip propellers, which reduce the aircraft's induced drag and consequently the power required from the propulsion system. To illustrate the influence of the wingtip propellers, Figure 14 shows the different partial turboelectric propulsion system thrust components
Figure 14.
Thrusts of the propulsion system components normalized to the baseline aircraft at top of climb for different S P
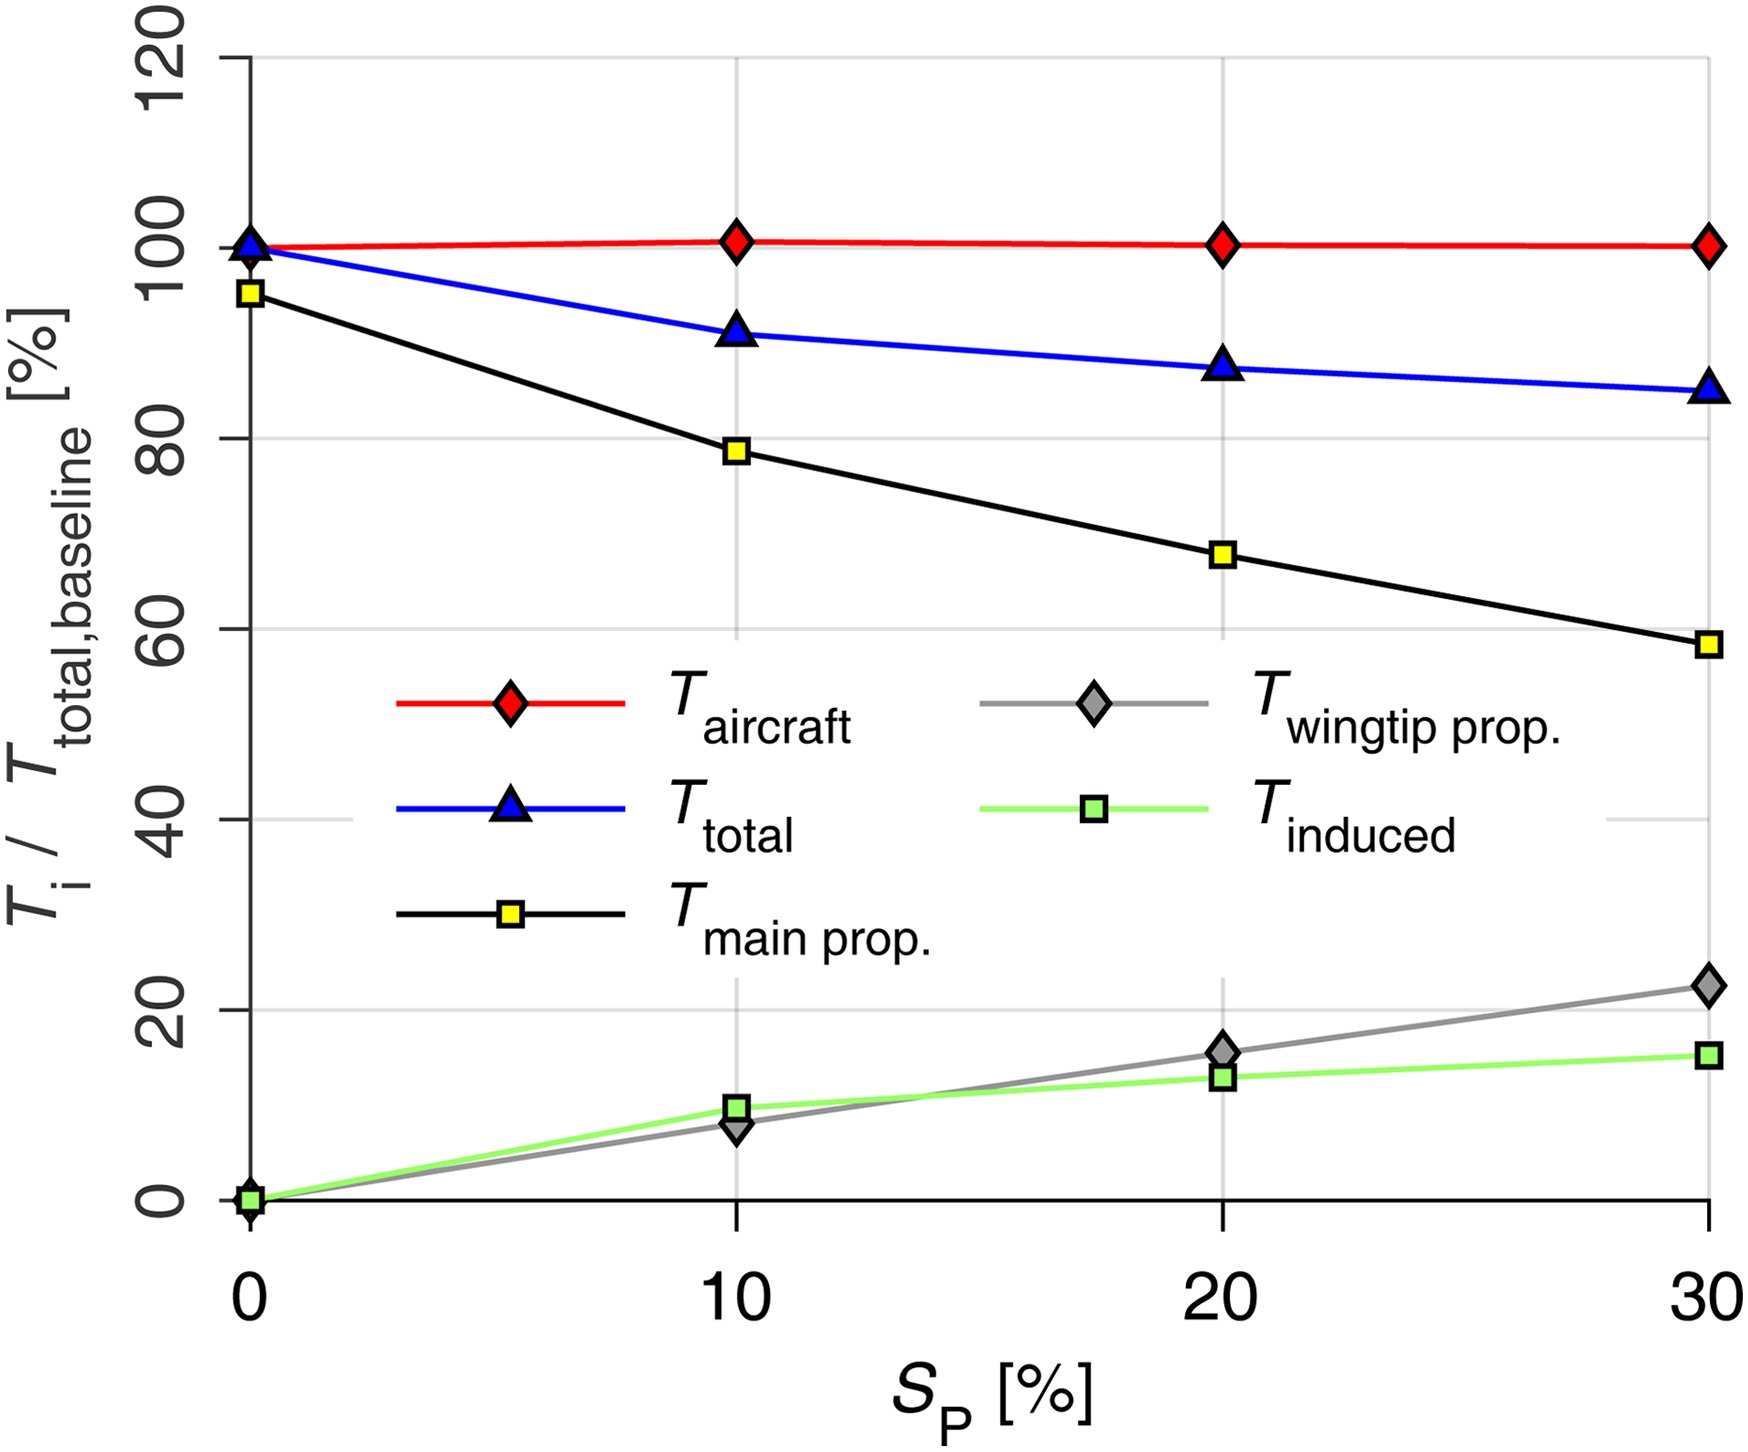
Figure 15 visualizes the masses of the partial turboelectric propulsion system components
Figure 15.
P total S P
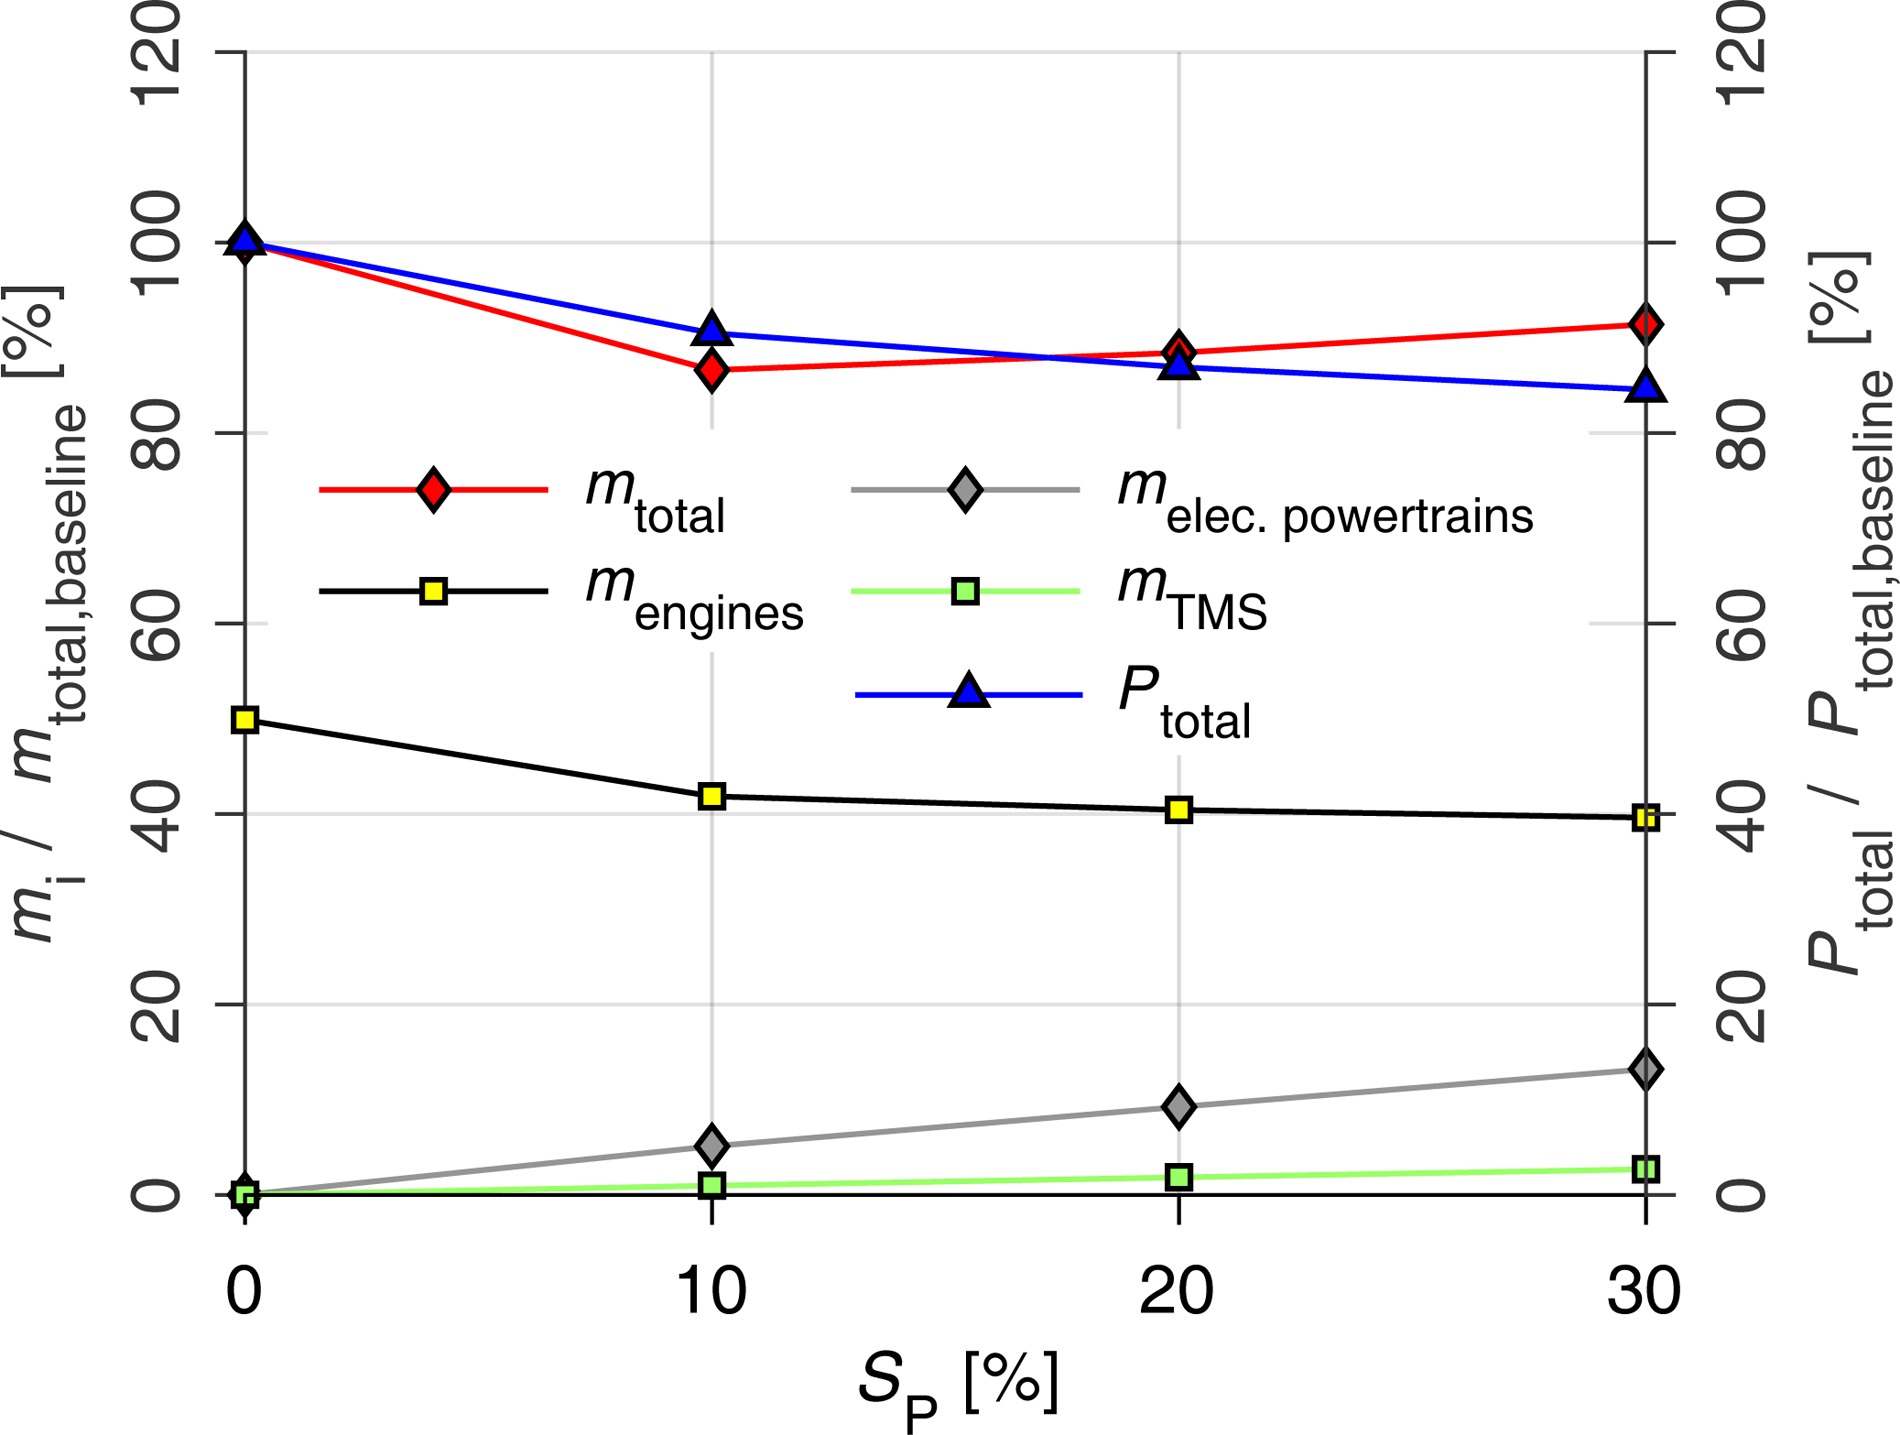
Table 6 describes the aircraft-integrated partial turboelectric propulsion system design and concludes the propulsion-system-focused investigation in this section. When comparing the partial turboelectric system designs shown in Table 3 with the actual designs resulting from the aircraft integration shown in Table 6, it is noticeable that the values of
Table 6.
Shaft powers and PSF C total
| SP | ||||
|---|---|---|---|---|
| % | kW | kW | kW | kg/kWh |
| 0 | 4,150 | 0 | 4,150 | 0.1859 |
| 10 | 3,379 | 375 | 3,755 | 0.1885 |
| 20 | 2,885 | 721 | 3,607 | 0.1908 |
| 30 | 2,456 | 1053 | 3,509 | 0.1930 |
Figure 16 provides more insight into the overall aircraft design parameters. The changes in the operating empty mass (OEM), the maximum takeoff mass (MTOM), and the block fuel mass
Figure 16.
Masses of the partial turboelectric aircraft normalized to the baseline aircraft for different S P
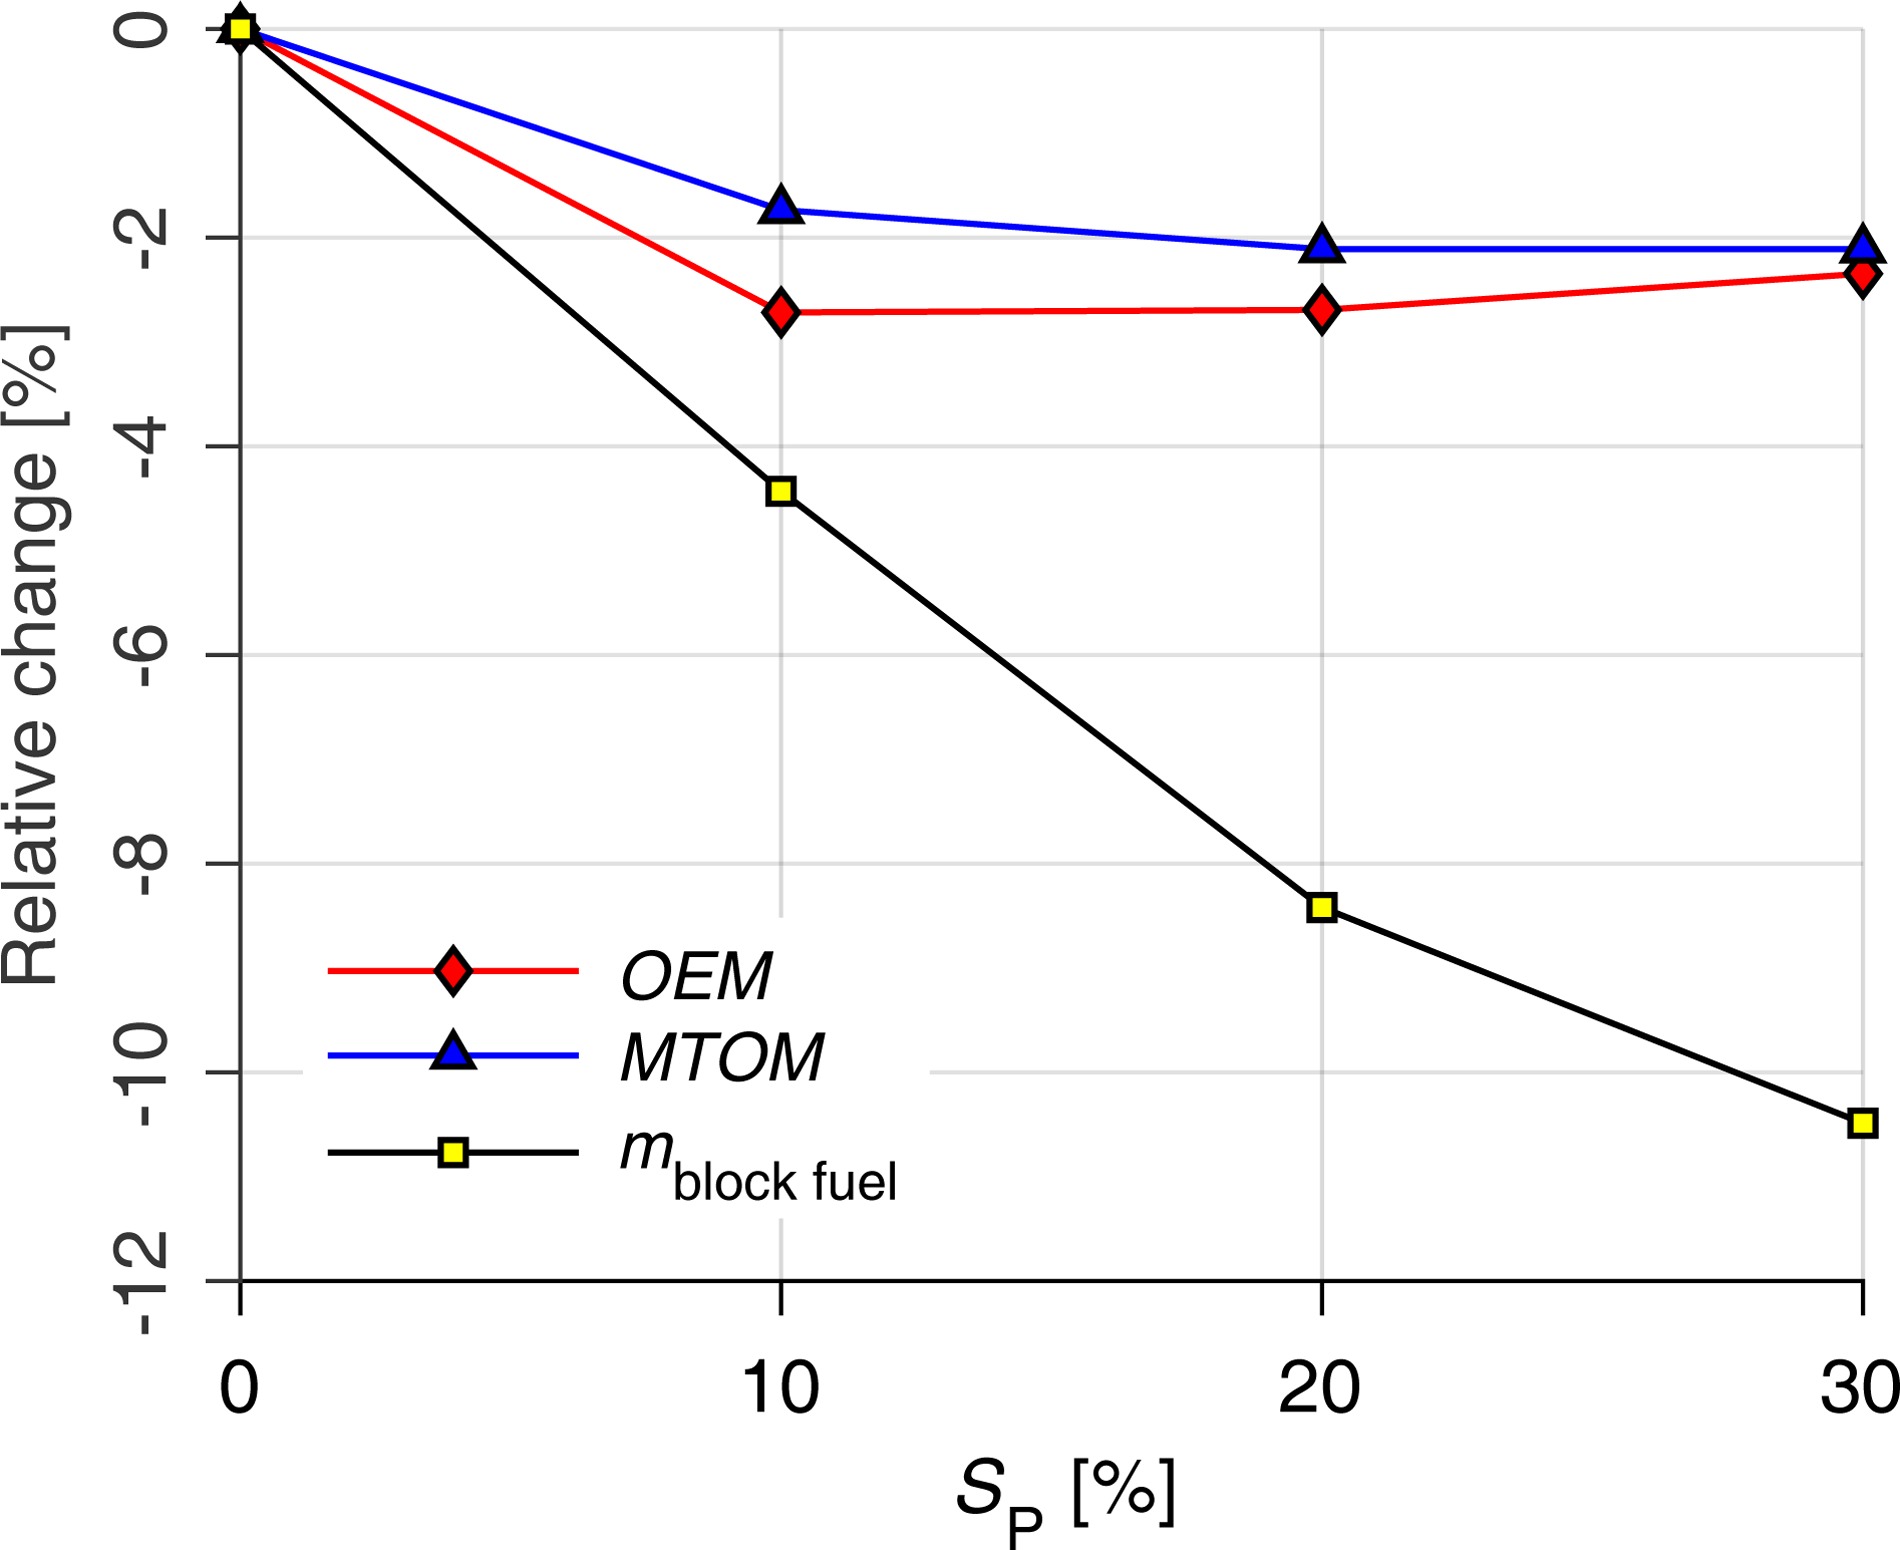
At SP = 20%, OEM is not decreasing any more. This is the result of two opposing effects. On the one hand, the comparatively small additional reduction in MTOM by just 0.4%, which in combination with the decrease in
Finally, at SP = 30%, OEM is 2.3% lower than the baseline aircraft's OEM. This increase in OEM, compared to SP = 20%, originates from an increasing
From the observations described in the previous paragraphs, several conclusions can be drawn. Most importantly, the advantage of the partial turboelectric propulsion system observed in the aircraft-integration relies on the aerodynamic benefit created due to the utilization of the wingtip propellers. These propulsors provide a growing amount of induced thrust for increased
Conclusions and outlook
This paper presents a novel preliminary design and evaluation tool for partial turboelectric propulsion systems and a case study for a commercial single-aisle turboprop aircraft. The included parametric studies of the electric powertrain illustrate that the design efficiency of the optimized electric powertrain is approximately constant and depends primarily on the efficiencies of the electric machines. The electric powertrain mass shows a more or less linear increase with its design power. Nevertheless, several effects, e.g., related to cable insulation, lead to a certain deviation. This, in turn, results in rising power-to-weight ratios at increasing electric system powers. By only taking the isolated propulsion system into account, the electrification does not lead to any benefits in respect of
However, the results change when the partial turboelectric propulsion system is assessed at aircraft level. As part of the associated aircraft comparison, electrifying a turboprop aircraft by using turboelectrically driven wingtip propellers was found to be beneficial with regard to the block fuel consumption. The wingtip propellers add induced thrust to the overall system and thus reduce the power demand on the partial turboelectric propulsion system. The lowest block fuel consumption was found at the maximum
Furthermore, several additional aspects of the partial turboelectric propulsion system modeling can be studied. Regarding the operation of the wingtip propellers, alternative operational strategies should be studied and compared. Maximizing the power of the wingtip propellers and the induced thrust generation throughout the whole flight envelope, by implementing more complex operating strategies, could also lead to a further reduction in block fuel consumption. Additionally, more sophisticated insulation modeling, especially for power electronics, could be included. This would probably also affect the optimum number of turns in the electric machines. These and other aspects will form part of further development of the tool and will be the subject of future publications.
In summary, the goal to develop a novel preliminary design tool and evaluation for partial turboelectric aircraft propulsion systems has been achieved. The case study has shown that a holistic evaluation of the aircraft, its propulsion system and the entire mission is necessary to evaluate the impact of electrification.
Nomenclature
Abbreviations
AC
alternating current
DC
direct current
HPC
high-pressure compressor
HPT
high-pressure turbine
IPC
intermediate-pressure compressor
IPT
intermediate-pressure turbine
ISA
international standard atmosphere
LPT
low-pressure turbine
MOSFET
metal-oxide-semiconductor field-effect transistor
MTOM
maximum takeoff mass
OEM
operating empty mass
PMSM
permanent magnet synchronous machine
SiC
silicon carbide
TLARs
top-level aircraft requirements
TMS
thermal management system
TOC
top of climb