
Introduction
Sand production is a challenge in oil wells worldwide, and reducing the amount of produced sand is a key priority for the operators. As the sand will follow the well stream until it arrives at the first stage separator, all equipment in the production string needs to account for wear and tear due to sand. Mitigating actions are applied in critical components such as chokes and rotating machinery, either by careful material selection or by optimizing the fluid flow through the component.
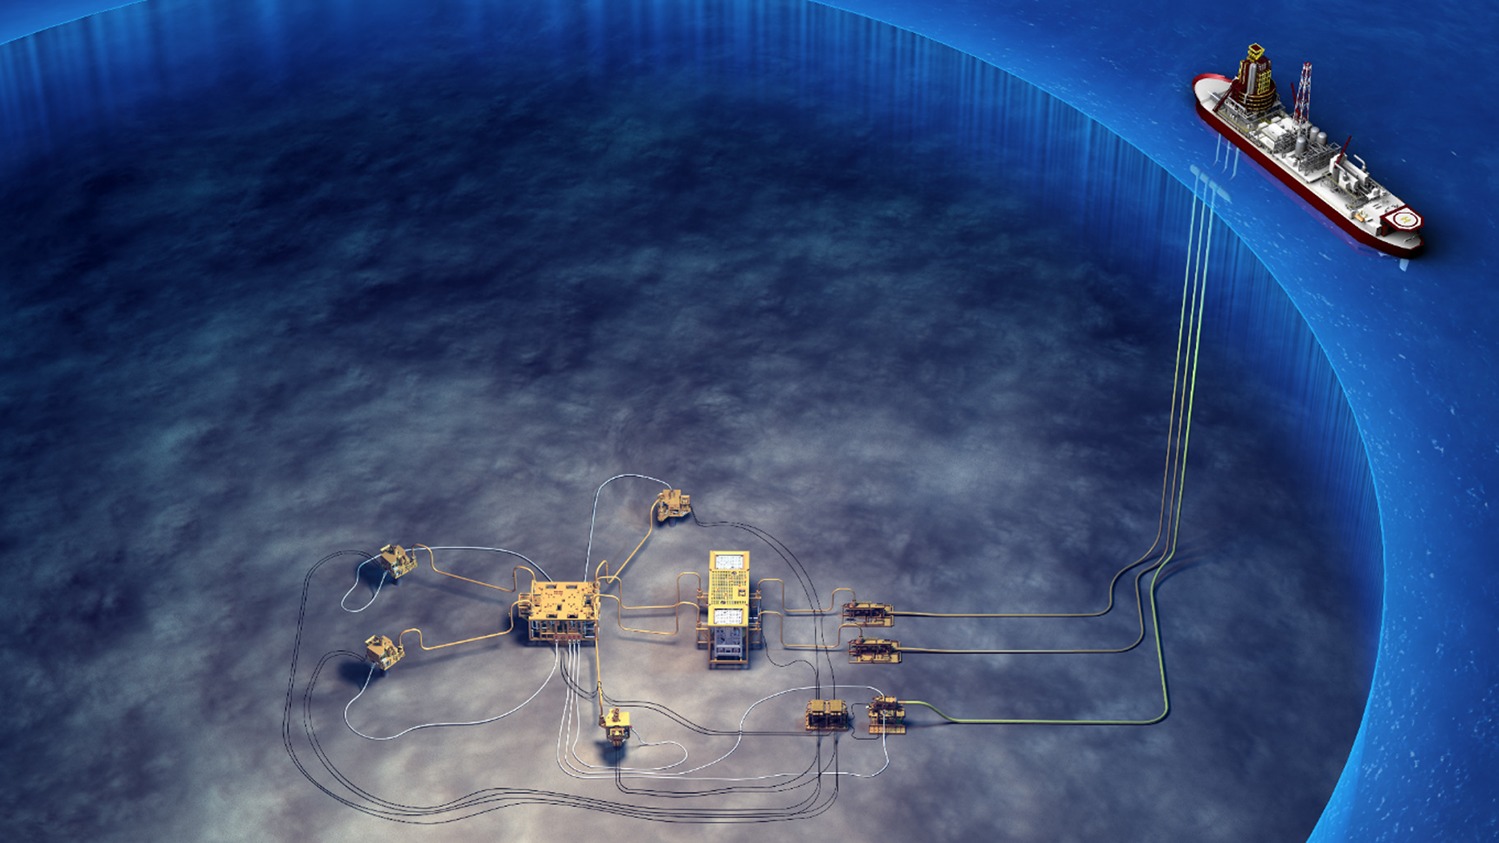
For subsea oil and gas fields, sand production becomes even more critical, as opportunities for corrective maintenance and intervention are limited. A typical subsea production network is shown in Figure 1. This system contains wells connected to a central manifold, a pump station, and dedicated flowlines and umbilicals between the topside host and the subsea equipment. In the pump station, one or more subsea pumps boosts the production by reducing the wellhead pressure (suction pressure) and increasing the flowline pressure (discharge pressure). If the well stream contains free gas, or if the pressure may be reduced below the bubble point pressure of the oil, MPPs must be applied.
For subsea pumps, where velocities are higher than elsewhere in the production string, it is crucial to understand the impact of the sand production throughout life of field. OneSubsea and TotalEnergies, as subsea pump system supplier and operator, respectively, have dealt with subsea pumps for decades, and consequently also with mitigating the impact of sand. The experience gained has changed design methodologies and increased the ability to predict and monitor the condition of a pump subjected to sand.
Sand management in subsea oil and gas fields
Sand (or solid) production affects the production system and the operation in several areas:
It increases the risk for erosion of the system and more specifically sand screens, pumps, valves, and elbows.
If rates are too low to transport the solids, these may accumulate in wells, pipelines, and vessels, creating flow restriction and the risk of plugging, corrosion under deposit, stagnant sand bed, and sudden sand surge.
Due to accumulation in vessels, solids generate upsets of the treatment system and reduce quality of produced water, which in turn challenges the disposal, or reinjection of this water.
With increased risks of erosion or corrosion and naturally occurring radionuclides, sand production is also a serious health, safety, and environment concern.
The first means to limit sand production is to assess reservoir properties, such as stress, cementation, sand grain sizes, and fluid viscosity, and adjust drilling, perforation, and completion accordingly. Oriented or selective perforations or adapted completions, such as standalone screen or openhole gravel pack, are known techniques to increase chances that the sand will stay in the reservoir. Completion involving deployment of screen, slotted liner, or resin to prevent sand migration into the wellbore are referred to as active sand control techniques (as opposed to passive sand control) and are widely used.
The second means is to operate wells with as little as possible stress induced on the reservoir rocks and completion. This is usually done with guidelines aiming at limiting ramp-up speed, flowrate, and drawdown or reservoir depletion. This can be applied on wells with no sand event recorded as a preventive method, but obviously accepting the production losses related to this strategy is easier for wells that have been through a sand event. The idea is then to avoid a new event and manage production with an acceptable sand rate (i.e., a sand rate that can be handled by the production system).
Sand production monitoring relies on
acoustic sand detectors (ASD)
erosion and corrosion probes
produced water quality and its desanding system monitoring
separation vessel monitoring for potential sand accumulation
multiphase flowmeter (due to its density, sand is counted as water)
Addressing the problem during the engineering of the wells is necessary. However, this may not be enough. Particles smaller than the completion threshold (fines typically) will still be produced, leading to a continuous sand production difficult to detect and stop. Transient flow in wells due to shut down or restart, but also any pressure variations transmitted to the wellbore, may destabilize the natural sand pack, causing a period of increased sand production (referred as a transient sand event). Continuous and transient sand production are both contributing to the erosion of the sand screen (or slotted liner), that will then slowly allow larger grains to go through. Ultimately this may lead to rupture of the screen (or slotted liner) and an accidental sand event. Since zero sand production cannot be achieved, the main challenge faced by operators is to control the baseline, the normal sand production rate, and identify sand events in time to limit their impact.
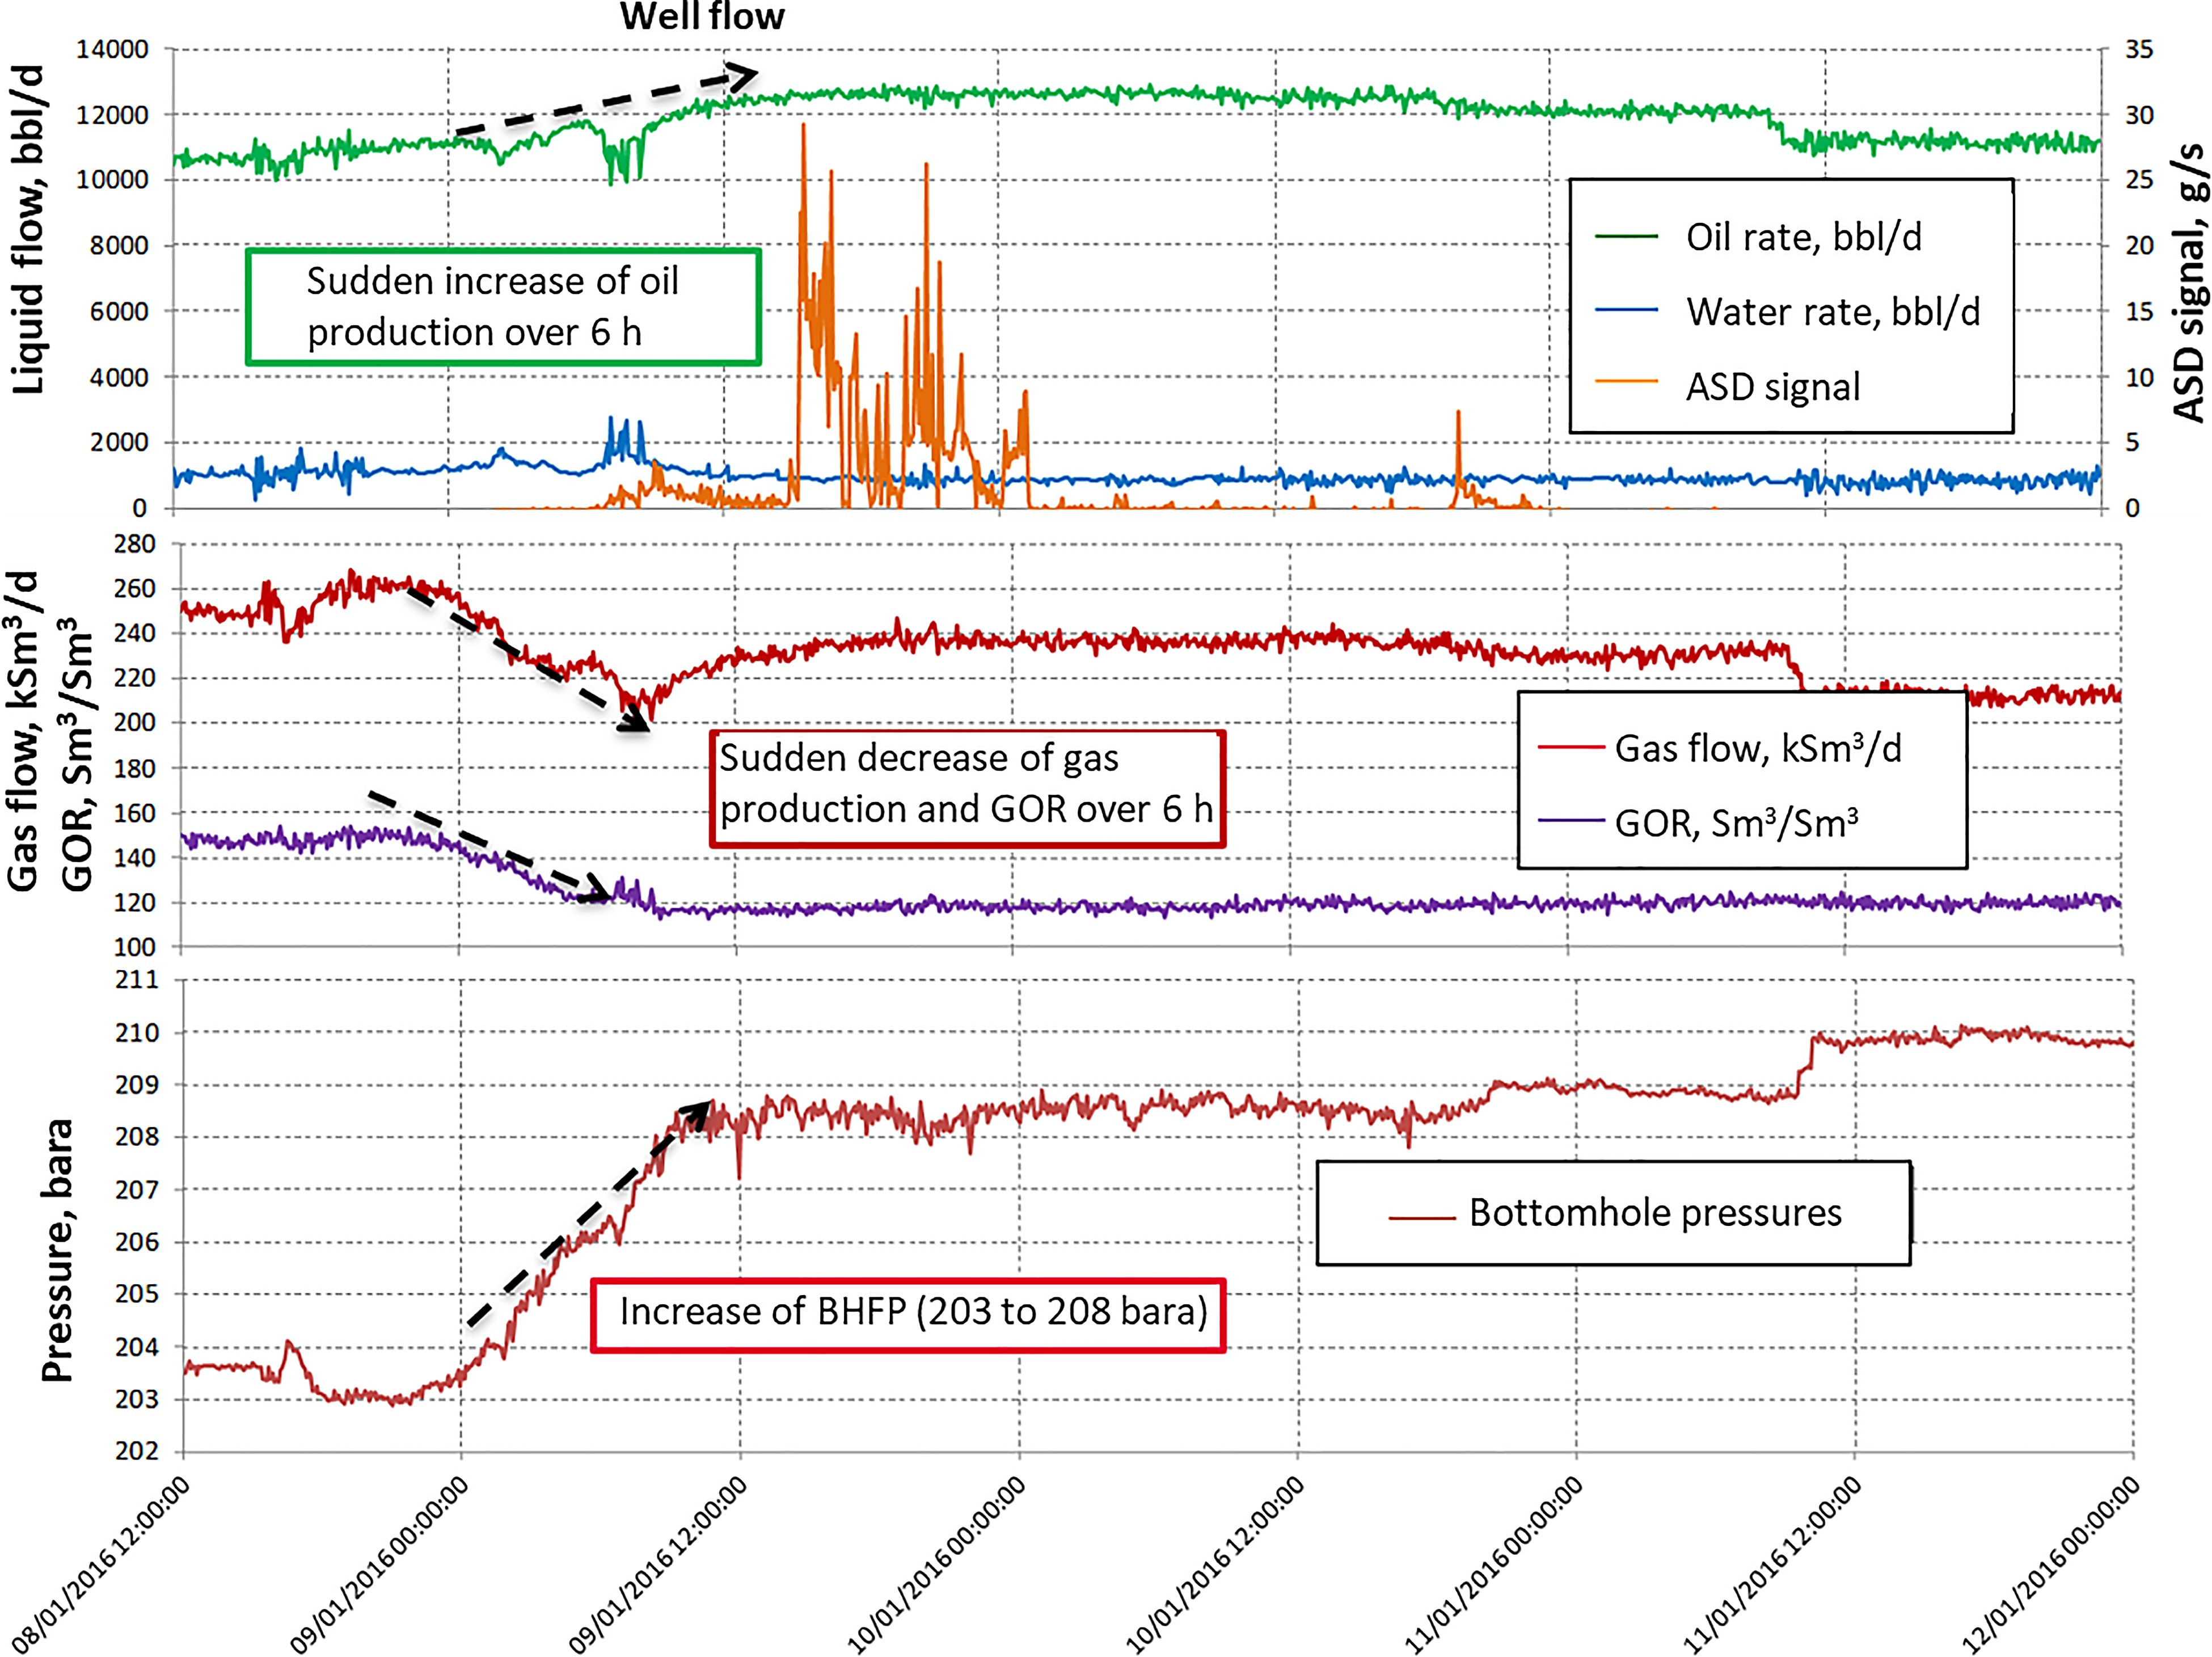
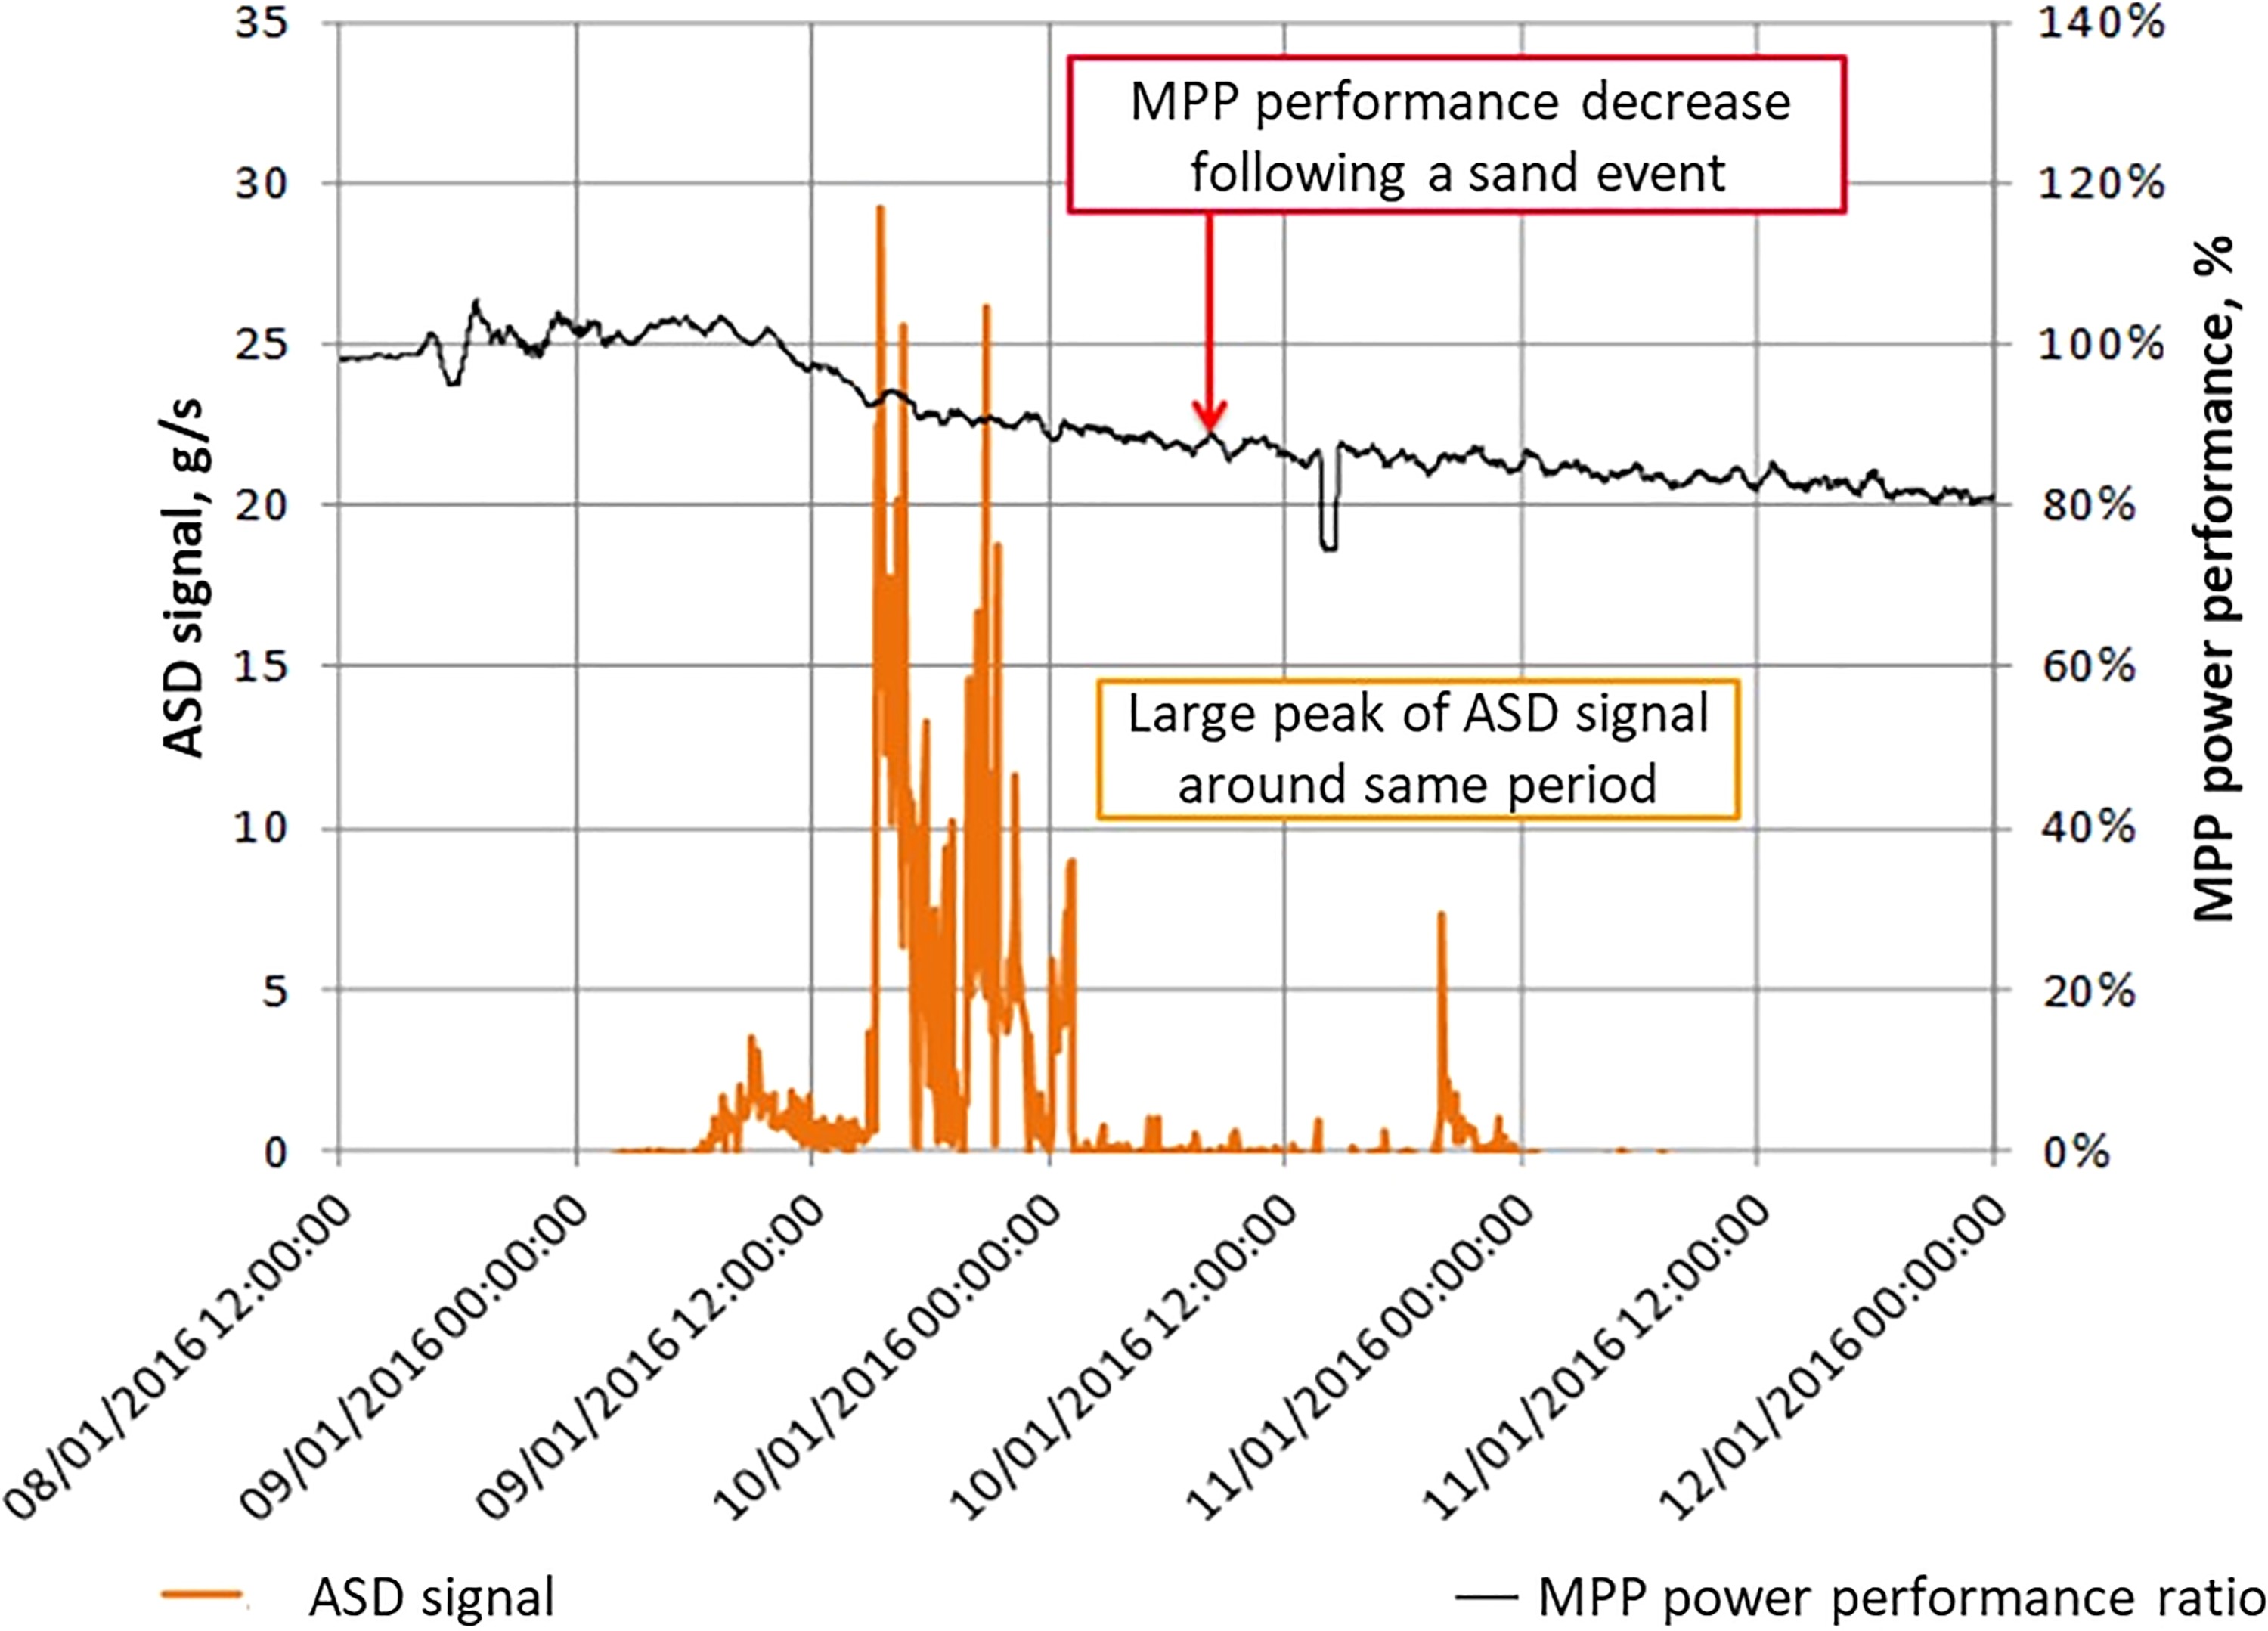
Today, with the progress of completion, monitoring, and production methods, sand production has been greatly decreased. Continuous sand production is now in the range of 2–10 mg/L and sand events are usually captured far before their cumulative production reaches hundreds of kilograms. However, a transient sand event can still occur and can have an immediate detrimental impact on a subsea pump performance. An example from a subsea pump exposed to a sand event is shown in Figures 2 and 3. When increasing the well flow, the gas oil ratio (GOR) decrease. The higher liquid rates result in a sudden increase in bottomhole flowing pressure (BHFP) which ultimately cause a temporary loss of the natural sand pack equilibrium. The MPP lost 20% performance during this event.
Sand handling in subsea pump systems
Subsea pumps are generally exposed to the full unprocessed well stream, including any sand particles produced over the lifetime of the equipment. This sand exposure may be a constant production of fines with the well stream, or potentially a higher sand concentration over a limited time caused by a sand screen failure, for example. Inevitably the pump performance will be impacted over time due to sand production and it is, therefore, critical to design the system to minimize this impact.
Two types of wear are typically relevant: (1) abrasive wear and (2) erosive wear. Abrasive wear typically occurs when solid particles are trapped in the clearance between two surfaces e.g., between rotating and stationary pump components. Abrasive wear is most prone to happen when the particles are in the same size range as the clearance and may occur up to a clearance two to three times the particle size. Erosive wear describes the impact of particles onto a surface. Repetitive impacts may gradually deform the surface as small amounts of material are removed over a time period. Erosion rate is strongly dependent on particle properties, such as hardness and size, the number of particles, velocity, and impingement angle on the eroded surface. In a typical MPP setup both abrasive and erosive wear are likely to occur.
Helico-axial MPPs
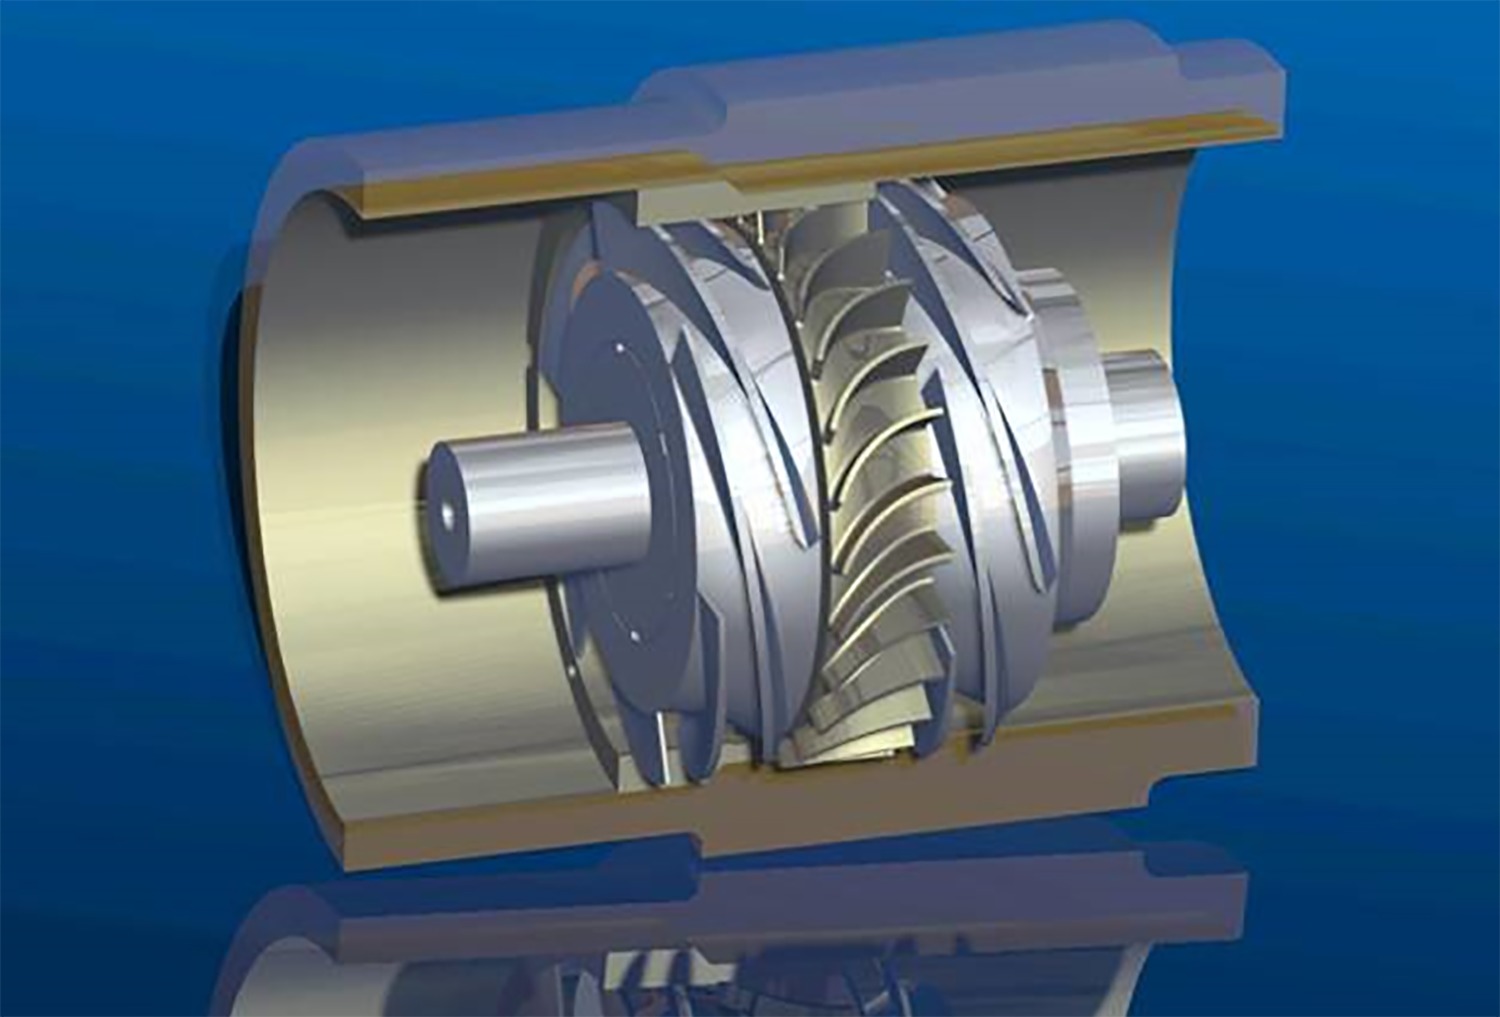
Helico-axial pump technology is the most widely deployed technology to date for seabed pumping of multiphase fluids. Helico-axial impellers and diffusers are designed to avoid phase separation by careful balancing of centrifugal and Coriolis forces within the impellers, and by the axial direction through the pump. Typical helico-axial impellers and diffuser are presented in Figure 4. The impellers are unshrouded, which means that a portion of the flow will go between the impeller tip and the static surface, from the pressure to the suction side of the impeller blade. Helico-axial pumps are sand tolerant by design due to large clearances relative to particle sizes and potential for coating critical components. Hence, the abrasive wear is less prominent in helico-axial design compared to displacement pump and twin-screw pump designs.
Particularly the rotating impellers in a helico-axial pump are subject to erosion due to high velocities. The impact angle between sand particles and the rotating impeller, for example, is directly impacting the erosion rate. This impact angle will vary with several parameters, such as the speed of the pump, the flow coefficient, and the impact location. The most significant erosion is observed on the leading edge of the impeller blades. Prudent material selection can partly remedy the impacts of sand particles in a pump.
Abrasive wear in clearances between rotating and stationary surfaces, e.g., in the balance piston, wear rings, and impeller tip clearance, will lead to increased gaps in these narrow passages, yielding lower volumetric efficiency and throughput. To address the challenges mentioned above, a number of improvements have been implemented on the subsea pumps based on significant operational experiences and qualification testing.
A cross-sectional schematic of an MPP indicating key components is given in Figure 5.
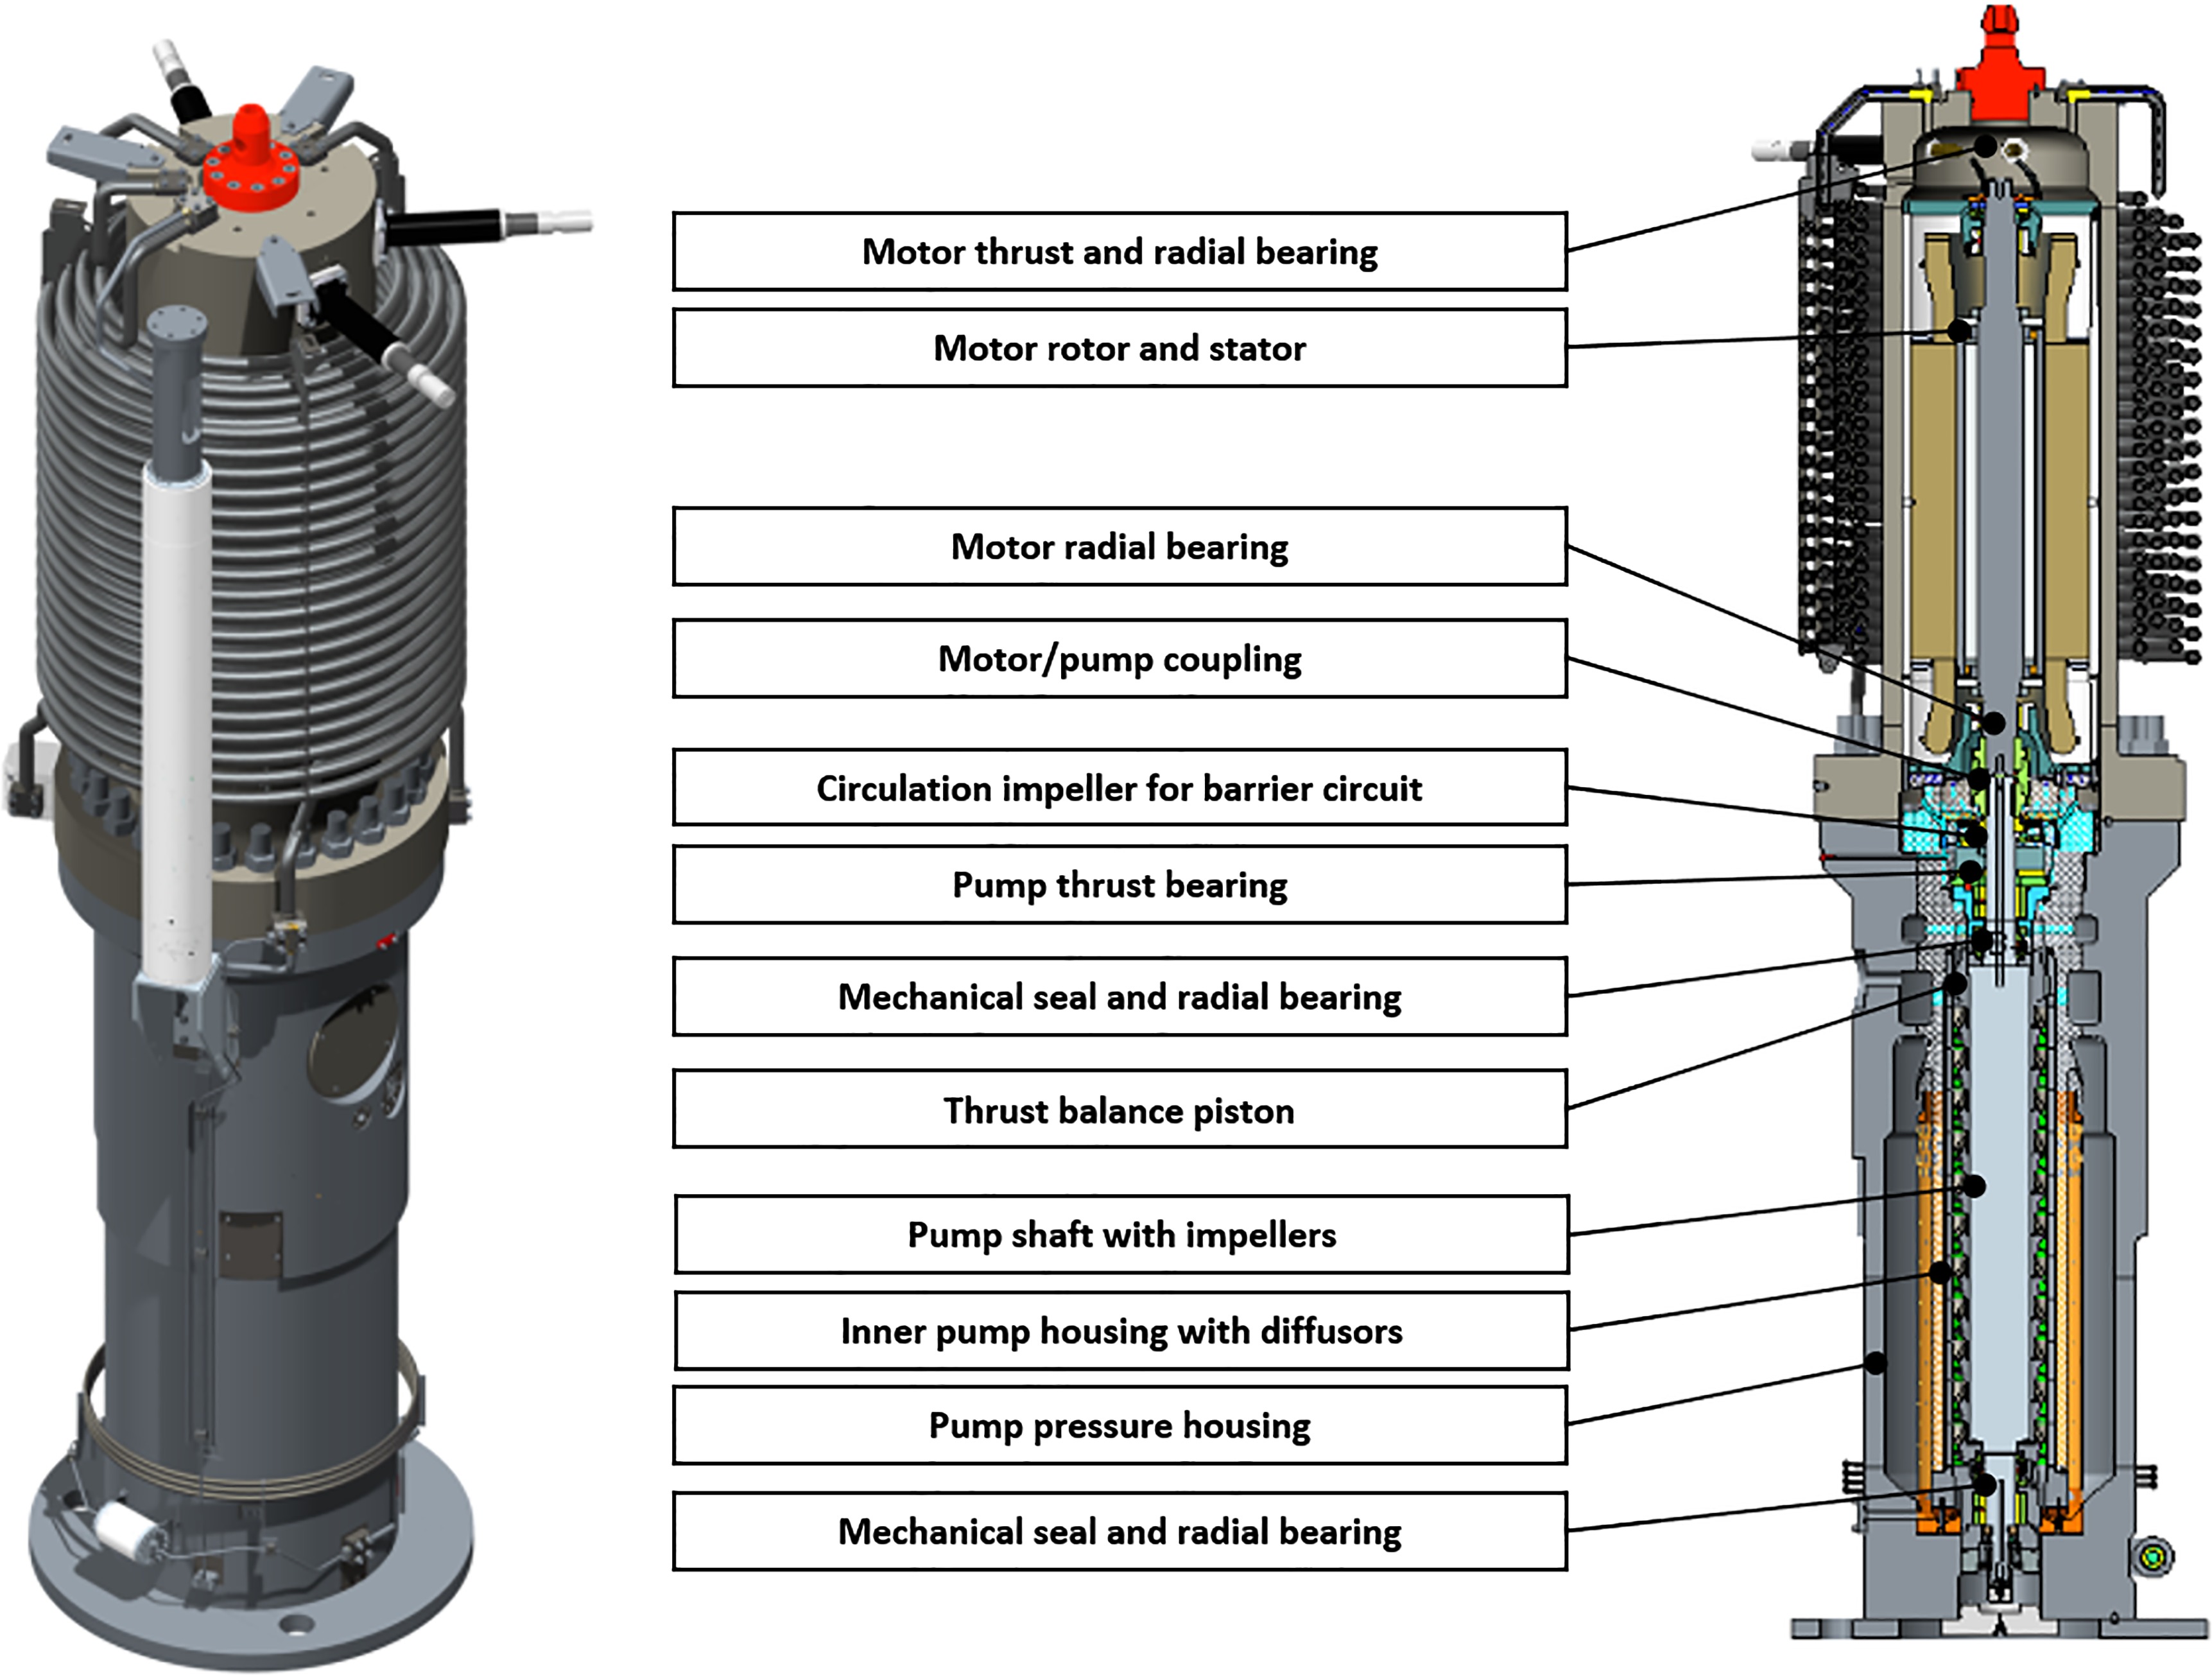
Oil submerged bearings and internally pressurized mechanical seals
A main feature of MPPs is the implementation of an overpressurized barrier fluid system to ensure that critical components are submerged in a clean barrier fluid oil. This implies that all bearings are continuously operating in a clean environment without impact from the sand concentration in the process fluid. A small intended leakage of barrier fluid from the motor section to the process cools and lubricates the mechanical seal surfaces, as well as eliminates ingress of sand particles to the motor volume.
Wear resistant materials
Materials of process wetted parts are carefully selected based on the expected wear rate due to presence of particles and fluid composition (e.g., sour fluid containing H2S). Normally, duplex stainless steel or super duplex stainless steel are used, but certain operating conditions have required tungsten carbide coating on impellers and diffusers. Further, wear rings and balance piston may be manufactured in tungsten carbide to reduce wear. Generally, the material selection for the subsea pump system follows the material selection of the production system, with the potential exceptions mentioned above.
Moderate operating speed
The dynamic pump generates a certain head per impeller stage for a given speed. To generate the required head the pump may be operated at a moderate speed with a number of impellers, or alternatively at a higher speed with a lower number of impellers. The impact velocity of a particle on a surface, is the single most dominating parameter affecting erosion. It is consequently of great interest to keep operating speed moderate to increase the lifetime of the equipment and reduce wear and tear.
MPP wear assessment
Pumps exposed to sand production will gradually reduce its throughput, head, and volumetric efficiency as the wear increases. A wear model used to predict this wear rate and performance degradation is further described in the subsequent sections of this paper. By use of continuous measurement of process parameters and pump operating conditions in the field, the actual performance can be compared to that of a nonworn pump. Further, applying the MPP wear model, wear levels can be calculated, and interventions may be planned for as the wear rate approaches nontolerable levels.
Wear experiments
Basis for pump design and wear model
In 1991–1993, DNVGL and partners conducted the Wear Resistance Program, initiated to acquire basic and practical knowledge about wear characteristics of materials exposed to degradation due to presence of sand in the well stream. The program covered experimental investigation of the erosion and abrasion characteristics of a total of 28 materials, including standard steel grades, coating, tungsten carbide materials, and ceramics. The experimental results were applied in empirical model equations, which showed that proper material selection could potentially increase the lifetime of equipment by a factor of up to 100 (Haugen et al., 1994). Although fabrication methods and material qualities have developed further since this program, the basic modeling is still valid and is adapted in later work, e.g., the oil and gas industry's recommended practice DNVGL RP O501.
In 1998, the French research institution IFPEN and pump manufacturers carried out a joint project to investigate erosion patterns and performance degradation of helico-axial MPPs exposed to the sand laden process. The test object was a six-stage pump with different material qualities. The results disclosed the most prominent wear occurring at the impeller leading edges. Signs of wear were also found at the impeller tip but to a much lesser extent. The findings added value to the existing models with its new information about wear rate and wear pattern in the complex flows inside a helico-axial pump. In addition, the first detailed experimental information about degradation of MPP performance due to sand wear was achieved.
A new wear test on a helico-axial MPP was conducted by OneSubsea in 2006–2007 (Table 1). The objectives of this test were (1) to evaluate materials and coating to be used in a subsea application with potentially severe sand issues and (2) to obtain new knowledge for further developing and validating a pump wear model. During this campaign, both a helico-axial MPP and a centrifugal single-phase pump (SPP) were investigated in separate tests. The test pumps were multistage pumps. The MPP was equipped with three duplex impellers, where the second stage was coated with tungsten carbide. (The SPP had impellers manufactured in solid tungsten carbide).
Table 1.
Data from OneSubsea wear test.
Testing was performed in an open loop where fresh and sharp quartz sand of 250 μm mean diameter was introduced upstream of the test pump and discharged immediately downstream, thereby securing accurate control of sand concentration and avoiding polishing sand particles as one would risk in a closed test loop. The process fluid was seawater.
The test program included 500 h at a sand concentration of 20 mg/L and 500 h at 500 mg/L. For the SPP additional 500 h of testing was performed with an extreme sand concentration of 2,000 mg/L. At certain intervals, the sand injection was stopped, and pump performance mapping was conducted. At two instances, the pumps were dismantled, and the process-exposed parts were measured. As expected due to the high impact velocities and impact angles, the MPP impeller leading-edge erosion was significant. The complex 3D flow pattern in the helico-axial stages resulted in a peculiar leading-edge wear pattern. Combining test results with computational fluid dynamics (CFD) simulations, substantial variations in particle impact angle along the leading edge of the impeller were identified. The erosive and abrasive wear pattern at the different impellers validated the modeled effect of tungsten carbide coating.
The pump performance degraded gradually through the duration of the wear test, but vibration levels and barrier fluid consumption were stable through the complete program. In total, the MPP was exposed to more than 27,500 kg (and the single-phase pump 276,000 kg) of fresh quartz sand during the test without any fatal incidents.
Other relevant research
Shirazi and his coworkers have conducted several experimental and analytical projects related to sand transport, erosion, and monitoring in the Tulsa University Sand Management Projects. Of particular interest is the evaluation of how characteristics of the carrier fluid affects erosion rates, exemplified by Okita et al. (2012). They found that viscosity of the carrier fluid significantly reduces the erosion rate of small and medium-sized particles. Since the experimental setup utilized by Okita does not completely apply to MPP conditions, the results should not be applied to the MPP erosion model without further validation.
Morrison et al. (2015, 2017) conducted a sand test to obtain experimental data on wear in electric submersible pumps (ESPs). Although the pump in this experiment had mixed flow impellers, the test is of value due to the similarities in process conditions in ESPs and MPPs. Morrison's experiments showed the largest wear in bearings and seals. Vibration measurements in the ESPs also showed increased orbit diameter as the bearing diameters increased.
Subsea multiphase pump wear model
The main objective of the wear model is to secure that necessary wear-mitigating precautions are taken before installing the pump at the seabed. This implies that the wear evaluation needs to be assessed when designing the subsea pump and system, and consequently the model input is usually predictive data for fluids and solids production, sand quality, and pump operating conditions. In addition, the predictive data is normally a wide range of conditions, covering years of operation. The output from the wear model is used to optimize the material, clearances, and performance of the pump system.
The model is based on fundamental erosion and abrasion mechanisms, and empirical factors for MPP applications are applied to account for the specific geometries and operating conditions.
Erosive wear
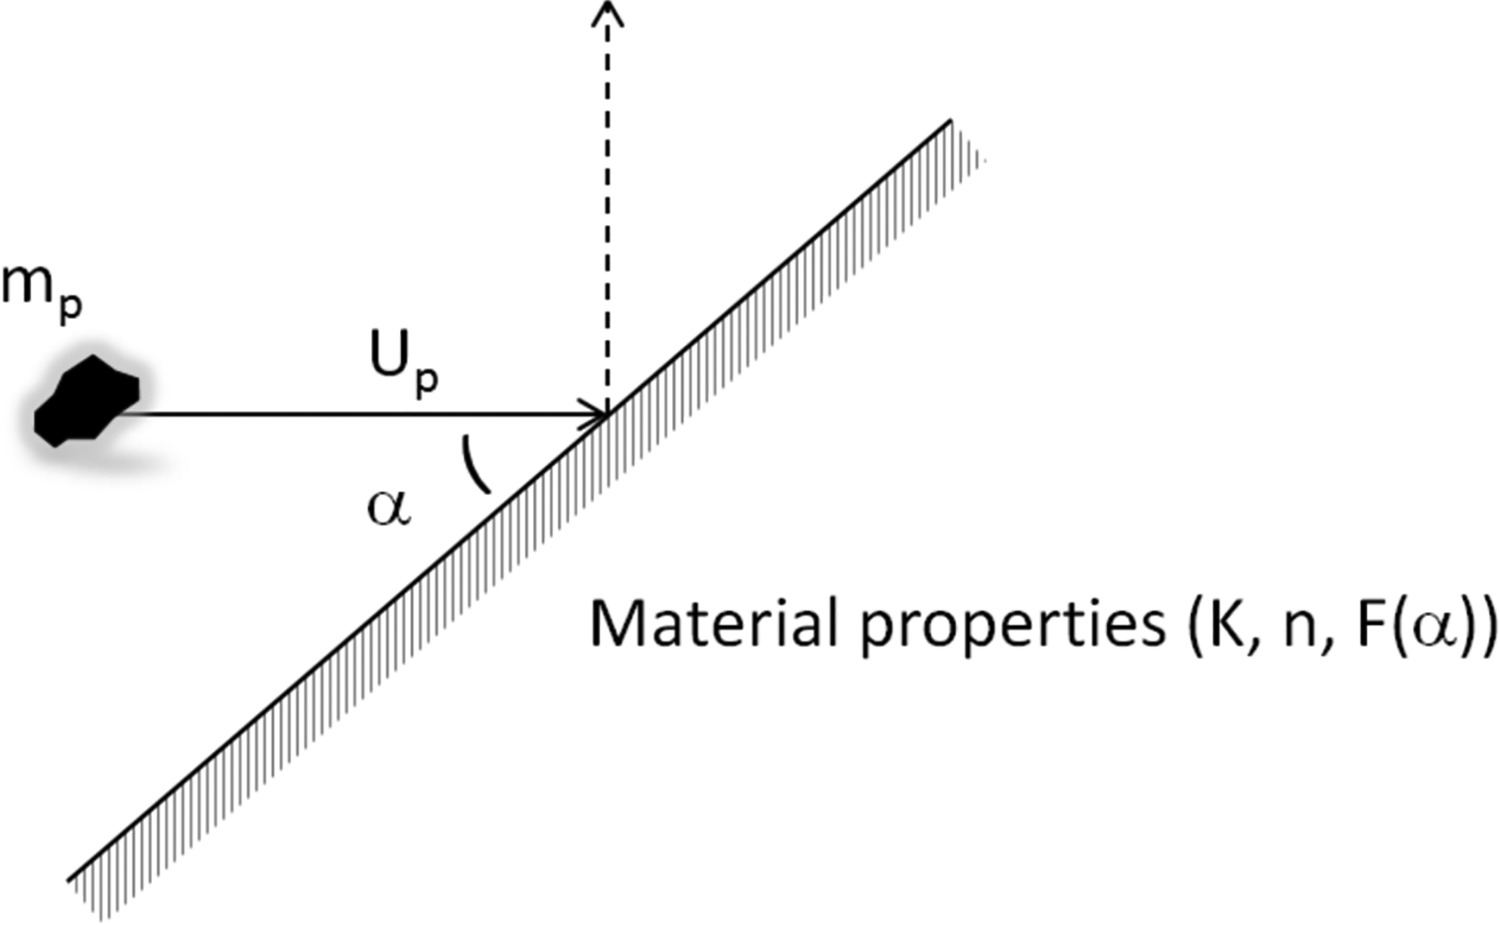
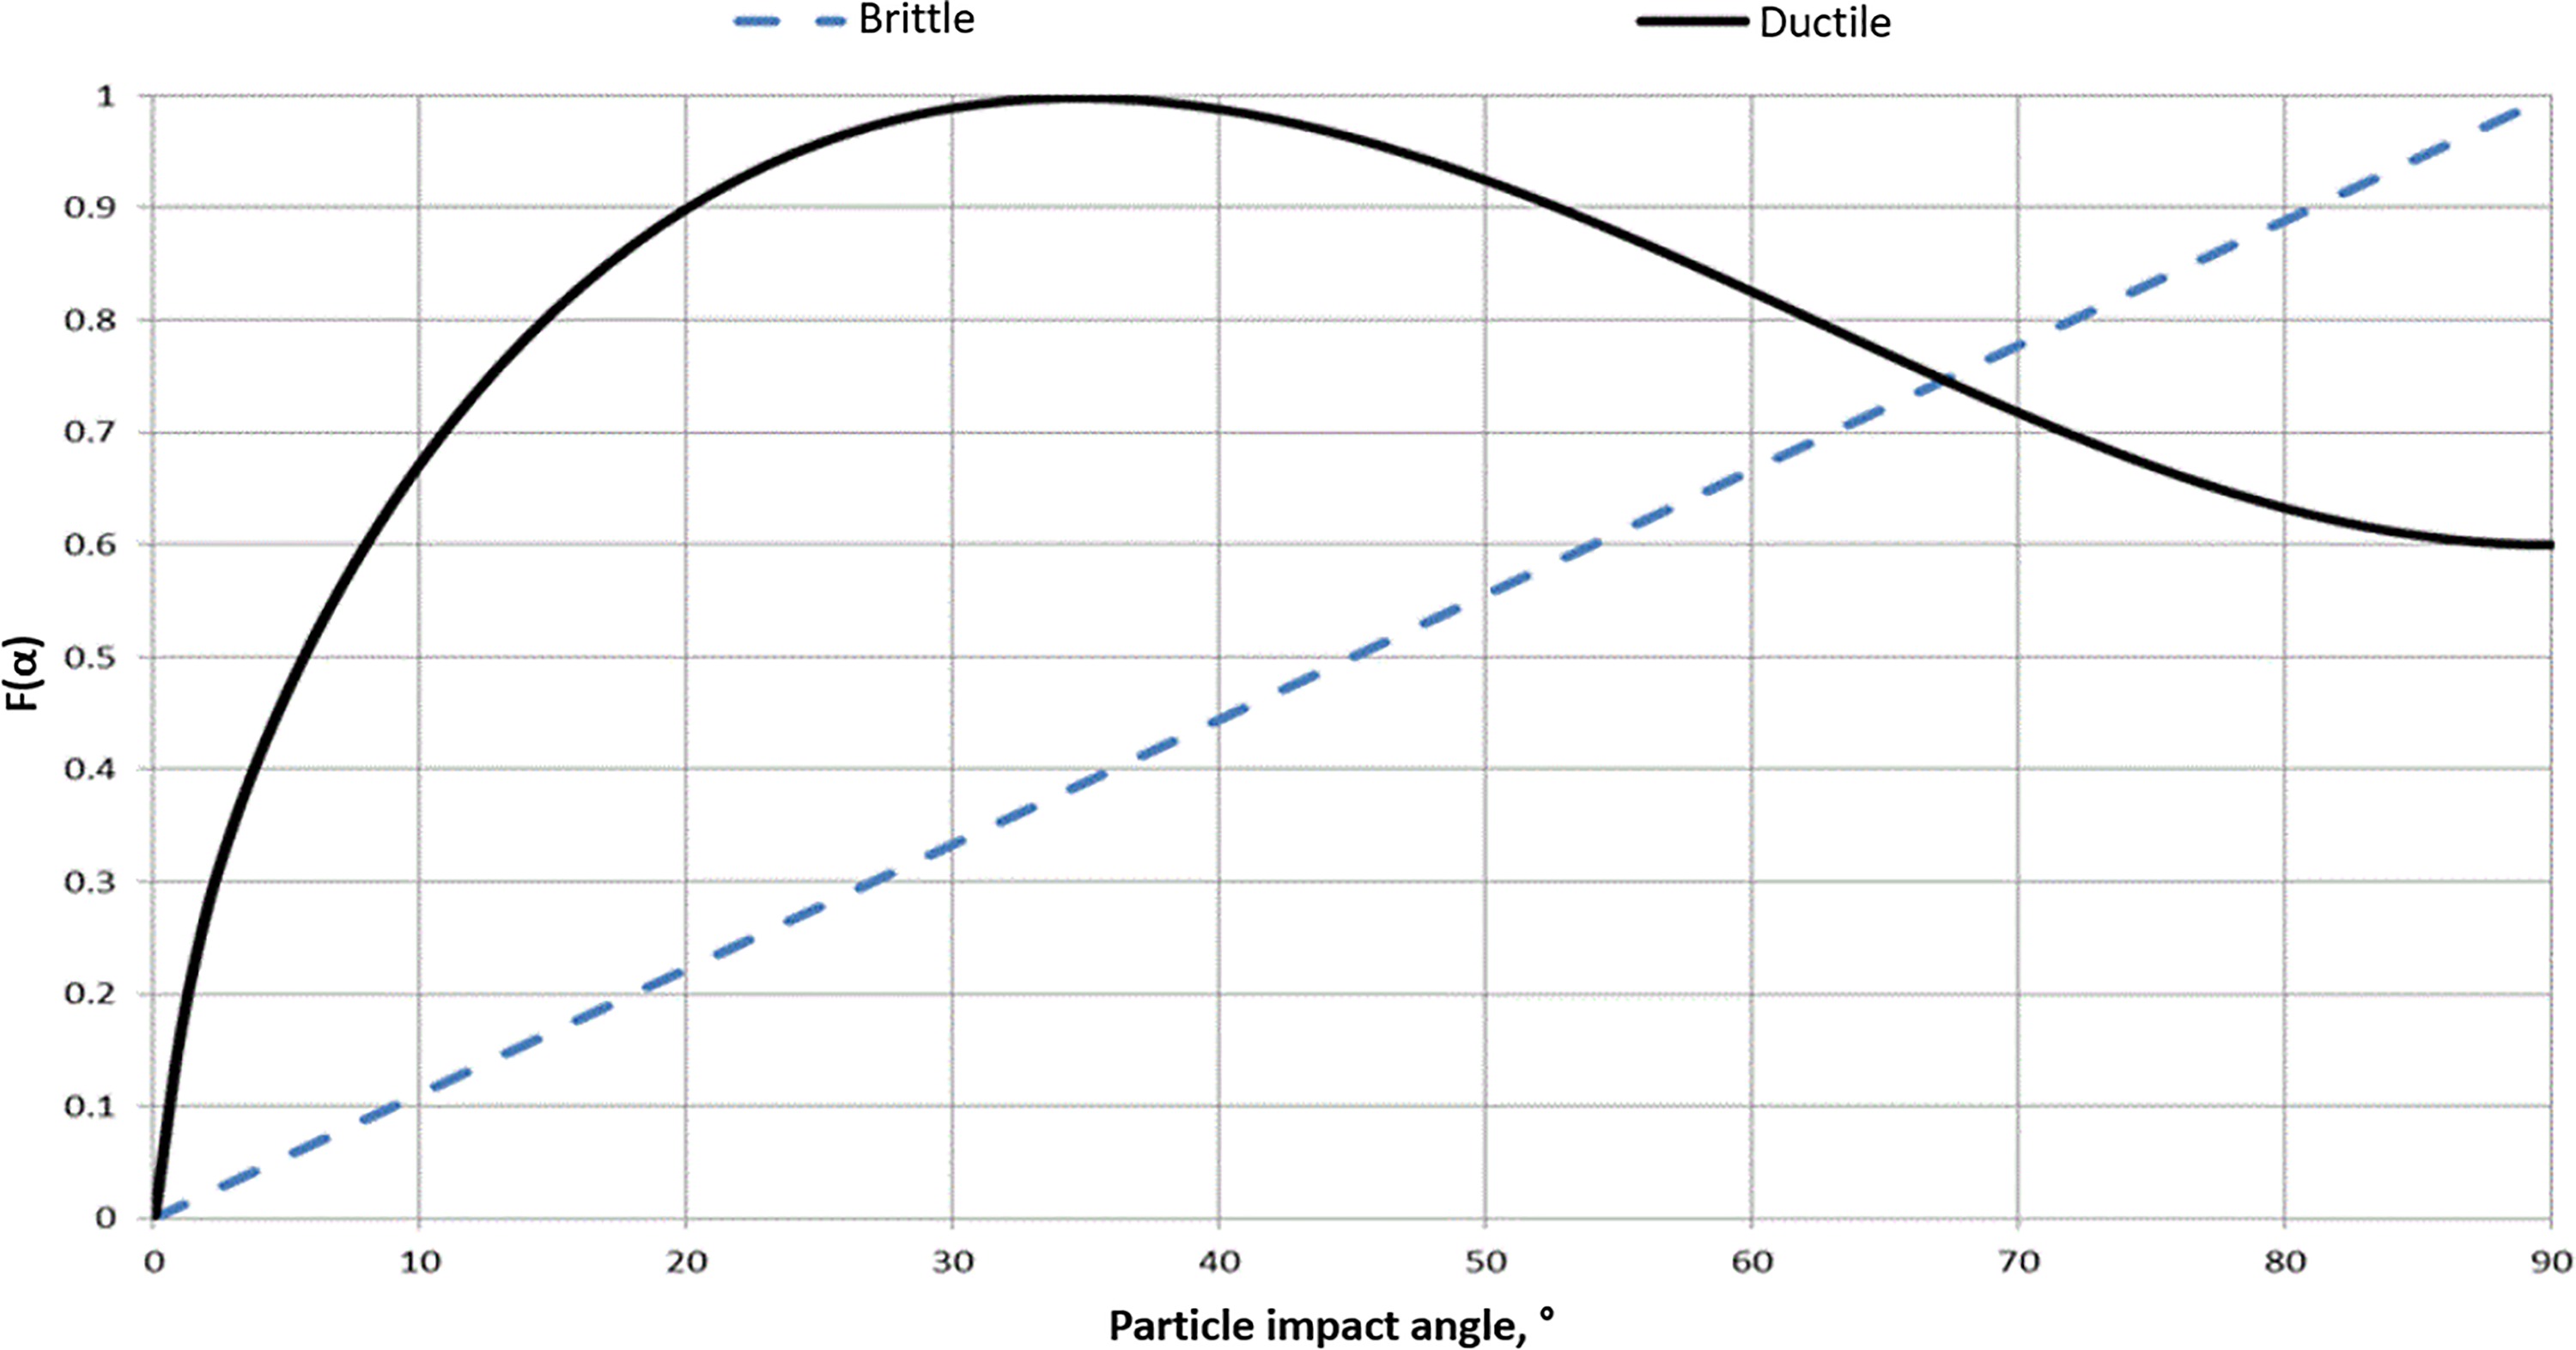
DNVGL RP O501 offers a recommended practice developed for the oil and gas industry to provide guidance on how to safely and cost effectively manage the consequences of sand produced from the oil and gas reservoirs through production wells, flowlines, and processing facilities. DNVGL RP O501 provides theoretical and empirical models for prediction of particle erosion in standard pipework components. This erosion model, shown in Equation 1, estimates the material loss rate, Em, caused by impact velocities, Up, and angles, α, of the particle colliding with the target surface. mp is the mass of the particle, and the parameters K, n and F(α) are empirical properties of the target material. The function F(α) describes the effect of impact angle on the erosion grade. F(α) is strongly influenced by the ductility of the material. Figures 6 and 7 illustrate the effect of impact angle on erosion grade for brittle and ductile materials.
From Equation 1, it can be seen that the erosion rate is proportional to the impact velocity raised by the power of n. DNVGL RP O501 provides a table of velocity exponent (n) values for typical materials. It states that normal for normal steel grades, n = 2.6. This implies that reducing rotational speed is an effective means of mitigating erosion on impellers. Linking the previous erosion model to geometrical parameters, the erosive loss rate at a geometrical surface can be calculated:
where Mp is the mass of sand, ρt is the density of the target material, and At is the area exposed to erosion. Considering the impeller leading edge erosion, At is corresponding to the ratio of the leading edge area to flow channels at impeller channel inlet. The flow path of sand particles will be strongly influenced by the velocity profile of the fluid in which it is transported. Although the difference in density between sand and the well fluids will cause the sand to follow a somewhat deviating flow path, studies have shown that the majority of sand will flow through the impeller without contact with impeller surfaces. In the pump wear model, the DNVGL erosion model is expanded to include geometrical correlations and effects of different sand types and sizes.
Abrasive wear
Abrasive wear causes narrow clearances between rotating and stationary surfaces to increase. In an MPP, abrasive wear in impeller tip clearances and in balance piston annular seals will increase internal recirculation. Rotordynamic sensitivity analyses are needed to secure stable pump operation also with worn clearances. The amount of abrasion is highly dependent on the particle size. Sand particles may ultimately increase the gaps to approximately 2–3 times the maximum particle diameter. The abrasion manifests itself with reduced pump efficiency and increased speed requirement.
Performance degradation
Erosive wear on the leading edge of the impellers affects the pump performance in terms of reduced head due to impeller blade area losses. In addition, worn impeller inlet can alter the incidence angle, which in turn impacts both head and efficiency. Abrasive wear at impeller tip and in balance piston and wear rings leads to internal recirculation in the pump, and hence reduced volumetric efficiency.
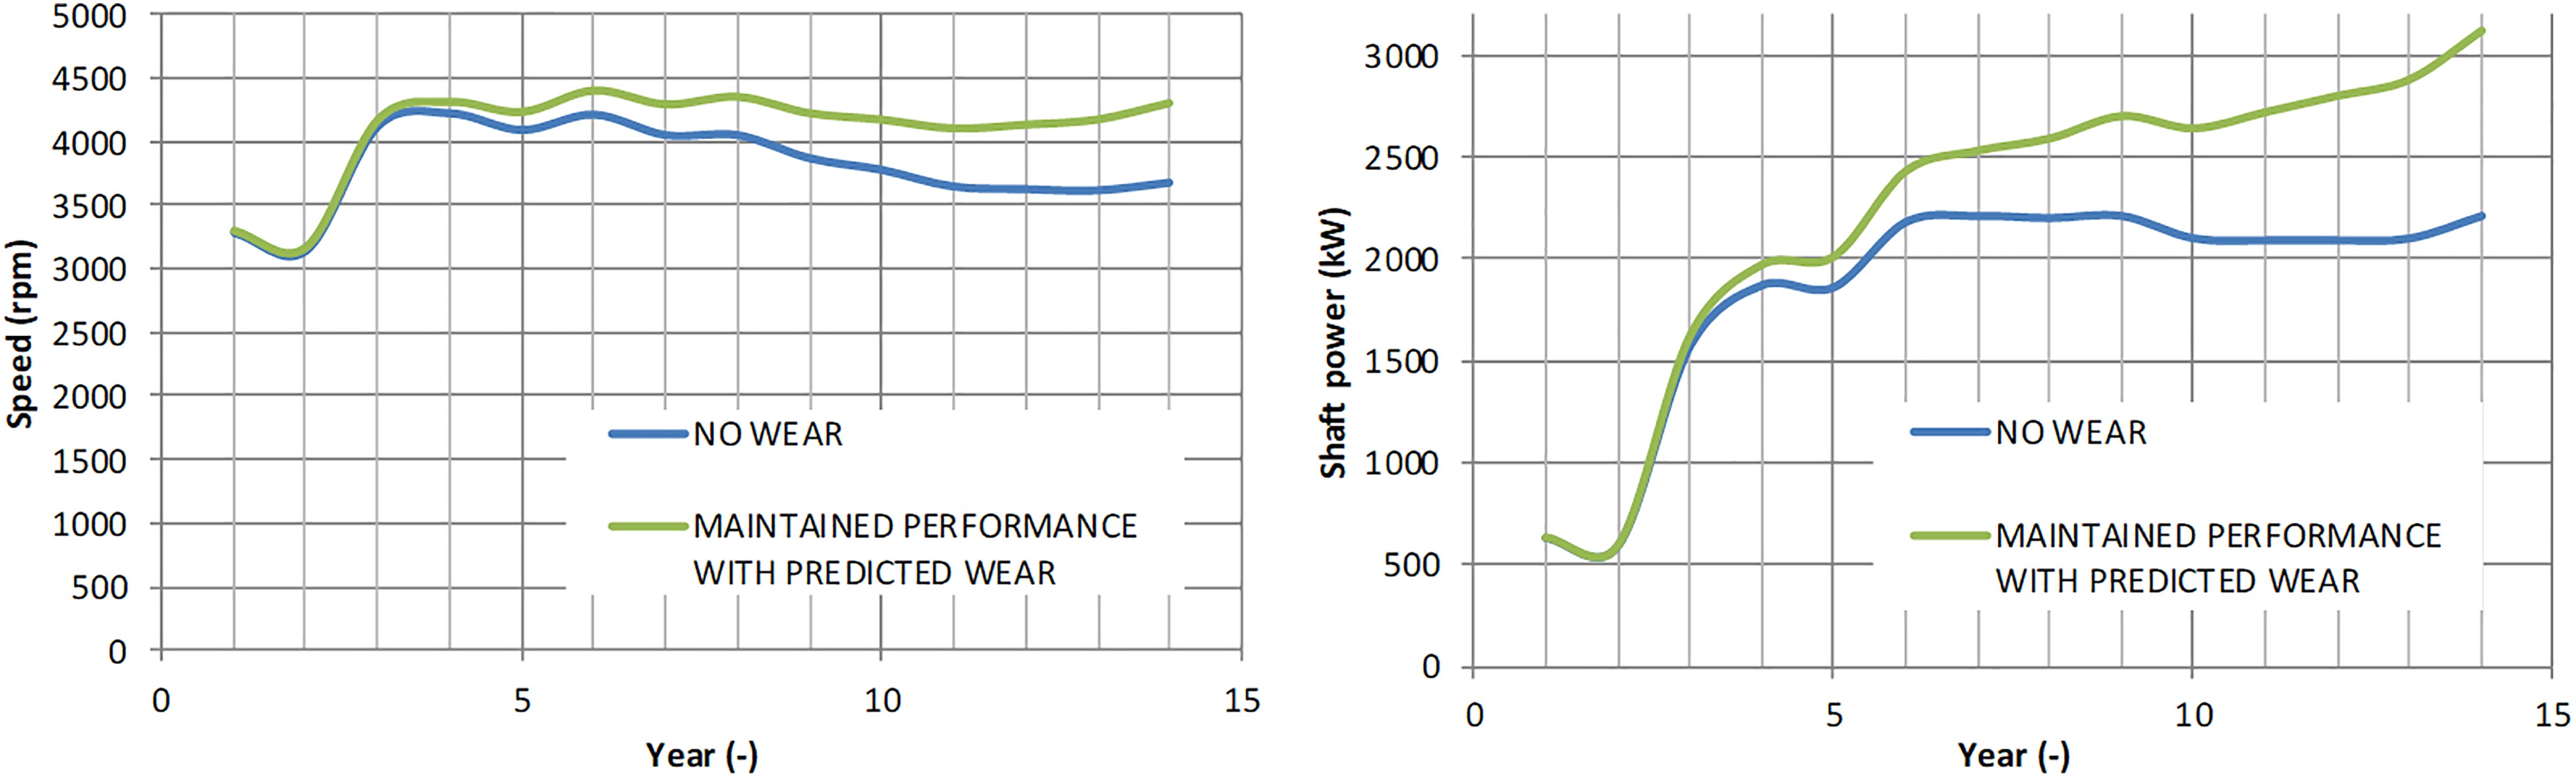
In subsea pump applications, designing with wear allowance means not only to maintain the mechanical integrity of the components, but also to maintain the required pump performance. Modeling erosion, abrasion, and performance degradation allows the client and vendor to specify speed and power margins to secure that the required flowrate and differential pressure can be reached also with the expected wear. An example of predicted performance degradation due to wear is shown in Figure 8. In the example, the wear model was part of an iterative design process, where the modest speed requirement for the selected hydraulics resulted in a low wear gradient in as-new condition, and speed and power margin to account for the performance degradation.
MPP wear model applications
The pump wear model has been applied in several subsea pump applications. In addition to the initial purpose of the model, namely designing the pump system for handling the predicted sand rates, it serves also as input to pump protection controls and condition monitoring. The previously described wear tests and field experience has provided an extensive range of data on different speeds, gas volume fractions, and flow coefficients. The data is continuously being used for model calibration and validation.
The largest uncertainty in the pump wear model today is related to viscous operation. High viscosity is expected to reduce wear rates due a viscous fluid film protecting the target components, damping the impact of particles. However, the effect of fluid viscosity on erosion rate is not fully understood.
Case study from field
Moho subsea MPP system
Together, the authors’ companies have developed, tested and installed a subsea MPP system for the Moho 1bis development. The Moho Field is located 75 km offshore the coast of The Republic of the Congo in West Africa. The pump system is used to tie back the Bilondo-D reservoir to the existing floating production unit, FPU-Alima. To meet the forecasted production profile, the pump system was equipped with two MPPs. Each pump comprised 11 helico-axial impeller-diffuser stages.
To mitigate the wear effects, sand screens were installed at the wellbore to allow for corrective actions in case of heavy sand production. The MPP was designed to have a 300-rpm speed margin and a 15% power margin toward the most demanding design requirements. The MPP impellers were coated with tungsten carbide.
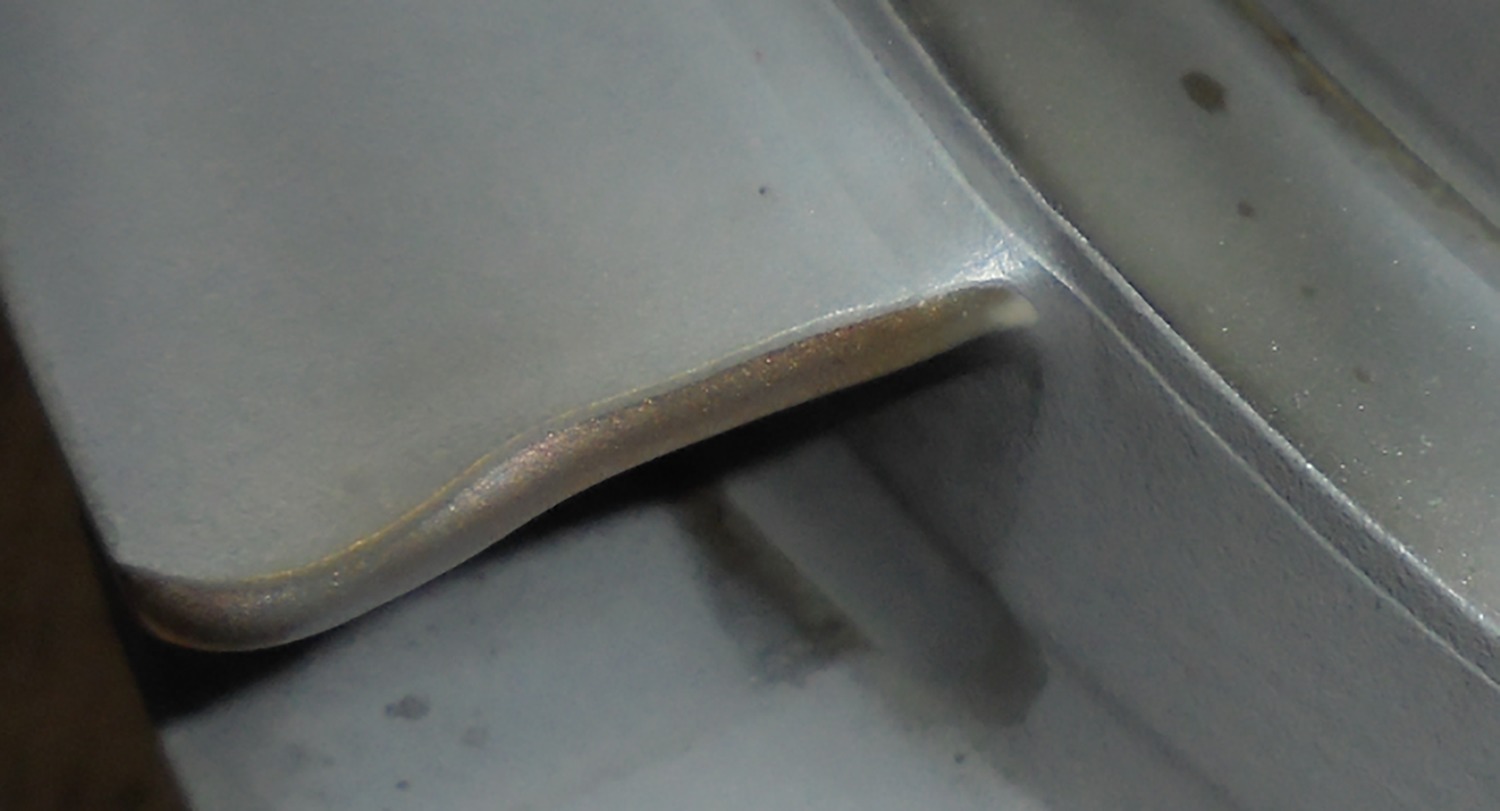
The pump system was successfully installed, commissioned, and started during the spring of 2017. In August 2017, a sand screen in one of the wells failed. Following this event, the pump was subjected to significant amounts of sand before it was retrieved for a planned revision in February 2018 (Figure 9). The retrieved pump was inspected, and the erosion on the impellers was documented.
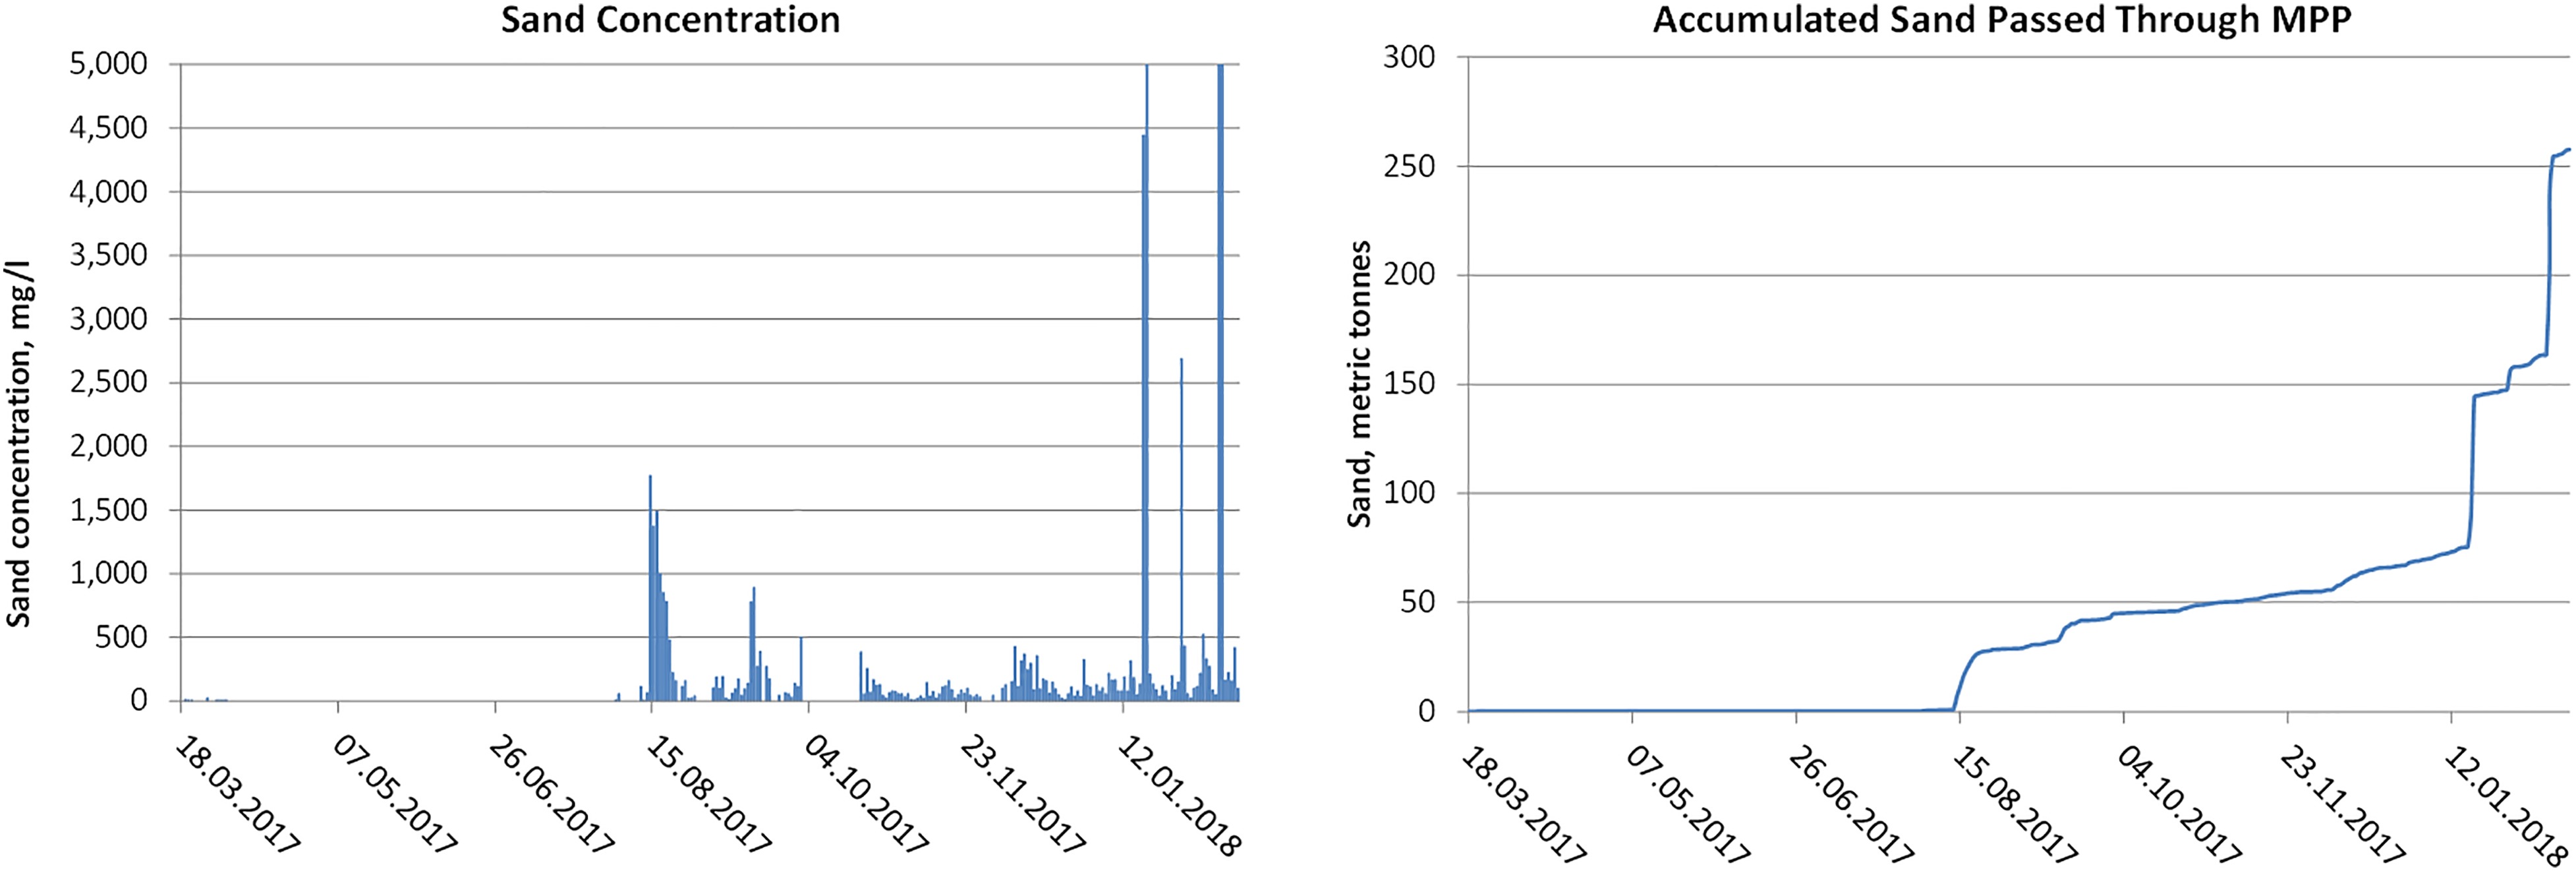
Measured sand data
Every day, a sample of the process fluid was taken from the inlet of the topside separator. The sand concentration was established from a lab analysis performed on the sample. The sand concentration is assumed to be constant for 24 h. It is further assumed that the concentration of sand in the pump and the pump station recirculation line is equal to the sand concentration measured topside. Following the sand screen failure in August 2017, the MPP was subject to more than 250 metric tons of sand. The high concentration measured on January 18 (16,500 mg/L) and February 10 (22,600 mg/L) 2018 have made a significant contribution to the overall sand production. It is uncertain whether this high concentration has lasted for as long as 24 h. At the same time, short periods of extremely high concentration may have occurred on other days without being captured in the daily sample.
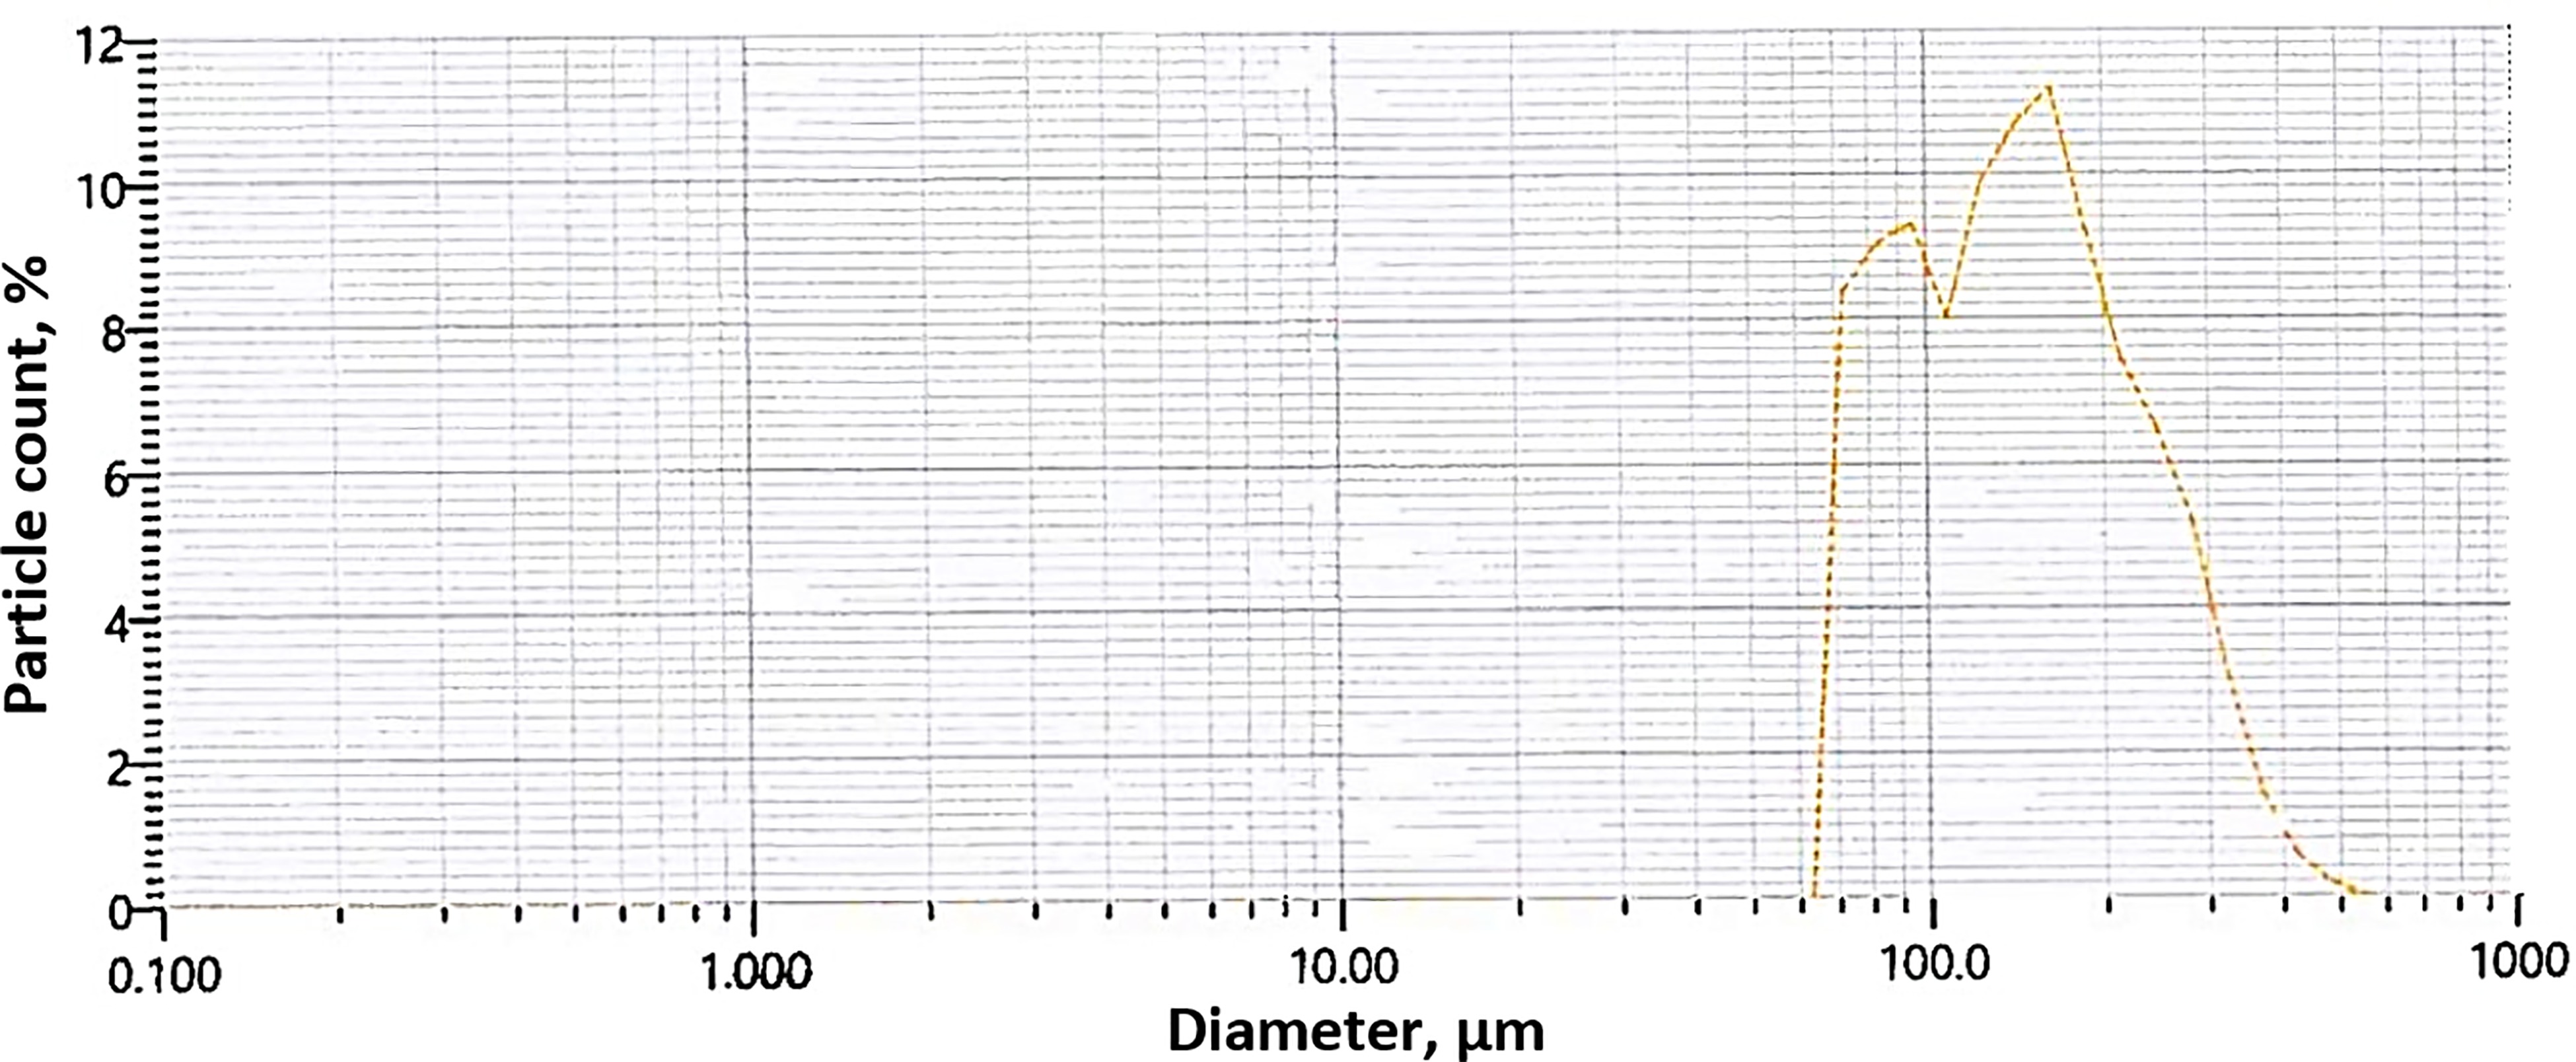
A laser scattering analyzer has been used to establish particle size distribution. The result, shown in Figure 10, yields an average particle size of 158 µm.
Measured wear
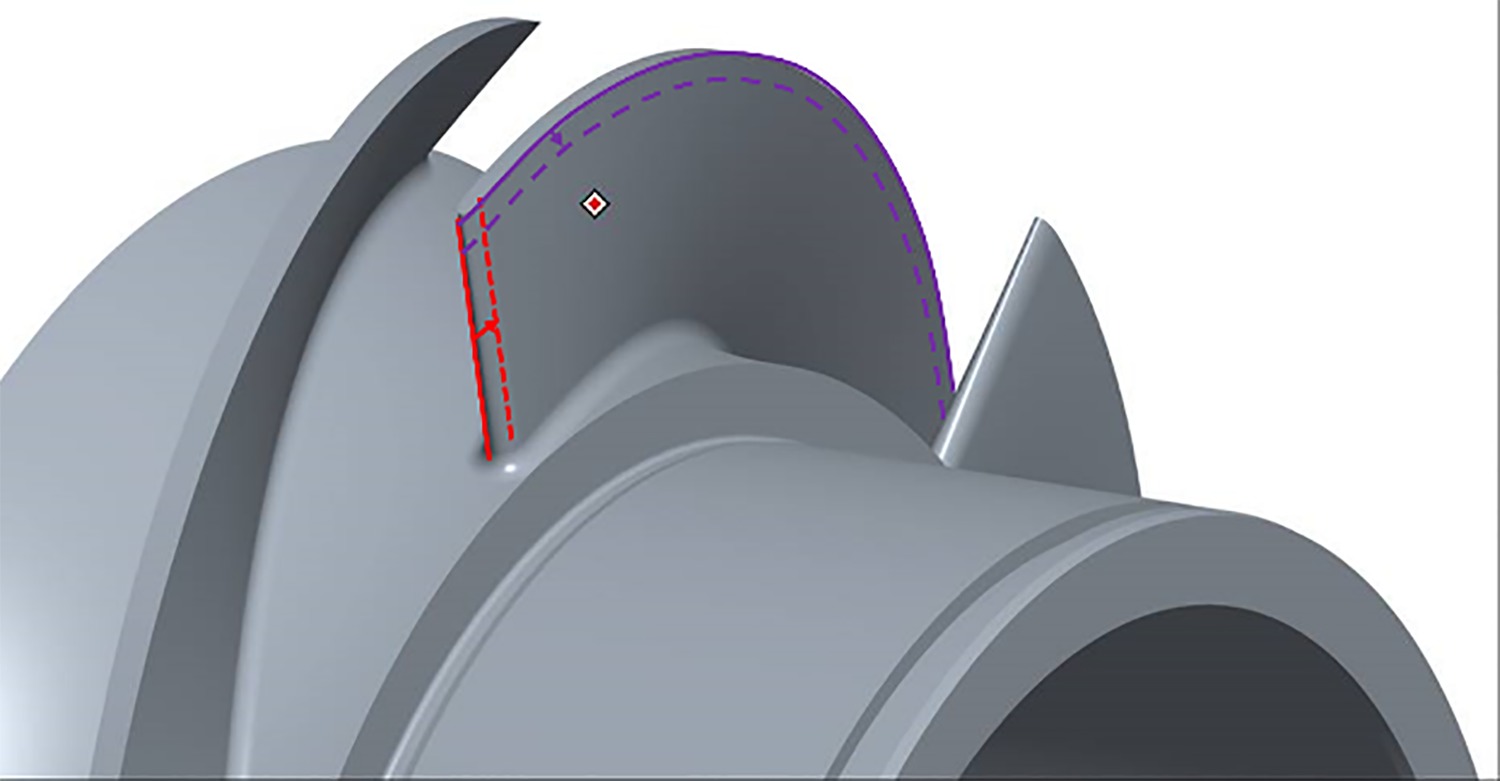
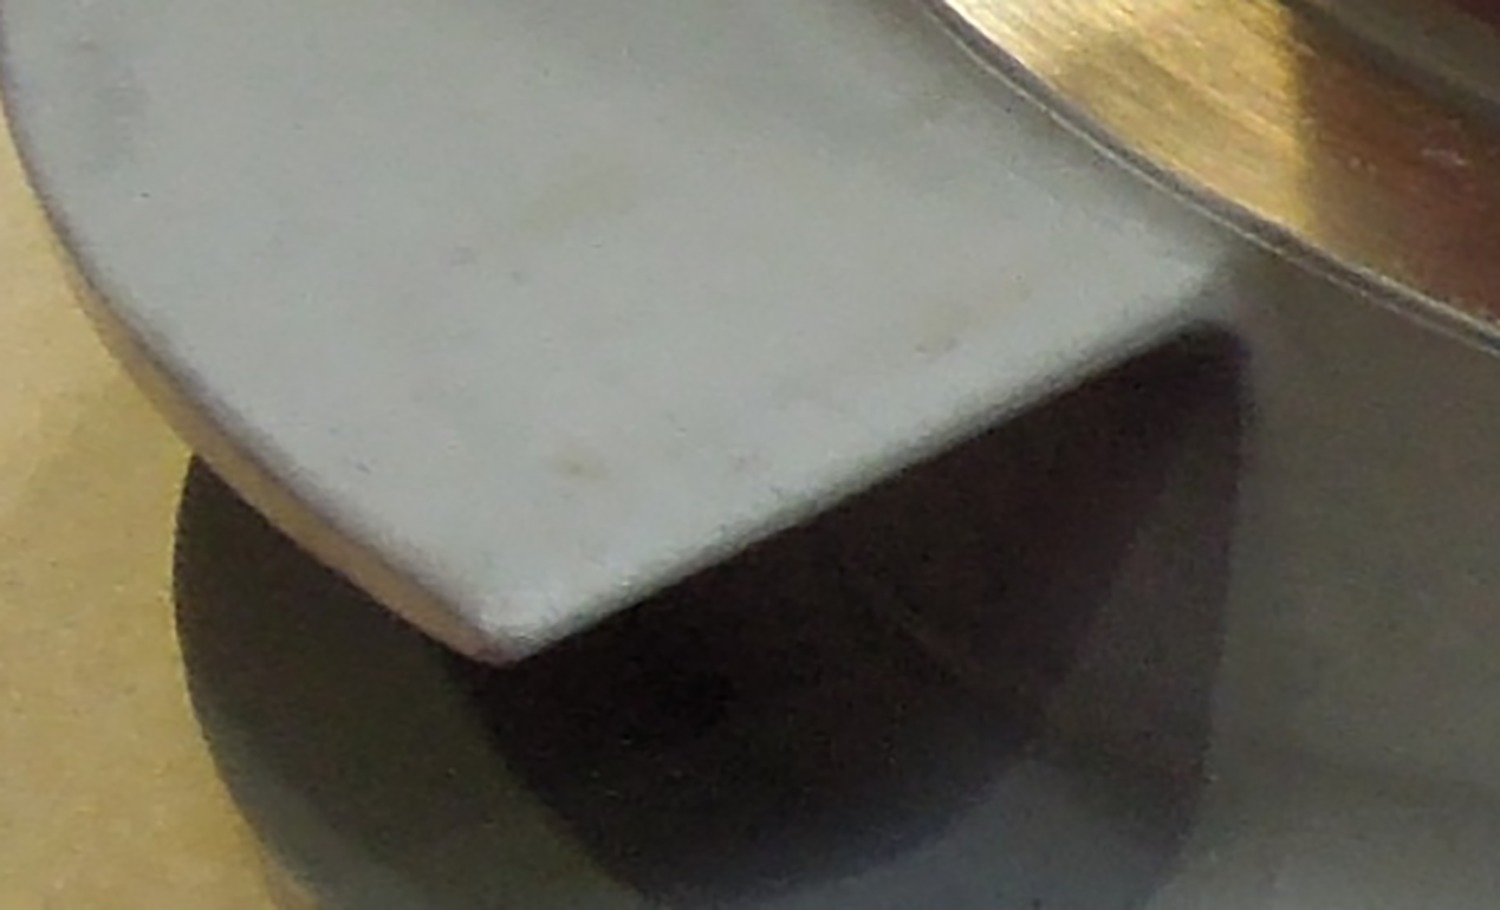
As previously described, the impellers are most susceptible to wear, and the largest material losses are observed at the impeller blade leading edge and tip. In Figure 11, the leading-edge wear is illustrated with red lines and the impeller tip wear is illustrated with purple lines. Figures 12 and 13 show the leading edge of an impeller blade prior to installation and after field operation, respectively. The material loss is very modest considering the heavy sand production. Furthermore, the wear is not evenly distributed along the leading edge. The leading-edge erosion was found to be similar for all impellers, and on average, 1.5 mm.
The wear on the impeller tip was also very low, and less than the tungsten carbide coating thickness. The impeller tip diameter was measured near the leading edge and trailing edge before and after operation. The results are illustrated with the tip wear values shown in Figure 14. In multiphase flow, the differential pressure across the impeller blade is higher near the leading edge compared to trailing edge. The velocity in the tip gap and the total amount of sand passing through the tip gap is therefore higher near the leading edge. As expected, the impeller tip wear measurements show more wear close to the leading edge as compared with the trailing edge. Due to compression, impeller number 11 is subjected to lower gas volume fraction than impeller number 2; the wear is more evenly distributed along the tip.

Modeled wear
Known pump operating conditions, process parameters, and sand data in combination with measured impeller wear is a unique set of information. Retrospective operational data from Moho were applied in the MPP wear model. Comparing the modeled wear to measured wear could allow for valuable field validation of the wear model.
Daily average values of the following parameters were supplied by the operator as retrospective model input
Sand data used in the model were based on the samples described in the previous section. The wear model applies the wear properties of tungsten carbide coating until the coating is punctured and duplex properties for the further wear.Viscous effects
As previously mentioned, the quantitative effect of viscosity on wear rate was uncertain. The Moho pump had operated at liquid viscosities of about 300 cP, and the effect was expected to be significant. An analysis was carried out to quantify the effect of viscosity on wear rate. This analysis started with neglecting viscosity effects in modeled wear, and then comparing the results to measured wear. Secondly, the deviation between measured and modeled wear was assumed to be caused by the neglected viscosity effects. A viscosity factor providing normalized wear rate for the relevant viscosity was found and compared with other published data.
Figure 15 shows removal of material from impeller leading edge and tip as illustrated in Figure 11. The wear modeled without viscosity effects, shown with solid lines, was very conservative for both leading edge and tip wear. To eliminate the deviation between the model results and the measured wear, a viscosity factor was introduced to the wear equations. Viscosity factors of 0.15 and 0.17 were required for the leading edge and impeller tip, respectively, to match modeled and real wear.

As mentioned previously, Okita et al. (2012) experimentally investigated viscous effects on wear rates and found that, for 150 µm particles, the wear rate was reduced to 30% when the viscocity of the carrier fluid was 50 cP compared to a reference wear rate at 1 cP. This is shown in Figure 16, where experimental results are marked by solid dots; whereas, CFD modeled results are indicated by circles. By extrapolating the trend for measured results to 300 cP (Moho conditions), one can estimate wear rates less than 20% of the reference wear rate.
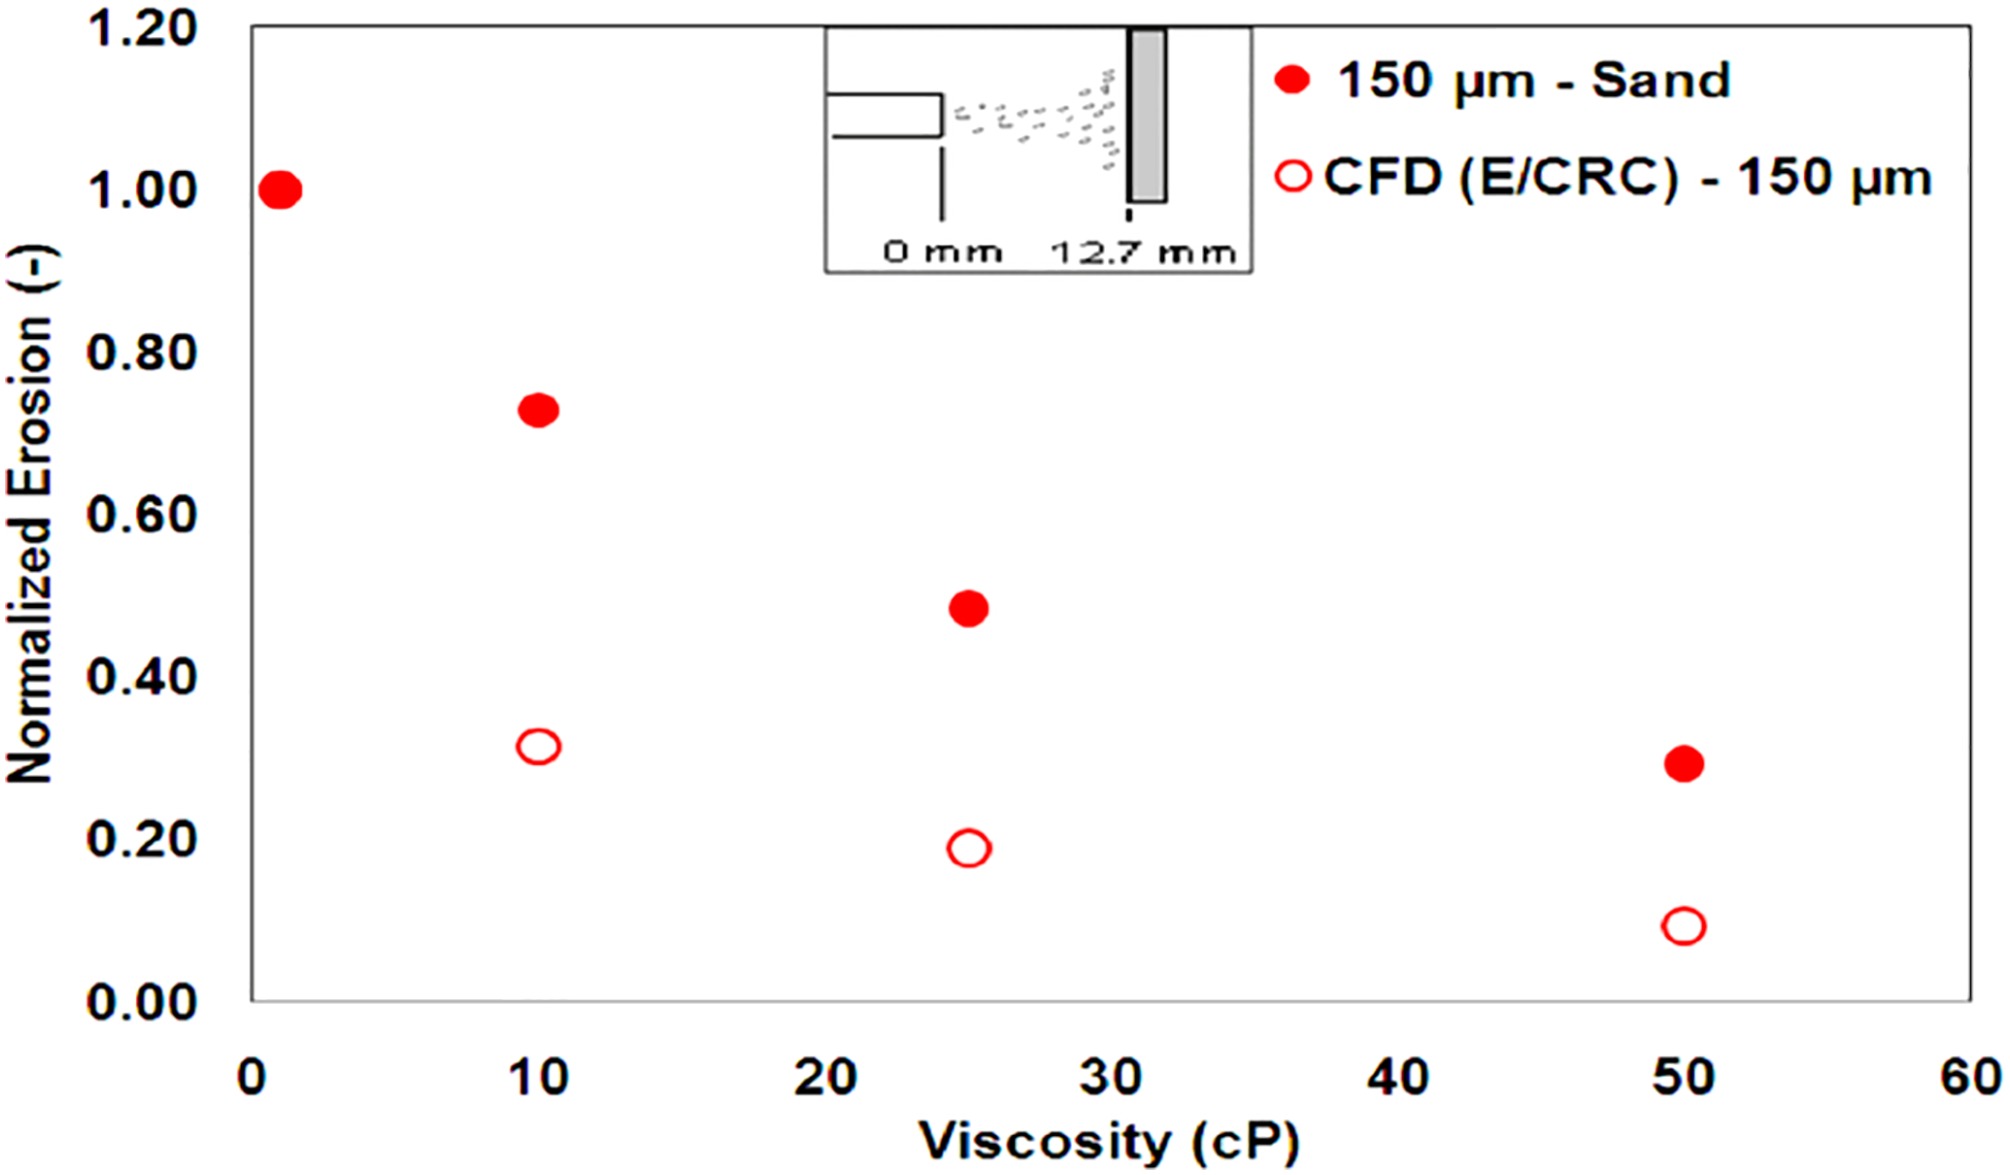
The correlation between the Moho-based viscosity factors and the extrapolated trend for the Okita experiments indicate that viscosity is highly important in wear assessments, and validates the magnitude of the viscosity factors for use in the pump wear model. Although the deviation between initially modeled and actual wear may partly origin from model inaccuracies or inaccurate model input, the correlation with Okita experiments indicates that viscosity is the dominating source. For the authors’ companies, expanding the existing wear calculation method to also include viscosity effects, allows for improved condition monitoring of subsea MPPs. The viscosity adjusted model is also an important tool for sizing future high viscosity applications where sand production and erosion are relevant issues.
Summary and conclusions
Sand production is a main challenge in subsea production systems due to limited opportunities for corrective maintenance and intervention. Subsea helico-axial pumps are frequently being used to boost the production of oil and gas. For subsea pumps, where velocities are higher than elsewhere in the production string, it is crucial to understand the impact of the sand production throughout life of the field.
Efforts are taken to minimize sand production in oil and gas fields, and general wear mitigating efforts are applied for all equipment in the production string, including subsea pumps. However, for fields particularly prone to heavy sand production, additional measures must be taken. To sustain high reliability and long lifetime for subsea pumps, a wear model has been developed. The model is based on and validated against several wear tests. This model predicts
wear rates for the forecasted production and operating conditions
how the pump speed requirement and power consumption will increase due to wear.
The wear model is also applied for condition monitoring purposes. Sand impacts pump performance, which can be monitored by flowrate, pressure and power measurements. The degree of wear can be quantified by combining performance monitoring and the wear model. This form of condition monitoring provides the operator with information to predict future performance degradation, plan for interventions and optimize availability.
In this paper, predicted wear is compared with the wear observed on a subsea MPP retrieved from the Moho Field. This pump has been operating on high viscosity: One of the largest uncertainties is the pump wear model. Viscosity of the carrier fluid is assumed to reduce the impact velocity of sand particles, and hence the wear rate. But quantitative data on viscosity effects are scarce, especially at the relevant viscosities in the range of 300 cP.
First, the analysis was performed by assuming that the viscosity of the carrier fluid had no impact on the wear rate. The results were very conservative. Second, it was assumed that the deviation between modeled and actual wear was caused by the neglected viscosity. The deviation was eliminated by introducing a viscosity factor. The magnitude of the viscosity factor corresponds well with an extrapolation of the experimental results from the work published by Okita et al. (2012). Although the deviation between initially modeled and actual wear may partly originate from model inaccuracies or inaccurate model input, the strong correlation between Moho Field experience and Okita experiments indicate that viscosity is the dominating source. This is believed to justify the use of the viscosity factor, yielding significantly reduced wear rates due to particles being suspended in a highly viscous medium.
For the authors’ companies, knowledge about viscosity effects allows for improved condition monitoring of subsea MPPs. The updated model is also an important tool for sizing future high-viscosity applications where sand production and erosion are relevant.