Introduction
Engine downsizing becomes a prevailing method to improve the fuel economy of internal combustion engine. It is achieved via reducing displacements of cylinders while maintaining the equivalent power with the original engine by increasing power density. One of the key enablers for engine downsizing is the turbocharging 11. The turbine of a turbocharger is the component recovering energy from the exhaust gas of an engine. This component is inevitably subjected to pulsating flow due to a reciprocating engine. How this fact influences the design methodology of the volute of the turbine is a topic of interest in its performance enhancement under pulsating conditions.
Research have been carried out extensively on turbine behaviours under pulsating conditions, and results demonstrated clearly the distinction from the equivalent steady performance 04, 02, 03, 06, 17. The rotor extracts energy from the exhaust flow and, thus, stands in the centre of the research topic. The volute is another important component feeding the flow into the rotor in the desired direction to optimize the performance. This component plays a key role of determining unsteady behaviours of the turbine. It is the volume of the volute that dominates the filling and empty processes of the turbine under pulsating conditions 09, 14. These two processes can be enhanced by larger volume and, thus, results in larger hysteresis loops of turbine performance. The deviation of hysteresis loops from the steady performance is an indication of mass imbalance in the turbine, which is considered to be a reasonable parameter of unsteadiness evaluation 07. However, the reason for the relationship between the mass imbalance and the unsteadiness has not been well understood. Except for the volume, the length of the volute passage is another important factor influencing the unsteady behaviour. It was confirmed that an evident phase shift exists between the input energy and the output power. Half length of the volute passage was suggested for the evaluation of the phase shift between the input energy at volute inlet and the output power by the rotor 0108. Satisfied results have been obtained from the assumption. This fact implies the route of energy propagation in the volute before it is absorbed by the rotor, but the propagating behaviours of flow parameters related with the flow energy have not been extensively investigated yet due to complex gas dynamics in actual pulsating conditions. Furthermore, research of the topic mainly focus on gas dynamic effects, such as the filling and empty that resulted from configurations of a volute, and few investigations have been carried out on the influence of the pulsation on detailed flow in the volute. Instead, detailed flow analysis in turbine volute was mainly carried out at steady flow conditions 101505.
Design procedures of the turbine volute based on steady conditions have been developed for decades 01, 05. It is well known that the geometrical parameter A/Rc of a volute is the key parameter determining the flow direction at the volute exit and, thus, has a significant impact on the turbine performance. The assumptions, such as that the flow follows the rule of angular momentum conservation (free vortex) and the uniformly distributed mass flow rate in the annulus, result in a linearly distributed A/Rc in the circumferential direction. This is the widely accepted guideline for volute design 10, 15, 16. Considering that these assumptions are all based on steady flow conditions, it is necessary to re-evaluate them under pulsating conditions and their influence on the design guideline if there is any.
The current article aims to study unsteady behaviours of a turbine volute under pulsating conditions through the validated computational fluid dynamic (CFD) method. Detailed flow parameters in the volute are analysed, and an analytical model is built for the understanding of the mechanism. The investigation demonstrates the unsteady influence of the pulse on flow parameters in the volute, which may shed light on the tailored design method of the volute targeting at turbine performance improvement under pulsating conditions.
Numerical method and validation
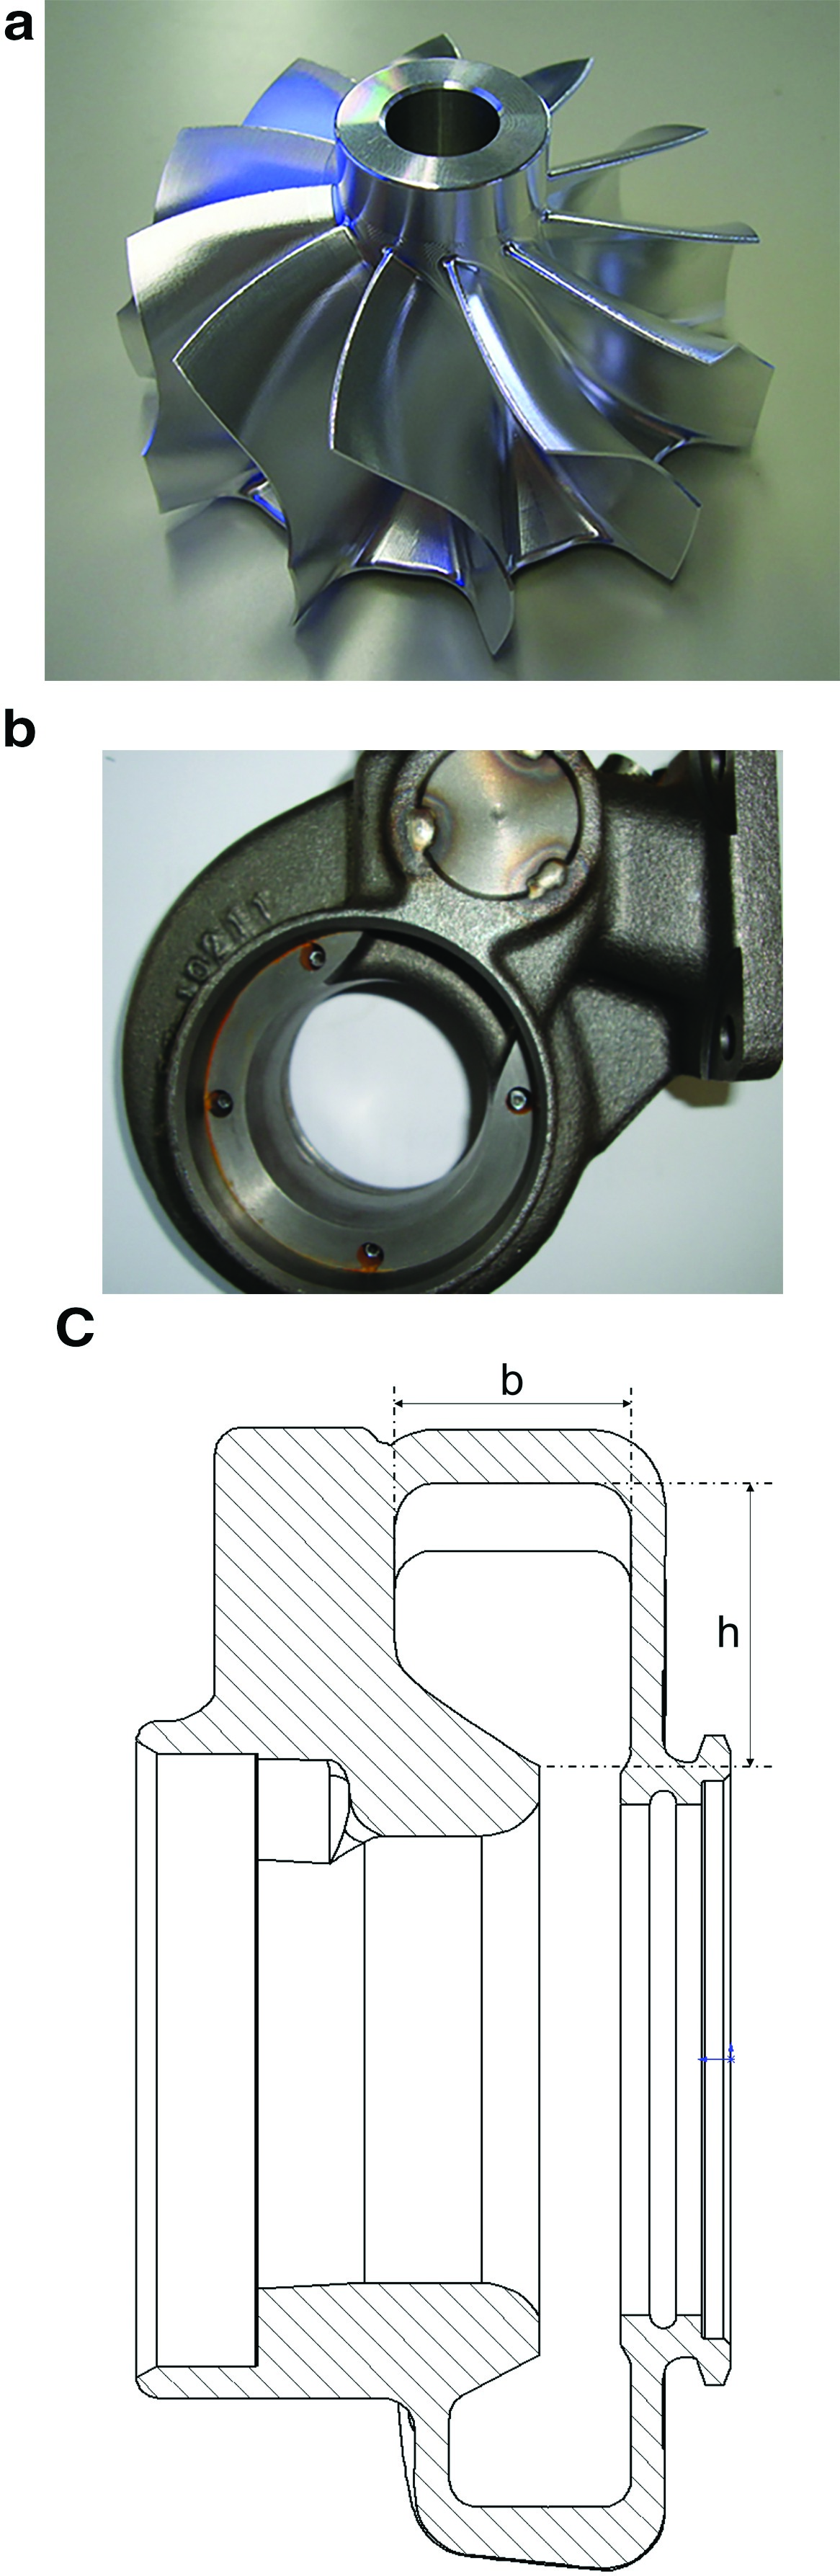
An Mitsubishi Heavy Industry radial turbine of a turbocharger is used for the investigation. The radial rotor, the vaneless volute and its cross-section are shown in Figure 1. There are 11 blades in the rotor. Main geometrical parameters are listed in Table 1. CFD method is employed for detailed flow investigation in the volute at steady and pulsating conditions. Domains from the measurement plane to the exit pipe, including inlet ducts, the volute, the rotor and the exit pipe, are all modelled for the investigation. Geometrical features such as fillets near hub and sculptures are not modelled for the convenience of meshing. The volute and the ducts are meshed by unstructured meshes for high quality of meshes, while the rotor is meshed by structured ones via TurboGrid module. There are 4.5 million nodes in total, where there are about 800k nodes in the volute and about 3 million nodes in the rotor, which can guarantee the grid independence. Computational meshes are shown in Figure 2.
Figure 2.
Meshes of the turbine for CFD analysis. (a) Mesh of turbine rotor; (b) mesh of volute; (c) computational domains of the turbine.
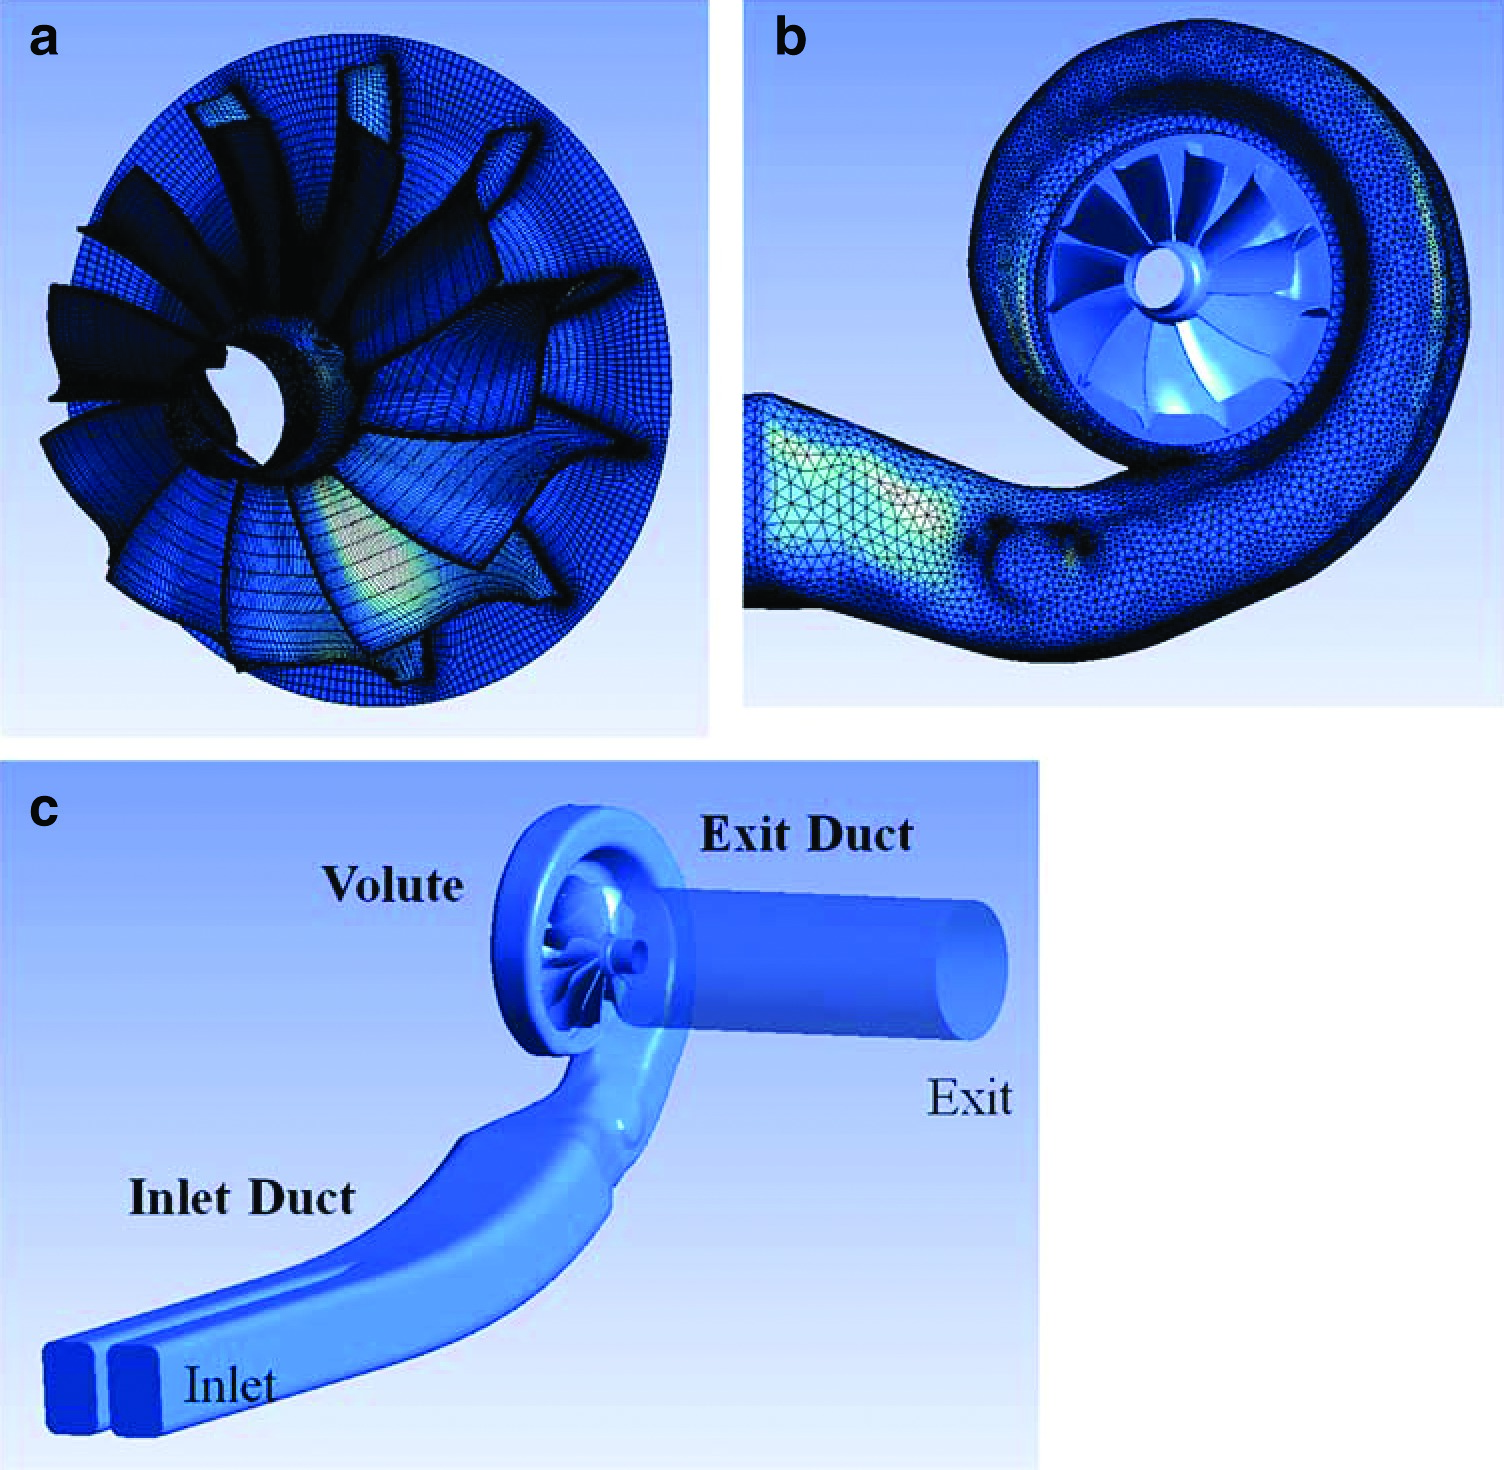
Table 1.
Main geometries of the rotor.
| Rotor geometries | |
|---|---|
| Inlet diameter of rotor | 74.0 mm |
| Blade height of the rotor inlet | 12.0 mm |
| Hub diameter at rotor exit | 21.0 mm |
| Tip diameter at rotor exit | 64.9 mm |
| Blade number | 11 |
The instantaneous total pressure and temperature from the measurement are given as the inlet boundary conditions; the instantaneous static pressure is imposed as outlet boundary condition. Adiabatic, nonslip wall condition is applied for solid wall surfaces. “Frozen rotor” method is applied for the treatment of rotor/stator interface between the volute and the rotor, which can reduce the amount of computational time immensely compared to fully transient interface (sliding mesh) treatment. The flow phenomenon in the rotor, such as the unsteady disturbance caused by the volute tongue, is difficult to be captured accurately because the location of the rotor relative to the volute is assumed to be “frozen” in this method. However, unsteady behaviours of the volute can be well captured because they are less influenced by the unsteady interaction. As the flow in the volute is the interest of the current investigation and the rotor can be recognized as a downstream boundary to some extents, the method can meet with requirements of the study. Furthermore, this method has been proved to be reasonably good for the turbine performance and flow prediction in the volute of the turbine 17.
The Reynolds-averaged Navier–Stokes equations are solved by commercial CFD software ANSYS-CFX. Stress transport model is used to model the turbulence flow, which has been confirmed as a reliable model for the prediction of turbine performance, as well as the flow phenomenon 12, 17. Dual-time stepping method is applied for the unsteady simulation. The physical time step of the iteration is set to be 1.5 × 10⁻⁴ s, which counts for 112 steps for a pulse period or 45 degrees of rotation for the rotor. It is rough for the resolution of the flow phenomenon in rotating passages but adequate to resolve the flow evolution in the stationary volute. Twenty inner iterations are conducted in each time step to guarantee reasonable convergence (global residual as 10−4). Well-converged steady results are used as initial conditions for the unsteady calculation. The simulation is considered to be converged when the predicted pulse of flow parameters is well repeated for at least three pulse periods.
For the validation of the CFD method, the test was carried out on turbine facilities in Imperial College London. The pressure ratio (PR) and the mass flow rate parameter (MFP) for steady condition are defined by Equations (1) and (2):
where Pt−i and Tt−i are the total pressure and temperature at the inlet, respectively, Ps−e is the static pressure at the exit and m is the mass flow rate.
The efficiency (η) and the velocity ratio (VR) are defined by Equations (3) and (4):
where τ is the output torque by the rotor and ω is the angular velocity; U is the blade speed at the rotor inlet.
Figure 3 compares the steady performance of the turbine at the rotational speed as 50 kRPM between the experimental measurement and CFD prediction. The predicted swallowing capacity (Figure 3) is in high accordance with the experiment at all operation conditions, and the maximum discrepancy between the two results is less than 1.5%. The predicted output torque (Figure 3) matches well with the experiment at low load and middle load conditions but is over-predicted moderately at high load conditions. Simplifications of turbine configurations in the model, such as fillets at the hub and tip gap, are considered to contribute to those discrepancies at high loads. Moreover, the frozen-rotor treatment of the interface between the rotor and stator and the turbulence model at high load conditions when there is stronger rotor–stator interaction and flow separation in rotor passages may also contribute to discrepancies. Nevertheless, both the swallowing capacity and the output torque are reasonably well predicted at steady conditions by the numerical method.
Figure 3.
Turbine performance at 50 kRPM under steady conditions. (a) swallowing capacity; (b) output torque.
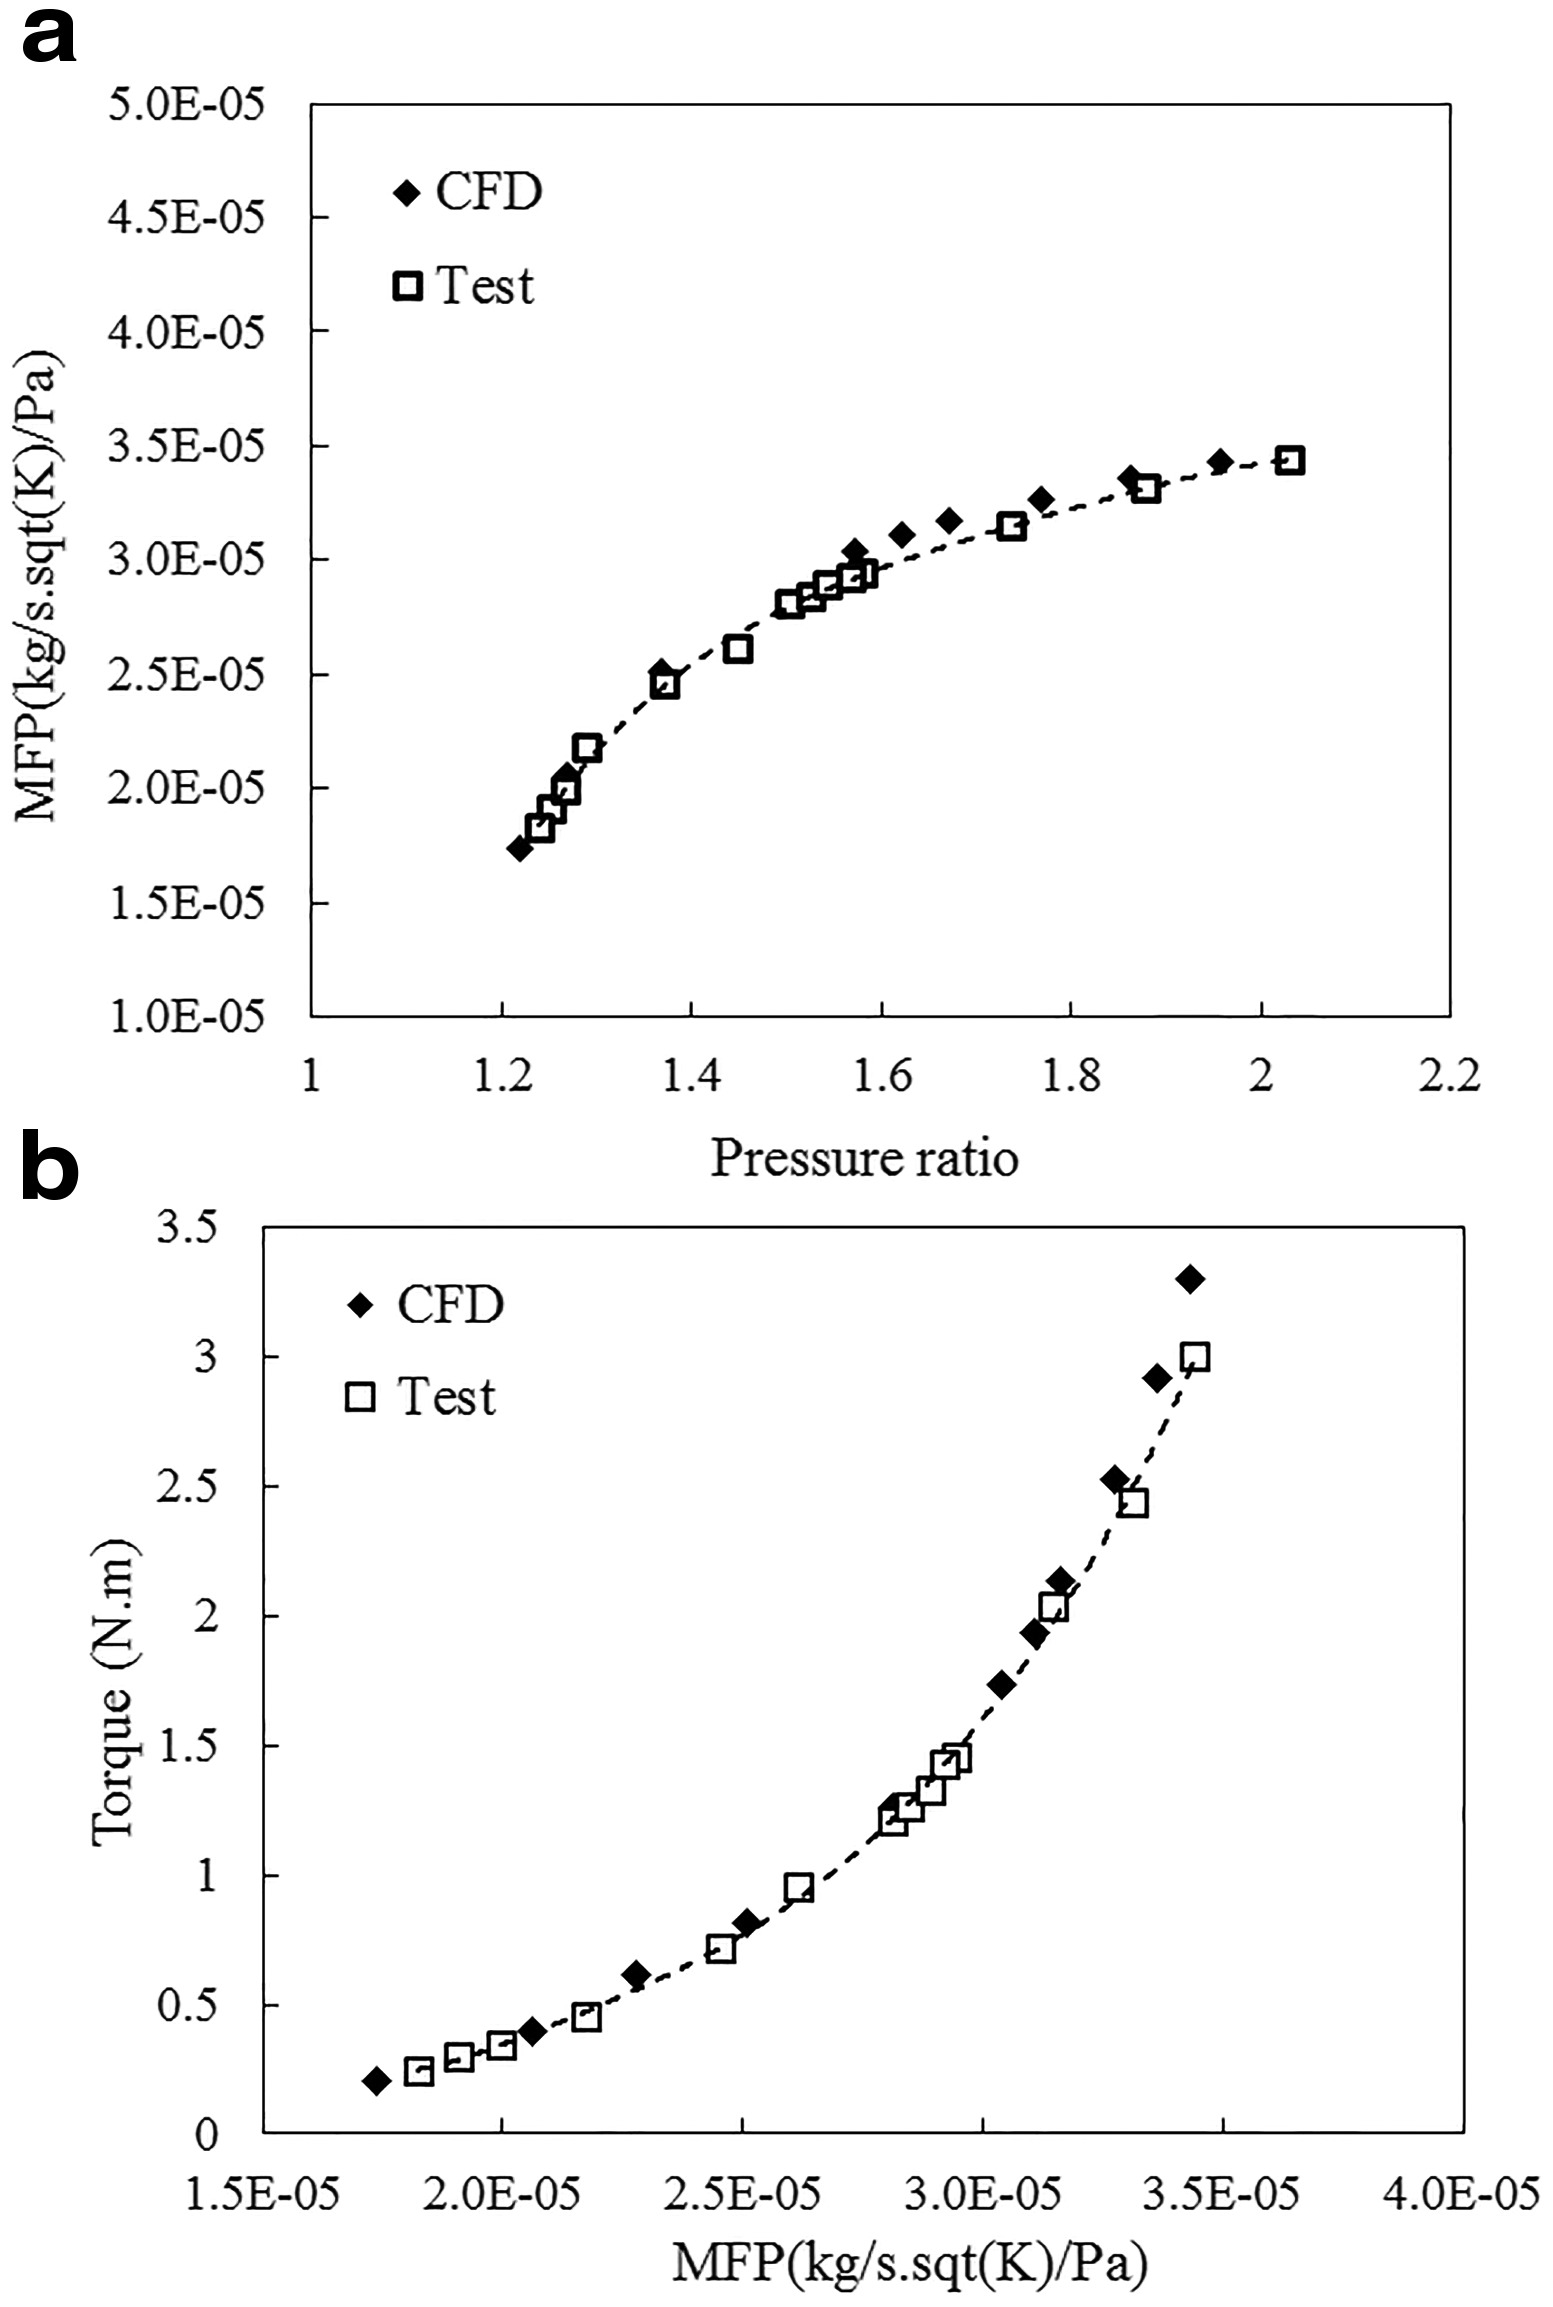
Figure 4 compares the locus of swallowing capacity by prediction and experiment under the pulsating condition at 60 Hz, high load, 50 kRPM. Steady performance is also overlapped in the figure for the comparison. Both the prediction and experimental results encapsulate the steady curve. It can be observed that the maximum MFP is moderately over-predicted by about 6%, while values at the tail of the pulse (low pressure and mass flow rate) are in good accordance with the experiment.
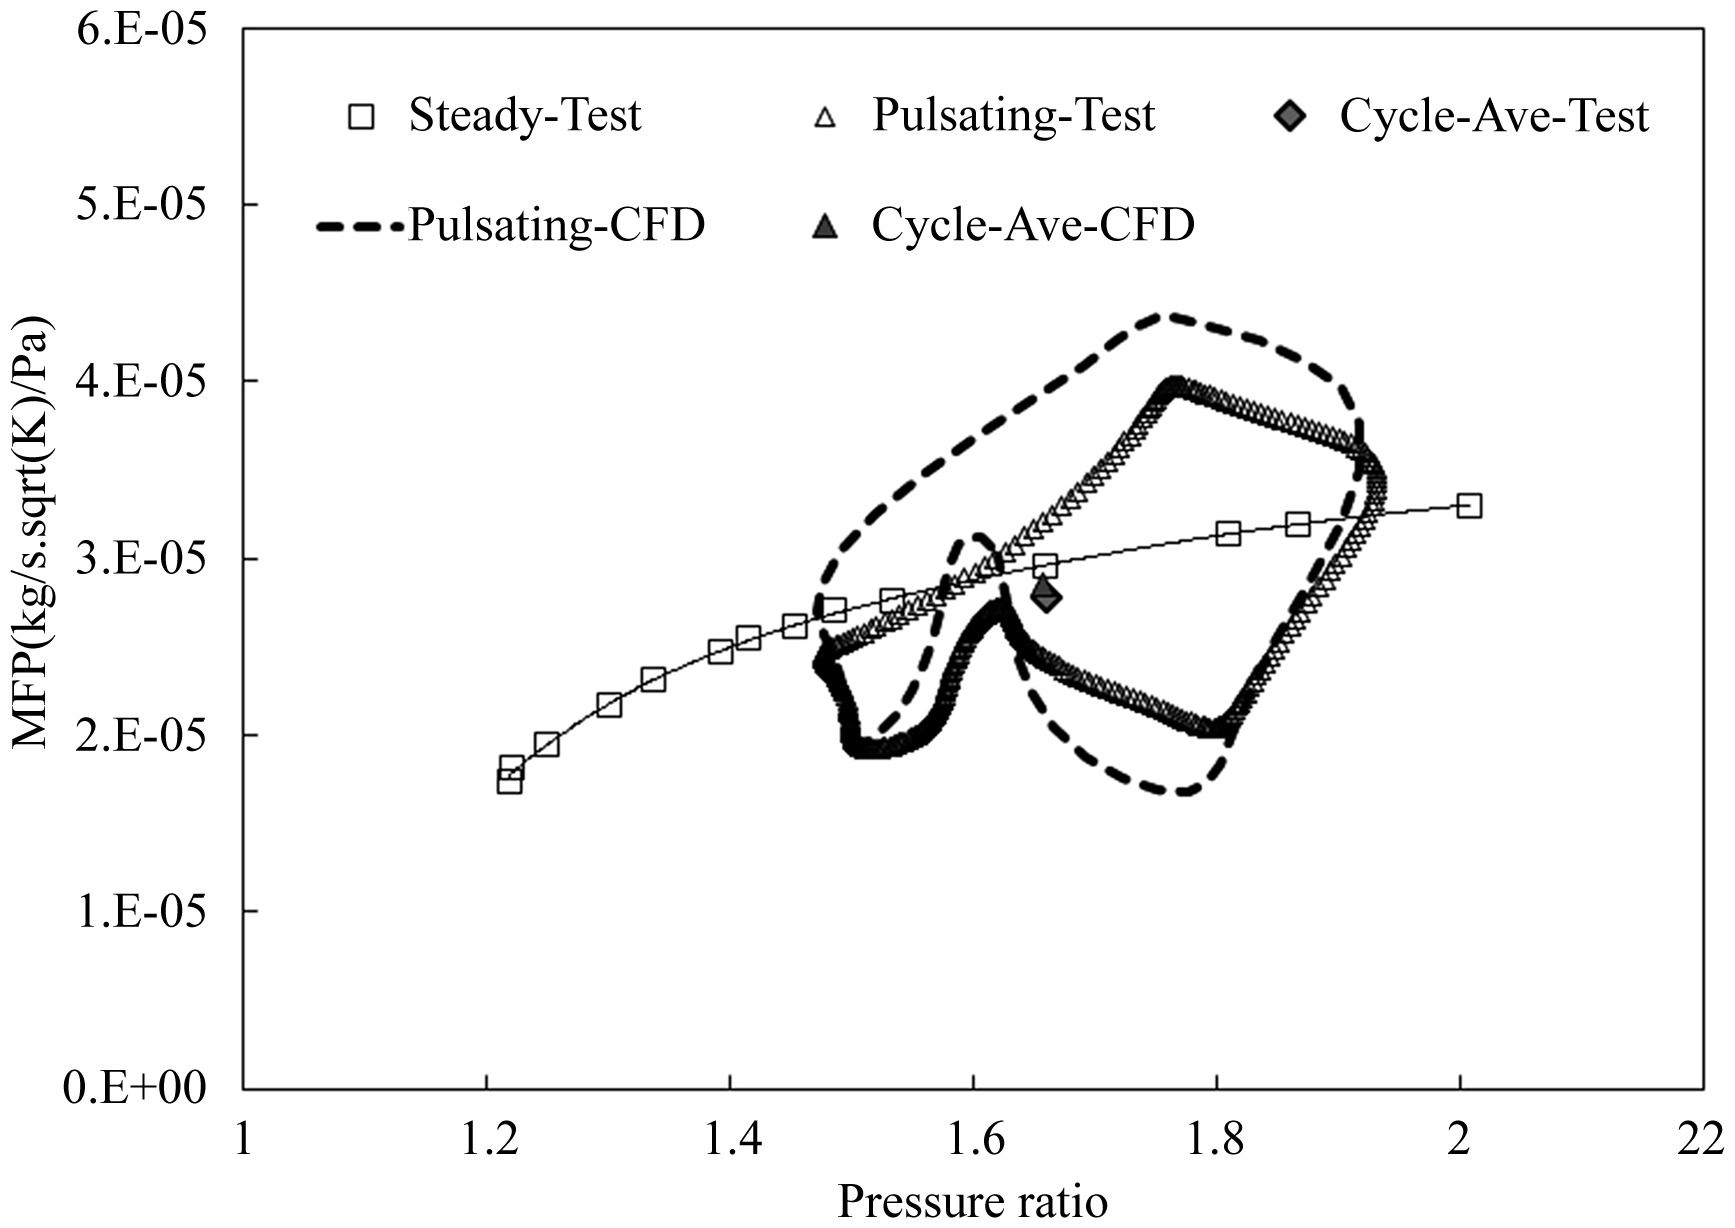
The discrepancy of the magnitude between two results is caused by several reasons, among which the frozen-rotor method applied for the interface treatment is considered to be the main one. The unsteady disturbance on the flow in the rotor caused by the volute tongue cannot be predicted accurately. Moreover, because the location of the rotor is assumed to be “frozen” by this method, the throttling effect of the rotor cannot be captured in high quality, especially for high-frequency pulsating conditions when the interaction is strong. Except for the pulse magnitude, the shape of the loop, which results from the gas dynamics in the turbine, is similar between two results. Specifically, a folder near the tail of the loop which is caused by the wave reflection can be observed at similar location for both the CFD and the experiment. Furthermore, cycle-averaged values which are evaluated via values averaging over the pulse period are also compared. Two averaged values are nearly overlapped with each other, indicating a very good accordance between two results.
According to the comparison between the experiment and CFD, unsteady gas dynamics in the turbine are well captured by the numerical method. Discrepancies are observed for the pulse magnitude of mass flow rate, but they are considered to be in a reasonable tolerance. Furthermore, the flow phenomenon in the volute instead of the rotor is the main interest of the article, which is considered to be in the capability of the numerical method. Therefore, the CFD method is credible for the flow investigation under pulsation conditions.
Pulse propagation in the volute
The volute has the longest length and the largest volume among all components in a turbine and, thus, is the key player for turbine unsteadiness under pulsating conditions. To study conveniently the propagation of a pulse in the volute, a single pulse of pressure and temperature with sinusoidal shape is imposed at the inlet of the turbine. By this simple pulse, the interaction between the reflected backward pulses and the followed forward pulses can be alleviated in the time period of the analysis. Therefore, the development of the pulses can be traced easily; thus, the analysis can be simplified dramatically. Unsteady behaviours of the turbine are predicted by the same CFD method as discussed earlier, except the pulsating inlet boundary conditions.
The shape of the inlet single pulse is shown in Figure 5. The occupation of the pulse period is 1/180 seconds, which is equivalent to pulsating condition with the frequency of 60 Hz in the experiment (the occupation coefficient is three, discussed in reference 09. To be relevant to the real pulse, pulse magnitudes of both the pressure and the temperature are set to be the same with experimental results at the frequency of 60 Hz, high load condition. A period of time (1/180 s) with the steady boundary conditions is experienced before the pulse begins to appear for full development of the steady flow in the turbine; therefore, the appearance of the pulse can be clearly traced in the turbine. The same steady boundaries are also experienced after the period of the single pulse is completed. Furthermore, the steady boundaries are determined by cycle-averaged values from the unsteady experimental measurement. The description of the inlet pulse is also given by Equations (5)–(7). Steady static pressure is imposed as the outlet boundary condition for the convenience.
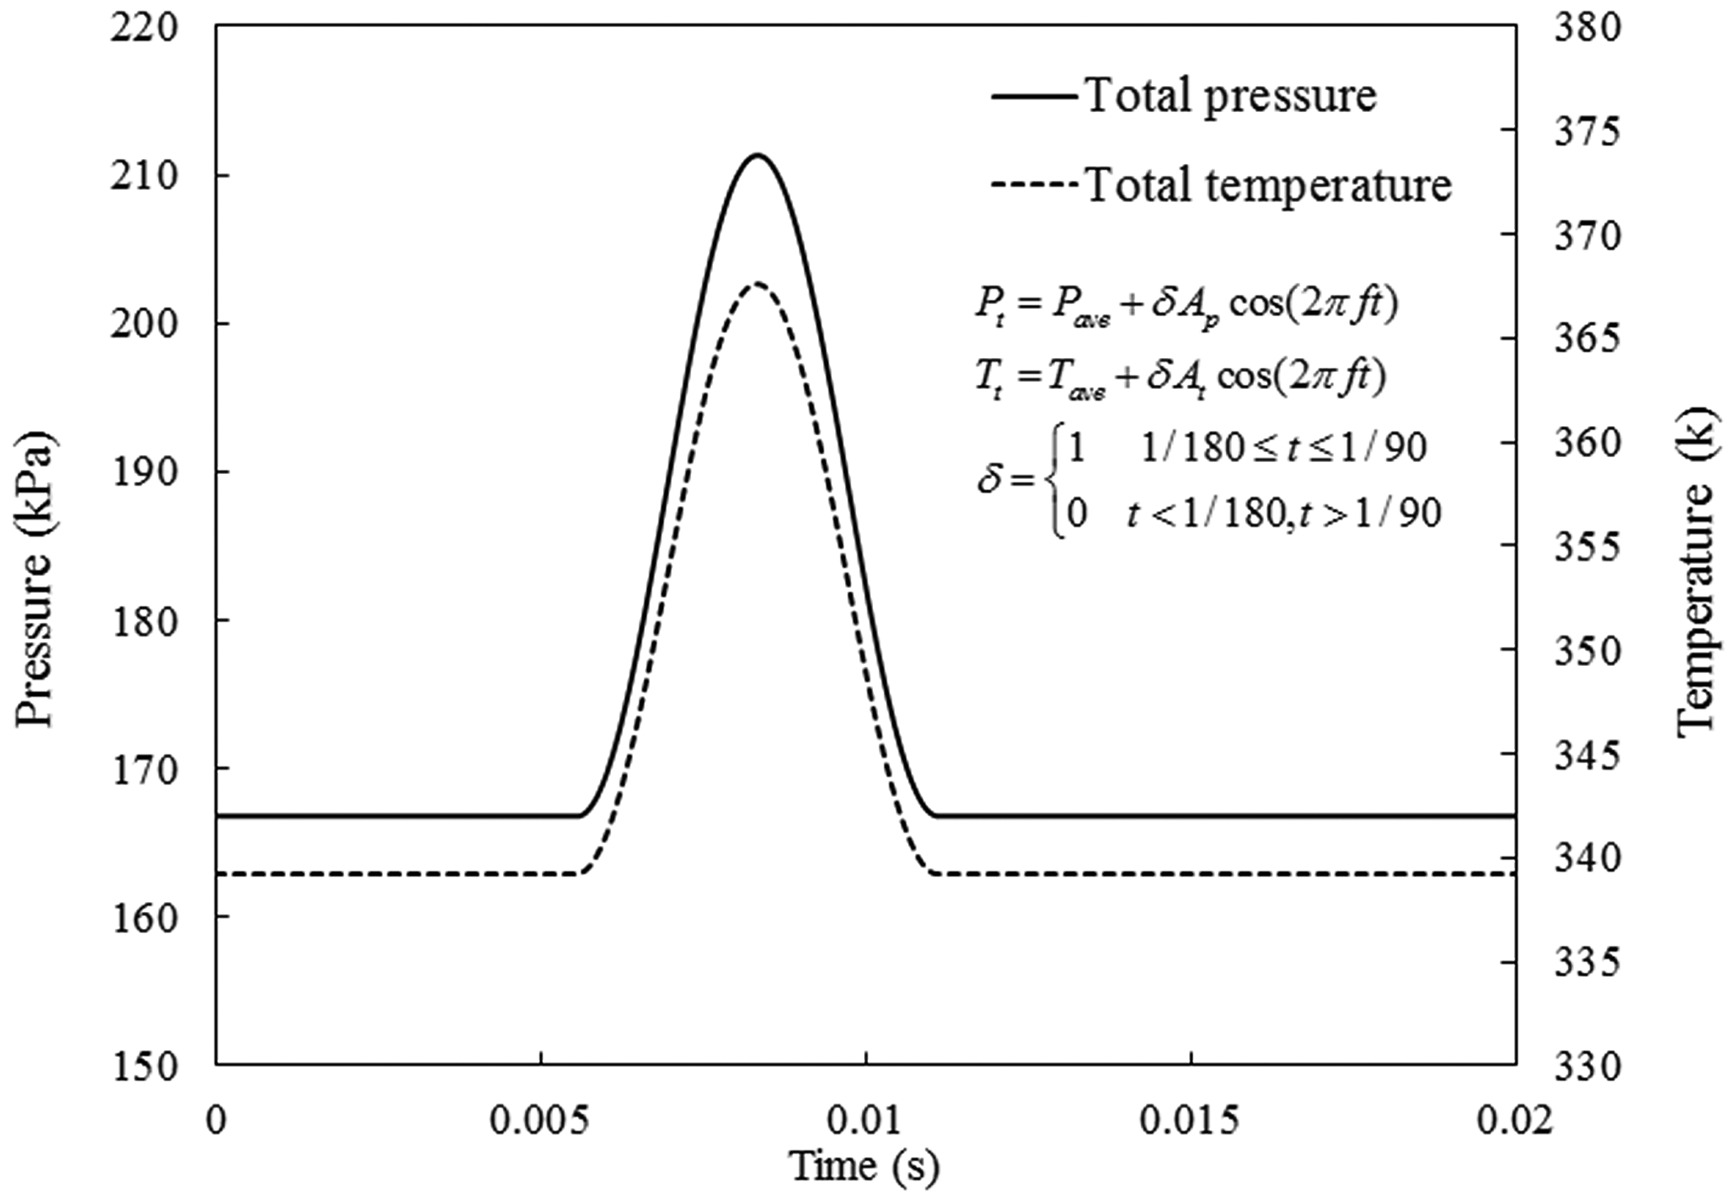
Figure 6 shows variations of different flow parameters versus the time at five different locations, of which four are uniformly distributed (referring as A, B, C, and D) along the volute passage (Figure 6). Distances from these four locations on the volute to the inlet plane are all dimensionless by the value from the inlet to the location D (the maximum distance). All pulses of flow parameters are dimensionless by the corresponding averaged values over the pulse period. To demonstrate the propagation of pulses in the turbine, variations of flow parameters at each location are plotted in the figure. Instead of plotting with actual values in the figure, the pulses at five locations are offset according to the dimensionless distance.
Figure 6.
Instant flow parameters in the turbine. (a) Locations in the volute for flow analysis; (b) pressure; (c) temperature; (d) mass flow rate; (e) output power.
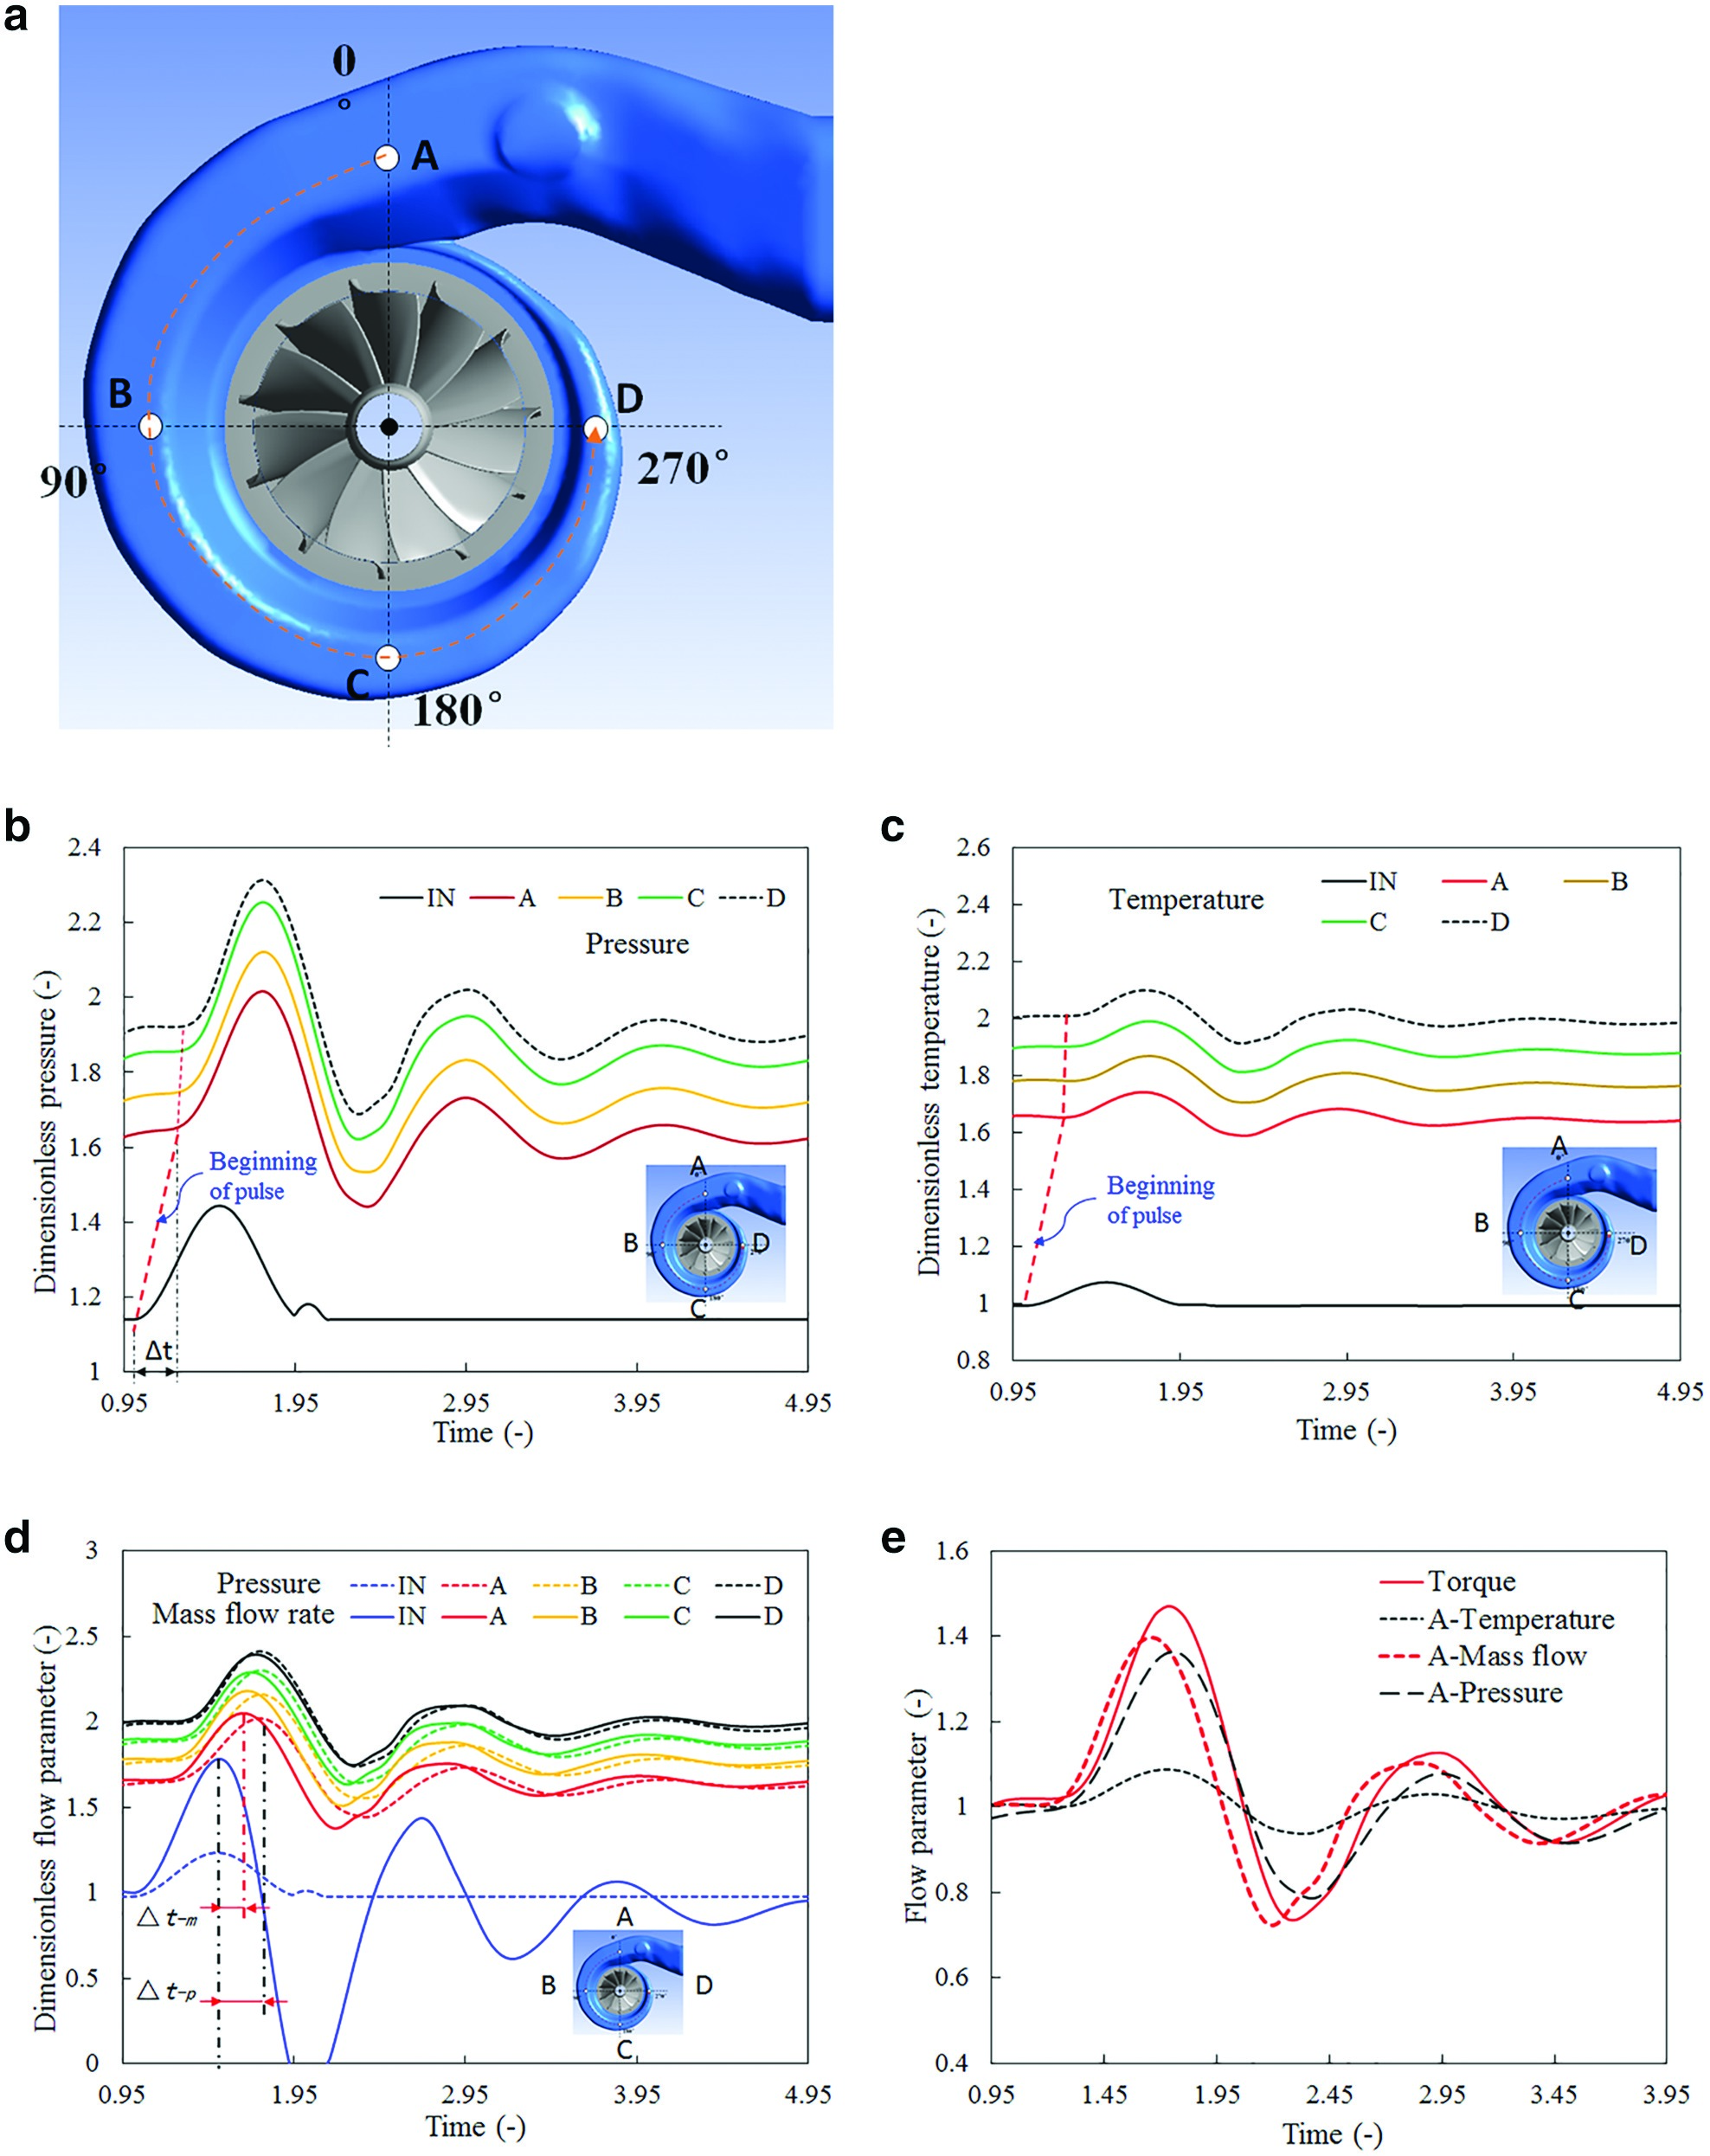
Figure 6 traces variations of the static pressure in turbine. The propagation of the pressure pulse is demonstrated by the phase shift of the pulse at the inlet and other four locations. Furthermore, the speed of the propagation can be evaluated via the time of when pulses begin to appear at each location and the distances among them. Specifically, the speed of the pressure propagation is about 385 m/s on average in the duct, which is similar as the sum of the sonic speed (about 356 m/s) and the bulk velocity (about 40 m/s). It is a direct proof that the pressure pulse travels at the sonic speed plus the bulk velocity. Besides, it can be observed that two fluctuations with smaller magnitudes appear following the main fluctuation. Apparently, they resulted from reflections of the main pulse by the interface of the volute/rotor.
By the scrutiny of the subfigure, an interesting phenomenon can be observed: pulses are nearly in phase among the four locations (A, B, C, and D), although there are considerable distances among them, which is evidently different from the propagation in the inlet duct where an obvious phase shift can be observed. This phenomenon is caused by much larger bulk velocity (about 170 m/s) in the volute passage than in the duct because of significant flow acceleration. As a result, the propagation velocity, which is contributed by the bulk velocity, is much faster than that in the inlet duct. In fact, the phase shift in the passage produced by the propagation is less than one-third of the one in the inlet duct. This phase shift can hardly be captured by the CFD because it is at the similar order of the time step of the numerical method. According to the phenomenon, it can be concluded that the phase shift of the pressure pulse in the volute passage can be ignored, and the pressure in the passage varies almost simultaneously.
Figure 6 shows variations of the temperature at five locations. There is hardly any phase difference between pulses of the pressure and the temperature. Same with the propagation velocity of the pressure pulse, the temperature pulse also travels at the speed as the sum of the sonic speed and the bulk velocity instead of the bulk velocity itself. Therefore, the temperature responses in time with the pressure. This phenomenon implies that the variation of the temperature is not caused by the convection of flow particulars but by the result of the variation of the pressure, which is governed by the state equation of the gas.
Figure 6 shows variations in the mass flow rate at cross-sections at five locations in the volute. Variation of the pressure is overlapped in the figure for comparison. Similar to the pressure, the propagation speed of the mass flow rate in the duct is evaluated by the appearance of the pulse at the inlet and the location A, as shown in the figure. It turns out that the mass flow rate propagates at the same speed as the pressure, which is the sum of the sonic speed and the bulk velocity. Interestingly, peaks of the pressure and the mass flow rate are in phase at the inlet but become out of phase notably as they move downstream to other locations such as A, B, and C. Moreover, the peak of the mass flow rate appears earlier than that of the pressure. The phenomenon seems to contradict with the fact of the same propagation speeds of these two flow parameters. The paradox is actually caused by the interaction between forward-propagating pulses (main pulses) and their reflections. It is worth noticing that the propagation time of the pressure from the inlet to furthest location D is roughly about one-third of the period of the single pulse. It means that the pulse has been reflected and travels backward when the main pulse is still developing at the inlet. The reflected pulse interacts with the main pulse, and hence, their shape can be altered, which has direct influence on the phase of peaks of pulses. Furthermore, the reflection of the mass flow rate is much more evident than that of the pressure, which is indicated by remarkable oscillations of the mass flow rate at the inlet as shown in the subfigure. Therefore, the interaction in the pulse of mass flow rate is stronger than that of the counterpart. The peak of this flow parameter is forced to appear earlier because more portion of the main pulse is counteracted by the massive reflected pulse. As a result, except for the effect of the pulse propagation, the interaction of pulses with their reflections is another important reason for notable phase shift of the mass flow rate at different locations in the volute, as demonstrated in Figure 6.
Finally, Figure 6 overlaps dimensionless mass flow rate, pressure, temperature at the location A in the volute and the output torque by the rotor. A moderate phase shift among four parameters can be observed at the location. As discussed previously, phase difference between the mass flow rate and the pressure or temperature is caused by different behaviours of interactions between main pulses and their reflections. At the meantime, those flow parameters determine the input energy into the rotor; thus; the phase of the energy is between that of the mass flow rate and the pressure or the temperature. Because it has been confirmed that there is a notable phase shift between the mass flow rate at location A and D, there must be a phase shift of the energy pulse at the inlet and the exit of the volute. At the meantime, the rotor has been confirmed as an approximately quasi-steady component; thus, the energy at the rotor inlet is almost in phase with the output power for the component. As a result, the energy fed into the turbine volute must be out of phase with the output power, which is the fact and is confirmed by both simulation and experiments in literatures 08, 13. More importantly, the phenomenon of the out-of-phase is contributed not only by the pulse propagation as previous researchers pointed out but also by the pulse interactions according to the discussions in this section.
Unsteady effects on flow distributions at the inlet of the rotor
The inlet flow condition of the rotor is determined by the flow field coming out of the volute. Therefore, unsteady behaviours of the volute at pulsating conditions influence flow distributions at the rotor inlet and, thus, has direct influence on the performance of the rotor.
Figure 7 shows absolute flow angle distributions in circumferential direction (at 50% blade height) at two instant times referred as A and B, of which the pressure is the same but locations are at different sides of the pulse peak, as shown in the Figure 7. The pressure experiences the increase at time A while the reduction at time B. The important phenomenon that can be observed is that flow distributions are different at those two instant times: the flow angle at time A is evidently higher at most of circumferential locations except for the sections near the volute tongue. It is worth mentioning that the instant pressure and temperature at these corresponding times are the same. The flow angle distributions are expected to be the same if the flow behaves in a quasi-steady way. Therefore, the only reason for those discrepancies is the unsteady effects of the flow in the volute under the pulsating conditions.
Figure 7.
(a) Two instant times with the same pressure at the rotor inlet; (b) absolute flow angle distributions in annulus at two instant times.

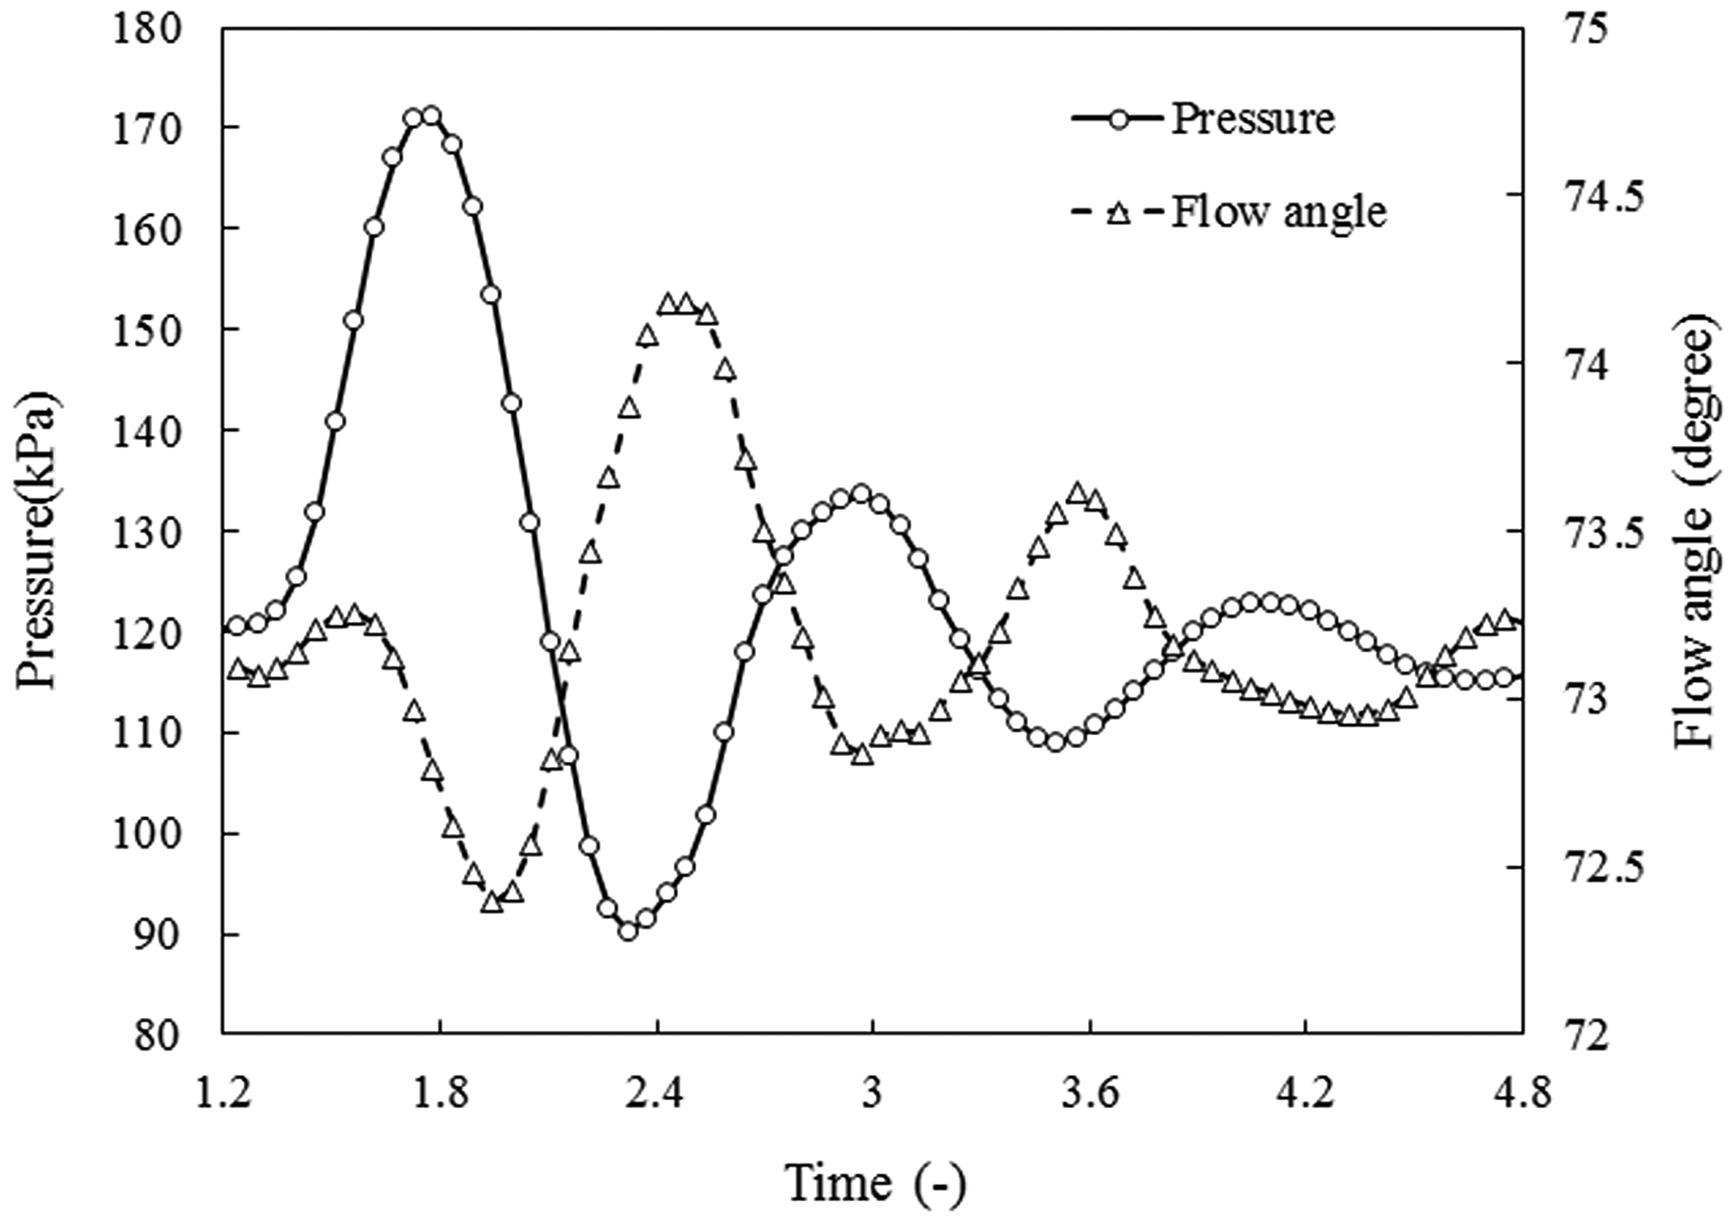
Figure 8 further shows variations of the absolute flow angle and the local pressure at the circumferential angle as 90 degrees and the exit of the volute (2 mm upstream the rotor inlet). It is clearly demonstrated in this figure that the flow angle varies evidently with the time, indicating that the pulsating incoming flow results in an unsteady effect on the absolute flow angle distribution at the exit of the volute. The magnitude of the variation is about 2 degrees from the minimum value as 72.2 degree to the maximum one as 74.3 degree. Because the relative flow angle at the turbine rotor inlet is very sensitive to the absolute flow angle, the variation of the latter one as 2 degrees will be amplified dramatically for the relative inlet flow angle. As a result, this flow angle fluctuation at the volute exit will result in evident influence on the flow capacity and even the efficiency. Importantly, it is observed from the figure that the variation of the flow angle is evidently out of phase with the pressure at the same location, which is profoundly different from behaviours of the temperature or the mass flow rate as discussed previously. The mechanism of this unsteady behaviour of the absolute flow angle distribution at the volute exit is going to be discussed in the following sections.
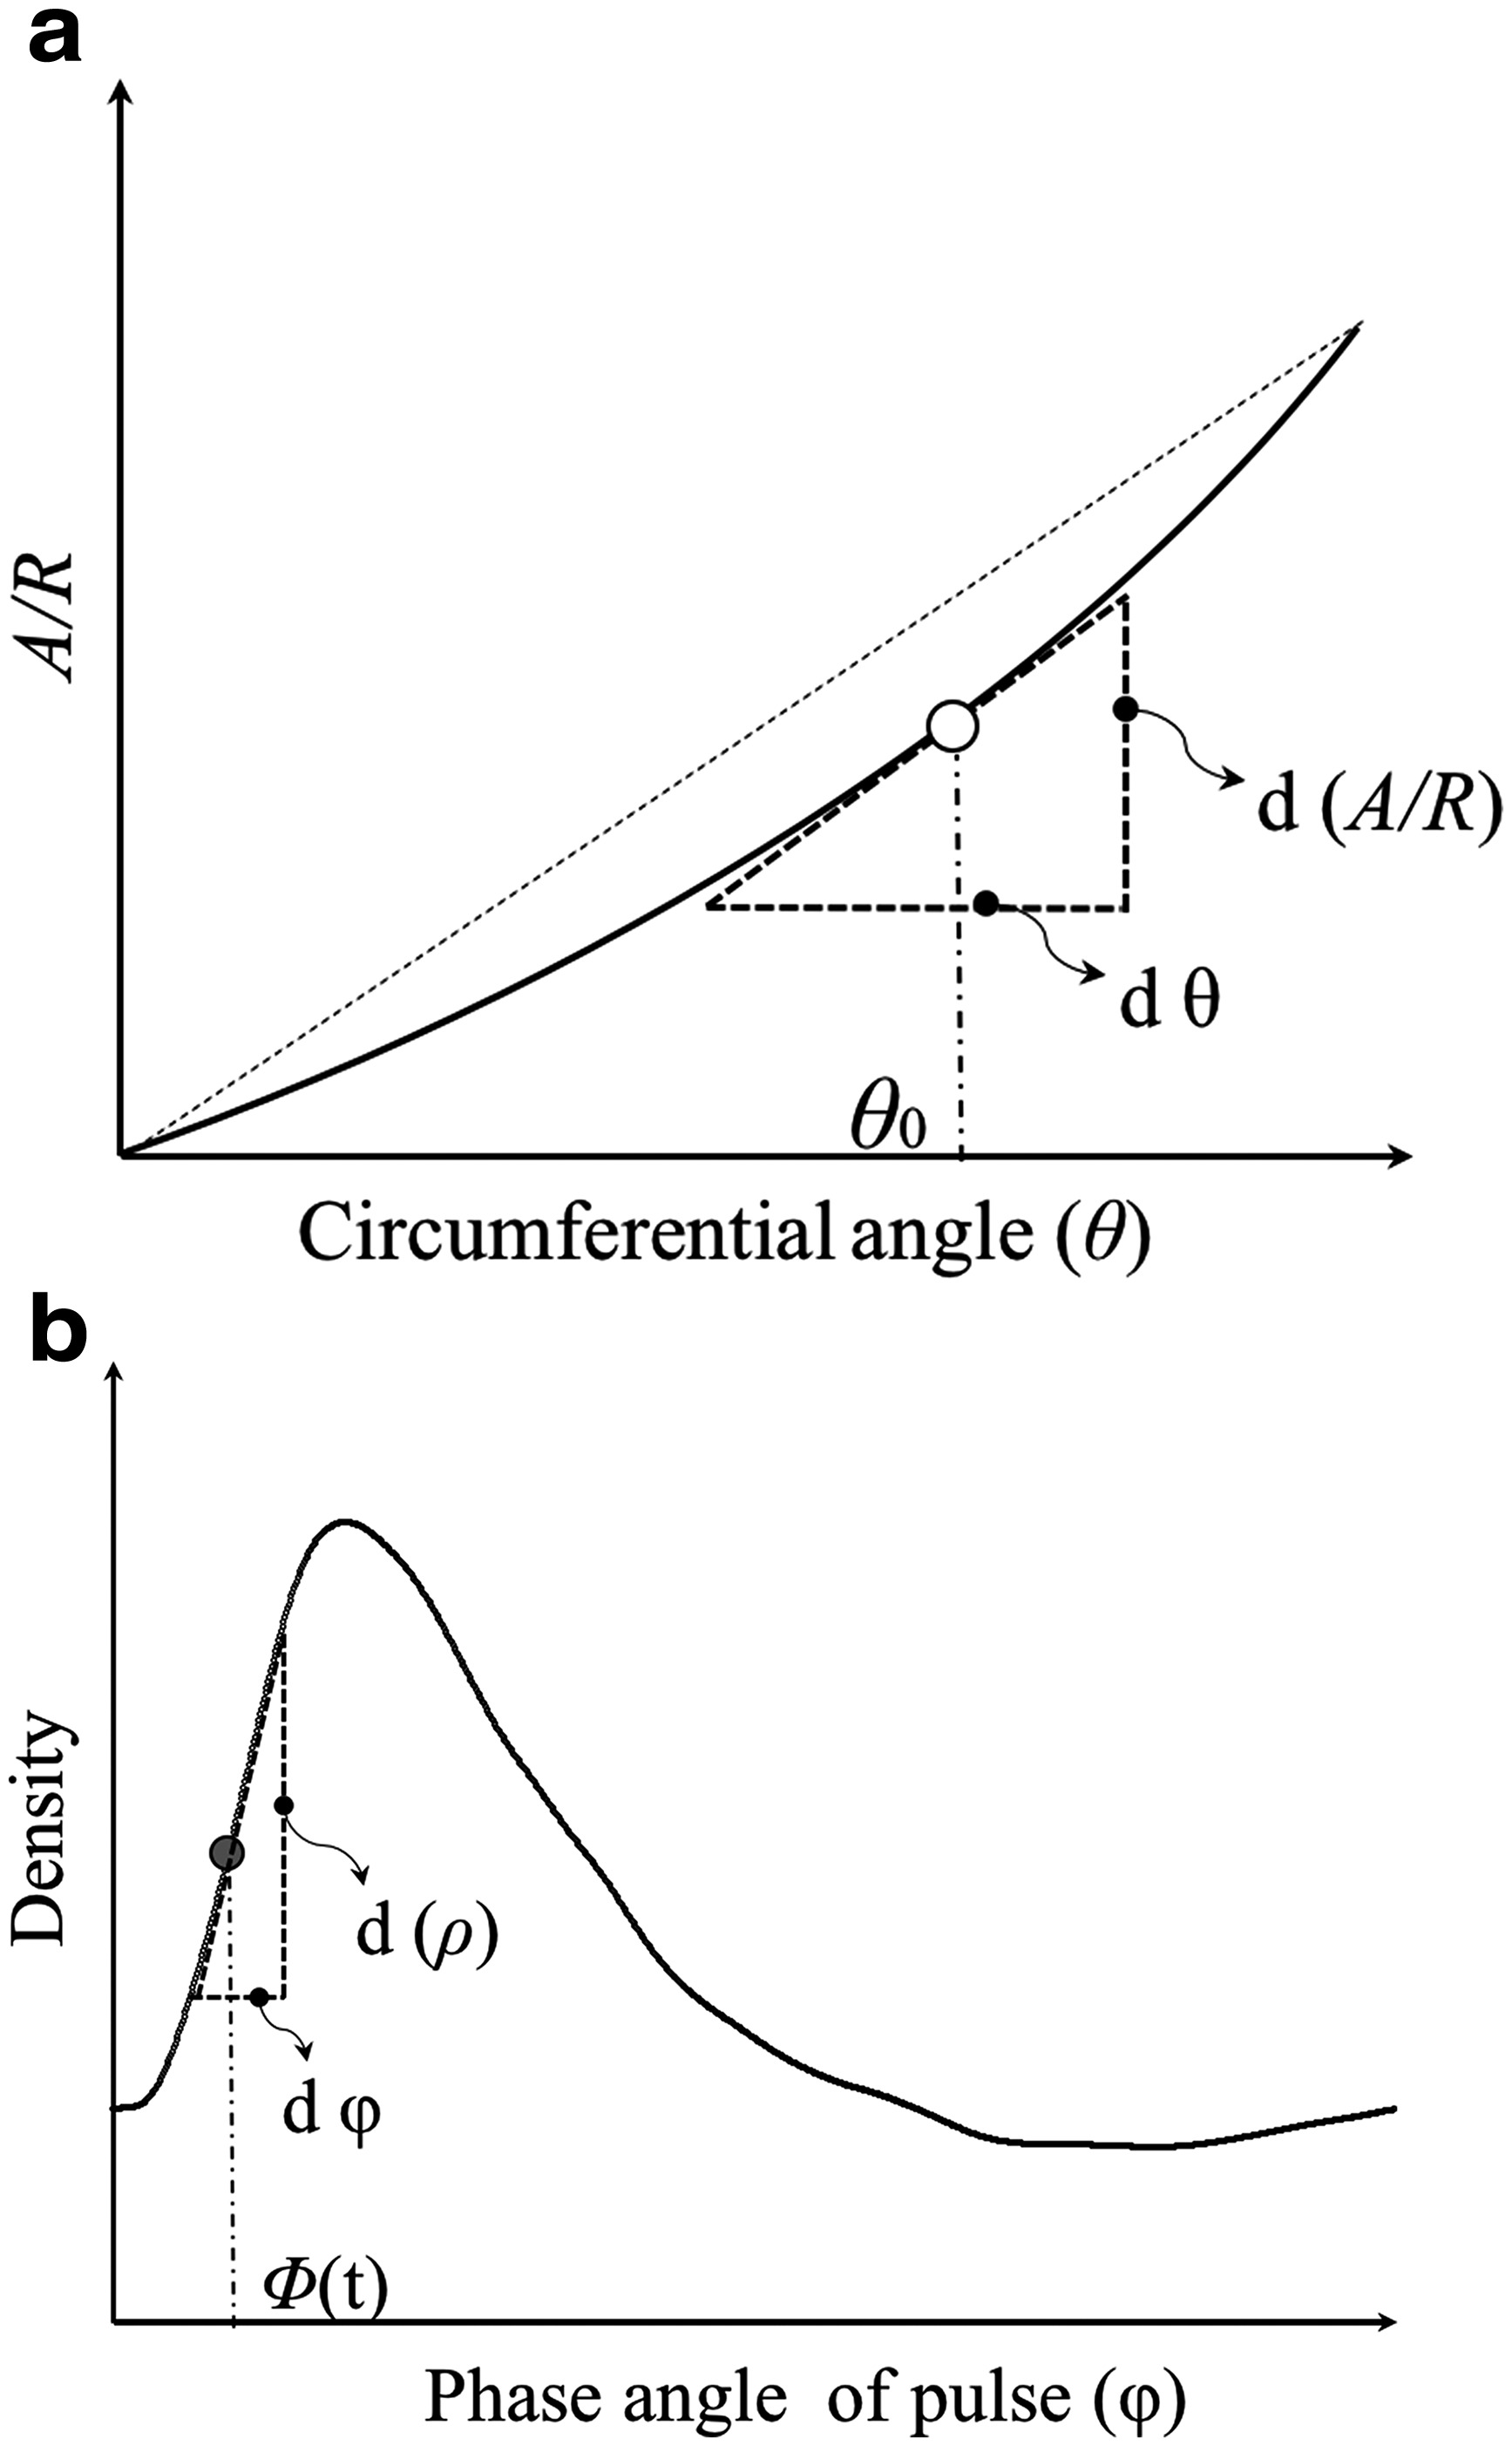
The ratio of the section area (A) divided by its area centre (Rc) is the most important geometrical parameter for a turbocharger volute. This ratio determines the direction of flow fed into the turbine rotor and, thus, the swallowing capacity and the efficiency of the turbine. Usually, the flow in a volute is assumed to be distributed uniformly in annulus and governed by the conservation of angular momentum (free vortex). The mass flow rates coming in and leaving a sector of the volute are balanced at every moment (so-called mass flow rate equilibrium). Therefore, linear distributed A/Rc in circumferential direction can be deduced from those two assumptions. This forms the fundament of the volute theory and conventional methodology of design. However, according to previous discussions, it has been confirmed that the mass flow rate equilibrium is not valid anymore because of the variation of mass flow rate under pulsating conditions, especially for highly unsteady flow conditions. Unsteady effects on flow distributions in the volute are resulted by pulsating conditions. As a result, the conventional correlation between A/Rc and the flow angle at exit of the volute which is based on the steady situation is not valid for pulsating conditions. New correlation has to be developed based on the unsteady conditions.
A sector of the volute with a small circumferential angle dθ is shown in Figure 9.
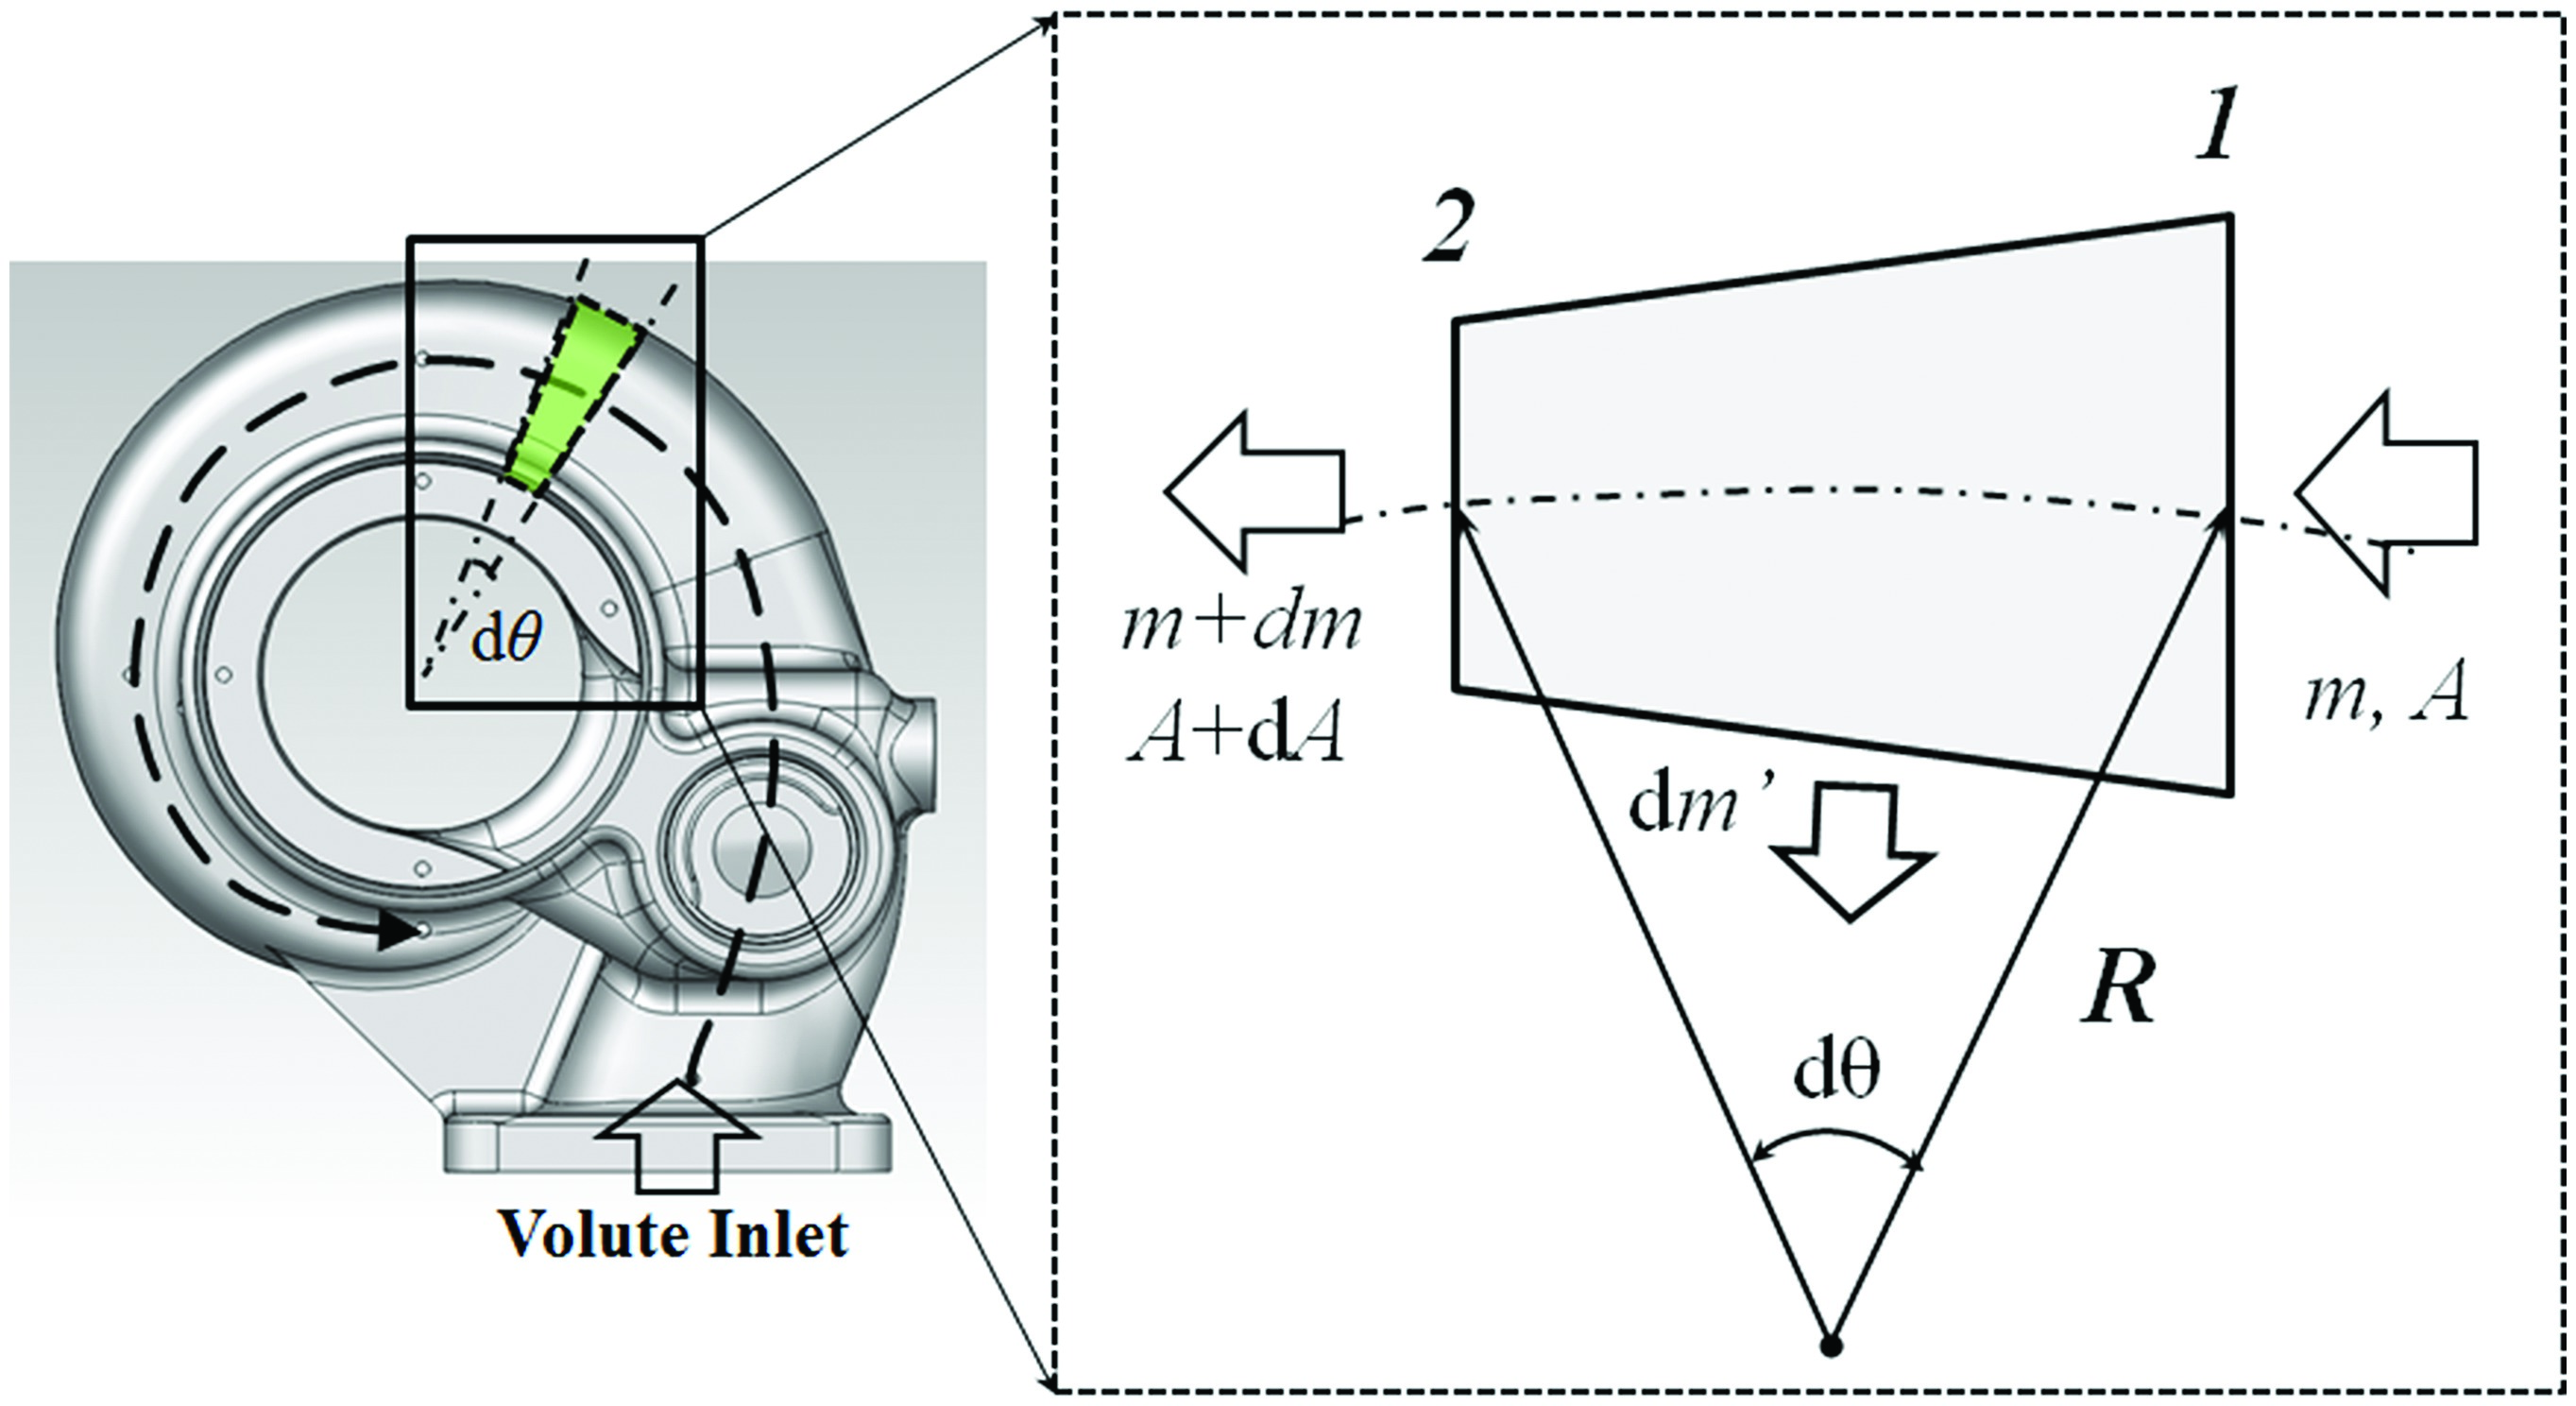
Mass conservation equation in the section is
where
For the control volume, the variation of the mass flow rate can be further calculated as
According to the angular momentum conservation,
Combining Equations (8)–(10) and state equation of perfect gas, the following equation can be deduced:
where α is the absolute flow angle at the exit of the volute.
This equation describes the relation of the volute configuration and the pulsating condition with the exit flow angle. The first item on the right side of the equation is the impact of the geometrical parameter A/Rc on the flow at certain annulus location of the volute exit. This geometrical item determines the flow distribution at both steady and pulsating conditions. In the conventional volute theory, A/Rc at the throat is considered to be the key parameter for the volute, which determines the flow angle at the exit. However, it can be seen from the equation that it is the local gradient of A/Rc distribution
Importantly, the second item on the right side is the impact of the pulsating flow on the flow angle at the volute exit. The gradient of the pressure divided by the temperature
Figure 10.
Impact on the flow angle by the volute under pulsating conditions. (a) Effect of geometrical parameter; (b) unsteady effect by pulse.
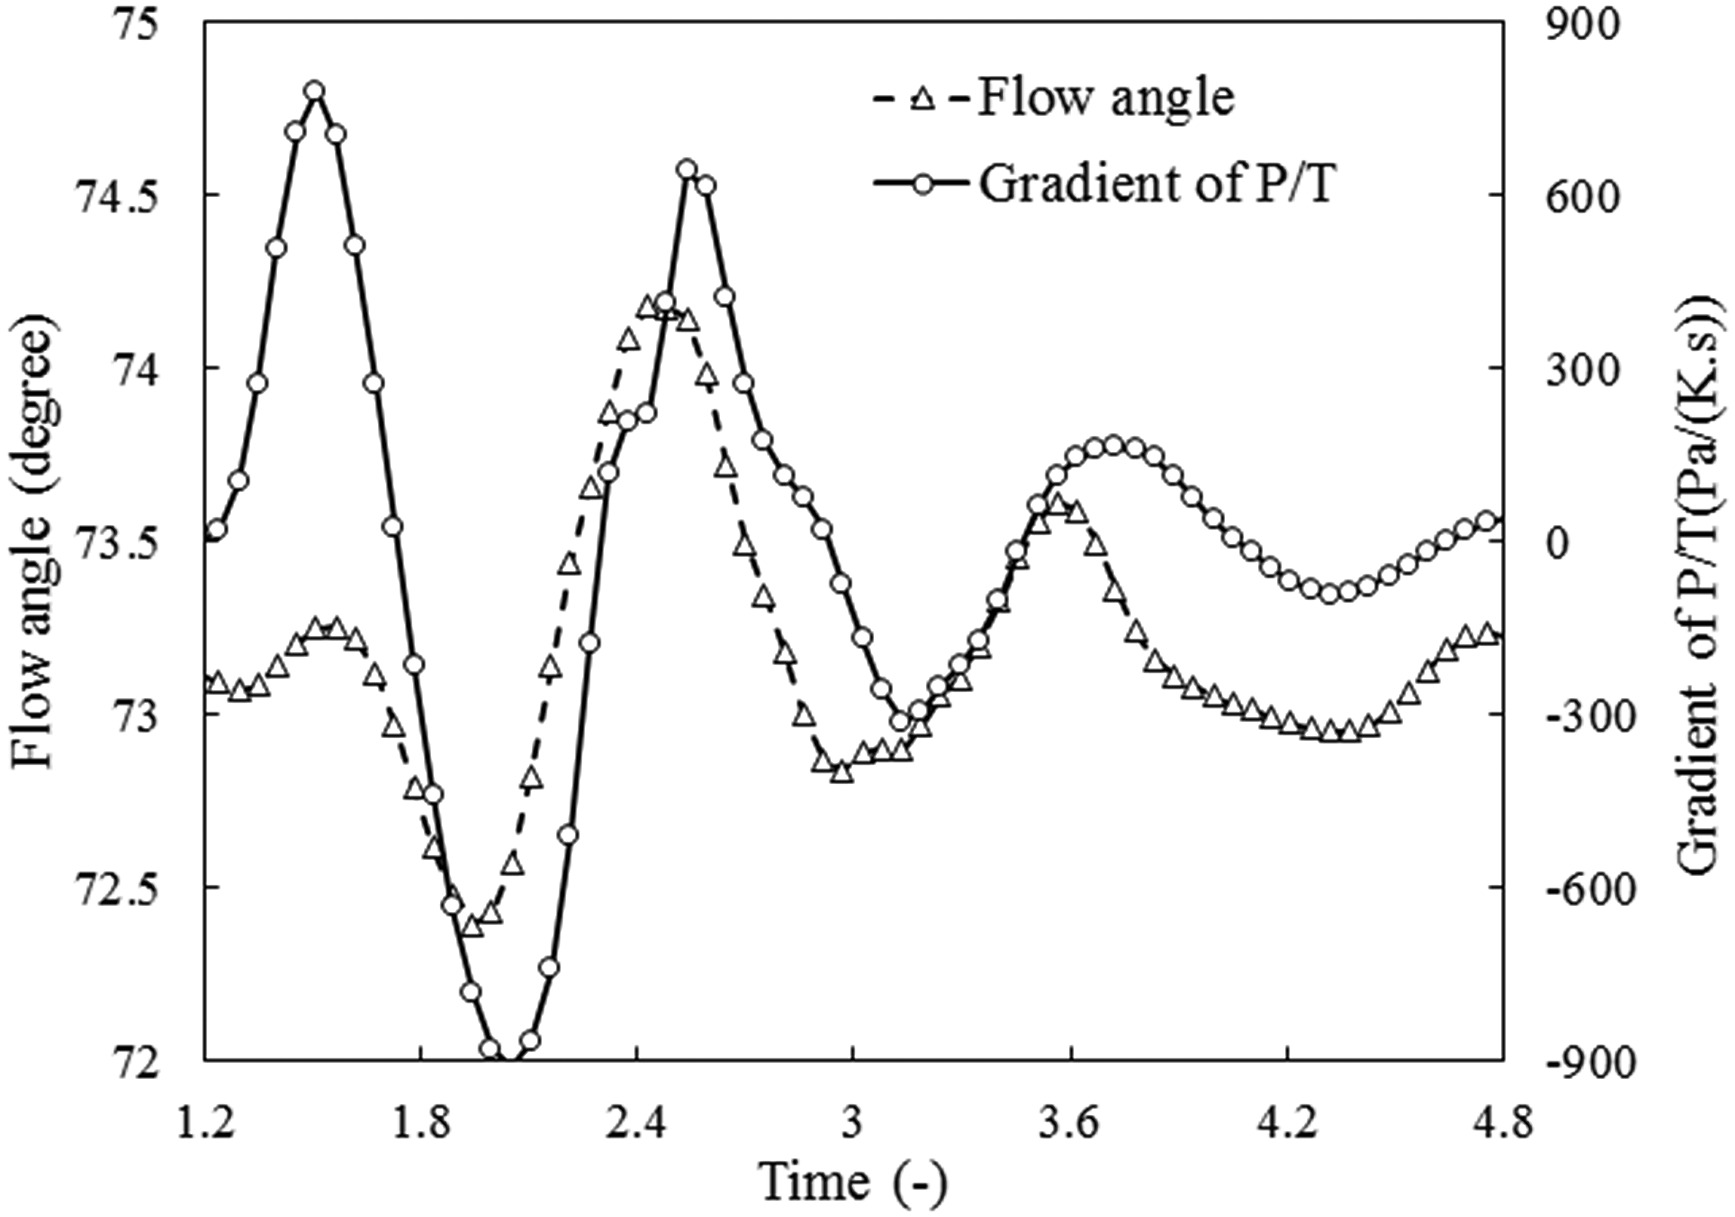
The analytical model is further applied for the understanding of flow behaviours in the volute as discussed in Figure 7 and Figure 8. In Figure 7, the gradient is positive for the instant time A but negative for B. According to the model (), the contribution by the pulsating flow to the flow angle is positive for the time A but negative for time B. As a result, the absolute flow angle is evidently higher for the former, which is demonstrated in the figure. Moreover, the unsteady effect on the flow angle is proportional to the gradient of the pulsating flow parameter P/T. Therefore, the unsteady flow angle should be in phase with the gradient of the parameter instead of the parameter itself. Figure 11 shows flow angle variations and the gradient of P/T. It can be seen that the two flow parameters are almost in phase, which is a direct comparison with the phenomenon in Figure 8 and, thus, is a satisfied proof of the analytical model.
Conclusions
A turbocharger turbine is confronted by pulsating flow conditions due to reciprocating internal combustion engine. To improve the turbine performance in the real operational environment, it is important to understand the flow phenomenon happening in the turbine under such highly unsteady conditions. This article investigates unsteady behaviours of the volute under pulsating conditions via validated numerical and analytical method. Three conclusions can be drawn from the investigation:
1. The pulses of pressure, the temperature, and the mass flow rate all propagate at the velocity as the sum of sonic speed and the bulk velocity. The mass flow rate is out of phase with other two flow parameters because of the interaction of the forward main pulse with its backward reflection. As a result, the phenomenon that the input power at the volute inlet is out of phase with output power is contributed by both the pulse propagation and the behaviour of the interaction.
2. The pulsating flow imposes an evident unsteady effect on the absolute flow angle at the exit of the volute. The magnitude of the flow angle variation is about 2 degrees and out of phase with the pressure for the current pulsating condition.
3. The analytical model is established for the absolute flow angle at the exit of the volute at unsteady conditions. The absolute flow angle at volute exit is determined by two factors at pulsating conditions: the geometrical parameter
It is well known that a relatively small variation of the absolute flow angle upstream the turbine rotor can produce a significant variation of the relative flow angle at the inlet of the rotor. Therefore, the unsteady effect on the flow angle at the volute exit further enhances fluctuations of incidence angle at turbine rotor inlet. As a result, turbine performance is profoundly influenced by pulsating conditions, which cannot be experienced at steady conditions. It is implied from the study that the conventional guideline for volute design which is based on the assumption of mass balance might be mended for the application of pulsating conditions.
Nomenclature
A
Area
mm2
Ap
Magnitude of pressure pulse
Pa
At
Magnitude of temperature pulse
K
b
Blade height at inlet
Mm
C
Flow velocity
m/s
CFD
Computational fluid dynamic
-
Cp
Specific heat
J/(kg.°C)
f
Frequency
Hz
K
Constant
MFP
Mass flow rate parameter
kg/s.√K/Pa
m
Mass flow rate
kg/s
P
Pressure
Pa
PR
Pressure ratio
-
Rc
Radius of the area centre
Mm
T
Temperature
K
t
Time
S
U
Blade speed
m/s
VR
Velocity ratio
-