Introduction
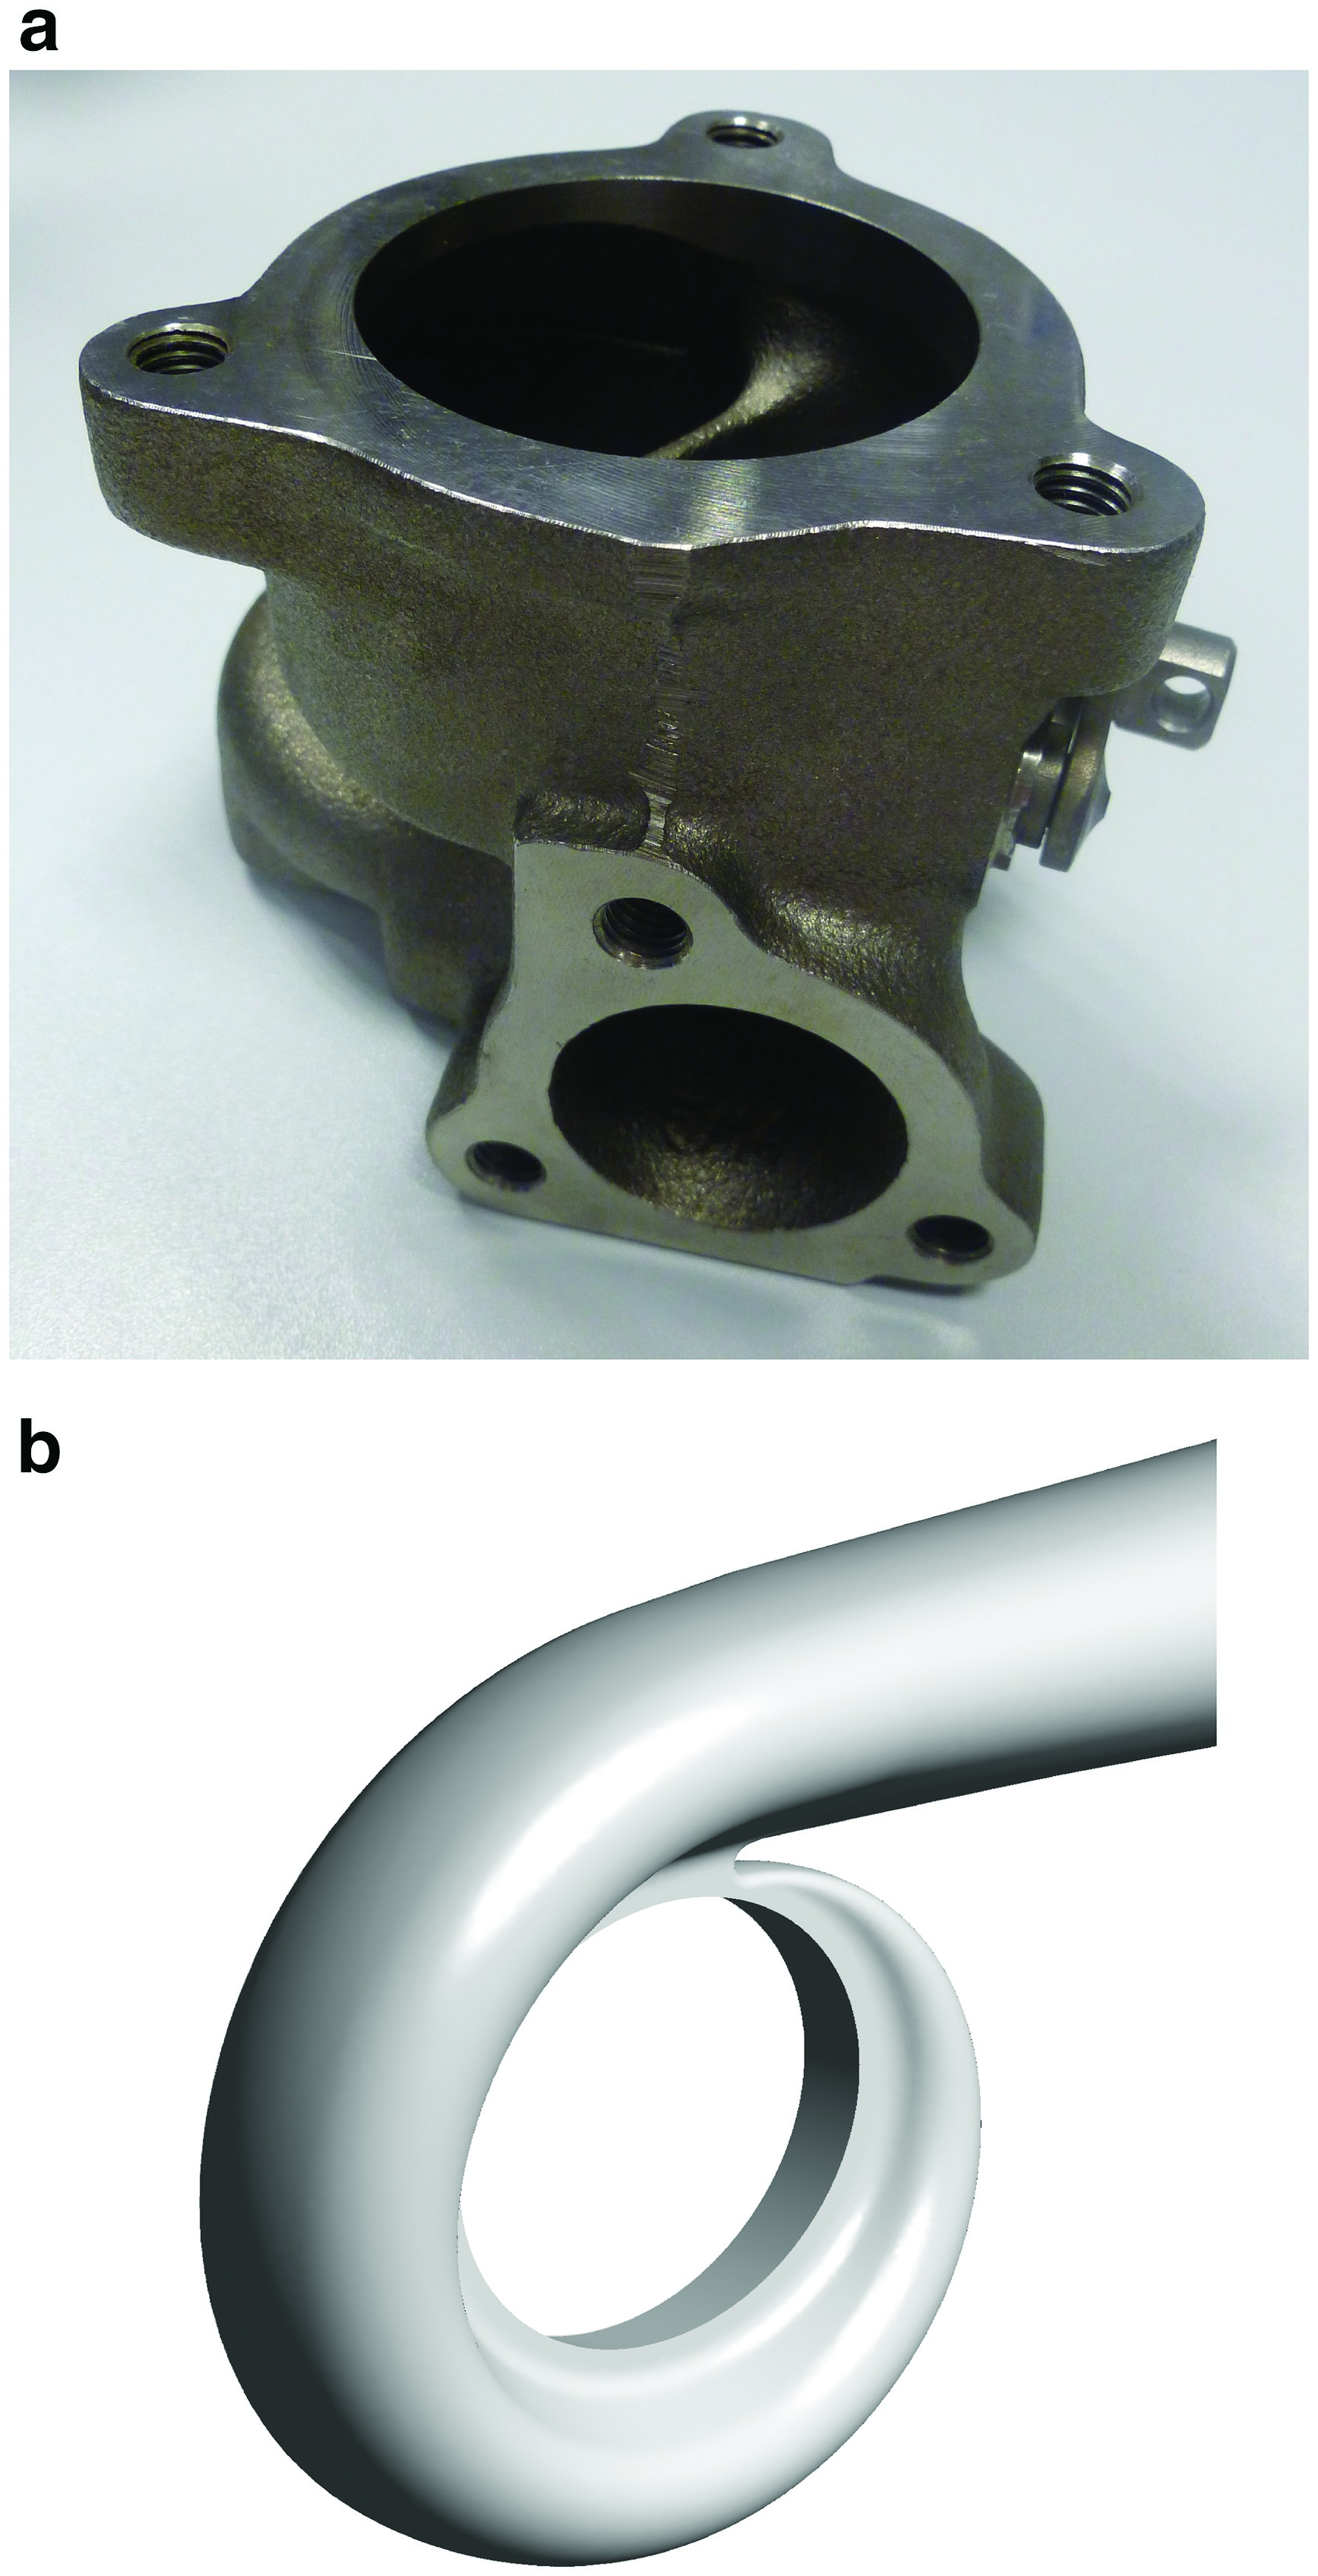
Today, turbine housings for automotive turbochargers (an example is shown in Figure 1) are in most cases produced by sand casting and subsequent shot blasting or similar cleaning processes. The surface quality of the casting mainly depends on the quality of the sand core and the coating. Compared with other turbine components such as wheels and vanes, the resulting surface roughness of the housing is many times higher. Nevertheless, it is unclear how the turbine performance is affected by volute surface roughness in general and what roughness level is necessary in order to achieve the best turbine efficiency at acceptable costs. BorgWarner’s continuous effort to improve turbine performance therefore involves the volute surface quality. In order to ensure that current targets for power and emissions are met, extensive studies are conducted, the findings of which facilitate the precise development of the manufacturing processes required.
Figure 1.
(a) Steel casting turbine housing for automotive turbocharger and (b) CAD model of mono-scroll volute.
The main challenge in assessing roughness effects in small turbocharger turbines by means of hot gas stand (HGS) testing is to ensure high geometric accuracy of the housing volutes. Only then is it possible to attribute the measured differences in efficiency to differences in surface roughness. CFD simulations are a valuable tool to complement the experimental results, as the geometry can be controlled very accurately in the simulation model.
In order to account for surface roughness effects in CFD simulations, one requires a rule for the conversion of measured roughness values into sand grain roughness. This conversion has been described in several publications, especially for large gas and steam turbines. In his review paper, 03 quotes values between k/Ra = 2 and k/Ra = 10. 01 present conversion rules for sand grain roughness from three measured roughness parameters (e.g., k/Ra = 5.9), which are tested with flow experiments using water as the flow medium.
The Moody diagram 06 is widely used in order to estimate the friction coefficient in pipe flows from Reynolds number and a relative roughness. The diagram is based on pipe flow experiments using sand paper on the walls, the average diameter of the sand grains serving as the relative roughness. 05 revised the experiments and the author points out that the Moody diagram was merely intended for simple estimations, as it contains quite a few simplifications. Apart from the basic studies described above, hardly any results have been published regarding surface roughness values and flow regimes of interest for turbocharger applications. To the knowledge of the author, there is currently no publication available dealing specifically with the effects of surface roughness on the aerodynamic performance of turbines for automotive turbochargers.
The present study is set out to answer the following questions:
1. Can the effects of surface roughness on turbine performance be reliably predicted by modified RANS CFD simulations?
2. What effect does the volute surface roughness have on the volute and rotor flow?
3. Is stage efficiency more sensitive to roughness changes in specific parts of the volute?
4. What is the potential penalty in case of increased volute surface roughness and which mono-scroll applications are most sensitive to changes in roughness levels?
The work is based on the measurement of pressure loss over a simple pipe in order to determine the effects of surface roughness on the flow in a geometrically well-defined experiment. The sand grain roughness coefficient for the CFD simulation is calibrated against the results of the pipe measurements. This CFD roughness model is validated by comparison of turbine stage CFD results with HGS results. The origin of the additional loss and the changes to the flow field due to changes in surface roughness are examined in detail. Further CFD studies are conducted using the calibrated roughness model in order to assess the effects of surface roughness in mono-scroll volutes on the steady-state turbine performance.
Surface roughness measurements
Stylus roughness measurements conforming to DIN EN ISO4288 are unfeasible in most turbine housings due to geometric constraints. It is virtually impossible to find a region in the volute that facilitates a measurement over a straight line long enough to comply with the norm specifications. Even if this is possible, no measurement of local roughness around the circumference is possible, the result will only be an average along a line. Local measurements are desirable as they enable the characterization of significant aerodynamic effects of surface roughness in the volute.
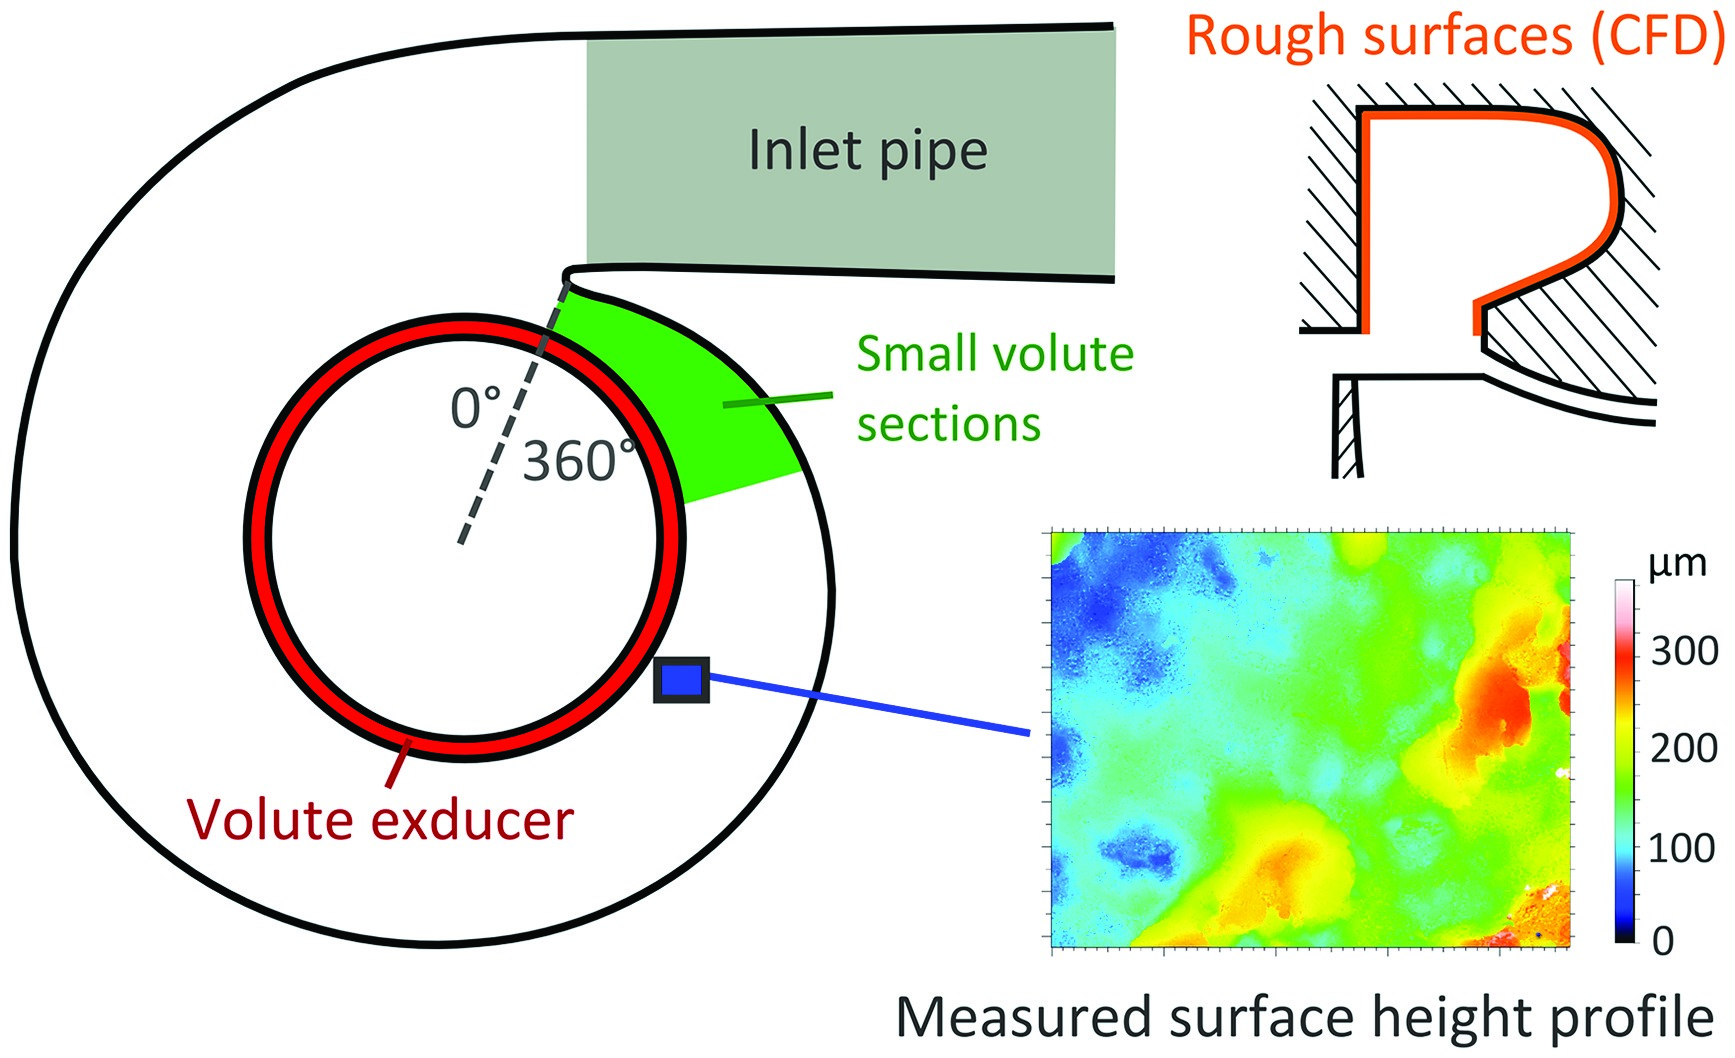
In order to ensure reliable roughness measurements in all possible turbine housing geometries and to enable local measurements of surface roughness, an optical measurement method is used in the present study. Contactless topographical measurements at ten circumferential positions around the volute are obtained by means of a confocal scanning microscope (Zeiss Axio CSM 700). The measured topography is shape-filtered using a second-order polynomial in order to obtain the surface’s height profile (see example in Figure 2).
Model calibration — Pipe measurements
The relationship between technical roughness values and the sand grain roughness to be used in the flow simulations is derived from pressure loss measurements over straight pipes. These are cast varying several parameters, such as cast material, sand grain size of the core and casting velocity, in order to obtain surfaces of different roughness levels. The roughness of the inner pipe surface is measured using the optical method described in the preceding section. These roughness values are then matched to the pressure loss over the respective pipe.
The pressure loss measurements are conducted at Reynolds numbers between 20,000 and 200,000 in a test rig featuring a smooth inlet pipe of 3 m length, so that fully developed turbulent boundary layers are achieved. The air is sucked through the measurement section (length 400 mm, diameter 50 mm) from a low-pressure chamber downstream. Pressure transducers are used upstream and downstream of the measurement section with three pressure tappings around the circumference.
The Computer-Aided Design (CAD) model of the rig serves as the basis of the CFD calibration, resulting in a correlation between the CFD roughness coefficient and the measured surface roughness. Relatively large uncertainties arise due to the roughness distribution on the pipe surfaces and due to the relatively short measurement length, leading to small pressure loss. It is therefore felt that the validity of the calibration is still questionable. Hence, two suitable turbine test cases are examined in the present study for further validation. They include roughness measurements, computed tomography (CT) scans of the turbine housings and HGS results. These test cases increase the confidence in the calibration so that it can be applied to turbine flow simulations in order to assess the effects of volute roughness on the flow field.
Throughout this paper, the correlation derived from the pipe measurements is used for the calculation of the technical roughness equivalent to the sand grain roughness used in the simulations. Roughness values are presented relative to a reference Sa,ref (see ) which is deemed representative of current volute surfaces in steel casting turbine housings from series production.
Computational setup
All the simulation results in the present paper are obtained from steady-state RANS CFD simulations, using the commercial package Ansys® CFX, Release 16.2. The turbine stages’ nominal geometry serves as the input for the simulation setups. For the volute domain and the exit domain downstream of the turbine wheels, Ansys® Meshing is used to generate tetrahedral/prism grids. The rotor domain features a structured hexahedral grid, generated in Turbogrid (see Figure 3). Grid point numbers are 800,000 in the volute, 2,500,000 in the rotor domain and 700,000 in the exit domain. These values are based on the results of a sensitivity study with variations of the grid density in each of the three domains. The number of grid points is selected so that the stage efficiency varies by less than 0.1% between the selected and the next finer mesh. The grid quality criteria are kept in the following ranges: orthogonality angle >20, expansion factor <20 and aspect ratio <80.

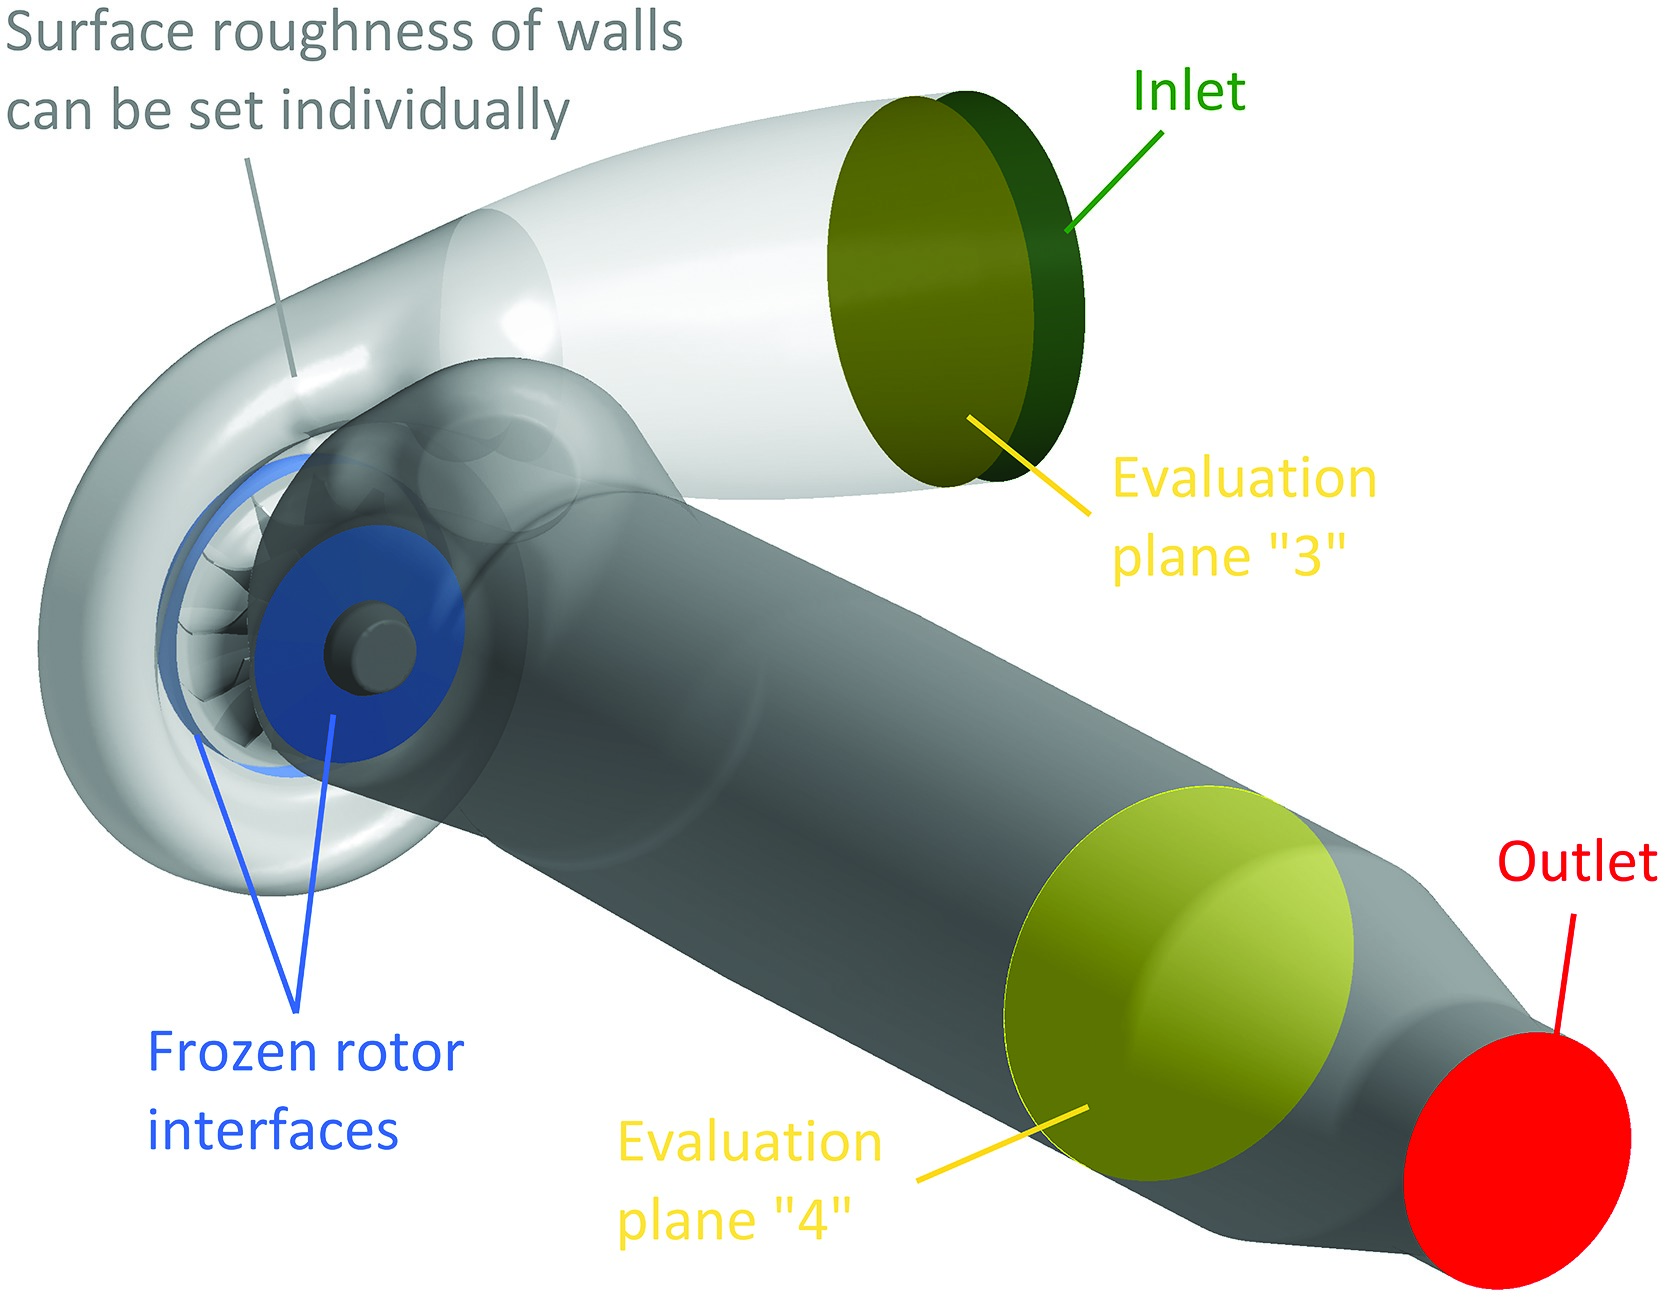
The shear-stress transport turbulence model is used and stationary parts of the computational domain are connected to rotating parts by “frozen rotor” interfaces. The boundary conditions for the simulations at inlet and outlet are taken from the HGS results directly. The turbine inlet temperature is 873 K and the flow is expanded to atmospheric pressure.
An overview of the computational setup is shown in Figure 4. Planes “3” and “4” are used for the calculation of stage efficiency, according to the setup of the HGS. For all the simulations presented the mass flow imbalance between inlet and exit remains within 0.05%, the stage efficiency is conserved to ±0.03% and the pressure ratio remains within ±0.02% over the last 50 iterations of the solution.
Surface roughness effects can be included in CFX by specifying sand grain roughness coefficients on individual surfaces. The additional loss in the boundary layers is accounted for by adapting the shear stresses (Ansys Theory Guide). 04 present a detailed large eddy simulation study of flow separation due to surface roughness in diffusing flows. The authors conclude that a modified RANS model cannot predict the roughness-induced effects on flow separation. However, the boundary layers at the volute surfaces of the present turbine test cases are largely attached, except for the transition region to the waste gate channel. The adapted RANS CFD model should therefore be able to predict the additional loss due to increased roughness fairly well.
Model validation
Both test cases presented in this section feature vaneless mono-scroll volutes and radial inflow turbine wheels. The values of the stages’ degree of reaction are relatively low.
Test case 1
The main turbine data for the first test case is summarized in Table 1. Six turbine housings of different volute roughness levels are tested both on the HGS and using the calibrated CFD model. The HGS tests are performed using the same core assembly including the turbine wheel, so only the housings are exchanged after each test. The reduced mass flow results are shown in Figure 5 for three different circumferential speeds. The respective roughness level is indicated by the color intensity, going from light (low roughness) to dark (high roughness). The CFD results (blue triangles) show barely any effect of surface roughness on flow capacity, whereas the HGS data (red squares) does show some variation in flow capacity. This can be largely attributed to deviations from the nominal volute geometry.

Table 1.
Main geometric parameters for test case 1.
| Wheel inlet diameter d5,tw [mm] | 48.0 |
| Wheel diameter trim d5,tw/d6,tw [-] | 0.84 |
| Wheel number of blades [-] | 12 |
| Volute size Athroat/rcog/d5,tw*100 [-] | 21.0 |
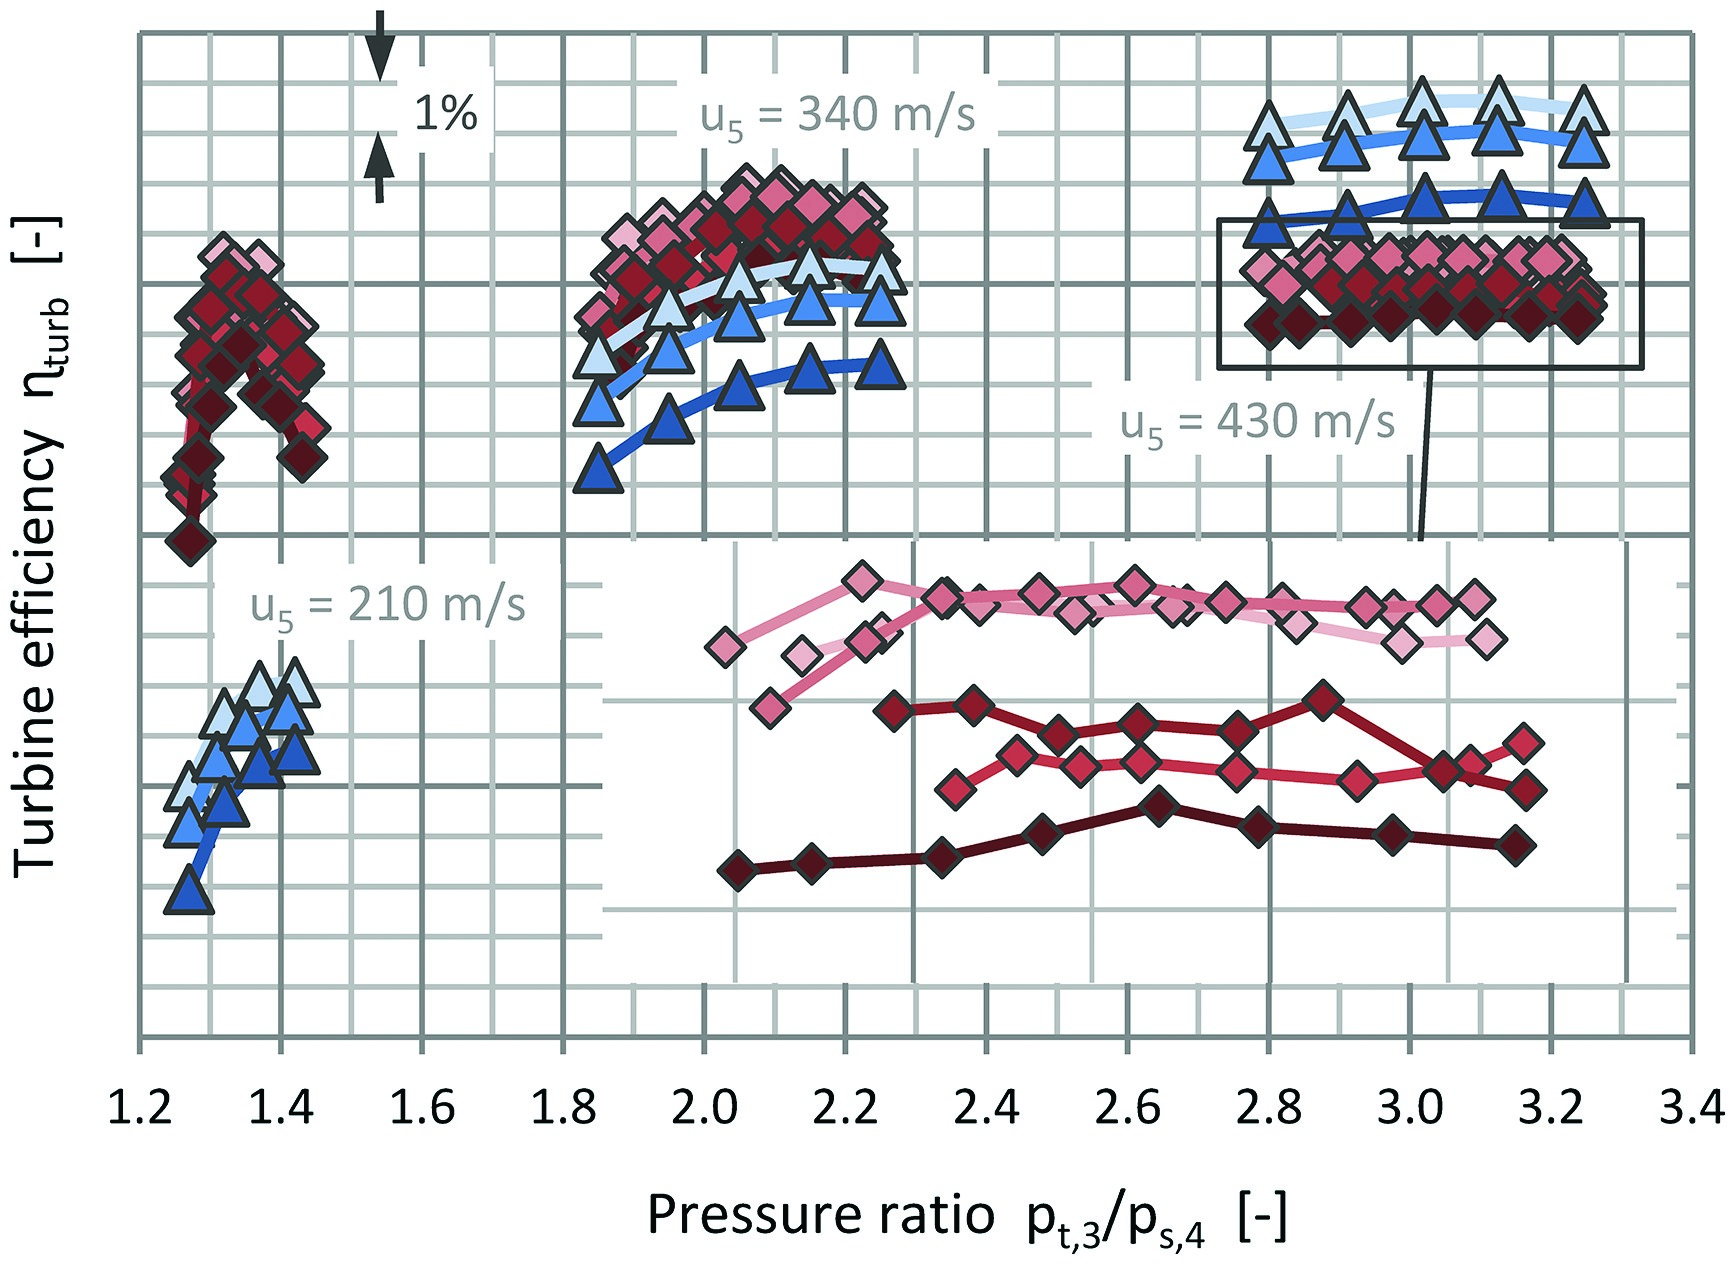
The experimental turbine efficiency is derived from the measured compressor efficiency and therefore includes the mechanical efficiency of the bearing system. This is accounted for in the CFD model by calculating friction power from a polynomial depending on the rotational speed of the shaft. The trend in turbine efficiency of the HGS data (red squares in Figure 6) is matched well by the CFD results (blue triangles). External heat transfer is not accounted for in the CFD simulations (adiabatic walls) and the efficiency level is therefore considerably different from the HGS data, especially at low pressure ratios.
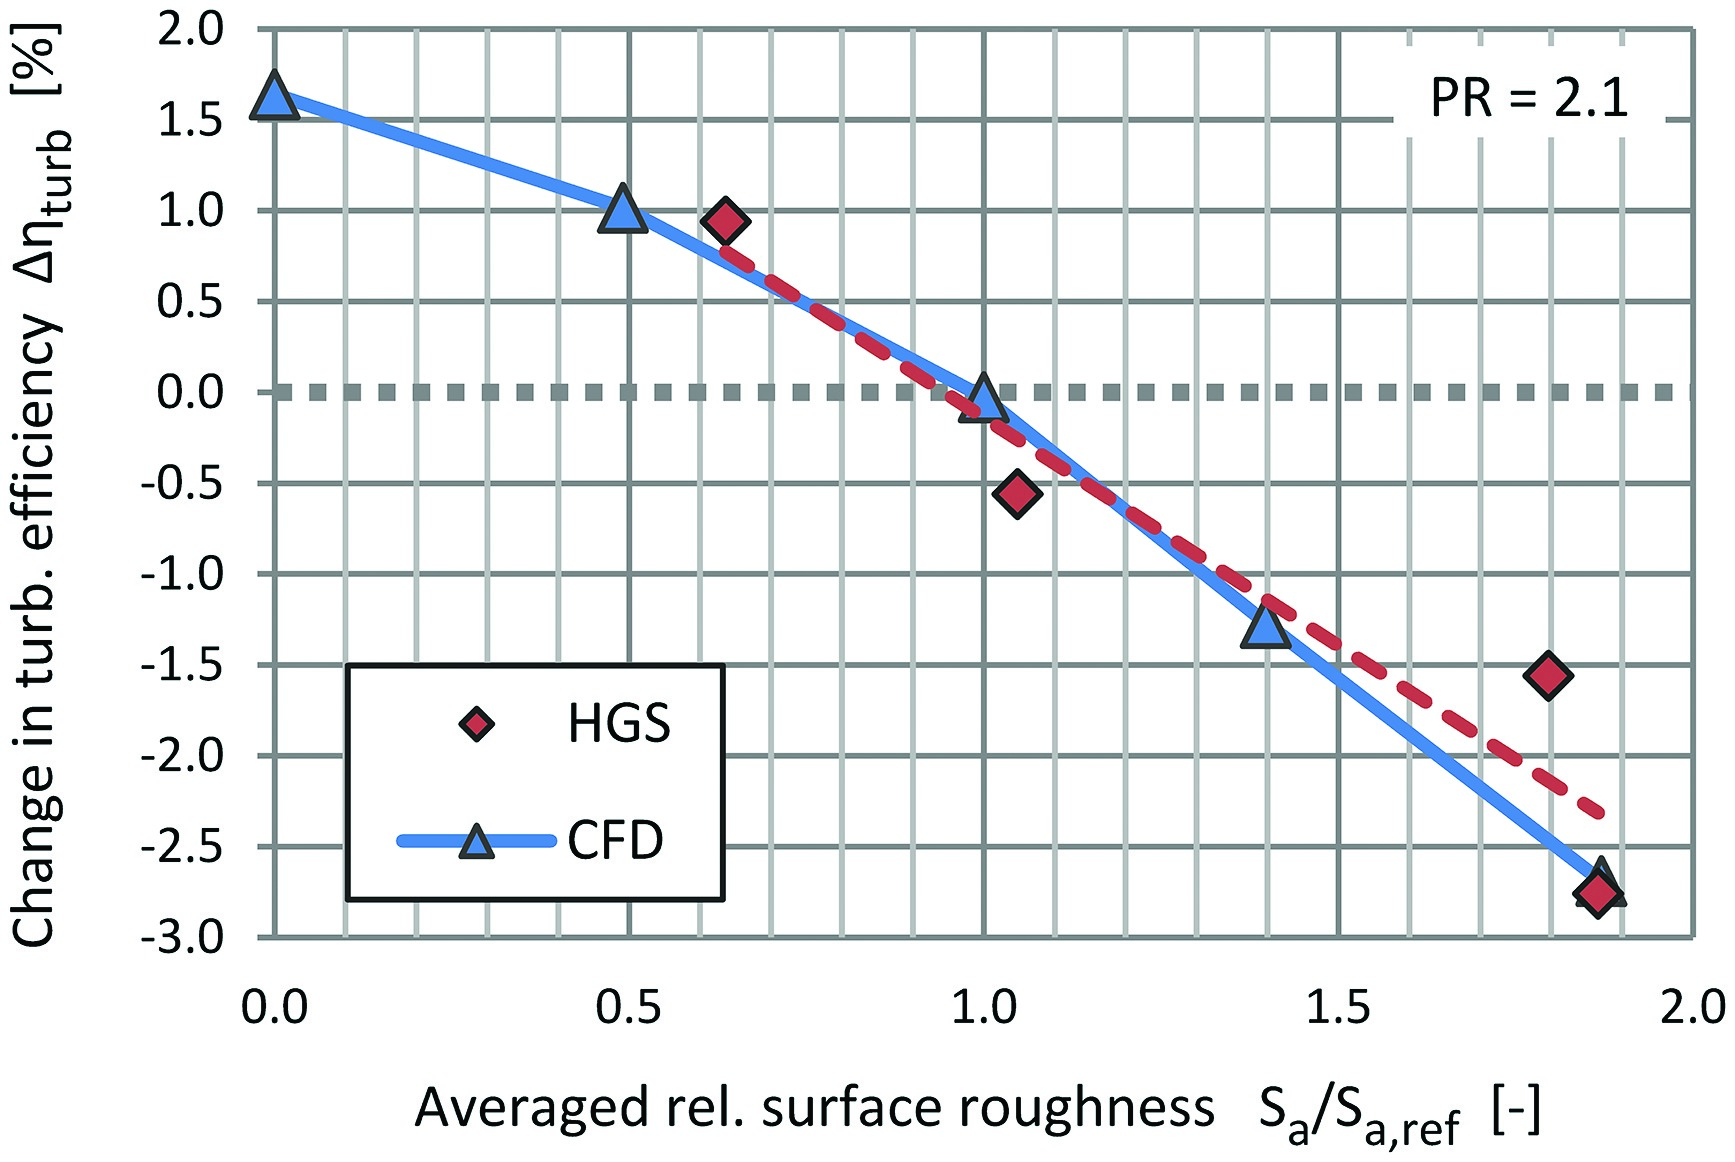
In order to provide a clearer comparison of the simulation results with the experimental data, the change in stage efficiency due to increasing surface roughness is shown for pressure ratio (PR) = 2.1 in Figure 7. Similar agreement of CFD and HGS results is achieved at other PRs and rotational speeds.

Test case 2
The second turbine used for validation purposes features a slightly larger turbine wheel of a different type. The main turbine data is summarized in Table 2. Four turbine housings with different volute roughness levels are tested. The volute surface geometries are checked by CT scans and remain within a tolerance of ±0.3 mm. Again, the penalty in turbine efficiency due to increasing measured surface roughness is shown for PR = 2.1 in Figure 8. The roughness range is much larger than for test case 1, reaching values of nearly twice the baseline roughness Sa,ref.
Validation test cases — Summary
For both test cases presented in this section, generally good agreement between the HGS data and the calibrated CFD simulation is found over a wide roughness range. There is some scatter in the HGS data, possibly due to uncertainties in the measured surface roughness distribution. Nevertheless, the calibration of sand grain roughness against measured roughness is deemed accurate enough to assess the effects of surface roughness on the turbine performance by CFD simulations.
Effects of surface roughness on the turbine flow field
One of the main questions regarding the effects of surface roughness is whether the flow field in the rotor is also affected. The flow conditions at the rotor inlet might be significantly different for increasing roughness levels, as the volute boundary layers thicken and become more skewed. This could entail consequences for the turbine wheel design.
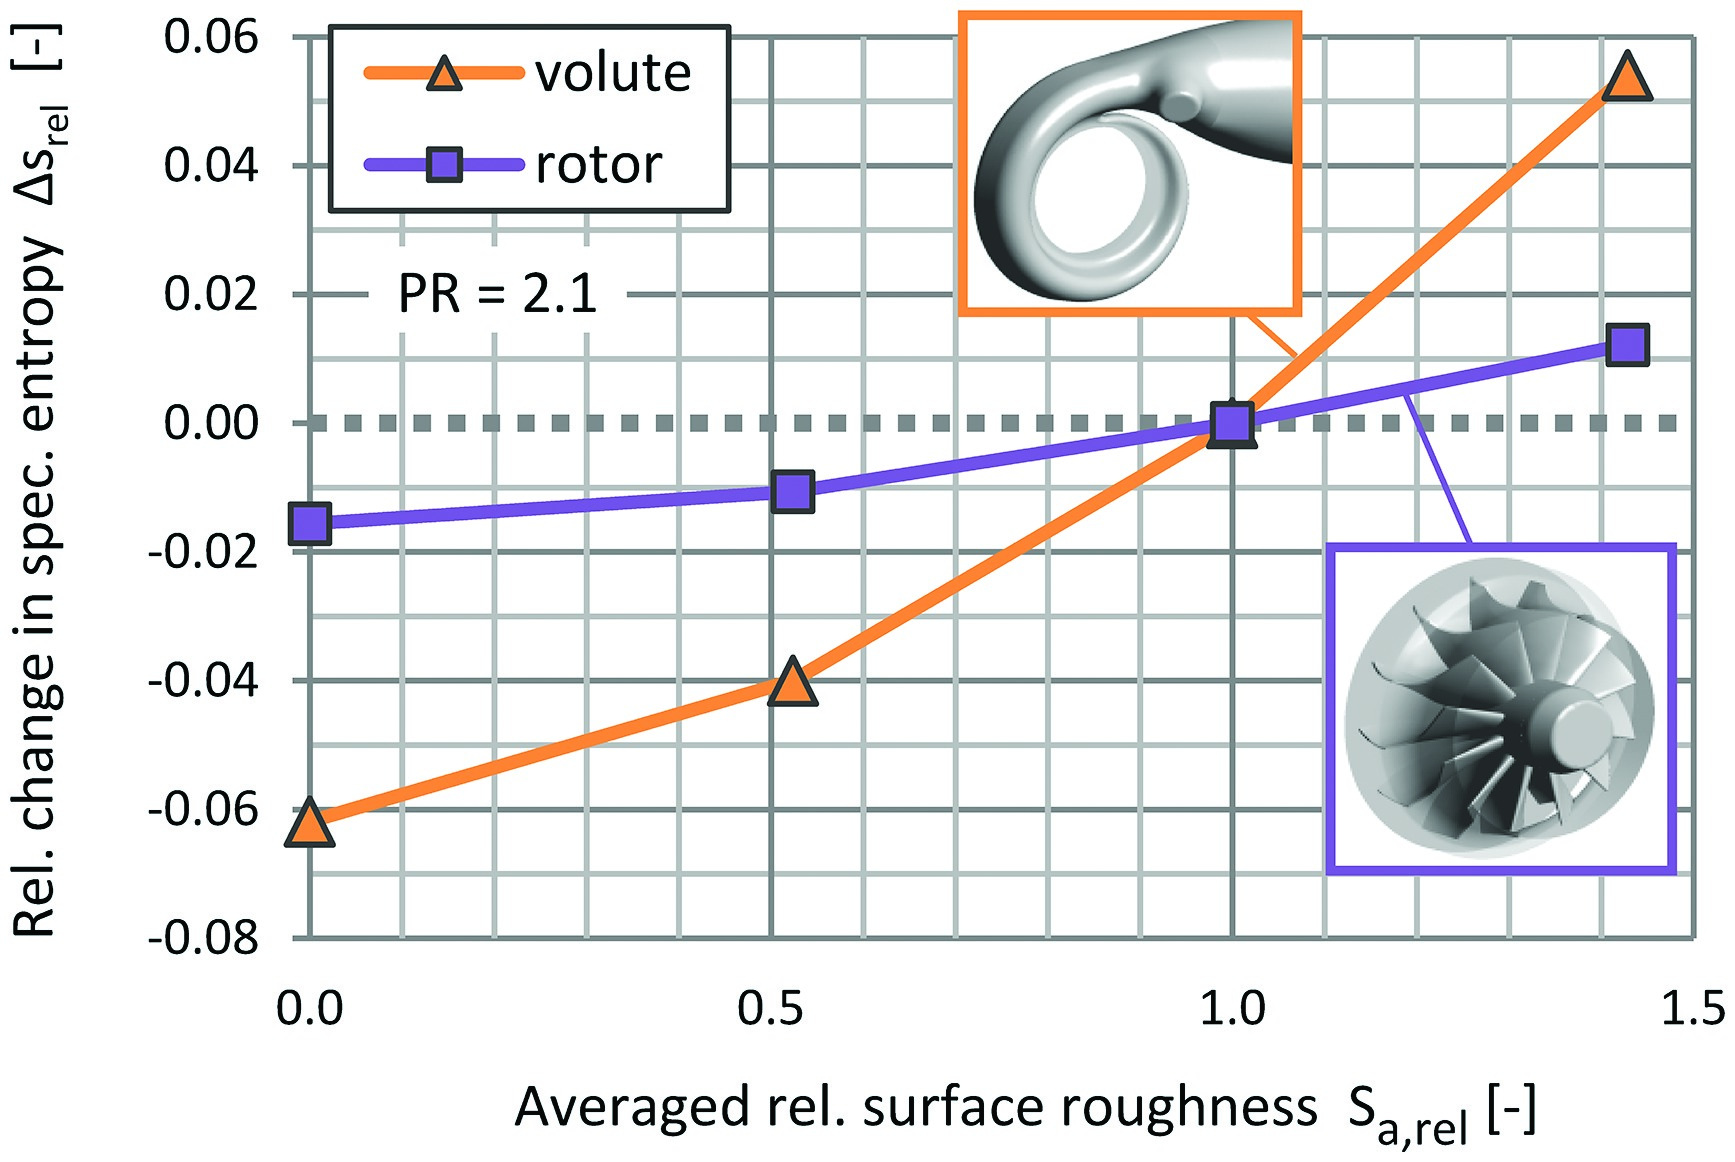
In Figure 9, the loss production in the main turbine components of test case 1 is presented as generation of specific entropy. The respective change in entropy is referred to the entropy generation over the stage of the reference case (roughness Sa,ref, see Equations 2 and 3). According to the CFD results, most of the loss change occurs in the volute. Additional loss due to increased friction in the volute boundary layers therefore seems to dominate the changes in stage efficiency.
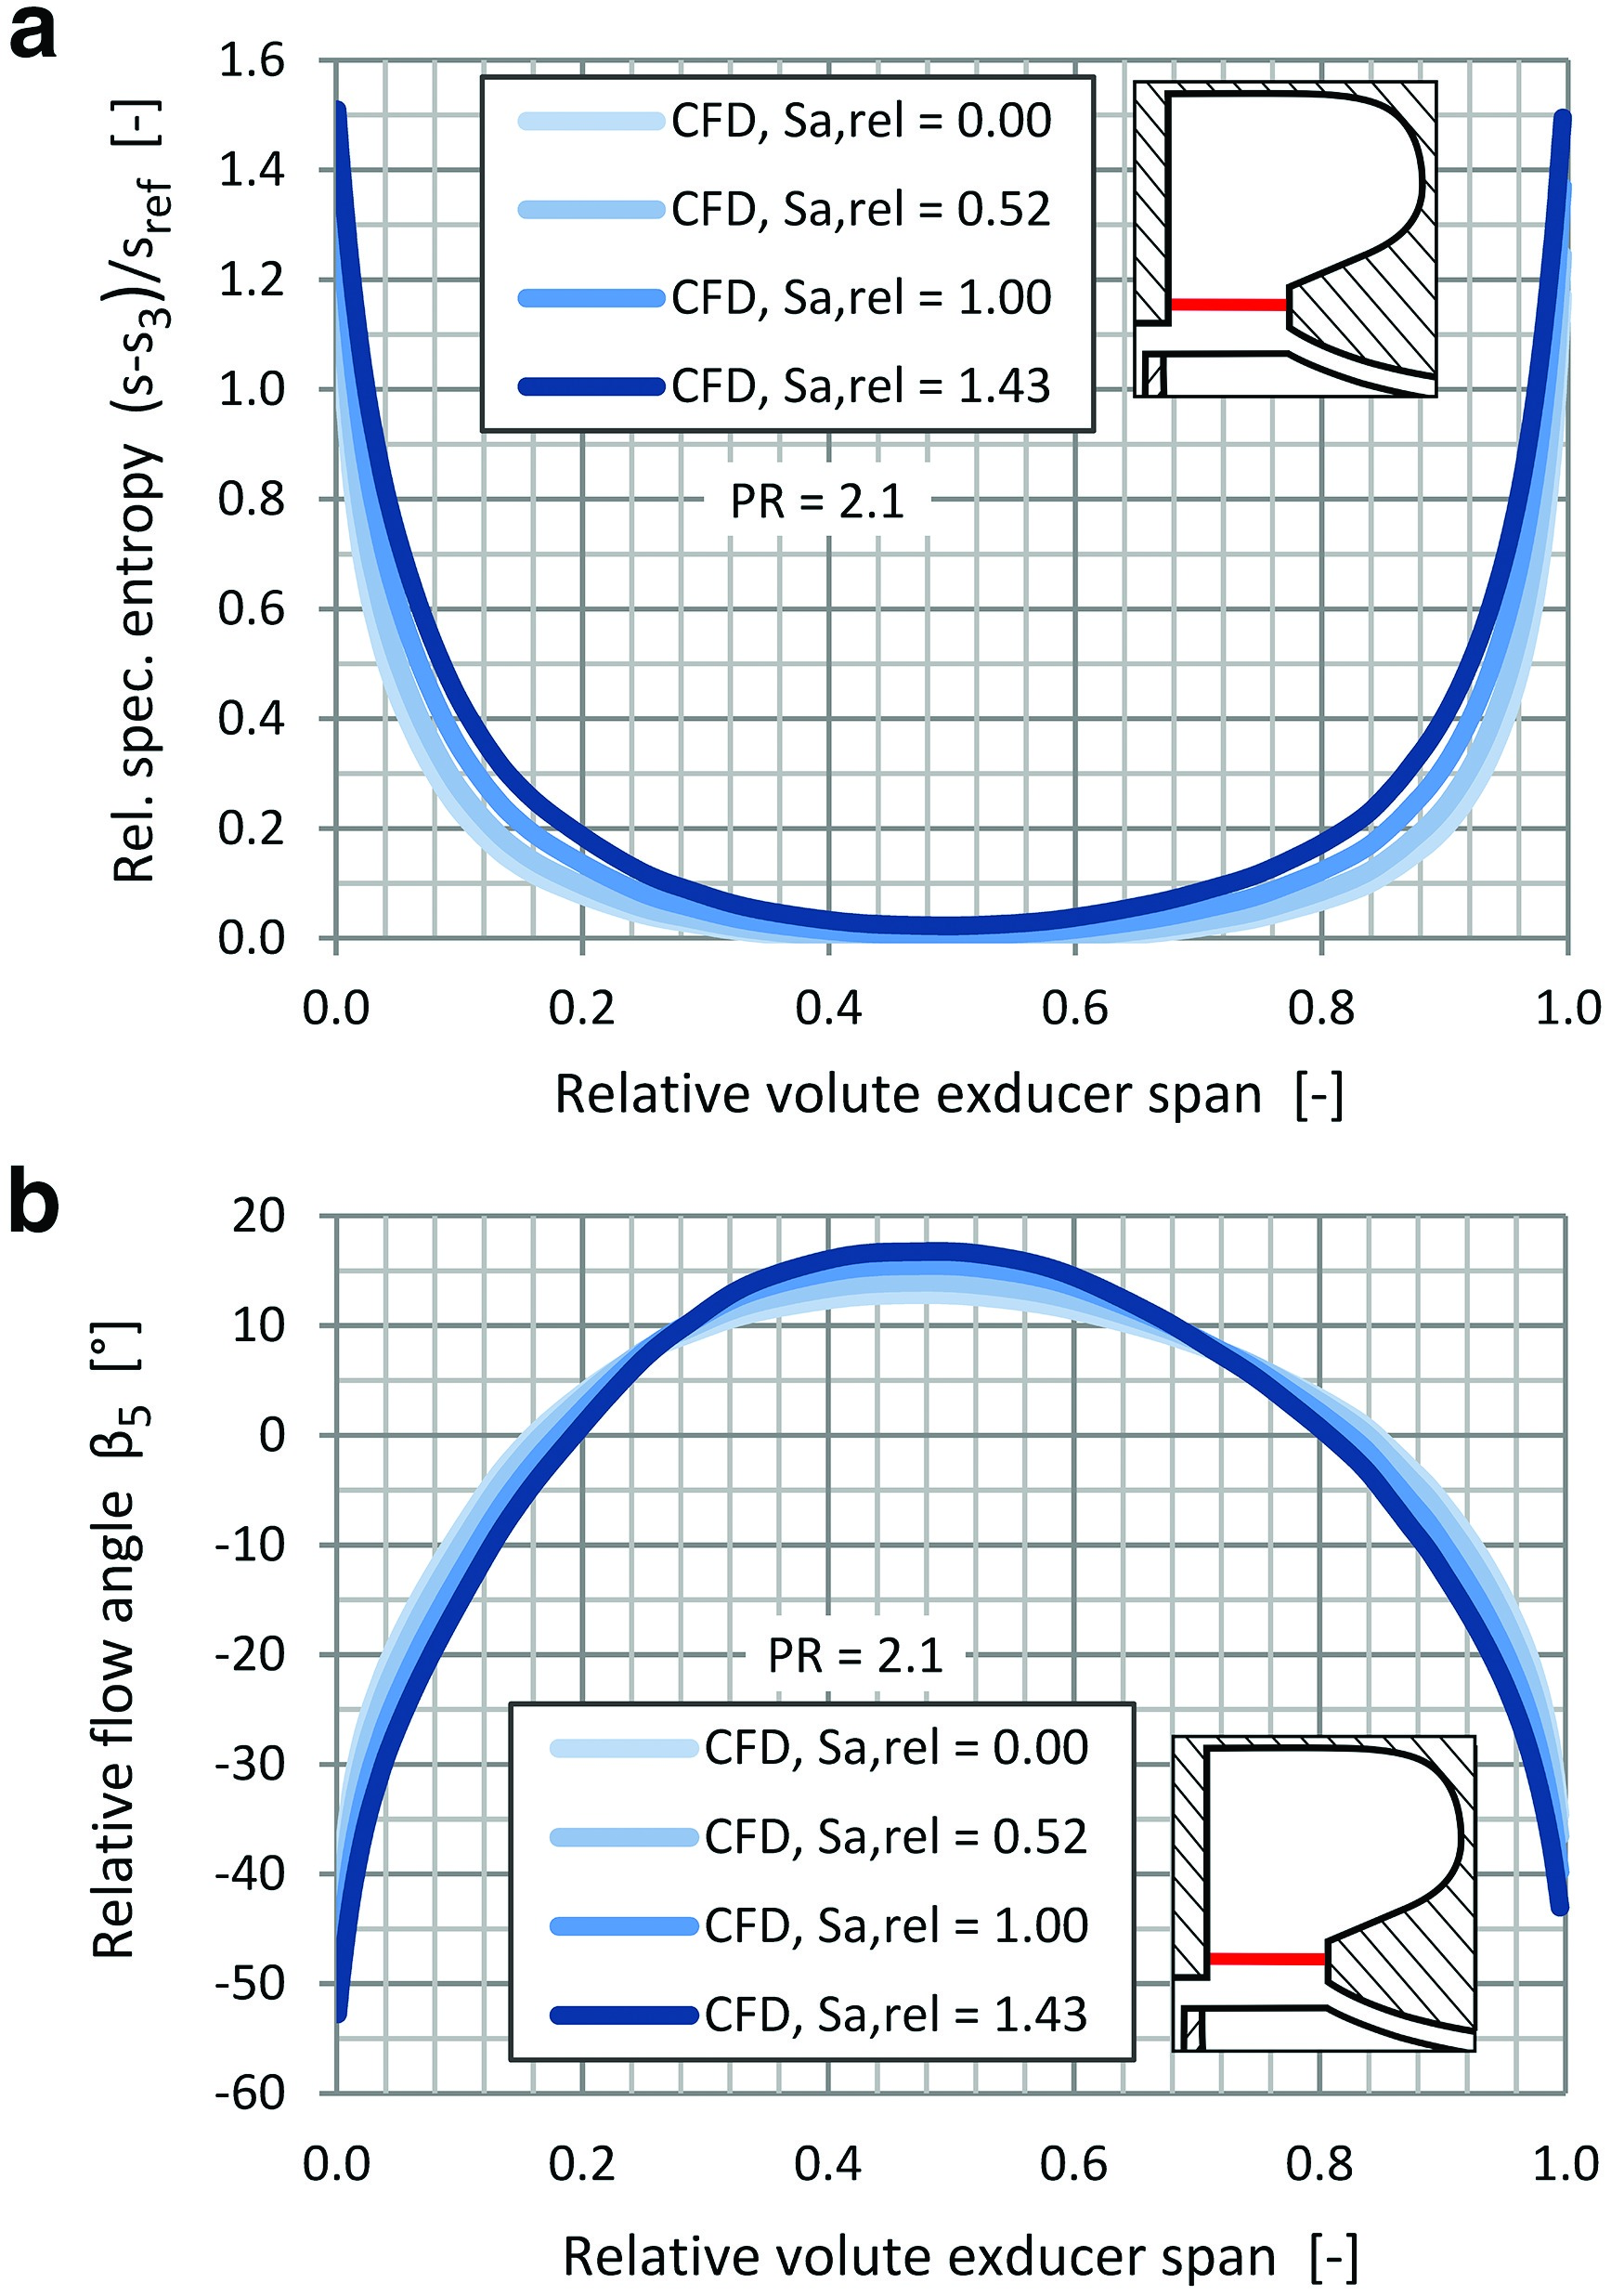
The rotor inlet angle distribution from the CFD simulations is shown in Figure 10. As expected, the boundary layer is more skewed with growing roughness values and the loss in the boundary layer region increases with increasing volute surface roughness (see Figure 10). Overall, there are only moderate effects on the rotor inlet flow conditions.
Figure 10.
Circumferentially mass-flow averaged flow properties at volute exducer (CFD), (a) relative flow angle and (b) relative specific entropy.
In Figure 11, the relative flow angle distribution at the rotor exducer also shows little difference between the cases of different volute roughness levels. Deviations between the cases are largest up to 50% span, where increased underturning at the hub is observed. In Figure 11, the loss is shown to increase especially in the hub and tip regions downstream of the rotor. The secondary kinetic energy in the vortex regions raises due to the thicker boundary layers at the rotor inlet (see Figure 11). Overall, there are only fairly small effects on the rotor exit flow field due to volute surface roughness, despite small but considerable alterations to the flow field at the rotor inlet. Apparently, the flow in the rotor row is not very sensitive to these changes, which explains why only small loss changes occur in the rotor domain.

CFD parameter studies
In the section “Model validation,” the effect of an even increase of roughness level throughout the volute on the turbine efficiency is demonstrated for two test cases. Figure 8 shows a drop of up to 4% in turbine efficiency between surface roughness values of 0.5 Sa,ref and 2.0 Sa,ref. This difference highlights the potential disadvantages in case the nominal surface roughness is not achieved in a turbine housing. In this section, the turbine of test case 1 is equipped with a larger volute with a size of volute size (VS) = 30. This simulation model is used to test uneven roughness distributions over the volute surface. Furthermore, the calibrated CFD model is applied to other turbine setups, in order to assess the effects of volute surface roughness in different turbines.
Circumferential roughness distribution
Up to this point, the roughness level has only been varied evenly throughout the volute in the CFD simulations. In order to assess the effects of roughness changes in different regions of the volute, an uneven circumferential distribution is applied. The volute model is divided into four sections, shown in Figure 12, whose surface roughness is varied between 0.5 Sa,ref and 1.4 Sa,ref. The other sections’ roughness is set to 0.5 Sa,ref. Figure 12 shows the variation of surface roughness around the circumference. The volute roughness is area-averaged, which is why the roughness increase in sector 4 only slightly increases the overall average.
Figure 12.
CFD setup for assessment of circumferential roughness distribution, (a) volute model and (b) roughness distribution.

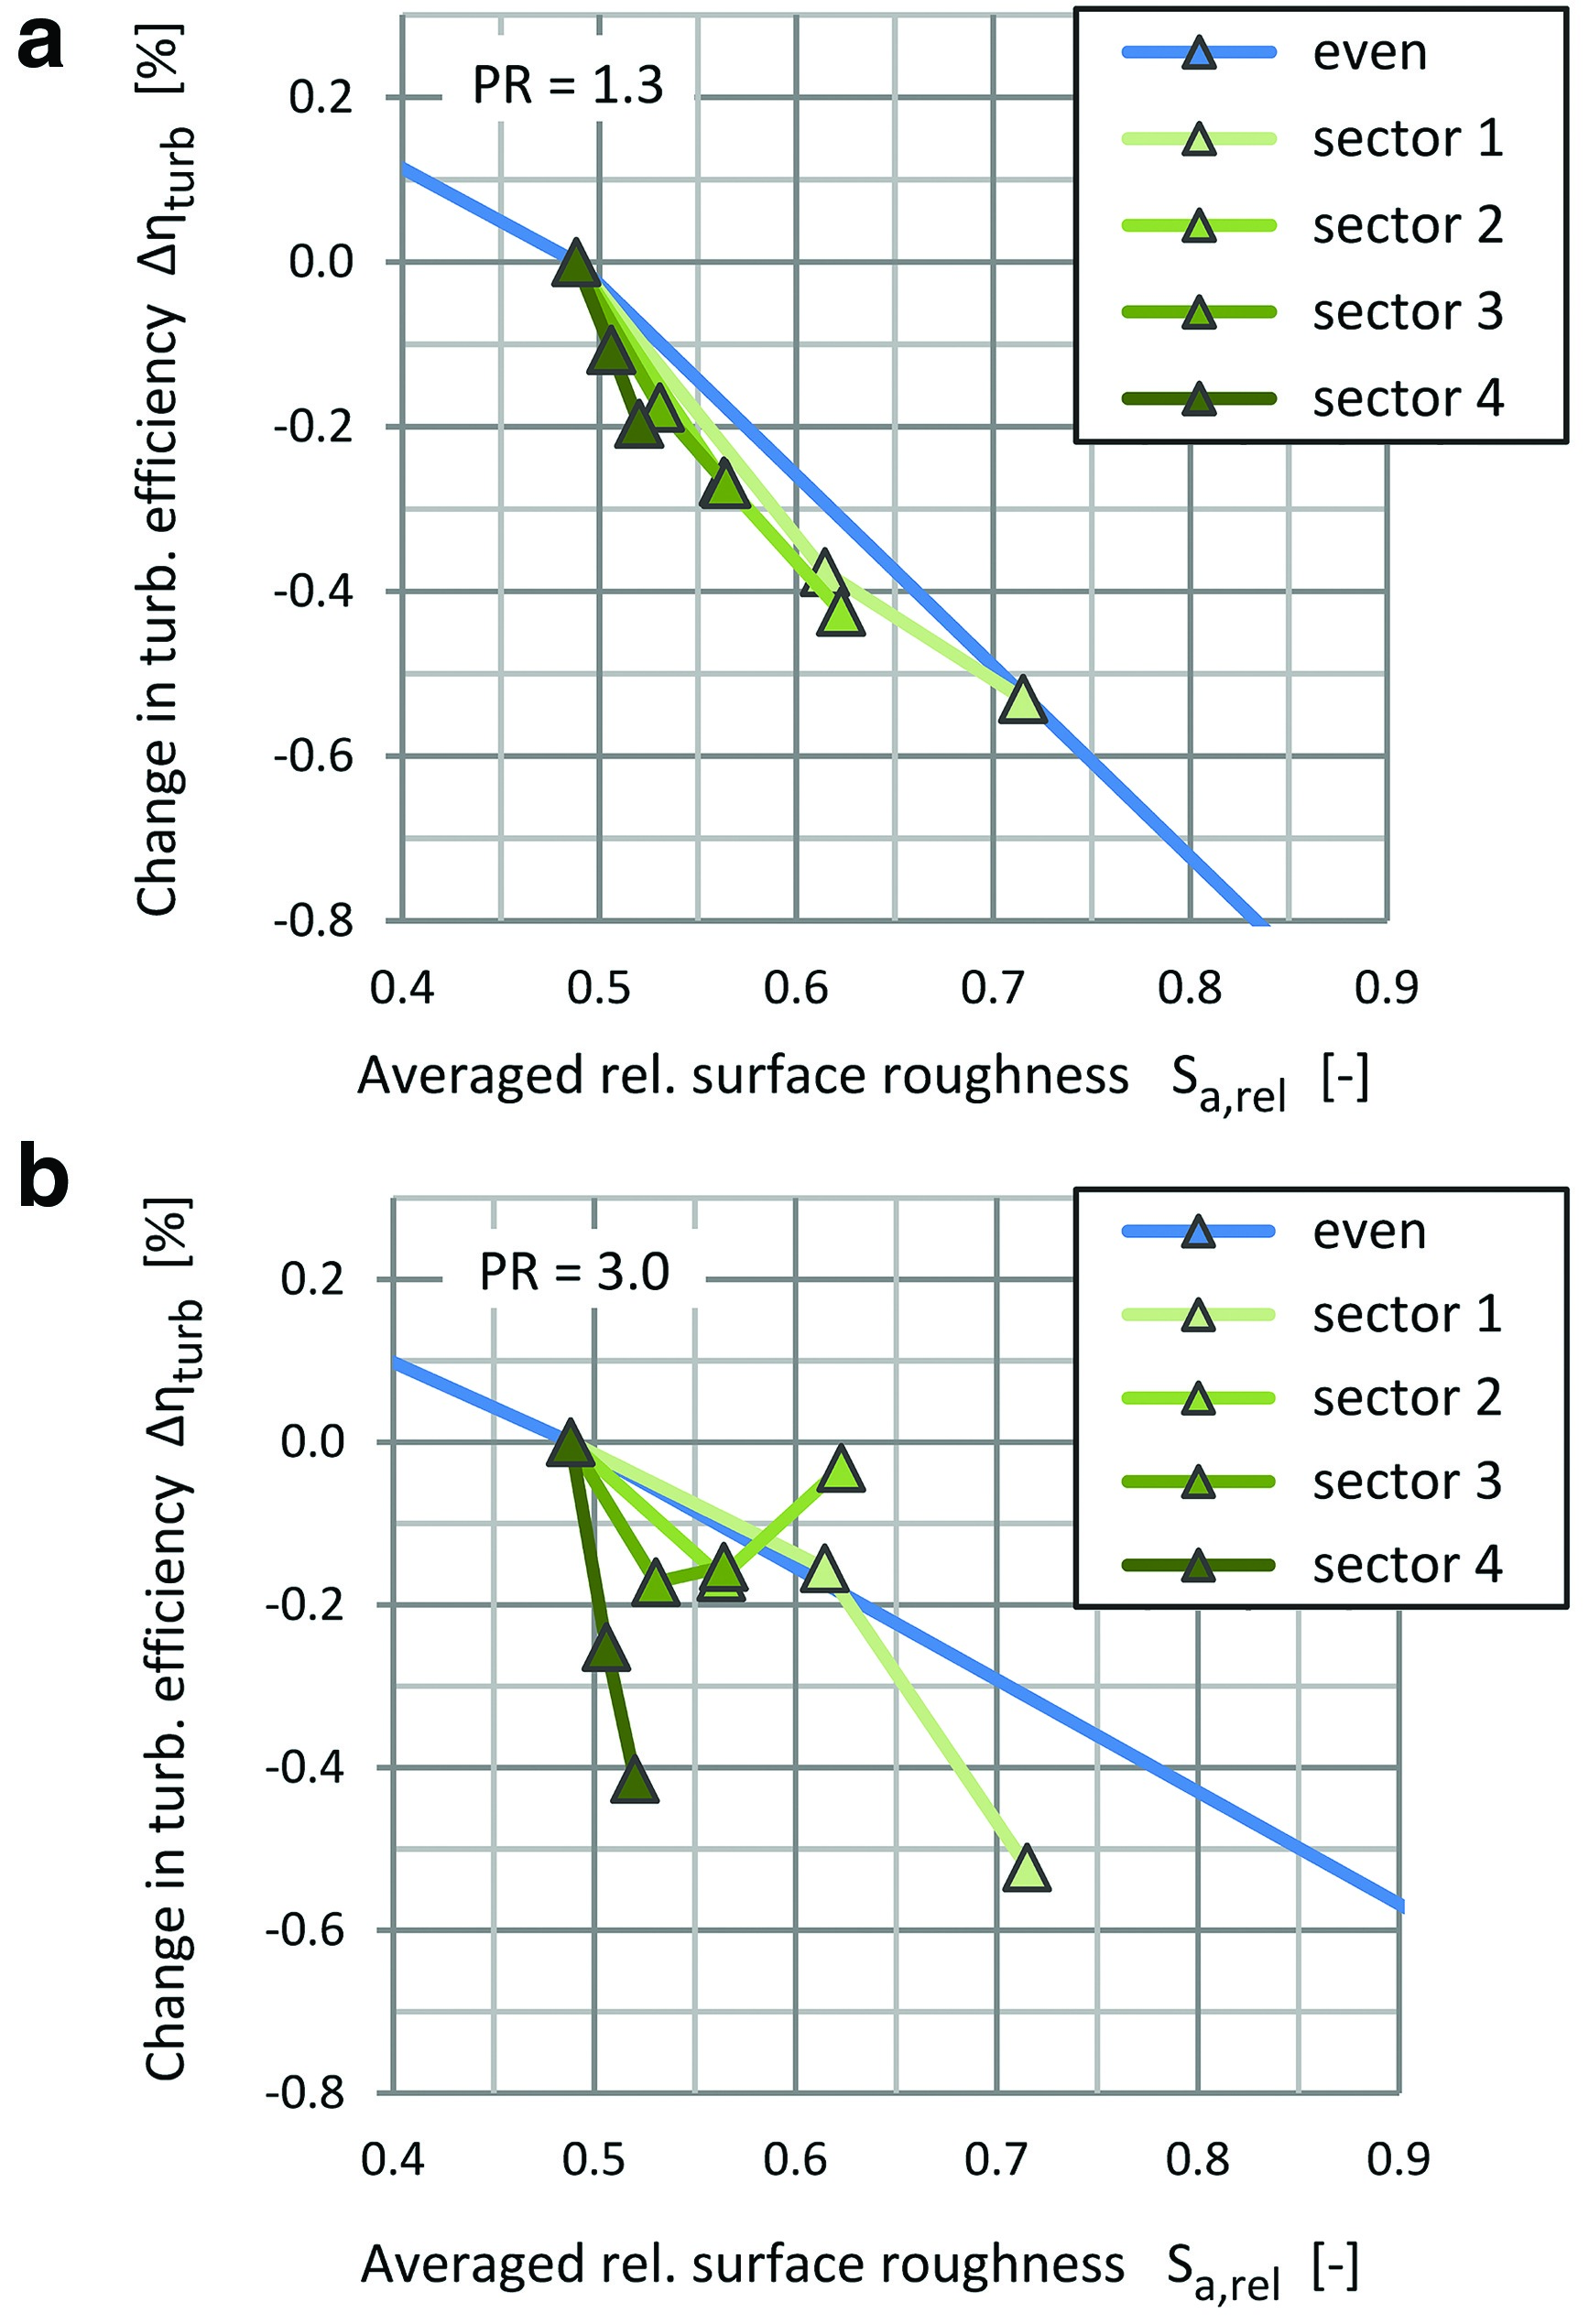
At PR = 1.3, the behavior is similar to the even roughness increase (blue line in Figure 13). The local change in surface roughness leads to similar changes in efficiency as the even increase throughout the volute. Figure 13 shows slightly reducing efficiencies going from sector 1 to sector 4 (light green to dark green), comparing points at the same roughness average. According to Figure 13, the efficiency is more sensitive to local roughness alterations at PR = 3.0. Especially the increase at the small volute cross-sections close to the volute tongue (sector 4) leads to a steep reduction in efficiency.
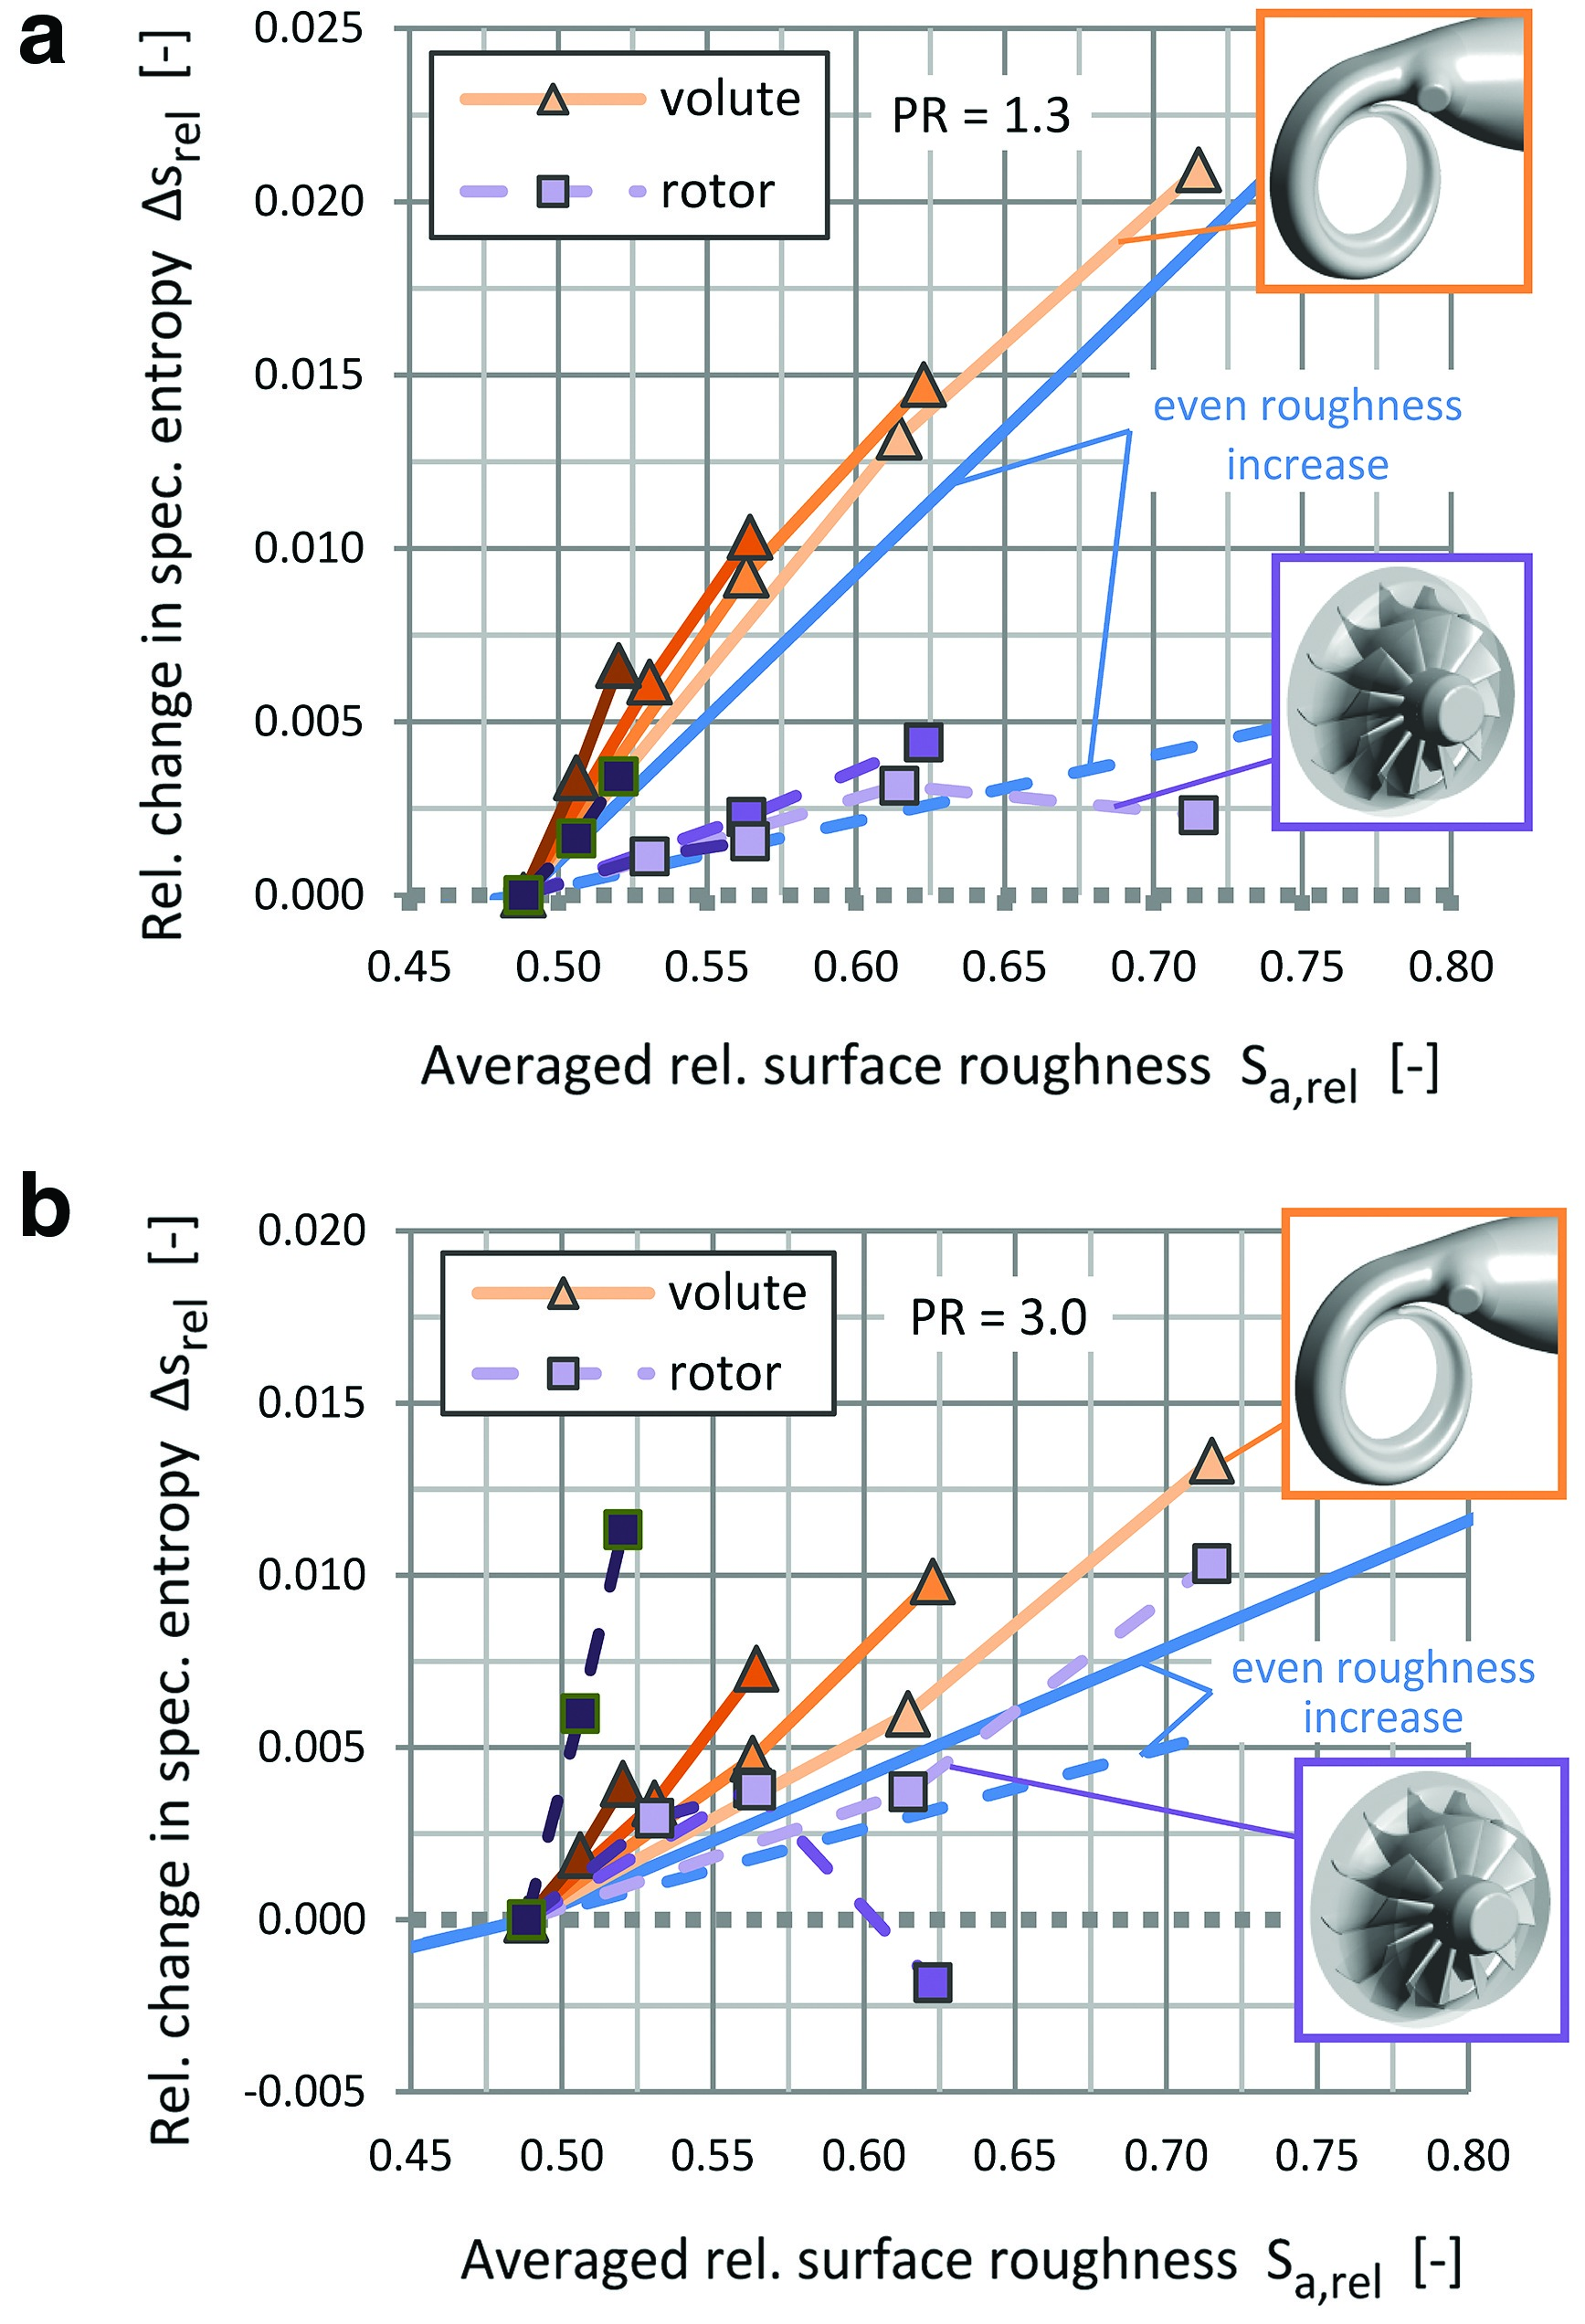
Figure 13.
Change in turbine efficiency for roughness increase in different volute sectors (CFD), (a) PR = 1.3 and (b) PR = 3.0.
The respective changes in loss generation are depicted in Figure 14. Again, the brightness of symbols and lines indicates the position of the volute sector with increased surfaces roughness, going from sector 1 (light) to sector 4 (dark). At PR = 1.3 (see Figure 14), the change in volute loss (triangles) becomes greater the closer the respective sector is to the smallest cross-section, sector 4 having the largest impact. The trend in the rotor loss change (squares) is less clear. The most obvious effect on rotor loss again occurs if the roughness is increased in sector 4. Most of the other sectors lead to similar loss increases as the even roughness change (blue line) does. At Sa,rel = 0.72, higher surface roughness in sector 1 leads to smaller loss growth in the rotor than the even roughness increase. At PR = 3.0 (see Figure 14), the differences in volute loss change between the sectors are more pronounced than at PR = 1.3. However, the rotor loss is affected even more. The roughness increase in sector 4 leads to a steeper loss increase in the rotor than in the volute.
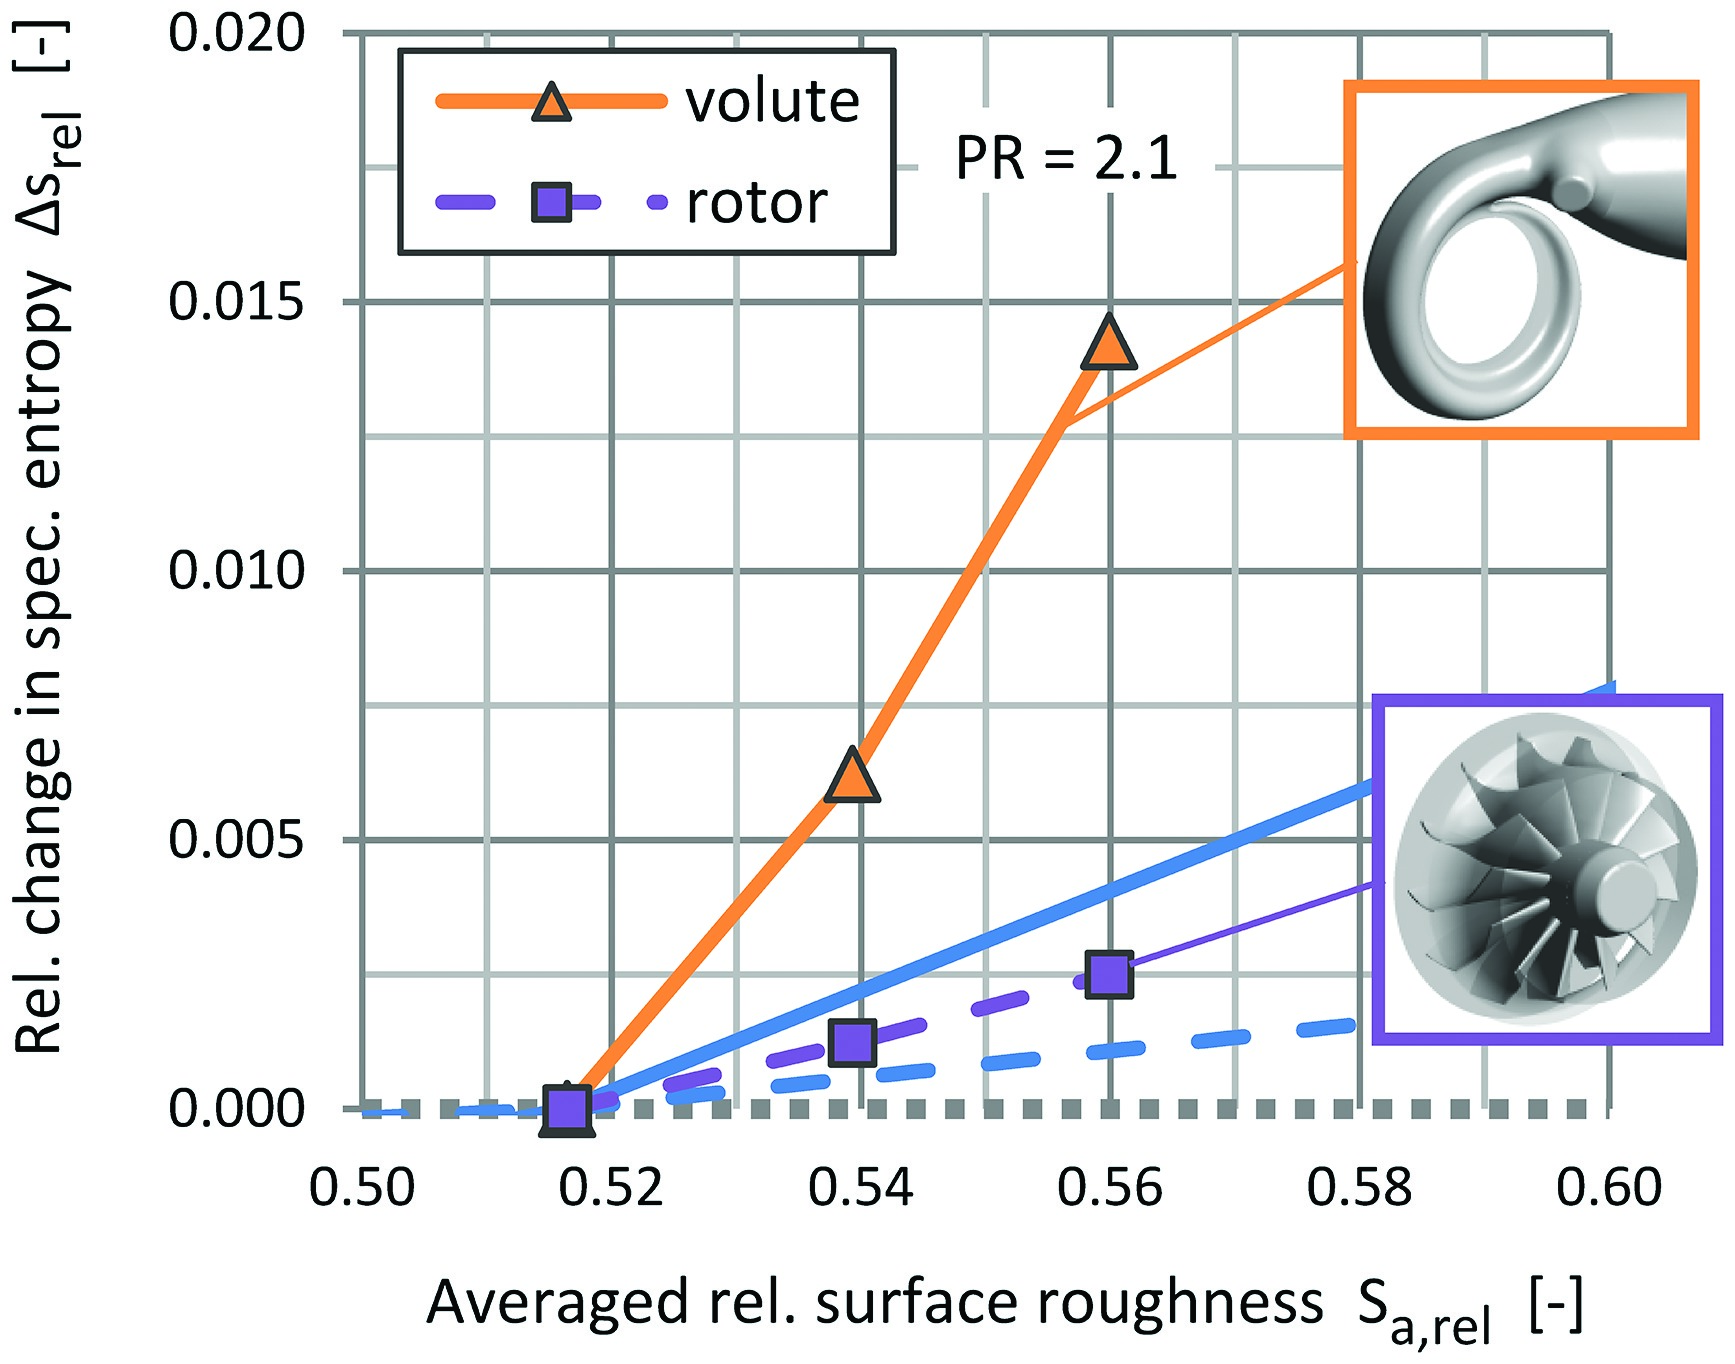
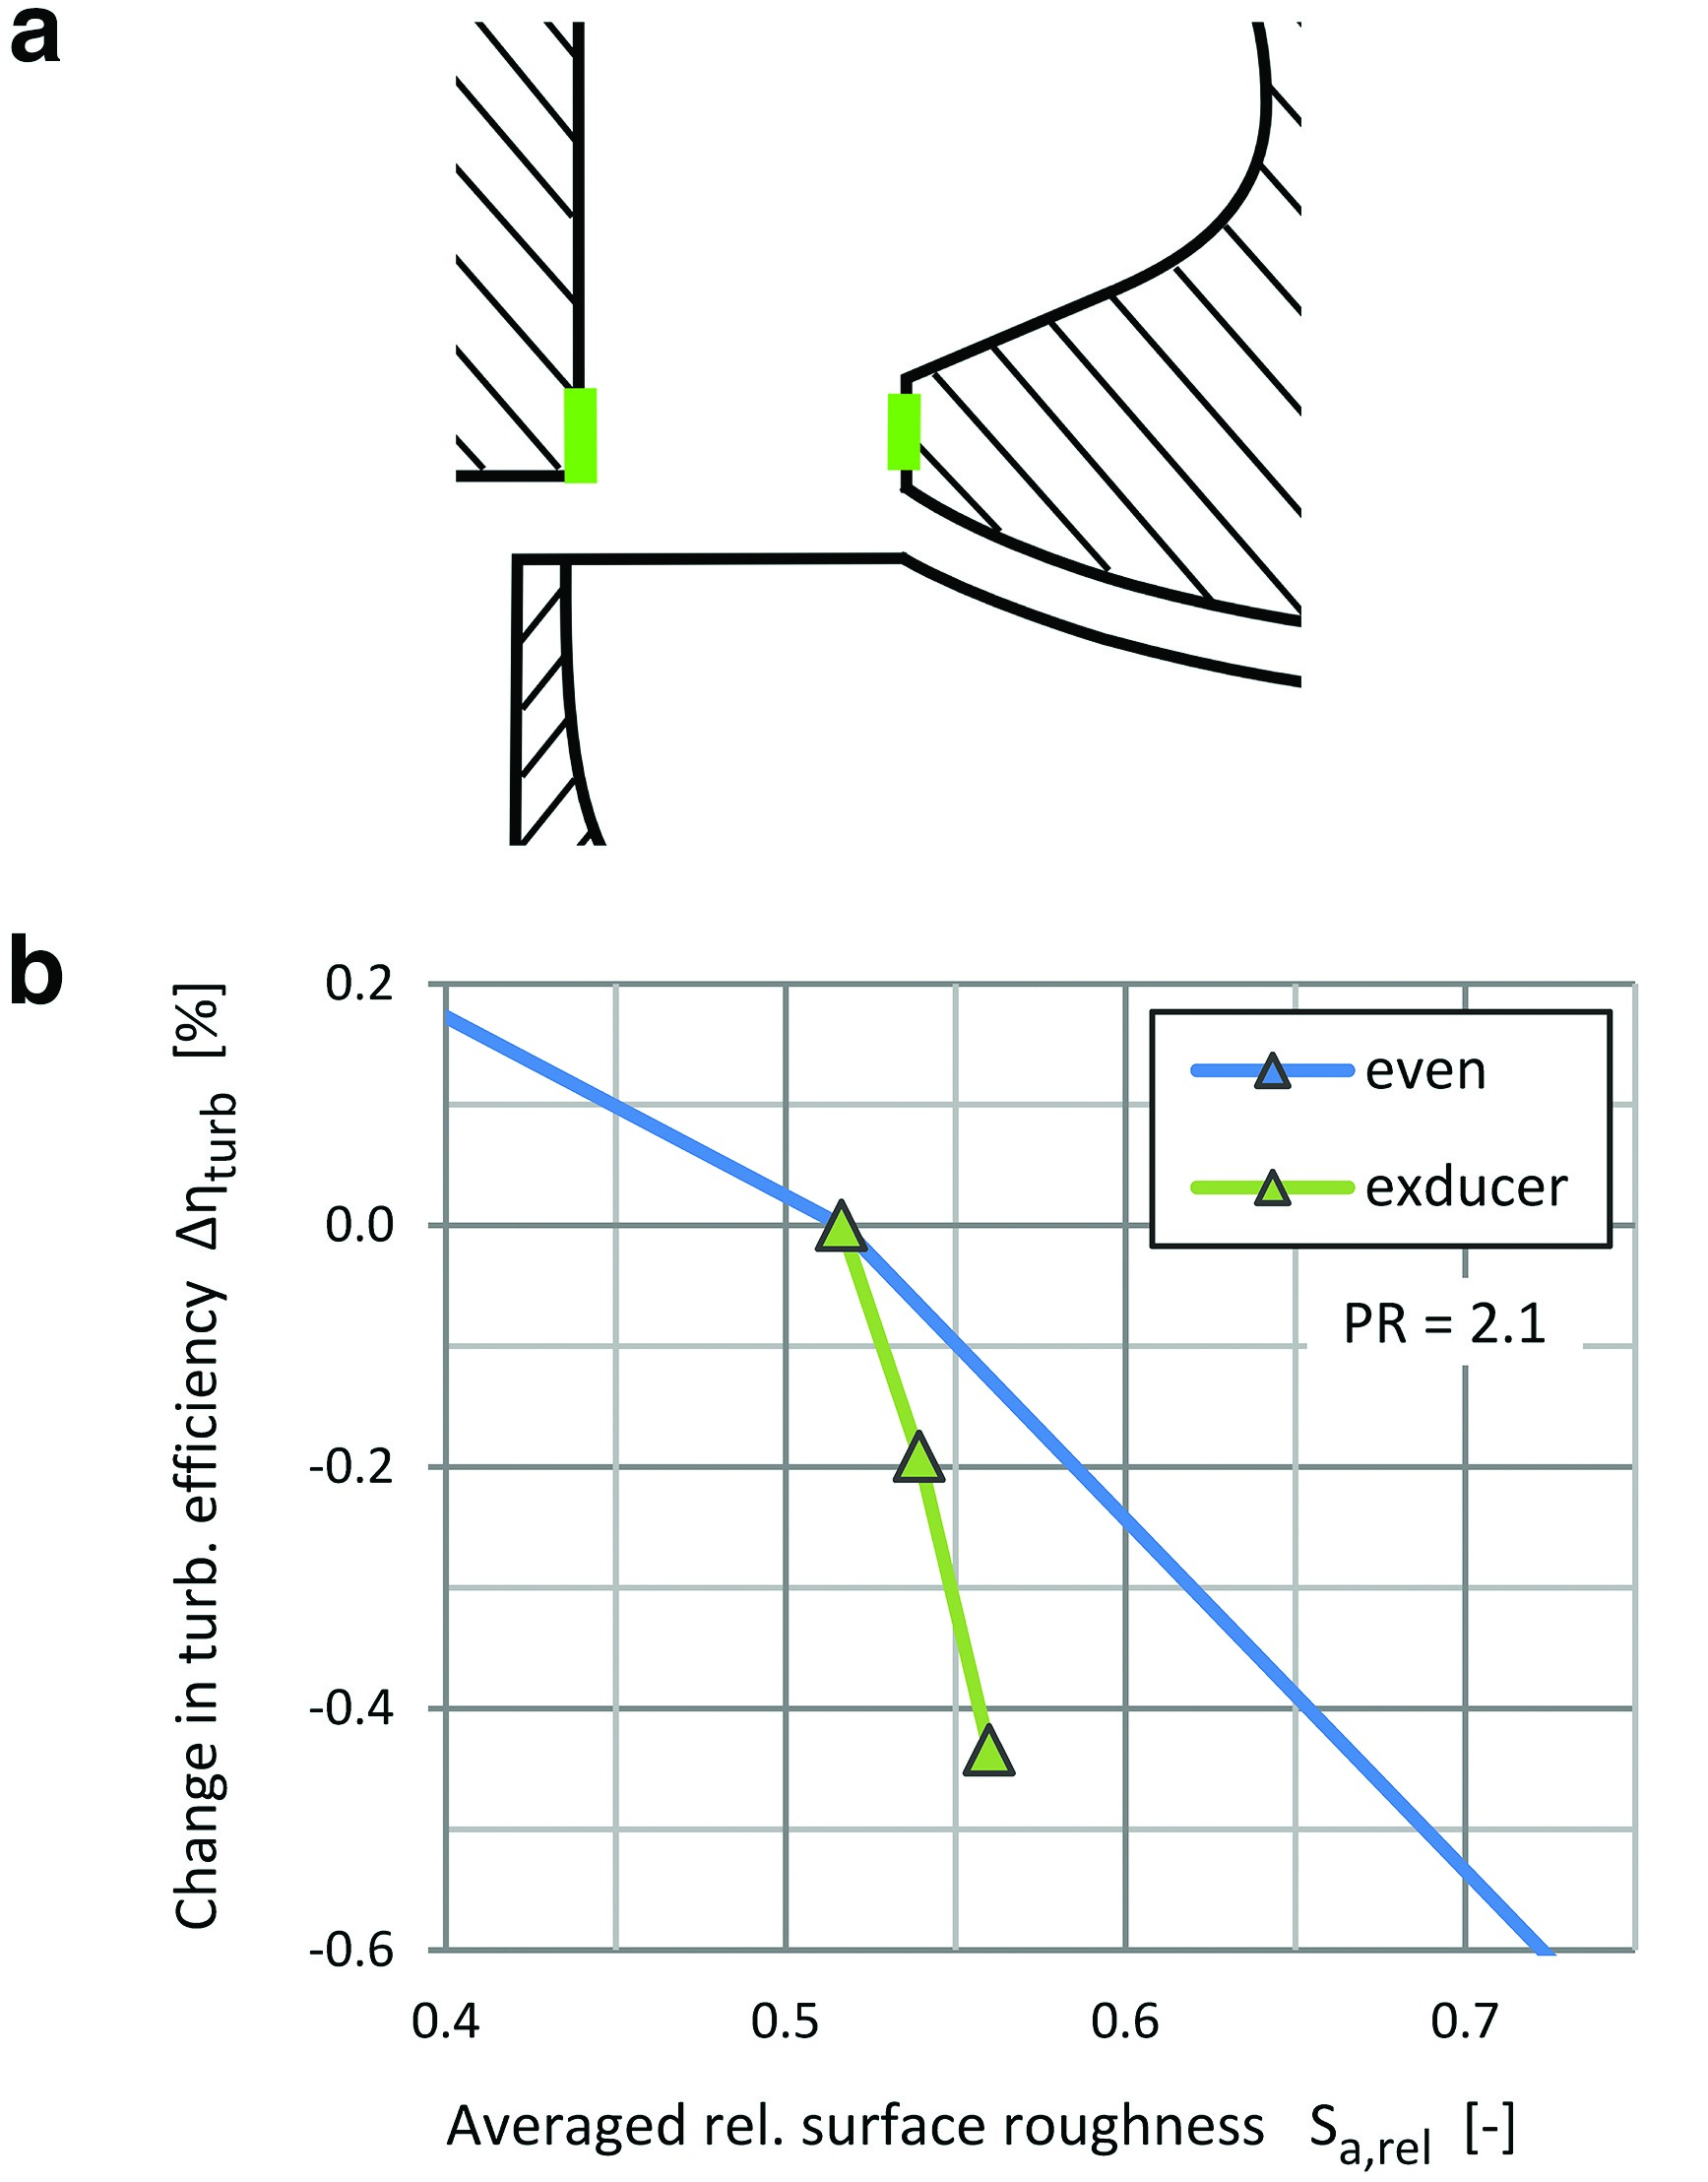
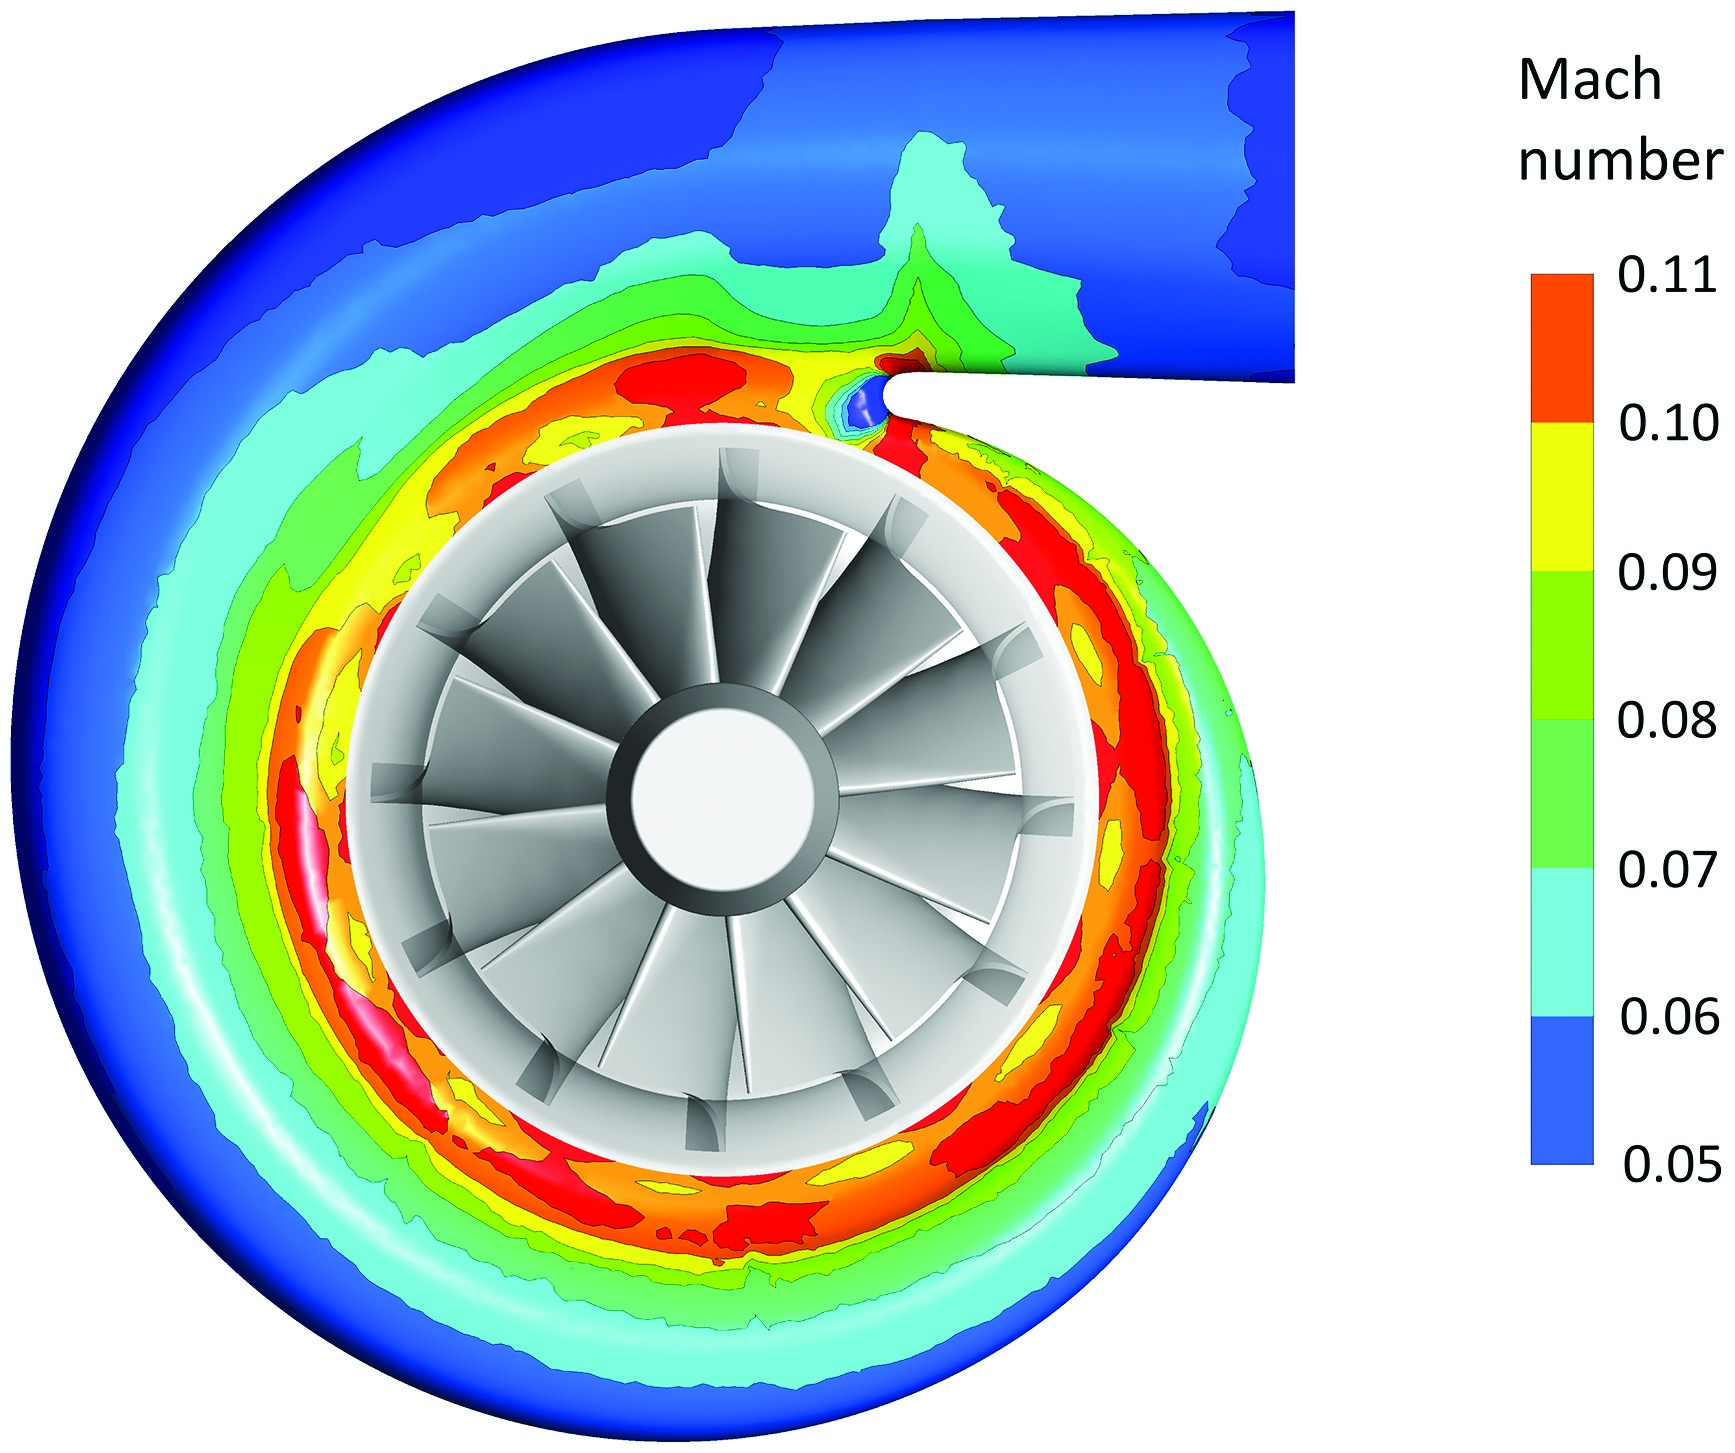
Volute exducer
Both the volute loss and the rotor loss are most sensitive to roughness changes in sector 4 (see Figure 14). This effect can be explained by the much higher level of near-wall Mach number in sector 4, visible in the contours of Figure 15. These contours also show increasing near-wall Mach number towards the volute exducer, which points to the possibility that the efficiency might be sensitive to roughness changes in the exducer area as well. In order to test this hypothesis, the surface roughness is varied between 0.5 Sa,ref and 1.4 Sa,ref on narrow strips on both sides of the exducer (green marks in Figure 16). This region accounts for only about 5% of the volute surface. Nevertheless, increased surface roughness in this area can have a relatively large effect on efficiency, as shown by the comparison with an even roughness increase (blue line) in Figure 16. Figure 17 shows that, compared with the even roughness increase, the loss generation in the rotor almost remains the same, while the major loss increase occurs in the volute. The effect on stage efficiency can therefore be attributed to raised total pressure loss on the volute surfaces with high near-wall Mach number.
Turbine wheel type and volute size
Several different turbine wheel types of different sizes, combined with volutes of different sizes, are examined using the calibrated CFD model described above. In Figure 18, the changes in turbine stage efficiency for an even increase in volute surface roughness from 0.5 Sa,ref to 1.4 Sa,ref is plotted against the respective stage’s degree of reaction. According to the CFD results, the increase in volute roughness is more detrimental with a low degree of reaction, i.e., in stages where a large part of the flow acceleration occurs in the stator. This effect again is attributed to the level of near-wall Mach number in the respective volutes.
Figure 18.
Change in efficiency for even volute roughness increase from 0.5 Sa,ref to 1.4 Sa,ref for different turbine wheel types and volute sizes (CFD).
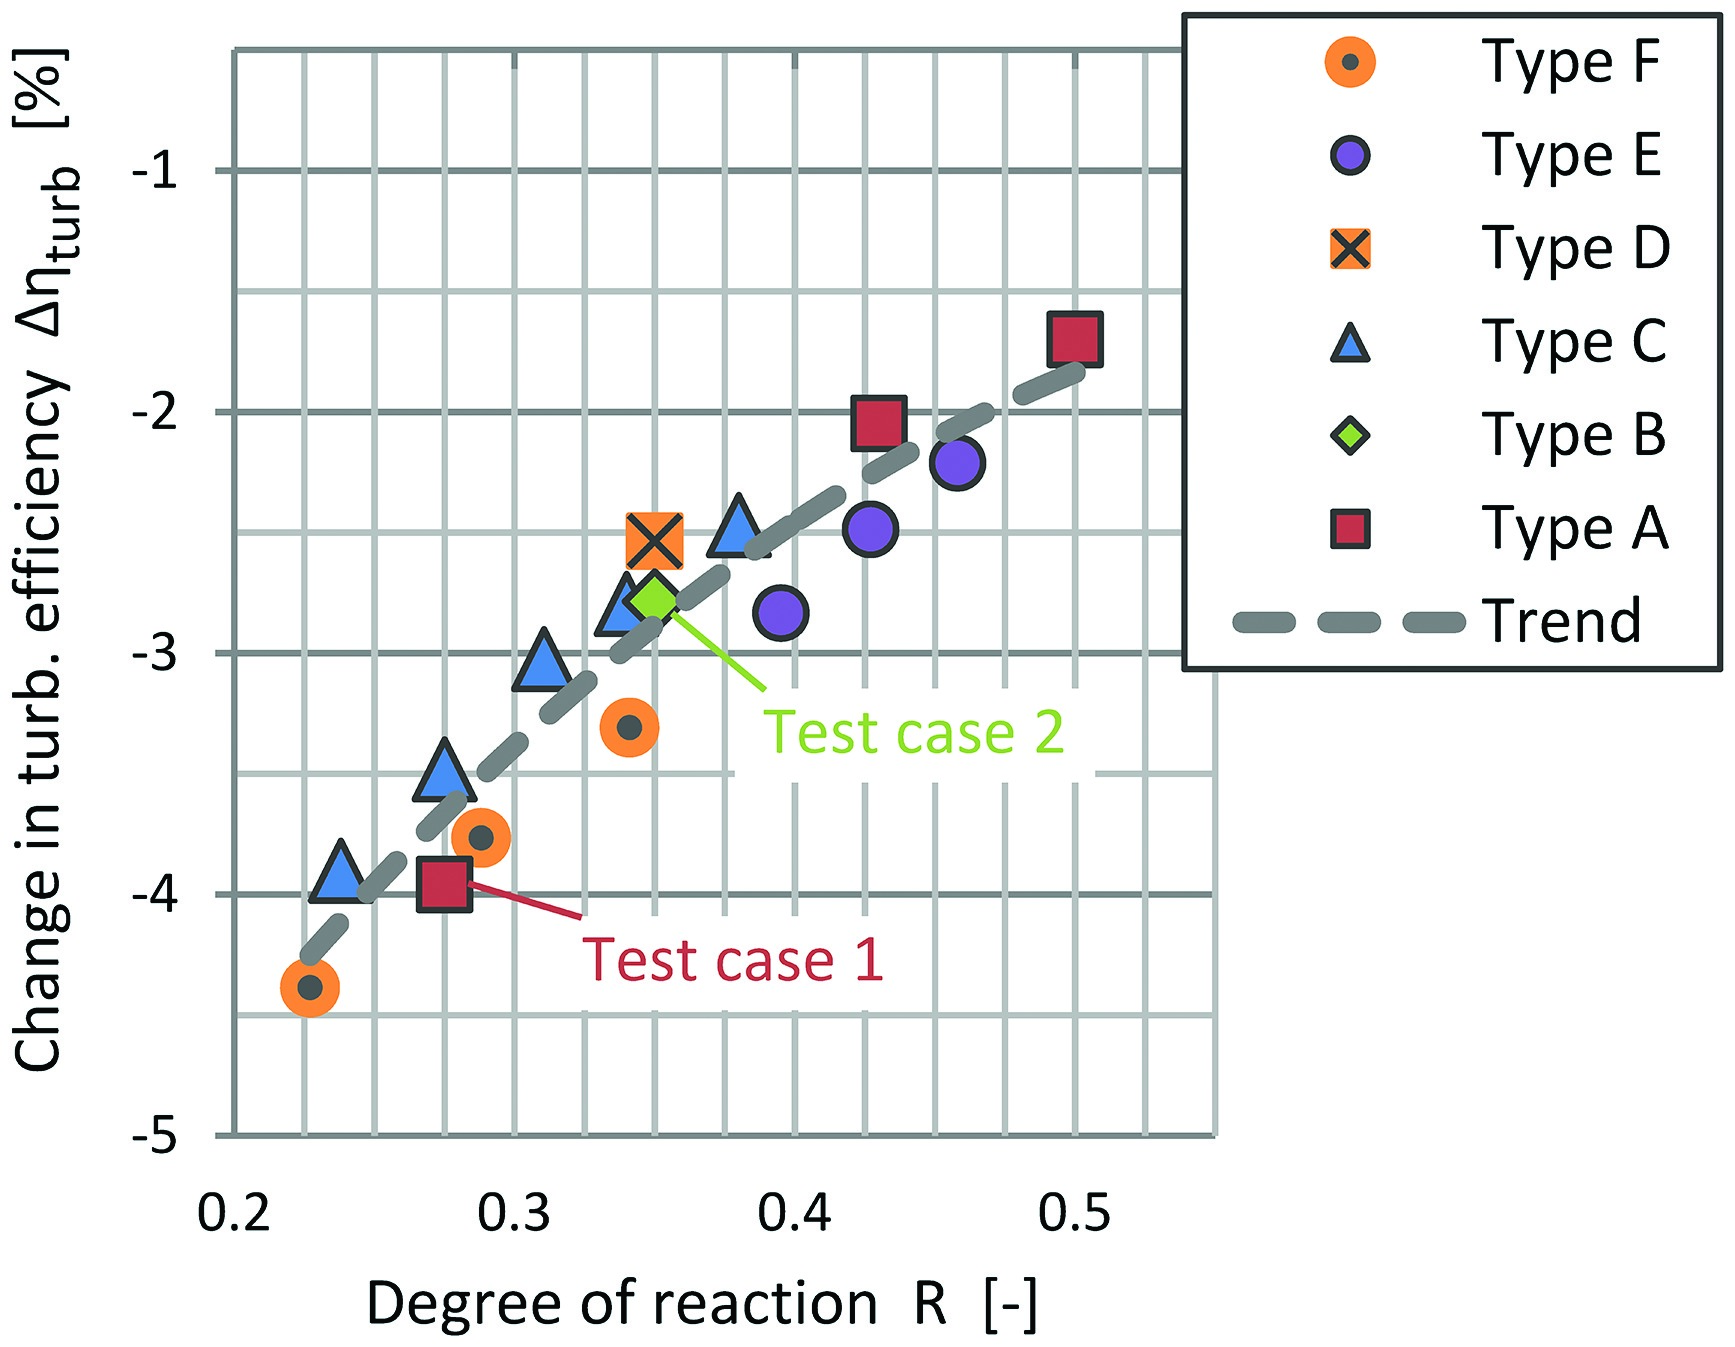
The influence of the volute surface roughness becomes bigger the more loss the volute contributes to the total loss over the stage. The higher the efficiency of the turbine wheel, the more important is the surface quality of the volute. Furthermore, the benefits of low reaction stages, as described by 07, can only be harnessed when using large turbine wheels combined with small volutes, again increasing the importance of the volute surface quality. The authors state that low reaction stages are especially “beneficial for turbines in automotive turbochargers for gasoline engines characterized by highly pulsating flow conditions.”
Conclusions
The present paper assesses the effects of surface roughness in vaneless mono-scroll volutes of turbines for automotive turbochargers by means of a calibrated CFD model. The main findings are:
1. The calibration of sand grain roughness k against measured surface roughness Sa leads to fairly good agreement between the respective efficiency changes in the CFD simulations and the HGS results for the available turbine test cases. Only small effects on the flow capacity are observed for changes in volute surface roughness.
2a. The rotor inlet conditions are affected moderately by the changes in volute surface roughness. As a result, the loss in the vortex cores at the rotor exducer is increased.
2b. The effect on the volute loss drives the efficiency changes when the roughness is increased evenly throughout the volute. In turn, the effect on the rotor loss can become significant when the roughness distribution around the circumference varies. It is therefore not sufficient to only account for the additional total pressure loss in the volute when assessing the effect of surface roughness on the stage efficiency.
3. The turbine efficiency is sensitive to changes in the surface roughness in regions with high near-wall Mach number (i.e., small cross-sections and volute exducer).
4. The sensitivity of efficiency to changes of the volute surface roughness reduces with increasing degree of reaction of the turbine stage.
More turbine test cases are necessary in order to further increase confidence in the calibrated CFD model und examine its boundaries.
Nomenclature
CFD
Computational Fluid Dynamics
CT
computed tomography
HG
Shot gas stand
PR
pressure ratio, PR = pt,3/ps,4
RANS
Reynolds-averaged Navier Stokes
Ra
arithmetic mean height of a line
Sa
arithmetic mean height of a surface
SKE
secondary kinetic energy,
SST
shear-stress transport
VS
volute size, VS = Athroat / rcog / d5,tw * 100
A
area
D
diameter
R
Degree of reaction,
k
sand grain roughness
p
pressure
r
radius
s
specific entropy
u
circumferential speed
v
velocity
w
width
β
relative flow angle
η
efficiency
ϕ
reduced mass flow,