
Introduction
Aeroengines, acting as the primary power source for aircraft, undergo rigorous operating conditions throughout their lifespan, resulting in the degradation of gas path performance (Shuang et al., 2021 & Chen et al., 2021). This deterioration can give rise to gas path failures, and in extreme cases, lead to system collapse. Consequently, the creation of precise and dependable aeroengine performance diagnosis systems is imperative to guarantee flight safety, reliability, and the extension of engine service life (Xu et al., 2022, Sun et al., 2020). Presently, the majority of engine performance diagnosis systems are grounded in the theoretical framework of gas path analysis (GPA), utilizing two primary approaches: model-based and data-driven methods.
The model-based approach focuses on establishing a precise mechanism model for quantitatively analyzing the variations in the engine's performance (Urban, 1973). Several researchers, including Gulati et al. (2000) and Aretakis et al. (2003), have conducted engine performance evaluation and fault diagnosis by deriving multiple fault equations from diverse steady-state points. Zedda and Singh (2003) have addressed the diagnosis of sensor bias in sexual energy and employed a two-level combination search of sensor and gas path components to isolate these components from each other. Song et al. (2015) have developed an engine performance prediction model and validated its accuracy in predicting the engine gas path performance status. Kim et al. (2020) have proposed a mechanism model method to predict engine performance changes in both steady-state and transient modes. However, to enhance the accuracy of the mechanism model, parameter modifications are necessary. Typically, steady-state working points are extracted from a significant amount of experimental and operational data for verification. Nevertheless, this process can be relatively complex and may result in information loss (Tsoutsanis et al., 2014).
The data-driven approach relies on utilizing existing information, experience, and data to quantitatively analyze the engine's health without the need for complex mechanism models (Wang and Zhao, 2023). To enhance detection quality and reduce setup time, Viharos and Kis (2015) proposed a fuzzy logic method that combines neural network learning with fuzzy logic and ideal solution similarity ranking technology based on user rules. Pu et al. (2013) investigated a directed graph Bayesian belief network that employs probabilistic reasoning and expert systems for knowledge representation and reasoning, demonstrating good performance in handling uncertain information. Kumar et al. (2018) introduced a method that combines fuzzy logic with support vector machines, which proves valuable not only for engine performance analysis and fault diagnosis but also for estimating the remaining life of engine components. Fentaye et al. (2019) utilized neural networks and support vector machines to quantify and classify engine component performance degradation under standard white noise. Lu et al. (2019) proposed a decentralized DKELM algorithm that significantly improves real-time performance while maintaining classification accuracy. Lu et al. (2020) presented the GPKELM algorithm, which reduces computing time without sacrificing accuracy, effectively enhancing the real-time performance of fault diagnosis. However, the data-driven model is essentially a “black box” that lacks detailed engine performance information, posing challenges for subsequent engine performance diagnostics.
With the advancements in physical model methods and artificial intelligence, the concept of digital twins has emerged as an innovative approach. A digital twin is essentially a virtual replica that is connected to a physical system or process. It collects and integrates data from the physical system using sensors, simulators, and other technologies to create an accurate visual model. Digital twin models have the capability to analyse, optimize, and predict the performance of physical systems, providing real-time information about the system's operational status and health (Bondarenko and Fukuda, 2020). However, there is currently a lack of research on digital twinning specifically in the field of aeroengines. Aeroengines are complex physical systems, and effectively integrating engine mechanism models with data-driven models to achieve digital twinning remains a challenging task (Huang et al., 2023).
This paper introduces a digital twinning framework for aeroengines that employs low-rank multimodal fusion methods to combine mechanism models with data-driven models. The proposed framework demonstrates improved accuracy in performance prediction and fault diagnosis compared to using model-based and data-driven methods separately. The mechanism model is constructed at the component level, while the data-driven model utilizes recurrent neural networks. These models are coupled through low-rank multimodal fusion methods to create the proposed data twin model. To achieve the engine performance diagnosis function of the digital twin framework, support vector machines are utilized for fault diagnosis of the rotating components in the engine gas path.
This paper presents a digital twinning framework for aeroengines, utilizing low-rank multimodal fusion methods to integrate mechanism models with data-driven models. The proposed framework showcases enhanced accuracy in performance prediction and fault diagnosis compared to employing model-based and data-driven methods independently. The mechanism model is developed at the component level, with the data-driven model incorporating recurrent neural networks. These models are interconnected through low-rank multimodal fusion techniques to form the proposed data twin model. To fulfilling the engine performance diagnosis function of the digital twin framework, support vector machines are employed for fault diagnosis of the rotating components in the engine gas path.
Methodology
Component-level model
Aeroengines are complex systems that operate in harsh environments for extended periods, leading to degradation of their gas path components and resulting changes in their performance. Consequently, developing an accurate engine performance model is vital for analysing engine gas path performance and diagnosing faults effectively (Talaat et al., 2020). With the advancement of model technology and software, aeroengine performance simulation technology has become a fast and reliable tool for engine engineers to evaluate engine performance. Common engine performance models can be broadly classified into two categories: mathematical theoretical models and component-level models (Li et al., 2012). Component-level models are preferred over mathematical theoretical models as they provide a more comprehensive description of engine gas path components' characteristics and offer better guidance and support for engine performance and structural design. Therefore, subsequent research in this field has focused on utilizing engine component-level models as the foundation for analysis and development.
The engine model investigated in this study focuses on the CFM56-5B engine, which represents a typical high bypass ratio turbofan engine with two spools and a booster. The structure of the turbofan engine is depicted in Figure 1. The engine's component-level model developed for this research comprises various modules, including the intake, fan, low-pressure compressor, high-pressure compressor, combustion chamber, high-pressure turbine, low-pressure turbine, outer bypass, and nozzle. The model environment employed in this study is Matlab2020a.
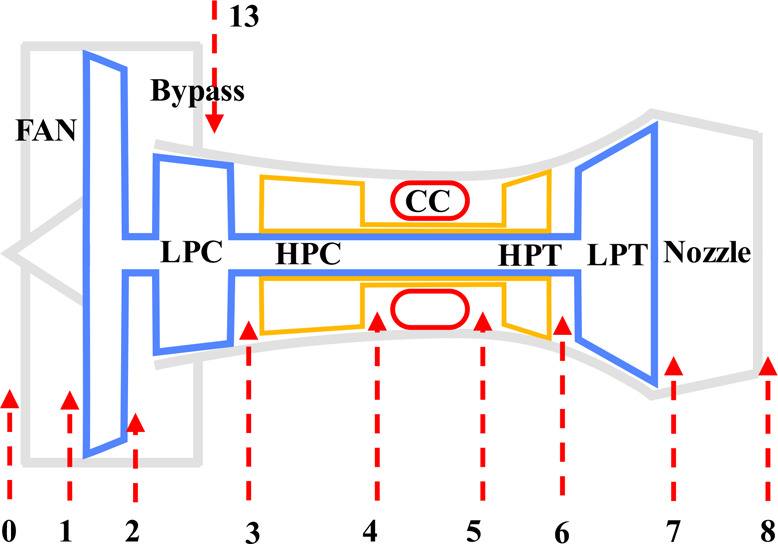
In Figure 1, each block represents a specific module within the engine model. The Intake block represents the intake port, FAN represents the fan module, LPC represents the low-pressure compressor module, HPC represents the high-pressure compressor module, Combustion represents the combustion chamber module, HPT represents the high-pressure turbine module, LPT represents the low-pressure turbine module, Nozzle represents the nozzle module, and Bypass represents the outer duct module. The model receives inputs such as flight altitude, Mach number, and fuel flow, and solves the equilibrium equations under both steady-state and transient conditions using the Newton-Raphson method (Li et al., 2018). It calculates the corresponding gas path parameters for each station of the engine during equilibrium. The component-level model possesses both steady-state and transient capabilities. Table 1 presents the design point performance of the engine, while Table 2 displays the relative absolute error (RE) results of relevant station parameters for the component-level model compared to GasTurb13 under design performance conditions. The table demonstrates that the maximum error for the same engine station is only 0.012%, indicating the accuracy of the performance calculation achieved by the developed model. The component-level model undergoes modifications through an adaptive method using component characteristic diagrams, with further details provided in reference (Li and Nilkitsaranont, 2009).
Table 1.
Design point performance.
| Parameter | Value | Unit |
|---|---|---|
| Thrust | 95.31 | kN |
| Total flow rate | 322.65 | kg/s |
| Total Pressure ratio | 33.8 | |
| SFC | 10.17 | g/(kN*s) |
Table 2.
Design point performance validation.
Data-driven model
Data-driven methods differ from model-based methods as they utilize existing information, experience, and data to quantitatively analyse engine performance changes. These methods do not require the establishment of additional complex mechanism models and possess characteristics such as dynamic learning and self-optimization. The objective of this study is to develop an accurate digital twin model for aviation engines that can monitor their health in real-time. However, component-level models often involve complex iterations, leading to low computational efficiency and difficulty in meeting engineering requirements for real-time monitoring. While data-driven models are sometimes viewed as black boxes, they can dynamically predict the future performance degradation trend of aeroengines through historical data with high prediction accuracy. Moreover, they can promptly respond to changes in engine operating conditions. Flight data typically consists of time-series data with strong timeliness, and data-driven models can only predict real-time data based on historical flight data. Therefore, extracting relevant features from historical flight data and ensuring the predictive performance of real-time data pose challenges that require the predictive ability of machine learning algorithms.
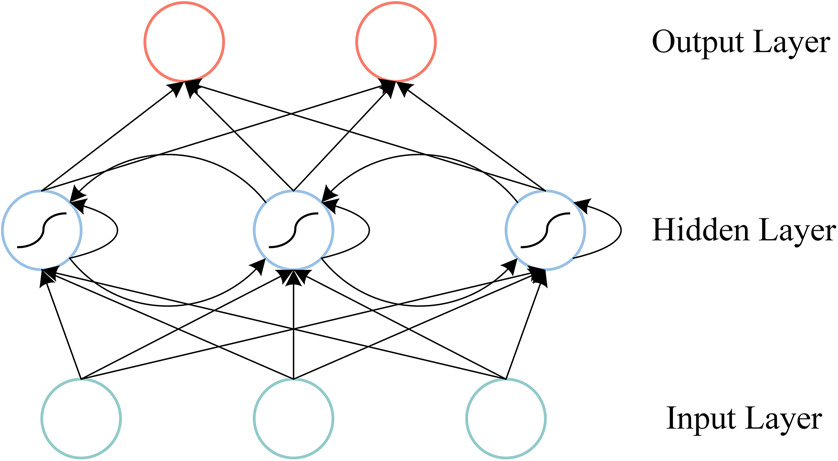
Recurrent Neural Networks (RNN) are a type of algorithm particularly suitable for learning continuous time series data. The architecture of an RNN incorporates the ability to propagate information from previous time steps to the current time step, enabling it to capture the temporal characteristics of the data. Figure 2 illustrates the structure of an RNN, which resembles that of a conventional multi-layer feedforward neural network. However, in an RNN, the output of the hidden layer neurons is fed back and utilized as input for the subsequent time step, alongside the input signals from the input layer neurons. This feedback loop allows certain neuron outputs to serve as inputs, facilitating the RNN's ability to handle time-dependent dynamics. The circular structure of an RNN allows information to flow not only from the input at time t but also from the network state at time t − 1, affecting the output state of the RNN at time t. This characteristic enhances the RNN's capability to capture temporal dependencies and handle time-related dynamic changes (Asrav and Aydin, 2023). In this study, the RNN employs a sigmoid activation function and is trained using the Backpropagation (BP) algorithm.
Low-rank multimodal musion
Multimodal musion using tensor representations
In general, modality refers to the manner in which things occur or exist, while multimodality refers to the combination of two or more modes. Modes represent different sources or forms of information, such as text, images, or voice. The current research field primarily focuses on processing three modes: image, text, and voice. The rationale behind fusing these modes is that each mode provides unique representations and perspectives on things. Consequently, there may be overlapping and complementary phenomena, as well as multiple interactions between different modes of information. Effectively processing multimodal information can result in the extraction of rich feature information and enhance prediction accuracy (Wörtwein and Scherer, 2017).
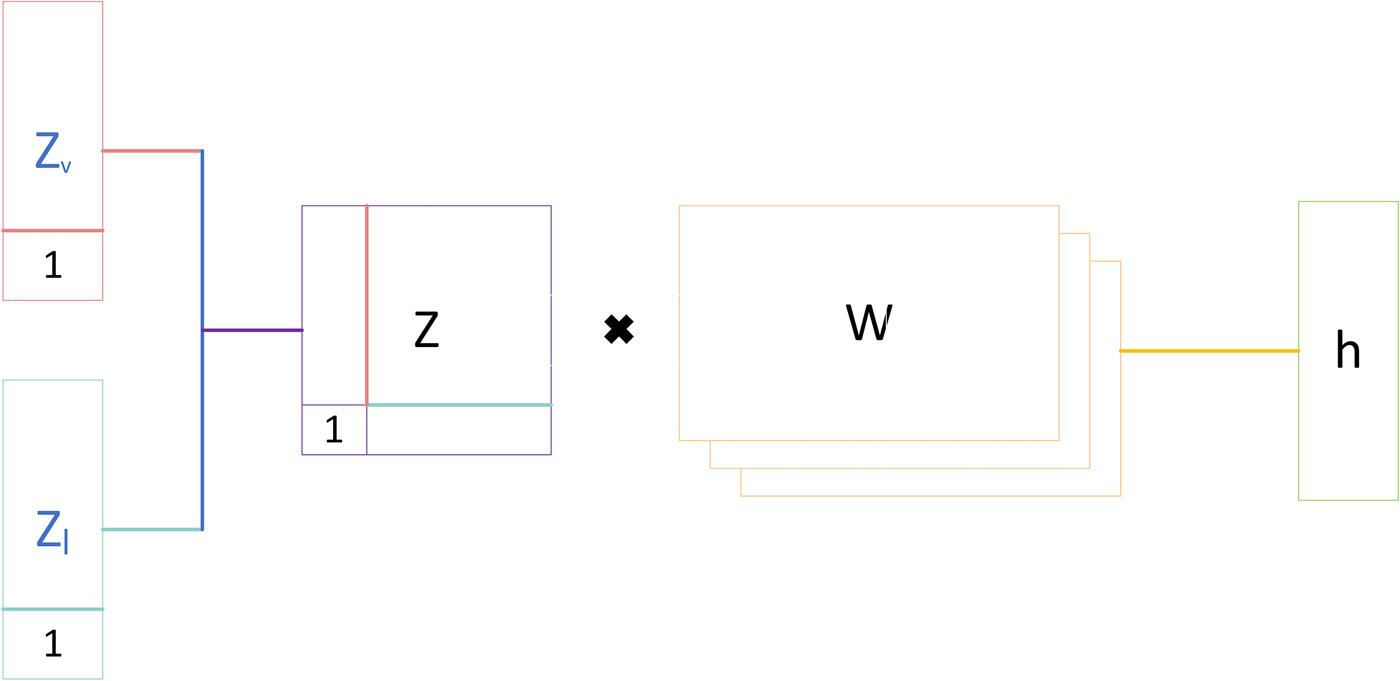
The goal of multimodal fusion is to integrate unimodal representations into a compact multimodal representation for downstream tasks. Tensor representations have gained significant attention for their ability to capture multimodal interactions. The tensor representation accomplishes this by converting the input representation to a high-dimensional tensor and then transforming it to a low-dimensional output vector space. The tensor is constructed by taking the external product of the input modes (Zadeh et al., 2017). The input tensor Z is expressed as follows:
where,
where, W represents weight and b represents offset. Figure 3 is a schematic diagram of tensor fusion under dual mode conditions.
One of the main drawbacks of tensor fusion is the need to calculate correlations between elements of different modes through tensor outer products. This process can increase the dimensionality of the feature vector significantly when the number of modes is large. This can result in a large amount of computation that can be difficult to train and may lead to overfitting.
Low-rank multimodal fusion with modality-specific factors
To address the limitations of tensor-based multimodal fusion methods when processing large amounts of modal data, this paper proposes a low-rank multimodal fusion method (LMF). LMF decomposes the weight of a tensor representation into tensor representations, utilizing the parallel decomposition of low-rank weight tensors and input tensors to calculate tensor-based fusion. This reduces the number of parameters, improves computational efficiency, and better adapts to a large number of modal application scenarios. The core idea is to perform a multi-dimensional dot product after each mode is individually linearly transformed. This involves summing the results of multiple low-rank vectors, thereby reducing the number of parameters in the model (Liu et al., 2018). The tensor of order M (M is the number of input modes) can be decomposed into vectors in the following form:
In the formula (3), the rank of the tensor is the smallest R obtained by decomposition, and the decomposition factor of the rank R of the original tensor is
The LMF method utilizes each rank r to reconstruct low rank Wk, and recombines and concatenates these vectors into the low rank factors of M modes. Equation (2) can be rewritten as:
By introducing a low rank factor to reconstruct the calculation of the weight W, formula (5) can be further rewritten as:
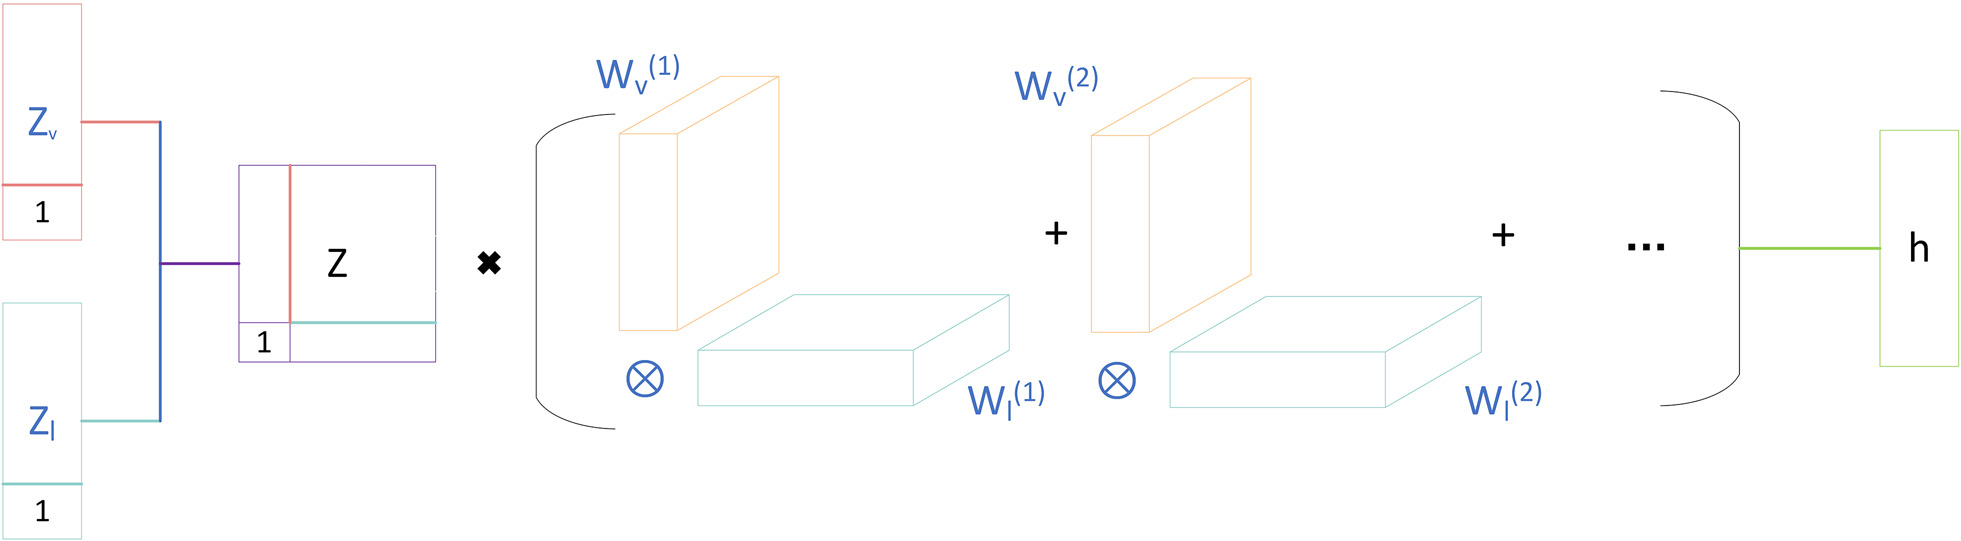
In the formula, ΛMm = 1 represents the meta product on a quantity sequence. Figure 4 shows a flow diagram for decomposing the weight tensor W into low-rank factors in a dual-mode situation. As shown in Figure 4, the low-rank factors are connected to form M-order tensors, which are used for element multiplication and summation along the first dimension of the bounding matrix. Instead of representing h using vector sets, it is calculated using modal-specific decomposition factors and parameterized by M-order tensors. This approach greatly reduces the dimensionality of the tensor Z and weight W, and prevents excessive computation and difficulty in training.
Support vector machine
SVM (Support Vector Machine) is a widely used machine learning algorithm for classification and regression analysis. The basic concept behind SVM is to find a hyperplane or decision boundary in a high-dimensional space to separate samples of different categories. In classification problems, SVM represents samples as vectors, and aims to find a hyperplane that places samples of the same category on the same side of the hyperplane, while samples of different categories are on opposite sides. If the samples cannot be perfectly separated, SVM allows a certain degree of classification error while minimizing both the classification error and the distance from the hyperplane to the sample points. This is the optimization goal of SVM. Figure 5 illustrates a schematic diagram of a linearly separable classification support vector machine (Jana et al., 2023).

SVM has several characteristics that make it a popular machine learning algorithm, including:
SVM can handle both linear and nonlinear classification problems by using kernel functions to map the input space to a high-dimensional space. This allows SVM to transform the nonlinear classification problem into a linear classification problem, making it easier to find a hyperplane to separate different categories.
SVM performs well when processing high-dimensional data. Unlike other machine learning algorithms, SVM is not affected by the curse of dimensionality, meaning that increasing the sample dimensions will not significantly impact its performance.
SVM can be effective in small sample situations, as it only uses a subset of the samples for training. This subset is called support vectors, which reduces the risk of overfitting and improves the generalization ability of the model.
Process framework
Aeroengine digital twin technology has the potential to assist operators in identifying engine issues and conducting predictive maintenance by analyzing real-time engine data. This can result in enhanced engine reliability, safety, as well as reduced maintenance costs and risks. However, achieving accurate and efficient monitoring and diagnosis of aeroengine performance using digital twin technology remains a significant challenge. To tackle this challenge, a digital twin framework has been proposed based on an engine mechanism model and a data-driven model. This framework accurately simulates the engine's operational state and assesses its health status in real-time by analyzing gas path measurement information obtained from sensors. Figure 6 illustrates the flowchart of this digital twin framework. Through the utilization of this framework, operators can effectively monitor and diagnose the performance of aeroengines with improved accuracy and efficiency, ultimately enhancing engine reliability and safety.
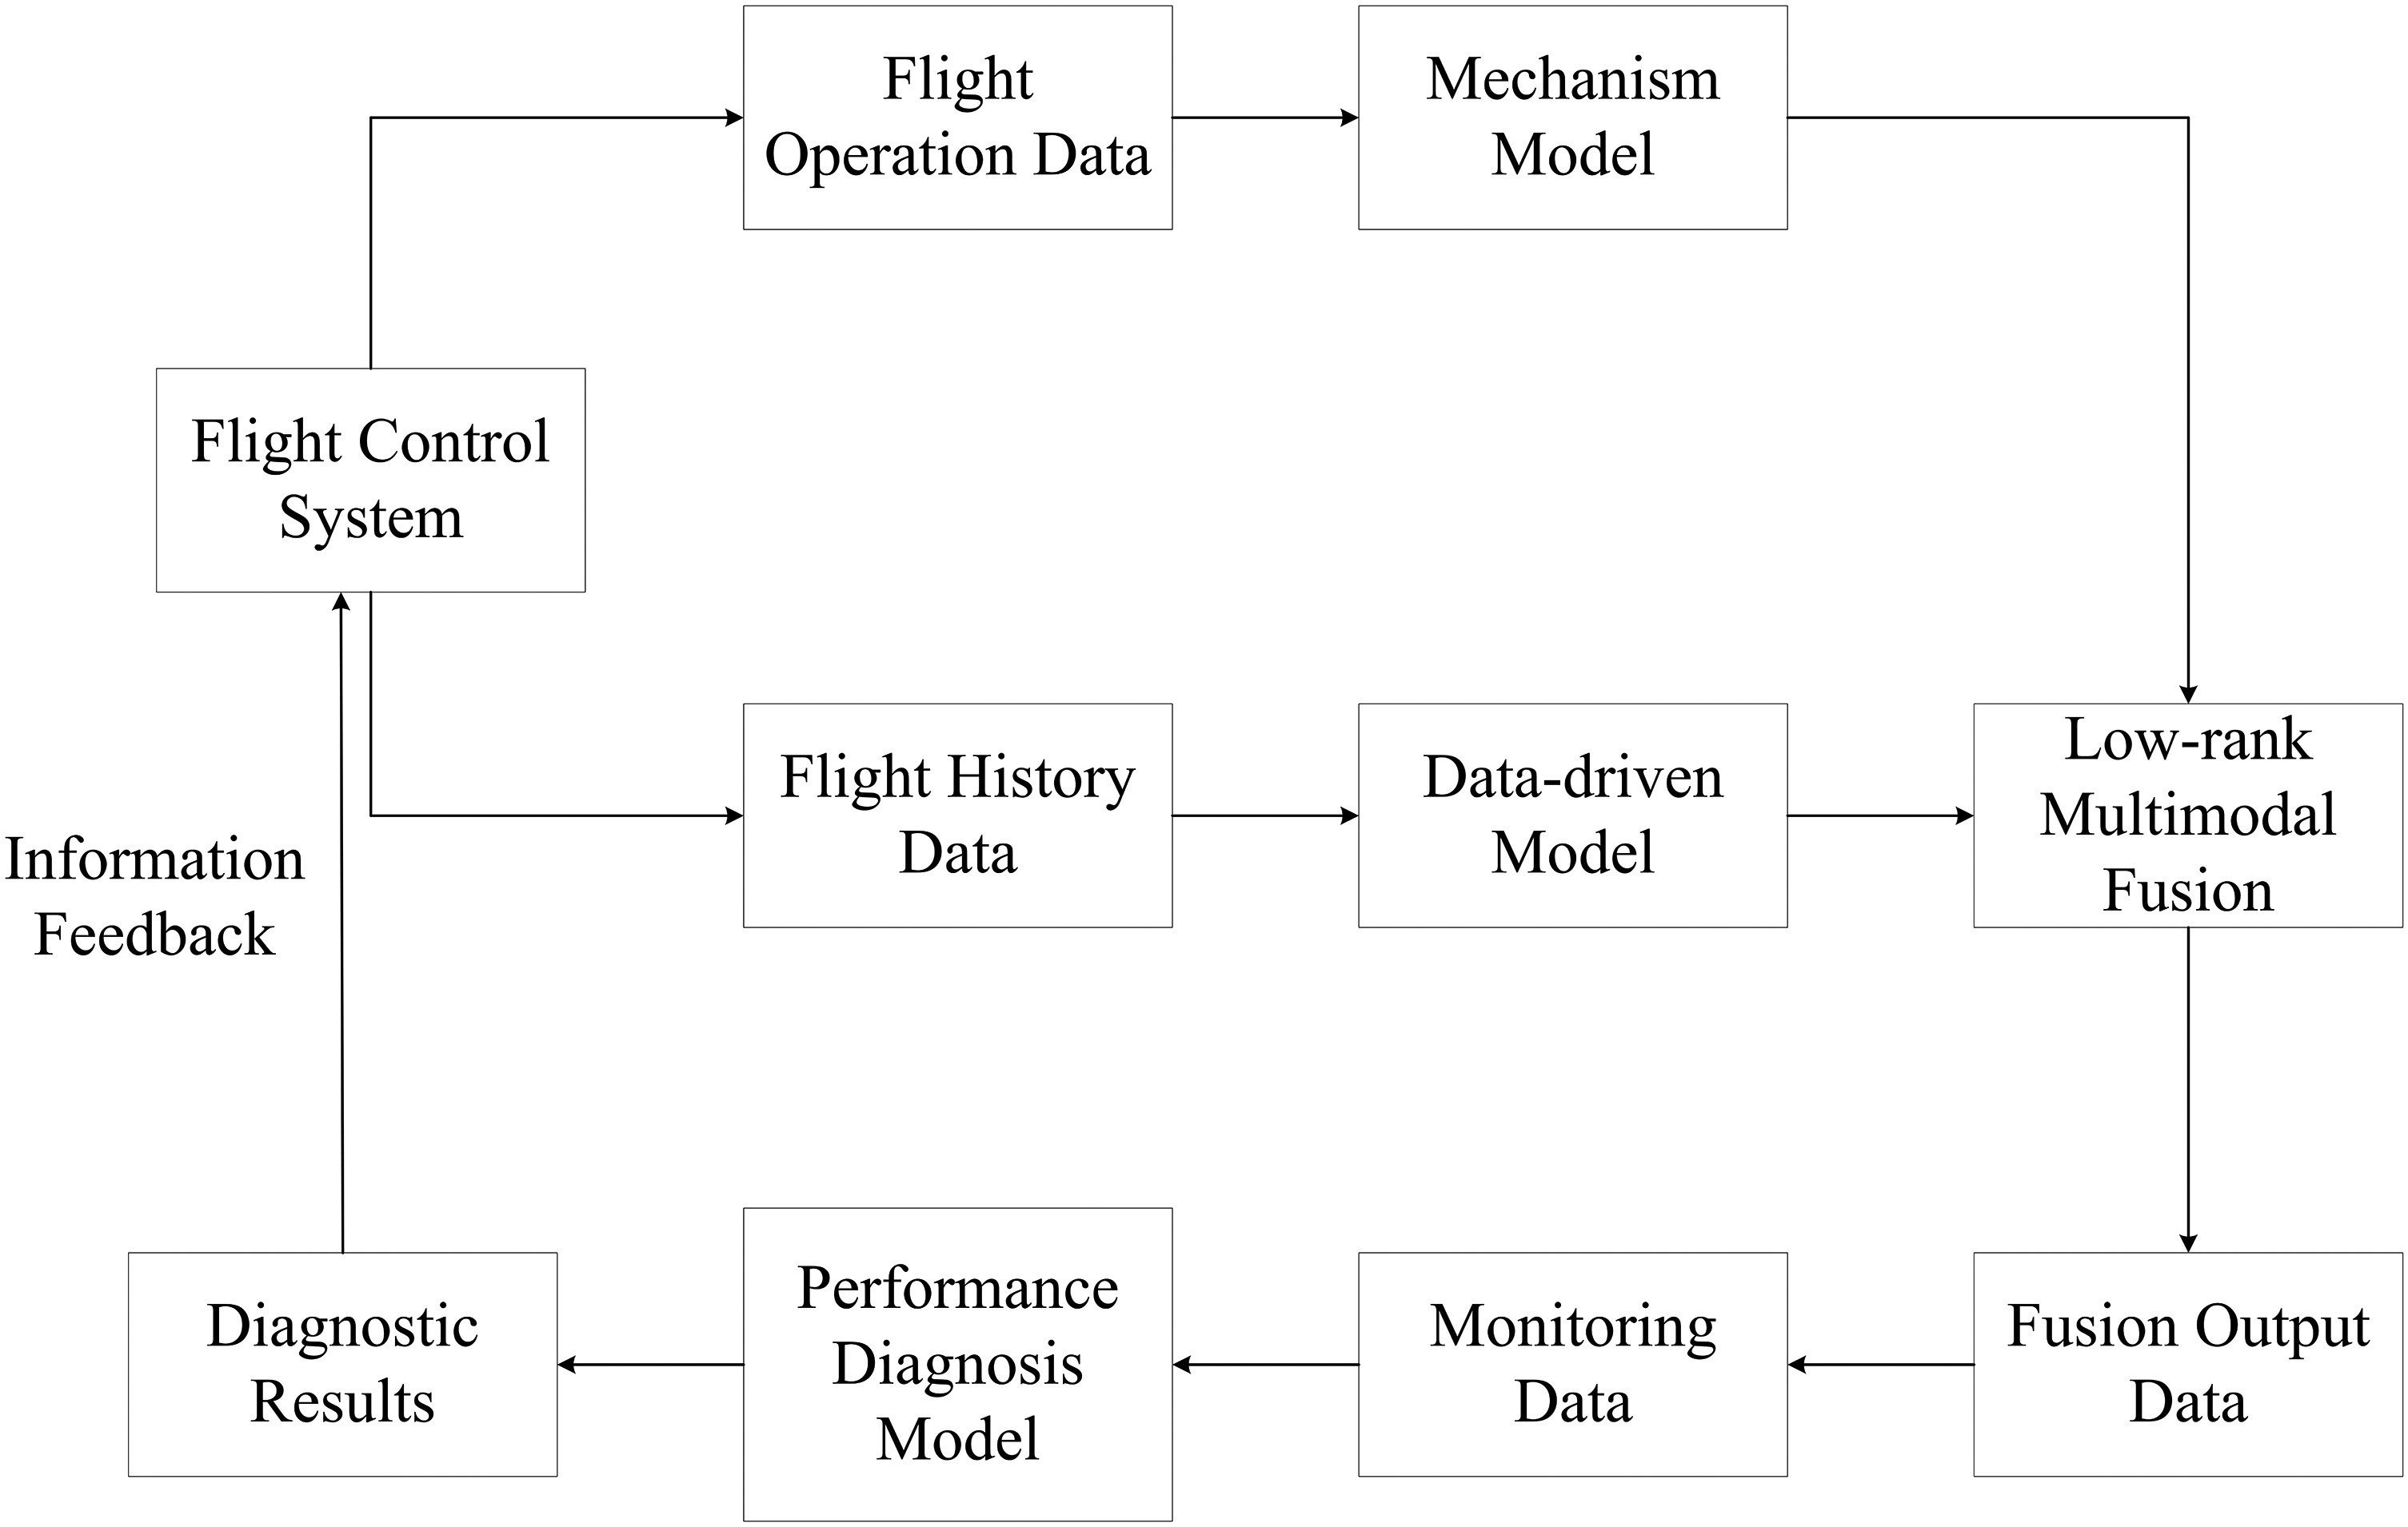
Firstly, a component-level model of the aeroengine mechanism is established to simulate the engine's gas path performance. This model can simulate the measured parameters of each gas path station's inlet and outlet sections based on the engine's operating state, effectively reflecting the engine's performance changes. The mechanism model can also be self-optimized using adaptive methods to better represent the engine's health status. Secondly, an RNN-based data-driven model is developed. Historical flight data is utilized to train the data-driven model, and the internal parameters of the RNN model are adjusted to enable real-time monitoring of flight data. Subsequently, the mechanism model and the data-driven model are integrated through LMF method, forming an engine digital twin model. In particular, the weights assigned to the two modalities are computed through the fusion of mechanism model features and data-driven model features. These weights are then concatenated with the two modal features to calculate a new fusion feature vector. This integration leverages the advantages of both models to simulate the measured gas path parameters more accurately. Finally, an engine performance diagnostic model is constructed using SVM to monitor the engine's health status. This is achieved by comparing the deviation between the simulated gas path measurement parameters and the actual monitoring parameters. The improved accuracy of the generated gas path measurement parameters obtained from the engine digital twin enables SVM to extract features more effectively, leading to more reliable performance diagnosis results.
Results and discussion
As described in Section 2.1, the developed component-level mechanistic model enables precise simulation of the engine's gas path channel and can adapt itself to track the engine's performance degradation. However, this mechanistic model assumes relatively ideal conditions and does not account for the influence of measurement noise and external environmental factors in the data. Consequently, accurately assessing the engine's real-time health status becomes challenging. In contrast, as outlined in Section 2.2, data-driven models have the ability to dynamically learn from historical and current data, providing stronger real-time capabilities. Moreover, these models can capture the effects of measurement noise and external environmental factors during the learning process. However, data-driven models act as black boxes and do not reveal the trends of unmeasurable data, such as changes in component characteristic parameters, within the engine. To address this limitation, LMF method is employed to integrate the two models and establish an engine digital twin framework that harnesses the strengths of both approaches. To assess the reliability of the developed digital twin framework, the proposed method is tested following the process framework depicted in Figure 6. After obtaining separate prediction results from the mechanistic model and the data-driven model, the LMF technique is used to fuse these results. Subsequently, SVM are employed for engine performance diagnosis. By combining the insights from both models through the LMF method and using SVM for diagnosis, the reliability of the engine digital twin framework is verified. This approach enables more accurate and comprehensive assessment of the engine's health status and performance.
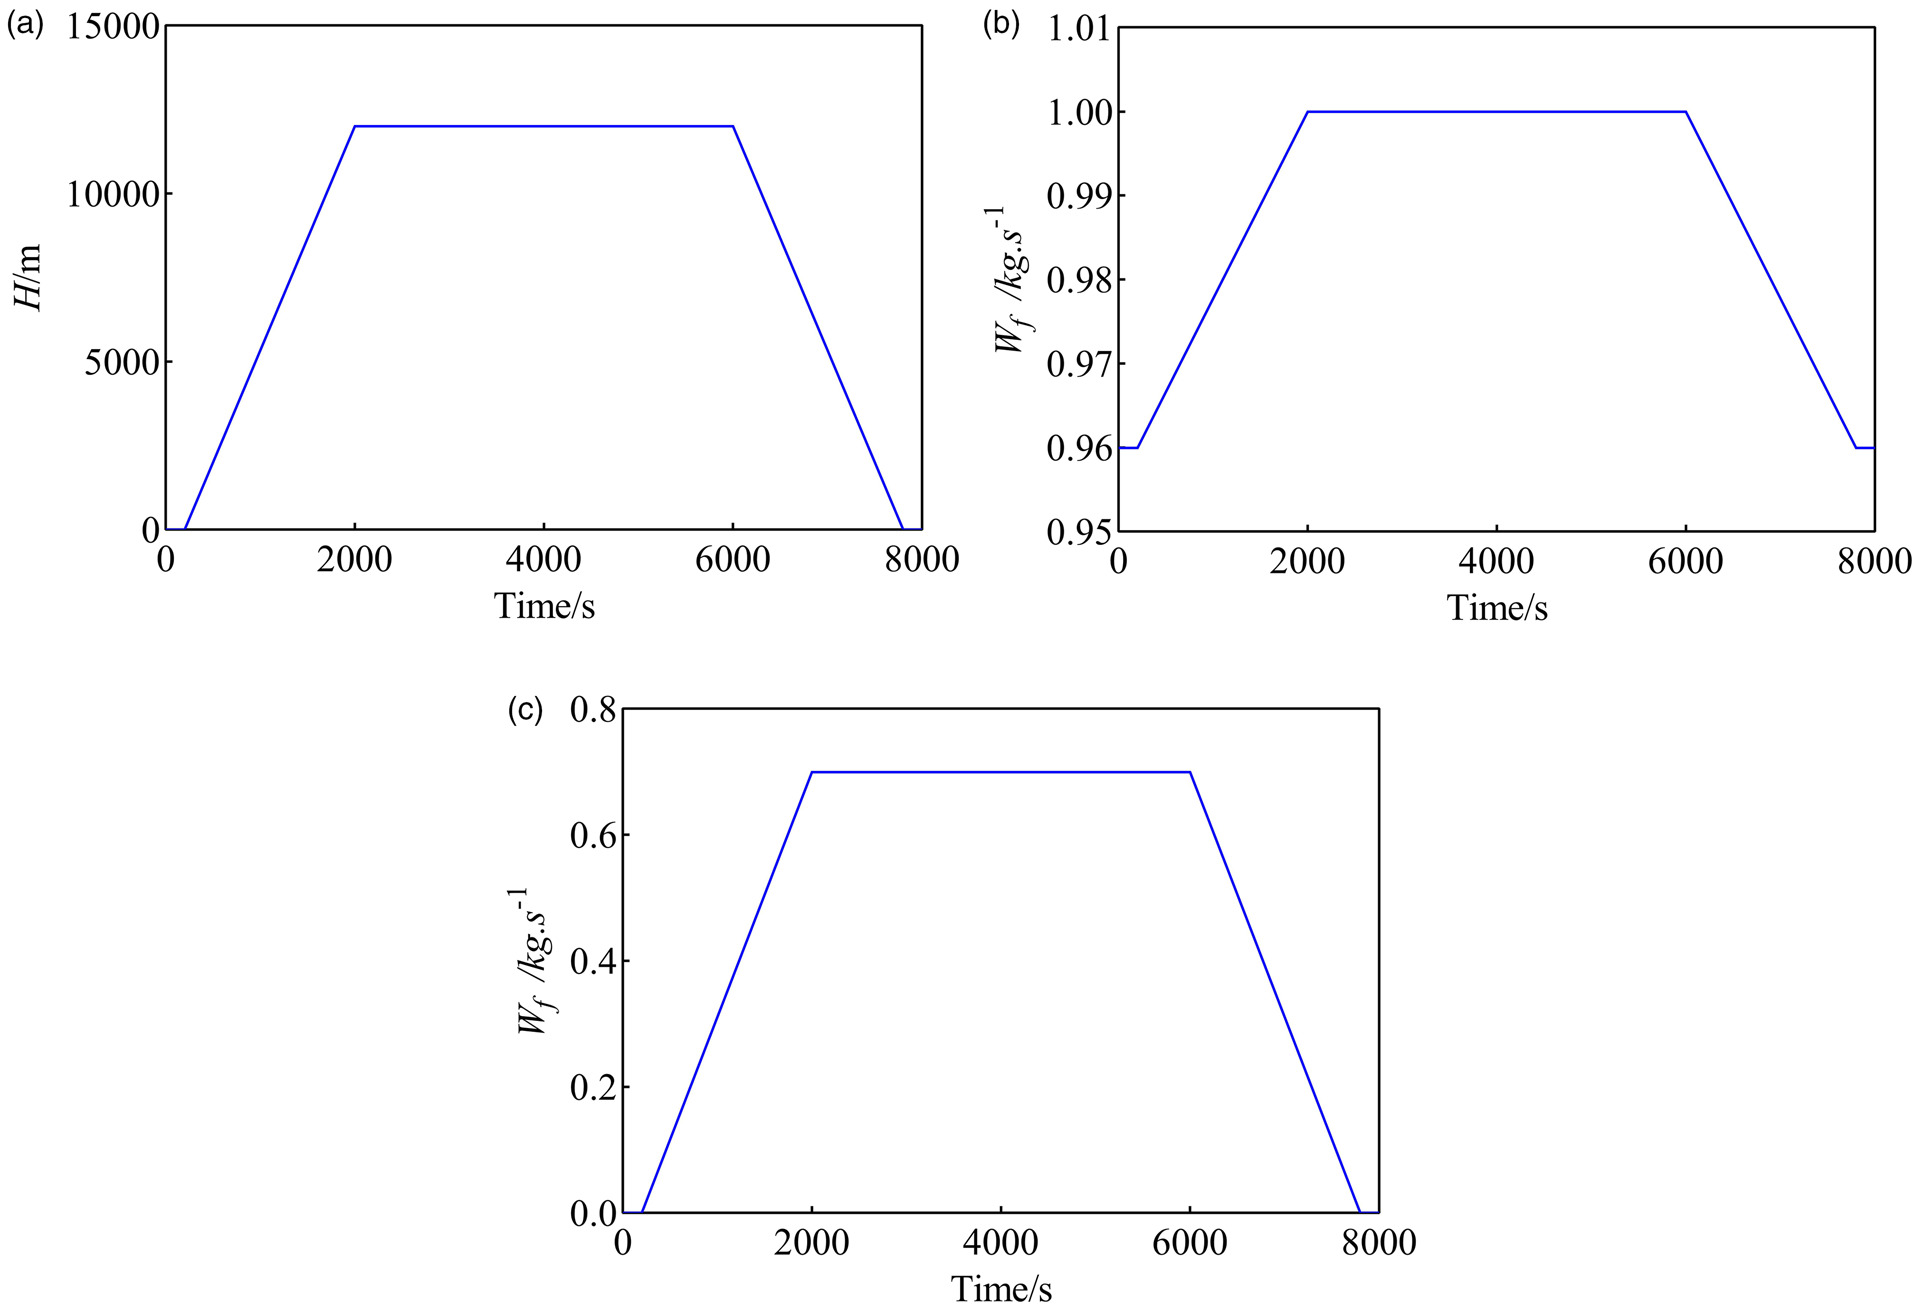
Due to the unavailability of actual flight data, simulated flight data generated by the engine component-level model described in Section 2.1 is utilized in the subsequent research. The simulated flight data generates one data point per second to mimic the real sensor acquisition scenario. In order to enhance the realism of the engine data, measurement noise is added to the simulated data to better simulate the engine's flight conditions. Assuming that the measurement noise follows a normal distribution, Table 3 presents the significance of the engine gas path data and their corresponding noise levels. In this study, we have intentionally introduced a small deviation as simulated noise after applying noise reduction techniques. However, it is important to note that the primary focus of this study does not encompass the investigation of the impact of measurement noise on model accuracy. The input to the engine digital twin framework consists of flight control data, including flight conditions such as flight altitude (H) and Mach number (Ma), as well as control regulations such as fuel flow rate (Wf). Figure 7 illustrates the input data for the engine digital twin framework in this study. The engine component-level mechanistic model computes the engine's gas path measurement parameters based on the input flight control data. These missions comprise three main stages: climb, cruise, and landing. Throughout the climb and landing processes, the engine is treated as transient, meaning it experiences dynamic changes in its operating conditions. The simulations aim to demonstrate the effectiveness and reliability of the proposed digital twin method in capturing and analyzing the engine's behavior under real-world flight scenarios.
Table 3.
Measurement parameters and noise level description
Figure 7.
(a–c). Flight Control Data. (a) Control law of H. (b) Control law of Wf. (c) Control law of Ma.
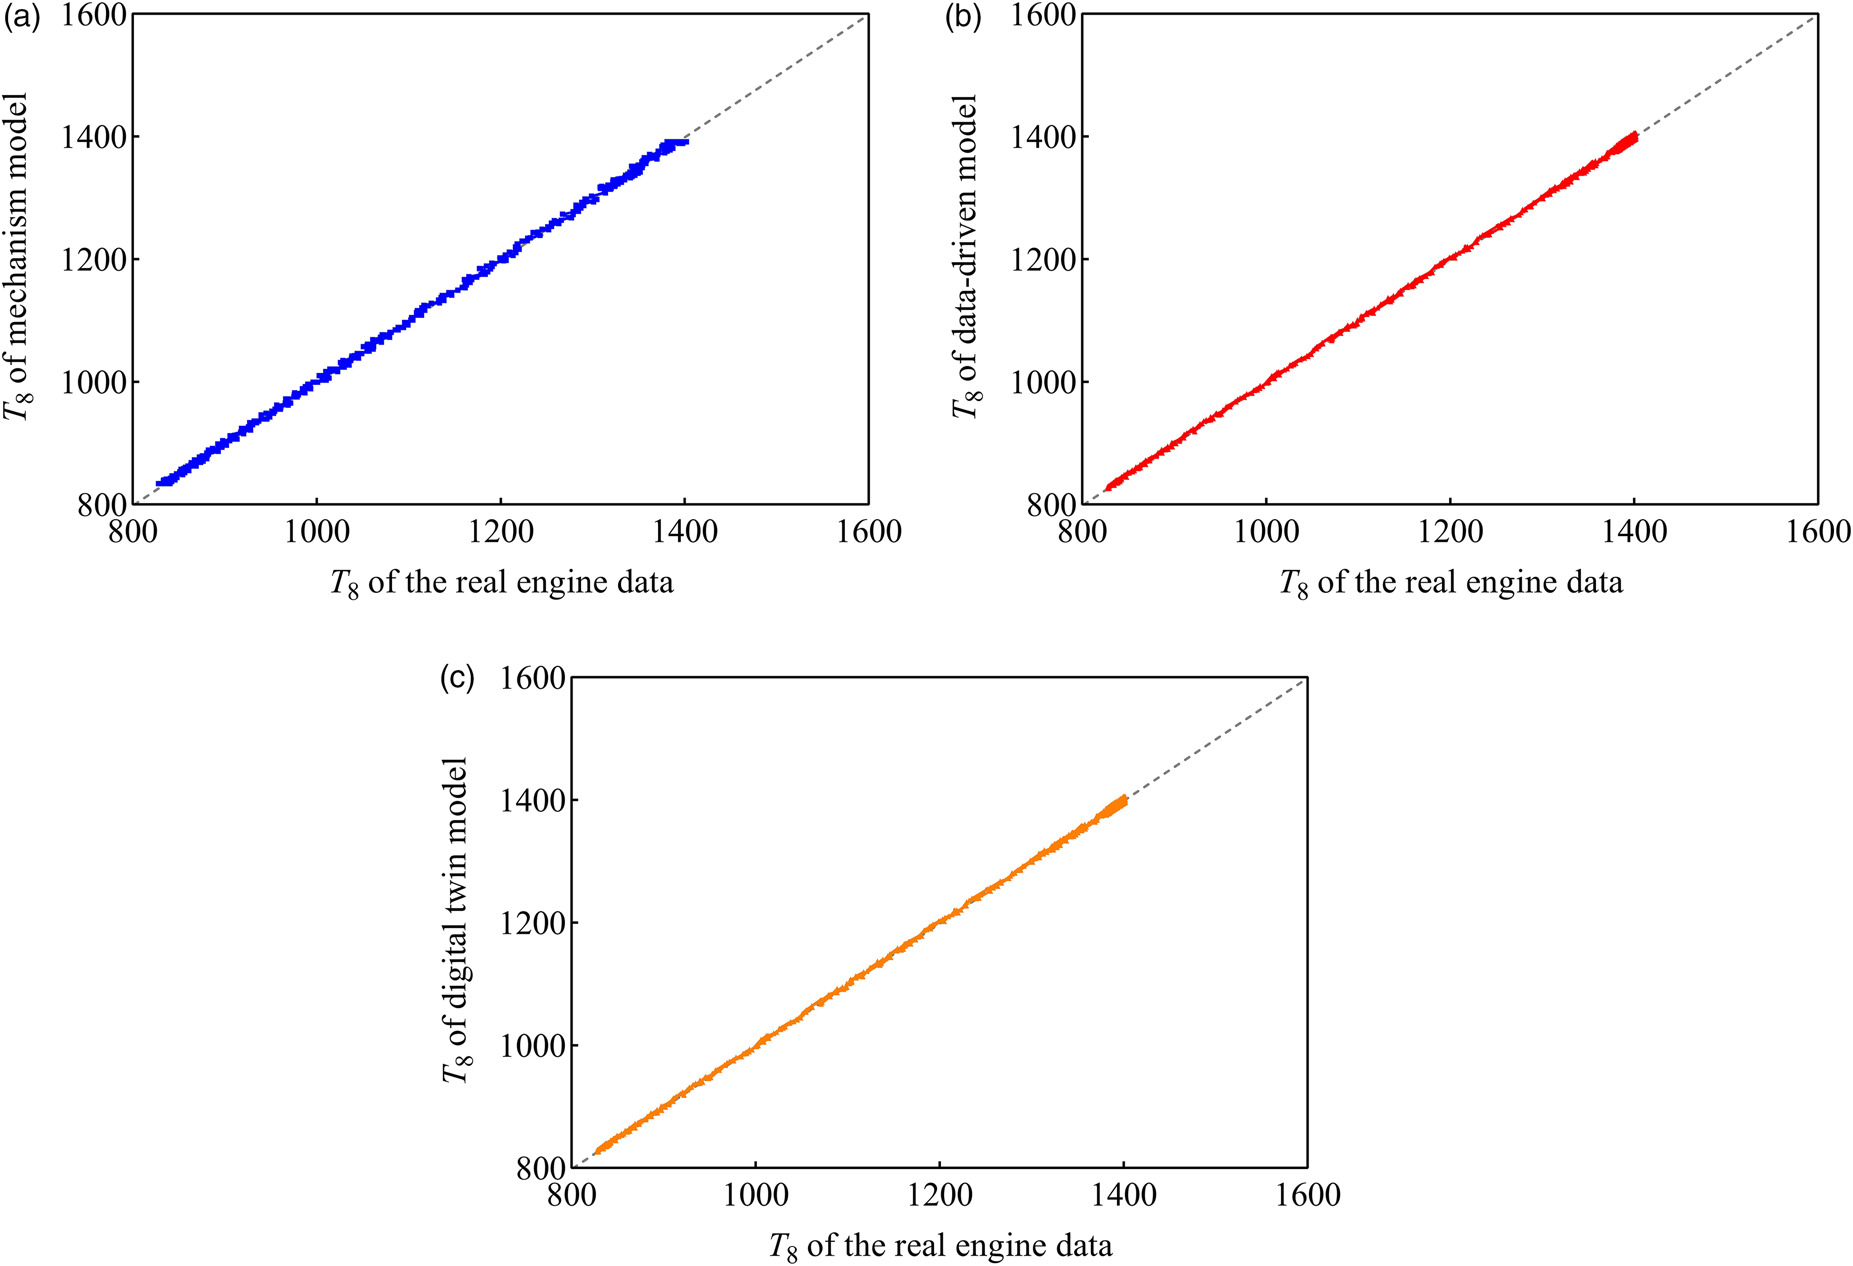
Similarly, the data-driven model, trained with sensor data, predicts the engine's gas path measurement parameters based on the flight control data. To account for the measurement issues encountered with actual sensors, the output of the digital twin framework corresponds to the gas path measurement parameters presented in Table 2. Figure 8 demonstrates the predicted values of the total temperature (T8) at the exit of the low-pressure compressor, as generated by the mechanistic model, the data-driven model, and the digital twin framework with the LMF method. From the figure, it can be observed that while the mechanistic model accurately predicts the engine's performance changes based on the flight control data, it struggles to account for the influence of measurement noise. In comparison, the data-driven model exhibits better prediction accuracy and can incorporate noise, but it may suffer from local overfitting and inaccuracies in some data points. The digital twin framework with the LMF method generates predicted results that exhibit the best fit with the actual values and are closer to the real data.
Figure 8.
(a–c). The T8 output results of each model. (a) T8 prediction distribution diagram of mechanism model. (b) T8 prediction distribution diagram of data-driven model. (c) T8 prediction distribution diagram of digital twin model.
In order to better demonstrate the advantages of the proposed digital twin framework, we compared the mean absolute error (MAE) of the predicted values of different models. The calculation formula for MAE is as follows:
where yi and y*i represent the actual value and predicted value of the i-th data sample, respectively.
Figure 9 displays the Mean Absolute Error (MAE) of the gas path measurement parameters obtained using different methods. It is evident from Figure 9 that the digital twin method yields lower errors compared to both the physics-based model and the data-driven model, demonstrating that the digital twin method significantly improves prediction performance. Although the MAE of the data-driven model is higher than that of the digital twin method, its prediction results are considerably better than those of the physics-based model. This discrepancy arises because the physics-based model captures the trend of aeroengine performance changes but cannot account for small measurement deviations present in actual measurements. On the other hand, the data-driven model can incorporate the influence of noise during the learning process, but being a black box, it fails to capture the degradation of unmeasurable parameters such as flow rate, pressure ratio, and efficiency in the aeroengine. In terms of overall MAE, the physics-based model has an MAE of 0.55%, the data-driven model has an MAE of 0.31%, and the digital twin model achieves the lowest overall MAE of only 0.24%.

Through the aforementioned case studies, we have demonstrated the predictive accuracy of the digital twin framework in accurately simulating actual gas path measurement parameters for engine performance diagnosis. However, obtaining actual fault data for aviation engines can be challenging. Therefore, in this study, a mechanistic model was employed to simulate actual engine gas path fault data. This simulated data, along with Support Vector Machines (SVM), was utilized to diagnose engine gas path performance faults, completing the overall digital twin framework. The study assessed the degree of degradation by incorporating an engine fault rule library. Based on the engine gas path analysis theory, the mechanistic model can simulate the degradation of gas path measurement parameters by modifying component characteristic parameters. This, in turn, enables the simulation of degradation in single or multiple gas path components. Common fault scenarios in the engine gas path include issues such as dirt, erosion, and corrosion. Table 4 provides the relationship between physical faults and component characteristic parameters, outlining how the degradation of specific components affects the gas path. Table 5 presents nine single and multi-type fault scenario cases studied in this research, as they have a higher probability of occurrence. The gas path fault conditions in Table 5 are represented by the corresponding component degradation conditions outlined in Table 4. Utilizing the degradation rates specified in Table 4, different gas path fault conditions are generated by randomly generating the degradation amounts of each gas path component's performance parameters. The developed mechanistic model is then used to generate gas path measurement parameters based on the gas path fault scenarios.
Table 4.
Relationship between the physical faults and health parameters
Table 5.
Cases based on the cause-effect scenario.
| Case | FAN fouling | LPC fouling | HPC fouling | LPC erosion | HPT fouling | LPT fouling | LPT erosion |
|---|---|---|---|---|---|---|---|
| 1 | × | ||||||
| 2 | × | ||||||
| 3 | × | ||||||
| 4 | × | ||||||
| 5 | × | ||||||
| 6 | × | ||||||
| 7 | × | × | × | × | |||
| 8 | × | × | × | × | × | ||
| 9 | × | × | × | × | × |
To validate the effectiveness of the proposed digital twin framework, the engine performance diagnosis function within the framework was performed using SVM, as described in Section 2.4. Table 5 presents the corresponding nine types and combinations of faults considered in the study. A total of 2,700 data samples were collected, with 300 samples for each type of fault. The confusion matrix of the predicted fault classification results is illustrated in Figure 10. Table 6 provides the diagnostic accuracy for different fault cases. The results indicate that the digital twin framework can accurately distinguish all nine fault cases, with only a small number of samples being misclassified. Notably, Case 9 exhibited the highest error rate, with a total of 19 samples being misclassified, with 9 fault samples mistakenly classified as Case 7 and 10 fault samples mistakenly classified as Case 7. Despite these misclassifications, the digital twin framework still demonstrates high accuracy, with an overall classification accuracy of 97.3%. In conclusion, the case study presented in this paper demonstrates that the proposed digital twin framework is well-suited for aeroengine performance diagnosis tasks.
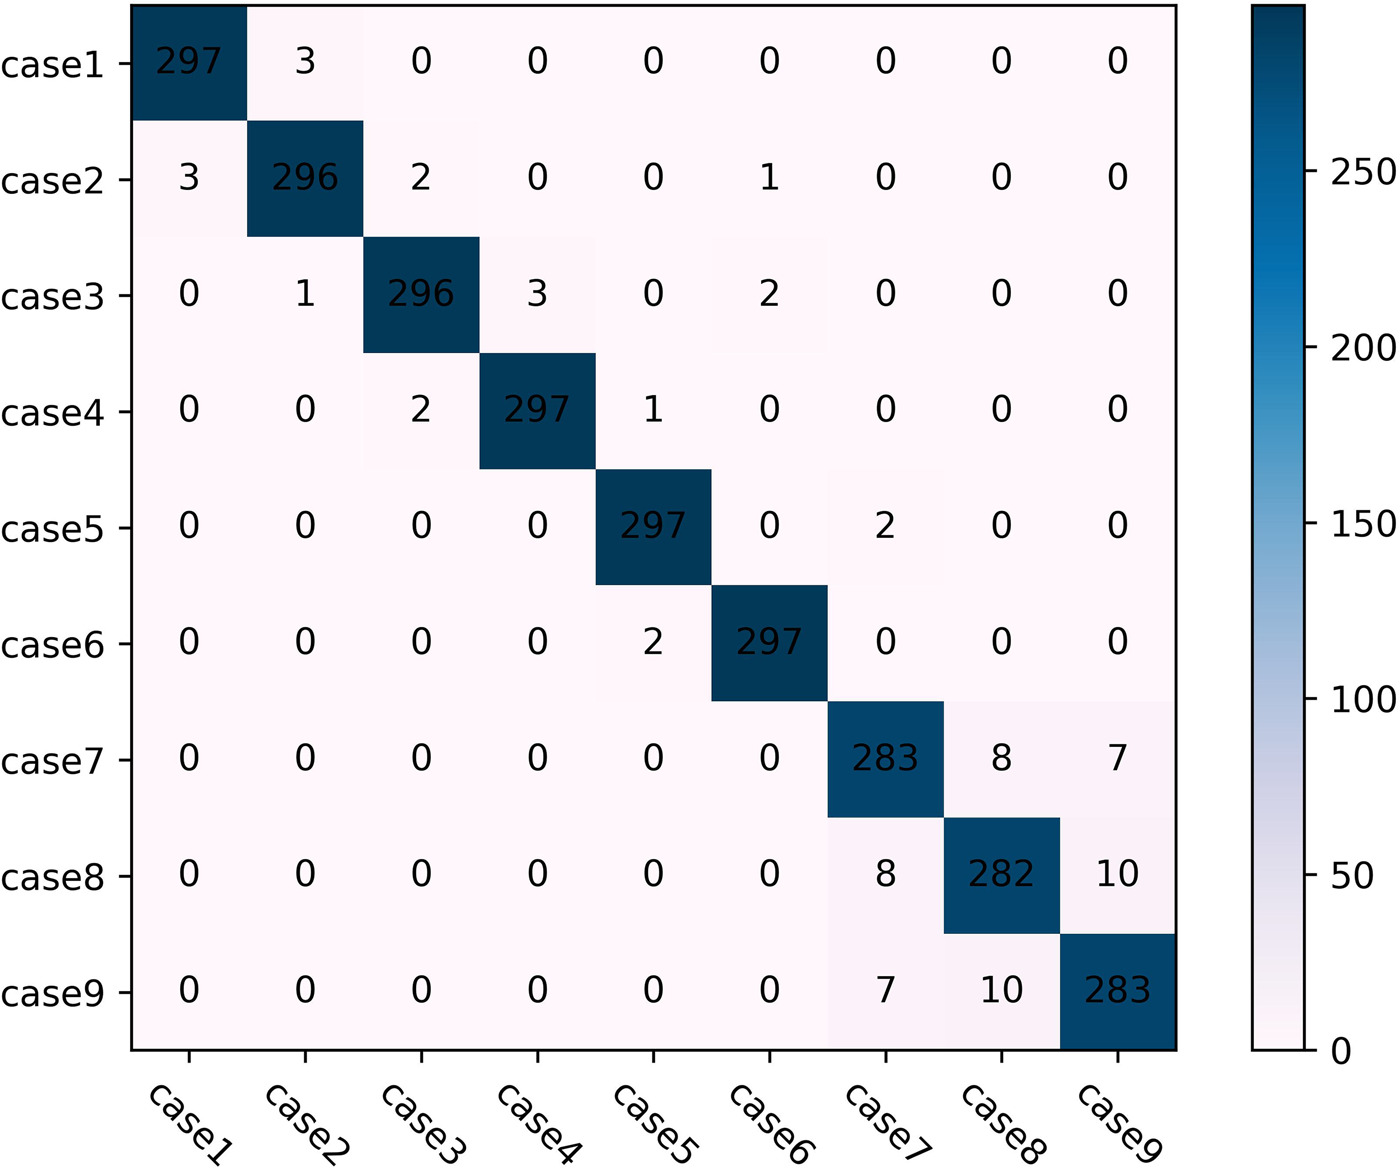
Table 6.
Diagnostic accuracy of each fault case.
| Case | Accuracy |
|---|---|
| Case1 | 99% |
| Case2 | 98.3% |
| Case3 | 98.7% |
| Case4 | 99% |
| Case5 | 99% |
| Case6 | 99% |
| Case7 | 95% |
| Case8 | 94% |
| Case9 | 93.7% |
The proposed method runs on a computer equipped with an AMD Ryzen 9 3900X CPU and 32GB of memory, allowing it to process the diagnostics of 2,700 engine operating points in just 98.7 seconds. In other words, it takes only 0.0366 seconds to analyze a single engine operating point. This impressive performance demonstrates that the proposed digital twin method is highly suitable for aeroengine performance diagnosis tasks.
Conclusions
In order to enhance the real-time performance diagnosis of aeroengines, this paper introduces a digital twin method that combines a low-rank multimodal fusion mechanism model with a data-driven model. By leveraging the different modal engine information provided by the mechanism model and data-driven model, the LWF method fuses their respective features to jointly represent them as the corresponding engine digital twin model. The engine digital twin model based on the LWF method achieves high-precision performance prediction. Additionally, by incorporating SVM for diagnosing engine gas path performance faults, the overall digital twin framework is established to accomplish engine performance diagnosis.
The feasibility of the proposed method is demonstrated through a comprehensive case study. The main conclusions derived from this study are as follows:
The proposed digital twin method outperforms the mechanism model and data-driven model in simulating the actual health status of the engine. The overall MAE of the digital twin model is only 0.24%. This significant improvement in simulation accuracy enhances the representation of gas path parameters under full flight tasks and accurately reflects the performance changes of engine gas path components.
The proposed digital twin method achieves accurate diagnosis of engine gas path faults, with an overall classification accuracy of 97.3%.
The proposed digital twin method enables real-time performance diagnosis of aeroengines, providing effective data support for engine health management.