Introduction
Owing to the remarkable and combined efforts from stakeholders across the complete fuel supply chain, alternative aviation fuels are now a reality. High oil prices and energy security, two of the main driving factors behind the initial quest for alternative fuels, are currently not of considerable concern in commercial aviation. In fact, the declining oil prices in the recent year or two have worked negatively for the promotion of alternative fuels. However, the commitment by Governments and the industry to reduce environmental impact have kept the momentum towards the development, certification and transparent integration of renewable alternatives in the aviation market. These fuels not only reduce reliance on conventional petroleum-based fuels as the primary propulsion source, but also offer promise for meeting the carbon-neutral growth target of aviation industry. As a result, fuels processed through five different pathways, Fischer Tropsch (FT), Hydroprocessed Esters and Fatty Acids (HEFA), Synthesized Iso-Paraffin (SIP), Synthesized Paraffinic Kerosene plus aromatics (SPK/A) and Alcohol to Jet (ATJ) have already been certified as blending components to the conventional jet fuel 03. Another seven alternative fuels are in the various stages of certification protocol, thus providing the aviation industry with a variety of fuel options.
Similarly, from the bulk production perspective, tremendous progress has been made in the same timeframe where a number of demonstration and commercial facilities are either up and running or will be online shortly, with large conventional oil refineries teaming up with the developers of the various alternative fuel pathways.
In the last decade, Canada has been involved in the area of aviation alternative fuels with activities ranging from the development of feedstock (e.g., brassica carinata) 01, to conversion into fuels and in the industrial qualification and demonstration of these fuels both on ground (subject of this article) and in flight 11.
The results on engine performance and air pollutant emissions, gathered from the alternative fuels qualification testing conducted over the last seven years are presented here. The work was jointly conducted by National Research Council Canada and Environment and Climate Change Canada and funded through various Government of Canada departments.
Test platforms and fuels
As shown in T1, the benchmarking data was collected on various engine platforms ranging from turbofan (F-404-400 and CF-700) to turbojet (TRS-18-046-1) to turboprop (T-56-A15) and using a variety of aviation alternative fuels and their blends at both sea level and altitude conditions. In order to provide a reference for comparison, the results collected using the alternative fuels were compared with baseline petroleum-based Jet-A1 or JP-8 conventional fuels. Some selected engine specifications as well as some key properties of the fuels, used in the various test campaigns, are given in (Table 1 and Table 2).
The first effort was undertaken in 2009 to qualify General Electric F-404-400 engine on a semi-synthetic jet fuel, which was a 50-50 blend of conventional Jet A-1 and FT fuels 10. The Synthesized Paraffinic Kerosene (SPK) FT fuel used was in turn a blend of coal-to-liquid (2/3 by volume) and gas-to-liquid (1/3 by volume) fuels refined from SASOL and Shell respectively. Engine performance, operability and emissions as well as engine durability, through accelerated mission simulation tests 09, were conducted under this test campaign.
This was followed by a novel effort in 2010 involving the evaluation of three different alternative fuels under test-cell simulated altitude conditions 07. The test fuels were: a fully-synthetic FT SPK; a semi-synthetic 50-50 blend of FT-SPK and JP-8; and a semi-synthetic 50-50 blend of Camelina based HEFA SPK and JP-8. The test vehicle was a specially instrumented 1000 N-thrust TRS18-046-1 turbojet engine from Microturbo. The experimental investigations included steady state and transient engine operations as well as emissions measurements at nominal test-cell altitudes (pressure and temperature) of 1,500, 3,000, 6,000, 9,000 and 11,500 m.
The next activity was another engine qualification test campaign in 2011, this time using semi-synthetic 50-50 blend of Camelina based HEFA SPK and JP-8 fuels on a Rolls-Royce/Alison T-56-A15 engine 05. Engine performance, operability, high-temperature 50-hr durability 02 and emissions aspects were investigated. A special objective of the work was to test the use of alternative fuel on a nearly life-expired engine with more than 6,000 hours of operation after last overhaul. As such, post-durability teardown inspection was also conducted and the hot-section components were subjected to material testing to assess the degradation of these components.
The next series of tests were conducted in 2012 using a General Electric CF-700 engine core using a 100% unblended synthetic kerosene fuel with aromatics (SKA) manufactured through the Catalytic Hydrothermolysis (CH) process 08. The feedstock for this fuel was a Canadian industrial crop called brassica carinata. Two additional fuels namely, a fully-synthetic 100% FT SPK and a semi-synthetic 50-50 blend of Camelina based HEFA SPK and JP-8 were also evaluated, back-to-back. As with the previous three projects, the whole suite of engine performance and emissions characterization was accomplished. This particular engine testing served to gain experience on the novel unblended CH renewable fuel with aromatics, prior to the world-first 100% biofuel flight conducted by National Research Council Canada 11.
Recently in 2015, the TRS18-046-1 engine platform was used again to test another novel emerging fuel called Hydrodeoxygenated Synthesized Aromatic Kerosene (HDO SAK) at test-cell simulated altitudes 04. HDO SAK is composed of approximately 95% mono-aromatic compounds. The special purpose of this testing was to investigate engine performance and emissions when using blends of SAK fuel at various levels of aromatic content in the fuel and to compare the results with conventional jet fuel. This testing also provided valuable information regarding differences between synthetically produced aromatics and conventional petroleum based aromatics.
Test and measurement methodology
In all the test campaigns reported here, the following elements and measurements were compiled:
a) Operability runs to demonstrate engine functionality during cold and hot starts and transient operations like rapid acceleration (slam) and rapid deceleration (chop).
b) Performance runs to document engine performance under steady conditions at idle, cruise and take-off conditions.
c) Emissions measurements, gaseous and particulate matter, conducted at steady state engine operation.
d) Durability runs (accelerated or limited endurance) for the cases of F-404-400 and T-56-A15 engines. The results of durability tests are not part of this article.
e) Post-test engine teardown inspection for the cases of T-56-A15 and TRS-18-046-1. The results of teardown inspections are not part of this article.
All static sea level tests, except for the T-56-A15 engine tests, and altitude testing were conducted at the National Research Council Canada facilities in Ottawa. For the T-56-A15 tests, an outdoor test stand was used. The engine installations for the four engines in the five reported test campaigns are shown in Figure 1.
Figure 1.
The four engines platforms used for testing. Clockwise from top left: F-404-400; TRS-18-046-1, T-56-A15; and CF-700.

The sea level test cell has a cross section of 7.7 × 7.7 m and is 23 m long with a capacity for 360 kg/s of airflow and 225 kN thrust. This test cell is also equipped with water injection exhaust cooling system for afterburner operation.
The altitude test chamber operates up to 14,000 m at temperatures down to −50°C (−58°F) with conditioned air flow up to 4.5 kg/s. This covers the entire operating range of the TRS-18-046-1 engine and even allowed operation beyond its rated conditions. Both pressure and temperature altitudes can be independently controlled. The chamber is 10 m long with an internal diameter of 3 m.
The measurement uncertainty related with the reported engine performance results was between 0.2% to 0.9% of full scale, with the higher uncertainty associated to the specific fuel consumption (SFC) results. These uncertainty estimates include contributions from instrument calibration hierarchy, signal processing and data reduction. As for the emissions results, the uncertainty in results was below 2%.
Performance and operability
All test engines were instrumented with conventional instrumentation, typical of development work for these engines, including static pressures and temperatures at engine inlet, fan exit, compressor exit and low-pressure turbine exit as well as surface temperatures on combustor liners. In selected cases, the following special hardware was also used:
a) K-type thermocouples, to measure temperature distribution on the after burner liner (F-404-400).
b) Dynamic pressure transducers, for the acoustic measurements in the main combustor (F-404-400 and CF-700).
c) Dynamic pressure transducers, for the acoustic measurements in the after burner liner (F-404-400).
d) Ram air pressure and temperature (TRS-18-046-1).
Each alternative fuel was tested back to back with the baseline Jet A-1 or JP-8 fuel. The throttle cycles and repeats were conducted (with slight modification for the T-56-A15 engine test) as follows:
1. Start, accelerate to idle and hold for 90 s then record emissions and performance data for 1 minute.
2. Slow acceleration to 95% shaft speed and hold for 30 s then record emissions and performance data for 1 minute.
3. Slow deceleration to 80% shaft speed and hold for 30 s then record emissions and performance data for 1 minute.
4. Slow deceleration to idle and hold for 30 s.
5. Slam (rapid acceleration) to 95% shaft speed and hold for 30 s.
6. Chop (rapid deceleration) to idle and hold for 30 s.
7. Shutdown.
8. Restart engine under hot conditions and repeat steps 1 to 6 above.
9. Switch to alternative fuel while at idle and hold for 60 s then record emissions and performance data for 1 minute.
10. Repeat steps 2 to 8 above.
11. Switch to Jet A-1 fuel while at idle and hold for 60 s then record emissions and performance data for 1 minute.
12. Repeat steps 2 to 6 above twice.
13. Shutdown.
Special fuel skids were designed and fabricated to ensure complete segregation of the alternative fuels and the baseline fuel; to avoid cross-contamination; and to allow running switch from one fuel to another without engine shut-down.
Emissions measurement
Emissions measurements were made to record gaseous species of carbon dioxide (CO2), carbon monoxide (CO), nitrogen oxides (NOx) and total unburnt hydrocarbons (THC), as well as the particulate matter (PM) number size distributions and PM mass. These continuous measurements were made during the steady state operation of the engines. Several samples were drawn and analysed to ensure repeatability and for statistical significance.
Non-Dispersive Infrared (NDIR) analyzers was used for CO2 and CO measurements while Heated Chemiluminescent (HCLD) and Heated Flame Ionization (HFID) detectors were used for NOx and THC measurements respectively. Engine Exhaust Particle Sizer (EEPS) spectrometer was used to measure the particle number size distributions. Additionally, for the most recent tests on CF-700 and TRS-18-046-1 engines, a high sensitivity Laser Induced Incandescence (HS-LII) instrument was also used to measure black carbon emissions.
Sampling probes were designed and fabricated to obtain uniform sampling across the engine exhaust with due consideration to allowable blockage at the engine exhaust. All measurements were made 50 mm downstream of the engine nozzle exit plane. Sample from the engine exhaust was extracted and was appropriately diluted to prevent condensation and to reduce the particle and gaseous concentrations to levels acceptable for the analyzers. The dilute exhaust was then transferred to the analyzers via heated lines. The appropriate dilution factors were determined via separate laboratory tests. These laboratory tests also helped in verifying the particle loss rate along the heated sampling lines.
Analyzers were calibrated at least three times per test day using ±1% purity gases. Similarly, EEPS was sampled periodically to ensure no baseline drifting and its electrometer was cleaned at the end of each test day to maintain optimum sensitivity of the instrument.
The measurement signals for the different gaseous compounds were converted to concentration (in ppm) based on the calibration curves, which were then corrected for background concentration before converting to emission rates following the procedure outlined in the SAE International, Aerospace Recommended Practice 1533 12. Particle number emission rate calculations followed the procedure outlined in .
Results and discussion
All engine operability, performance and emissions data were corrected and normalized using standard practises 13, to minimize the effects of variations in ambient conditions and to ensure that any differences observed in the results were due to change in the fuel type only. The SFC values were also corrected by the fuel heat of combustion (LHV). Sample results are discussed in this section and the maximum relative differences in main parameters of merits between baseline conventional Jet A-1 (or JP-8) fuel and the alternative test fuels are summarized in (Table 1).
Engine operability and performance
Operability checks involved recording various parameters like thrust/power, engine spool speed, temperatures and pressures at various locations and engine vibrations during starts and transient operations. The engine starts checks included both cold and hot starts, while the transients comprised slow and fast accelerations and decelerations (slams and chops). A sample result of engine exhaust gas temperature (EGT) during hot starts for F-404-400 engine is shown in Figure 2. No difference of significance is observed from the use of alternative fuels relative to the baseline fuels. Similar results were observed during the operation of T-56-A15, CF-700 TRS-18-046-1 engines.
Figure 2.
Engine hot start transient response: Sample result showing F-404-400 EGT profiles of Jet A-1 and 50% FT SPK.
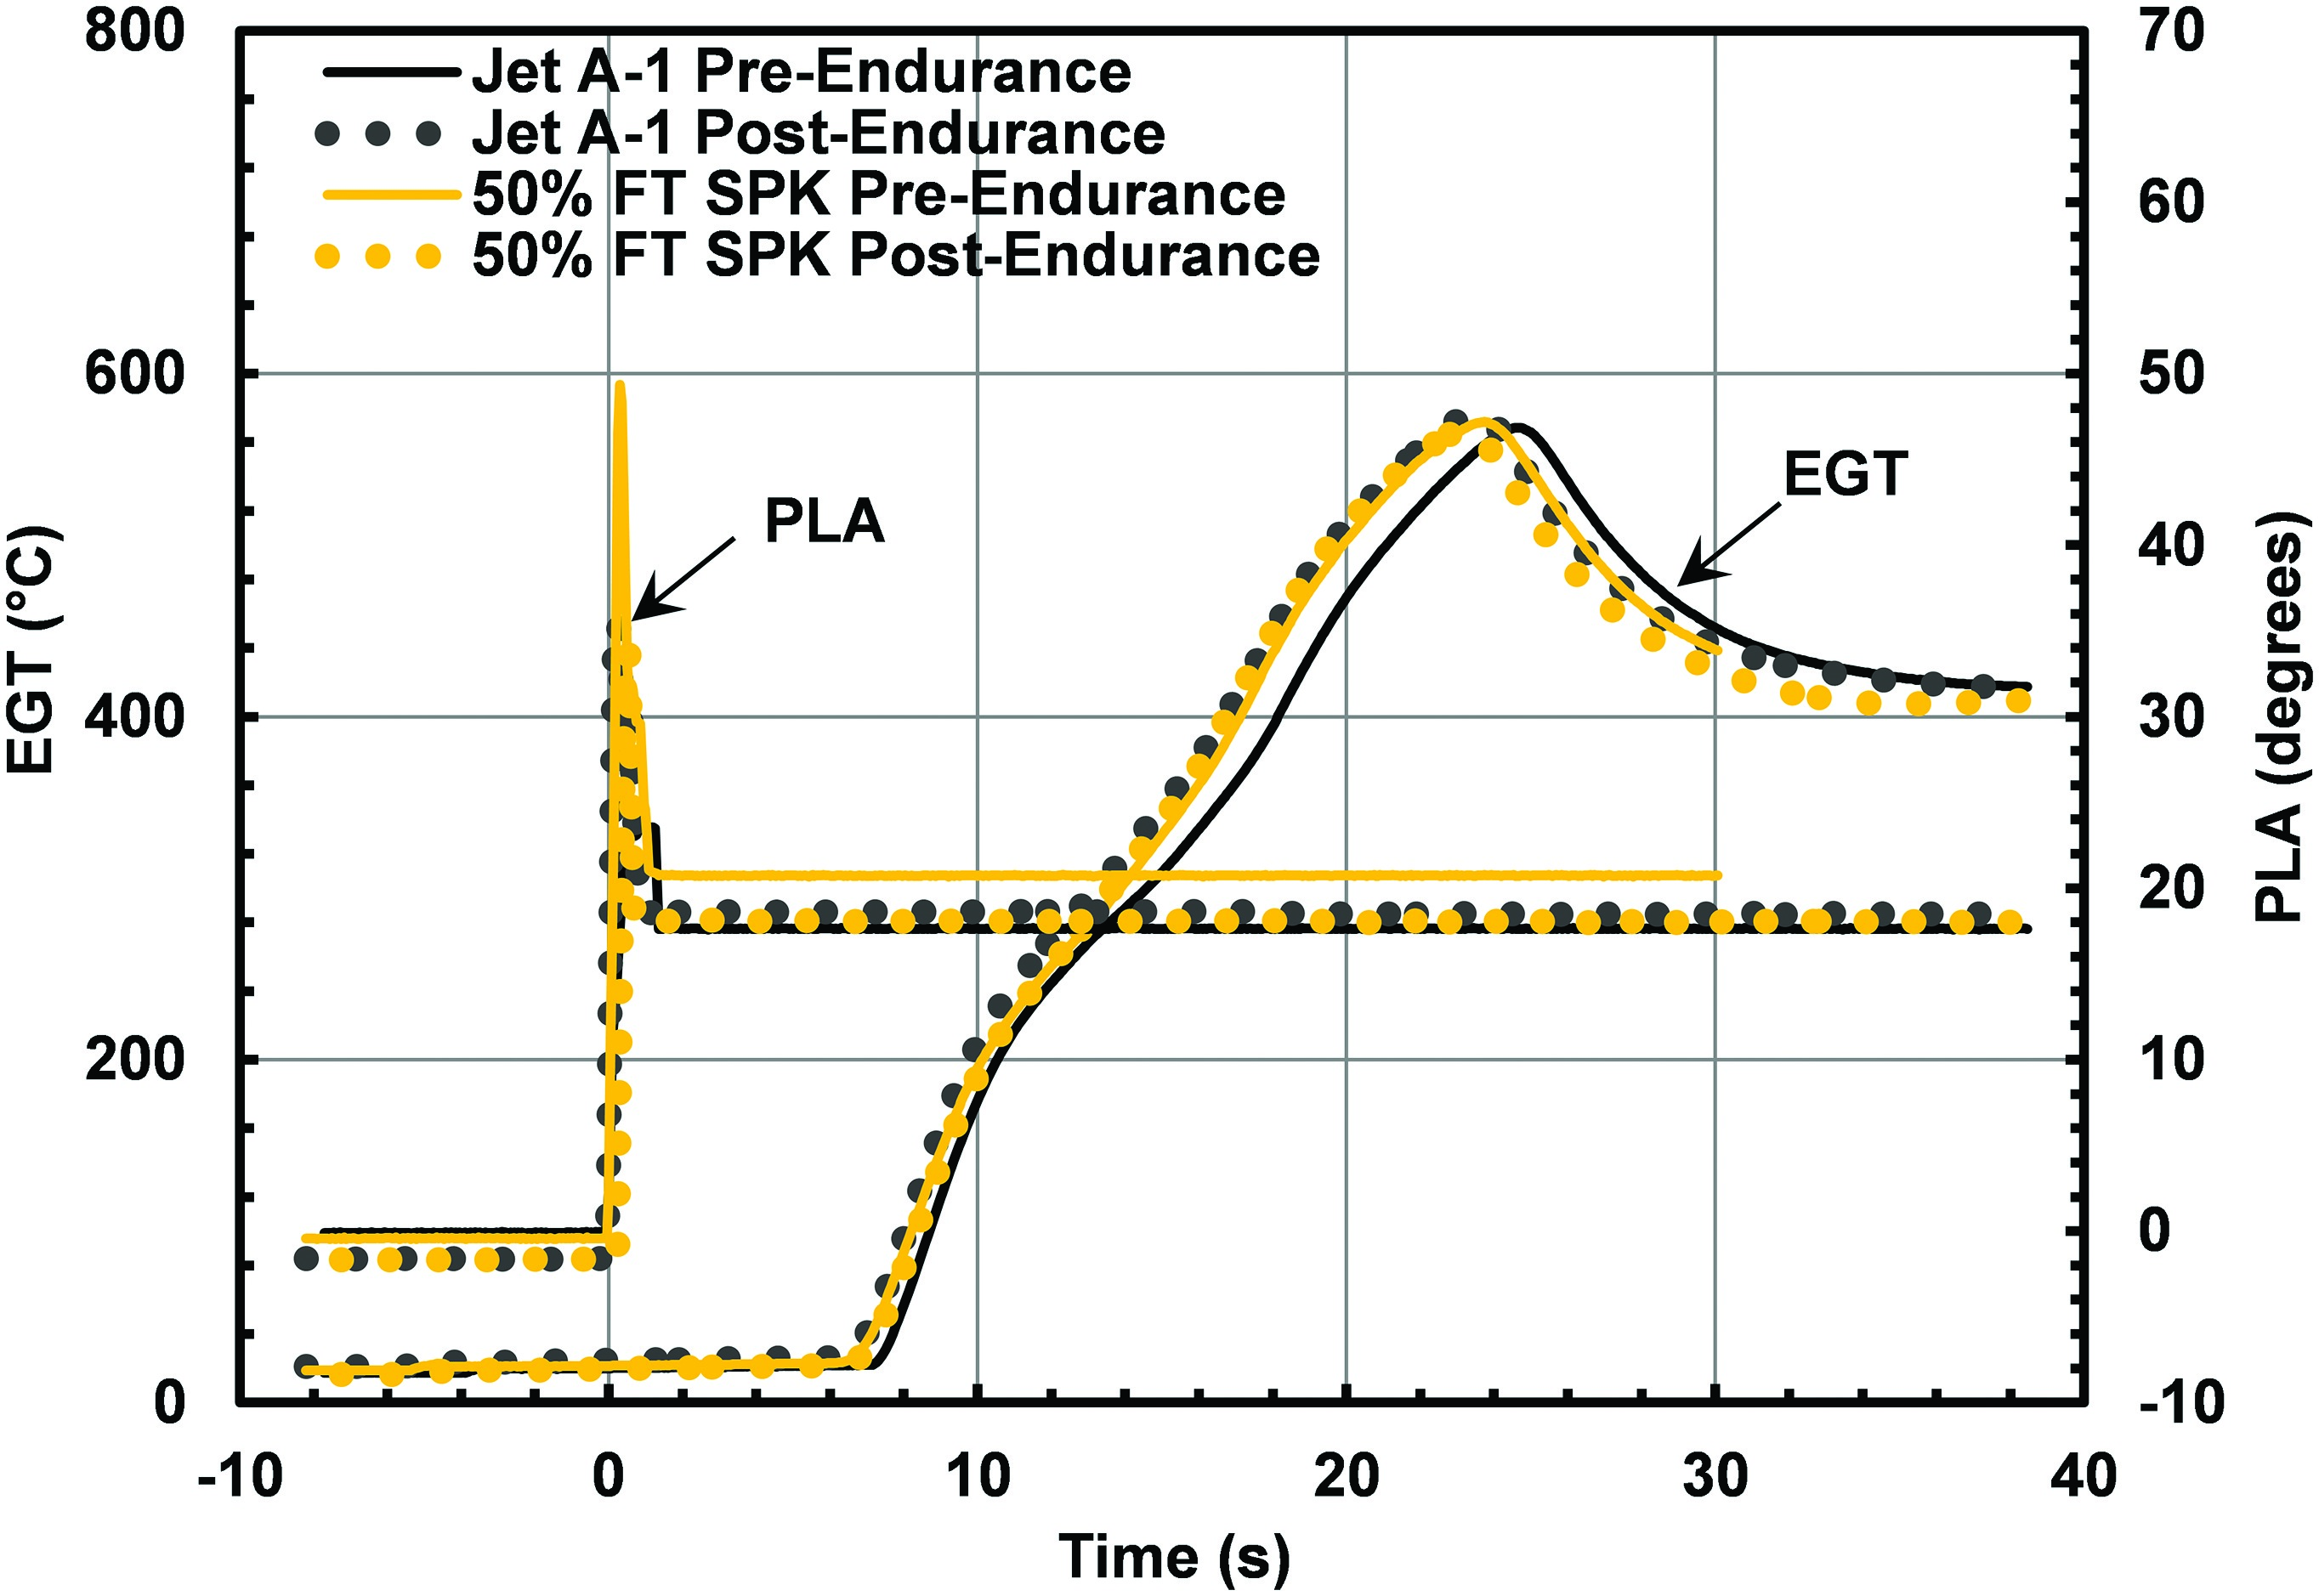
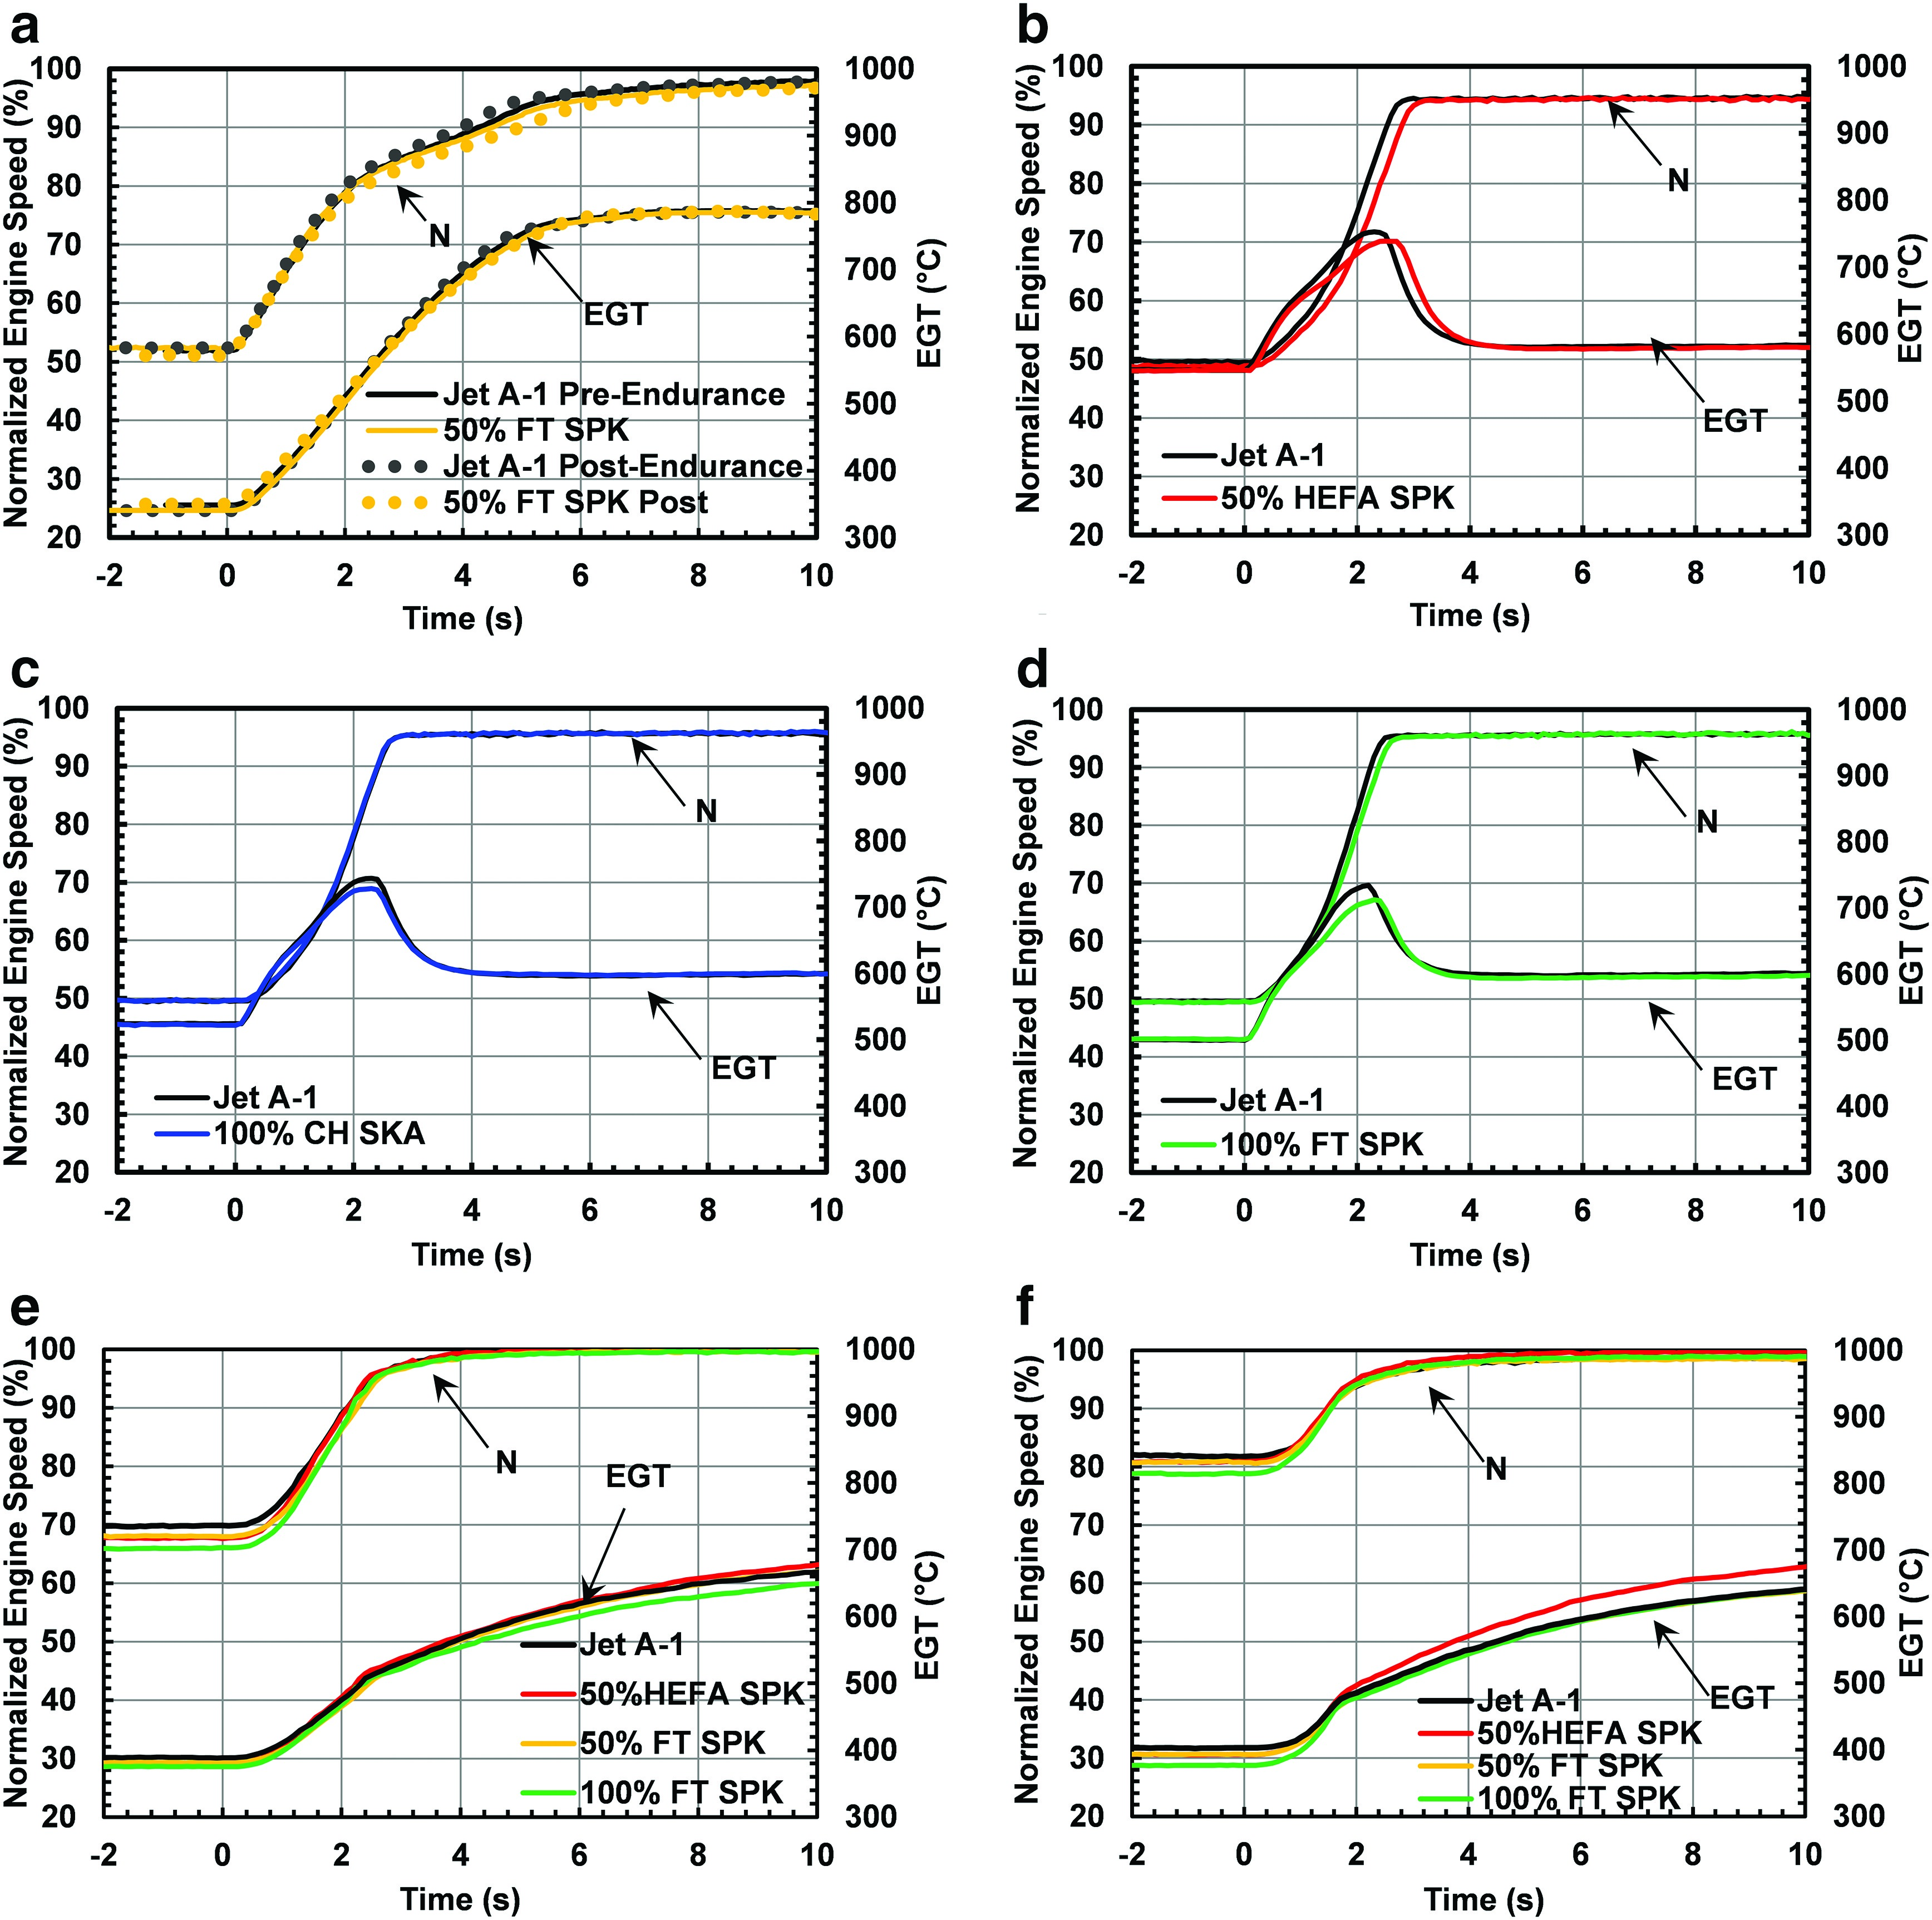
Figure 3 shows the rapid acceleration profiles for three engines: F-404-400, CF-700 and TRS-18-046-1 in terms of normalized engine speed and EGT. For TRS-18-046-1, the engine transient responses are shown at two different altitudes, 3,000 and 6,000 m. Within the bounds of the experimental uncertainties, the engine response from the use of alternative fuels was comparable to that of conventional fuels.
Figure 3.
Rapid acceleration response of normalized engine speed (N) and EGT: (a) F-404-400, Jet A-1 vs. 50% FT SPK; (b )CF-700, Jet A-1 vs. 50% FT SPK; (c) CF-700, Jet A-1 vs. 100% CH SKA; (d) CF-700, Jet A-1 vs. 100% FT SPK; (e) TRS-18-046-1 at 3 km, Jet A-1 vs. 50% FT SPK, 50% HEFA SPK and 100% FT SPK; (f) TRS-18-046-1 at 6 km, Jet A-1 vs. 50% FT SPK, 50% HEFA SPK and 100% FT SPK.
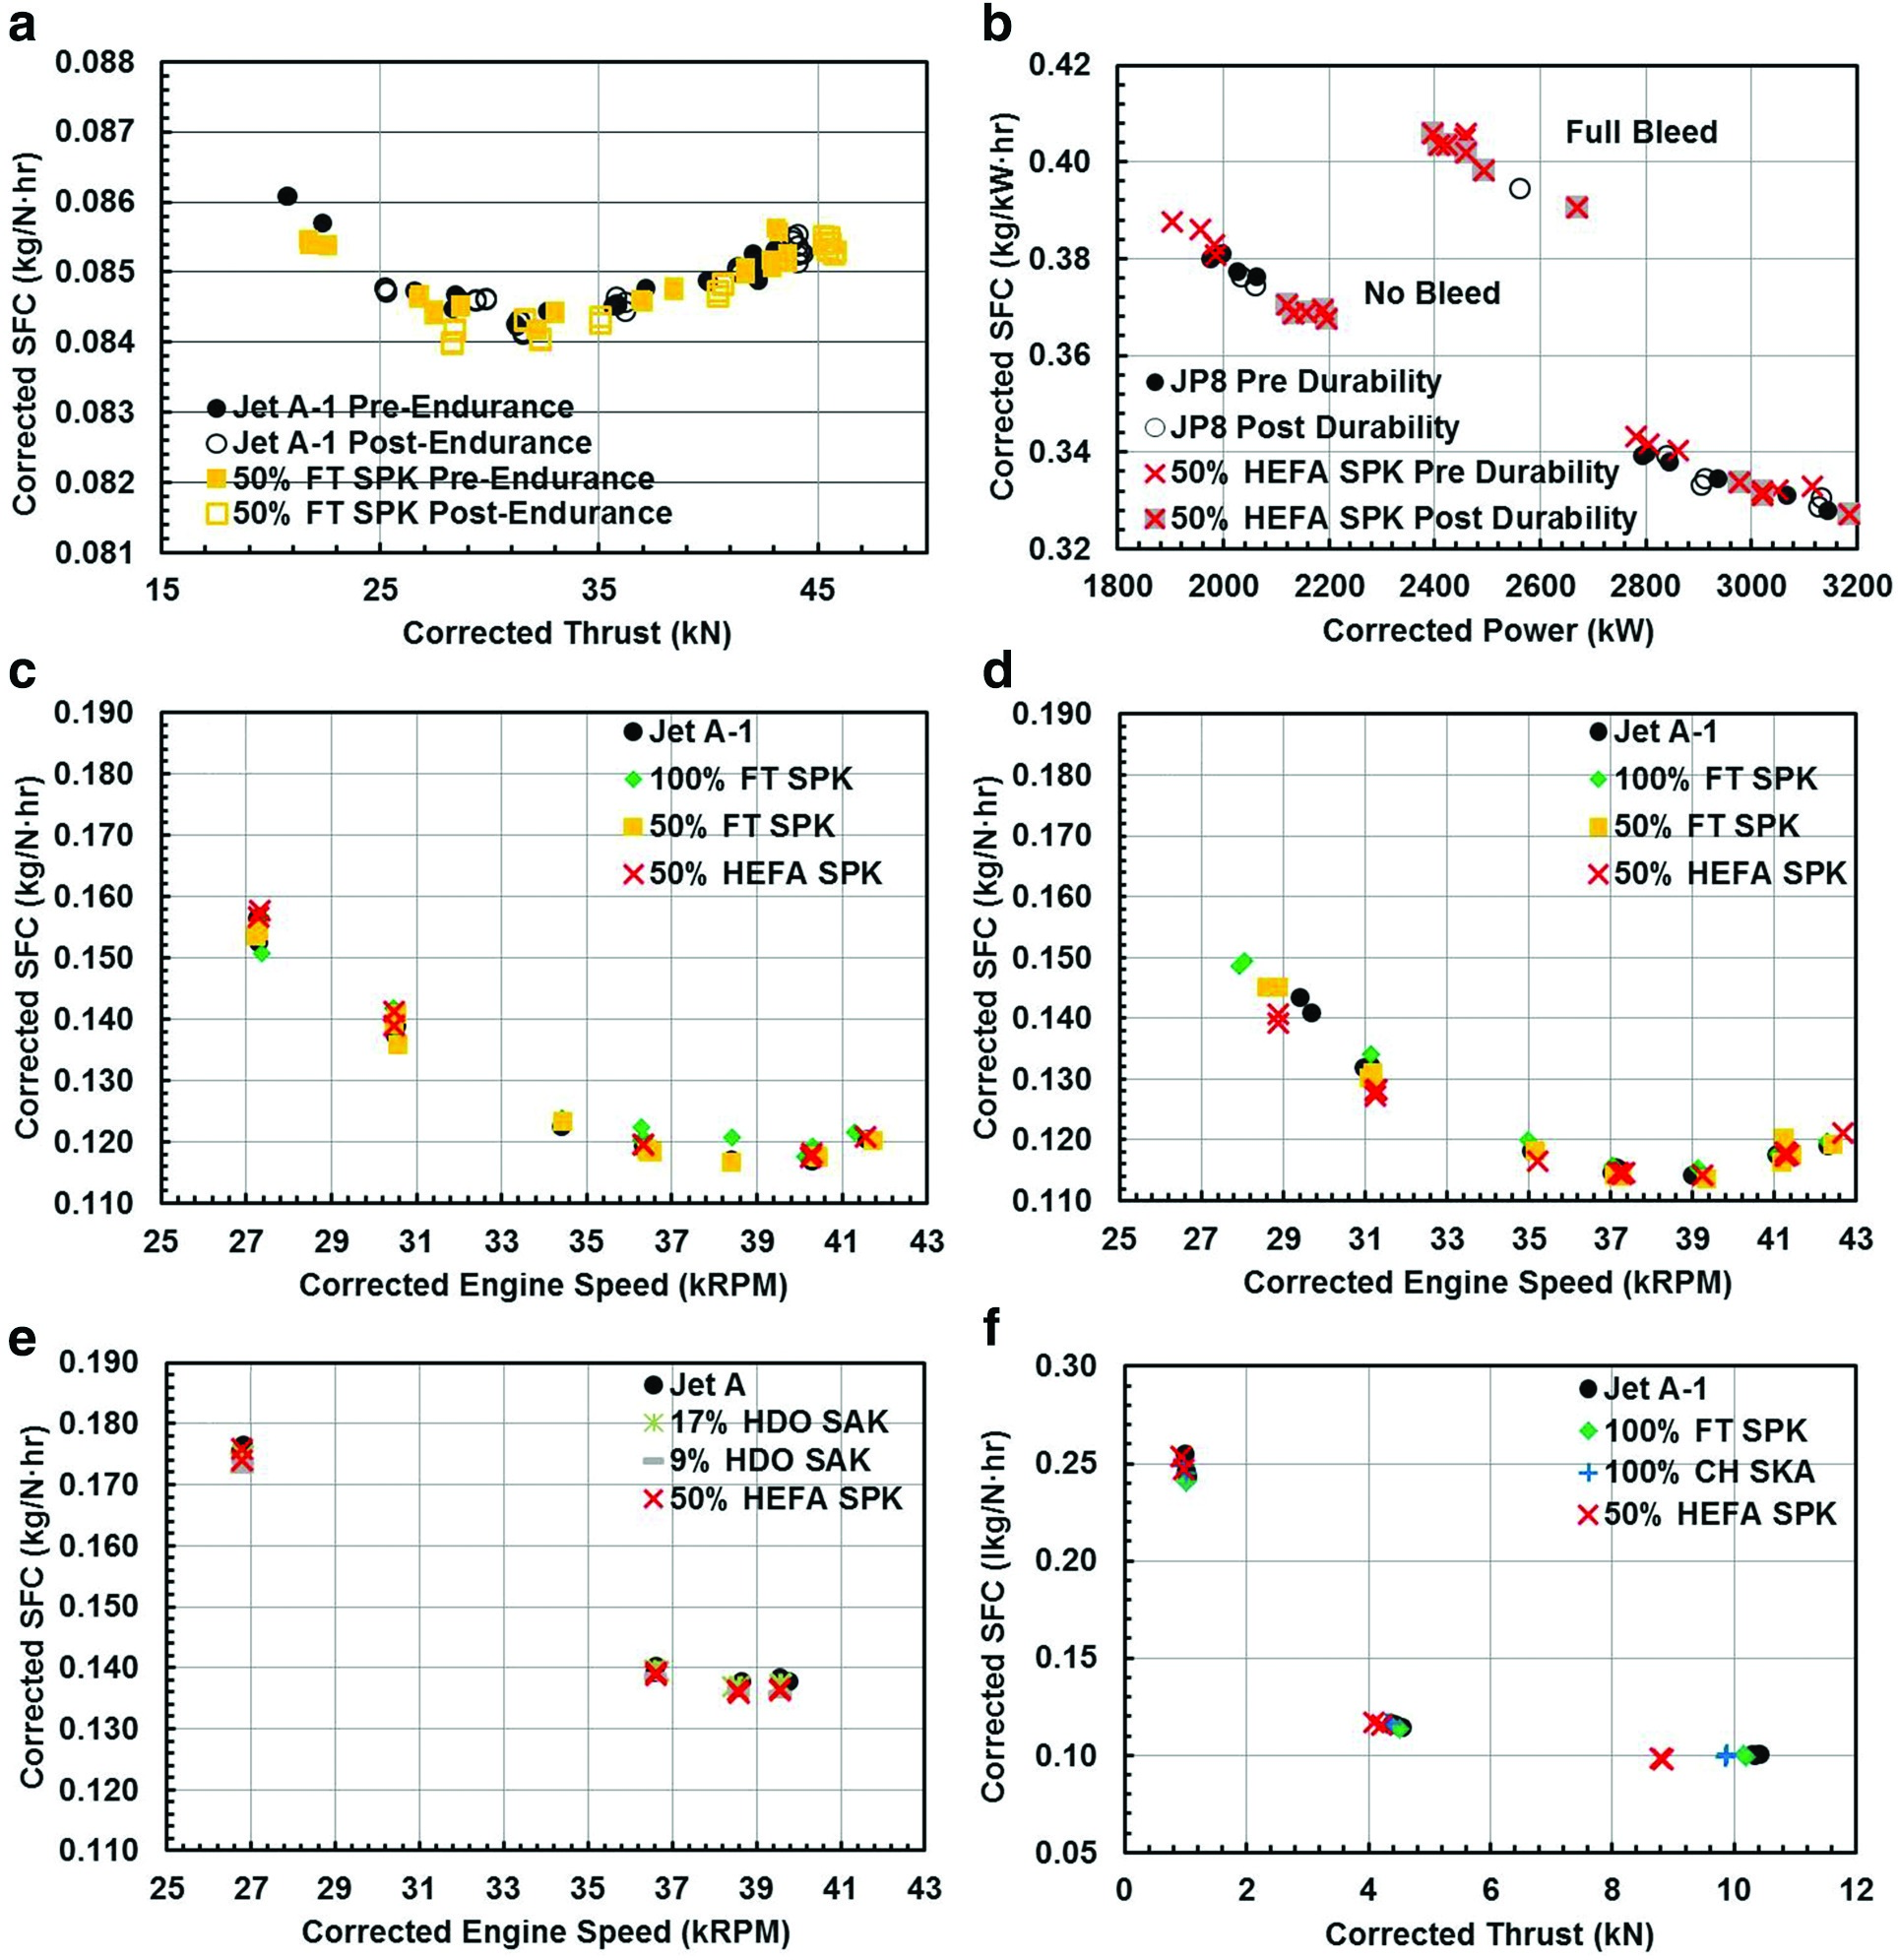
During the steady state operation of the engines, many performance parameters were recorded including thrust or power, fuel flowrate, air flowrate, engine speed, thrust SFC and temperatures and pressures at various locations on the engine. Results from corrected SFC measurements are shown in Figure 4 for all four engines. Results from multiple runs and in the case of F-404-400 and T-56-A15 results from pre- and post-durability tests are also shown. Within the limits of measurement uncertainty, none of the engines showed any noteworthy differences when switching from conventional to alternative fuels.
Figure 4.
Corrected SFC results: (a) F-404-400, Jet A-1 vs. 50% FT SPK; (b) T-56-A15, JP-8 vs. 50% HEFA SPK; (c) TRS-18-046-1 at 1.5 km, Jet A-1 vs. 50% FT SPK, 50% HEFA SPK and 100% FT SPK; (d) TRS-18-046-1 at 3 km, Jet A-1 vs. 50% FT SPK, 50% HEFA SPK and 100% FT SPK; (e) TRS-18-046-1 at 1.5 km, Jet A-1 vs. 17% HDO SAK, 9% HDO SAK and 50% HEFA SPK; (f) CF-700, Jet A-1 vs. 100% FT SPK, 100% CH SKA and 50% HEFA SPK.
Engine emissions
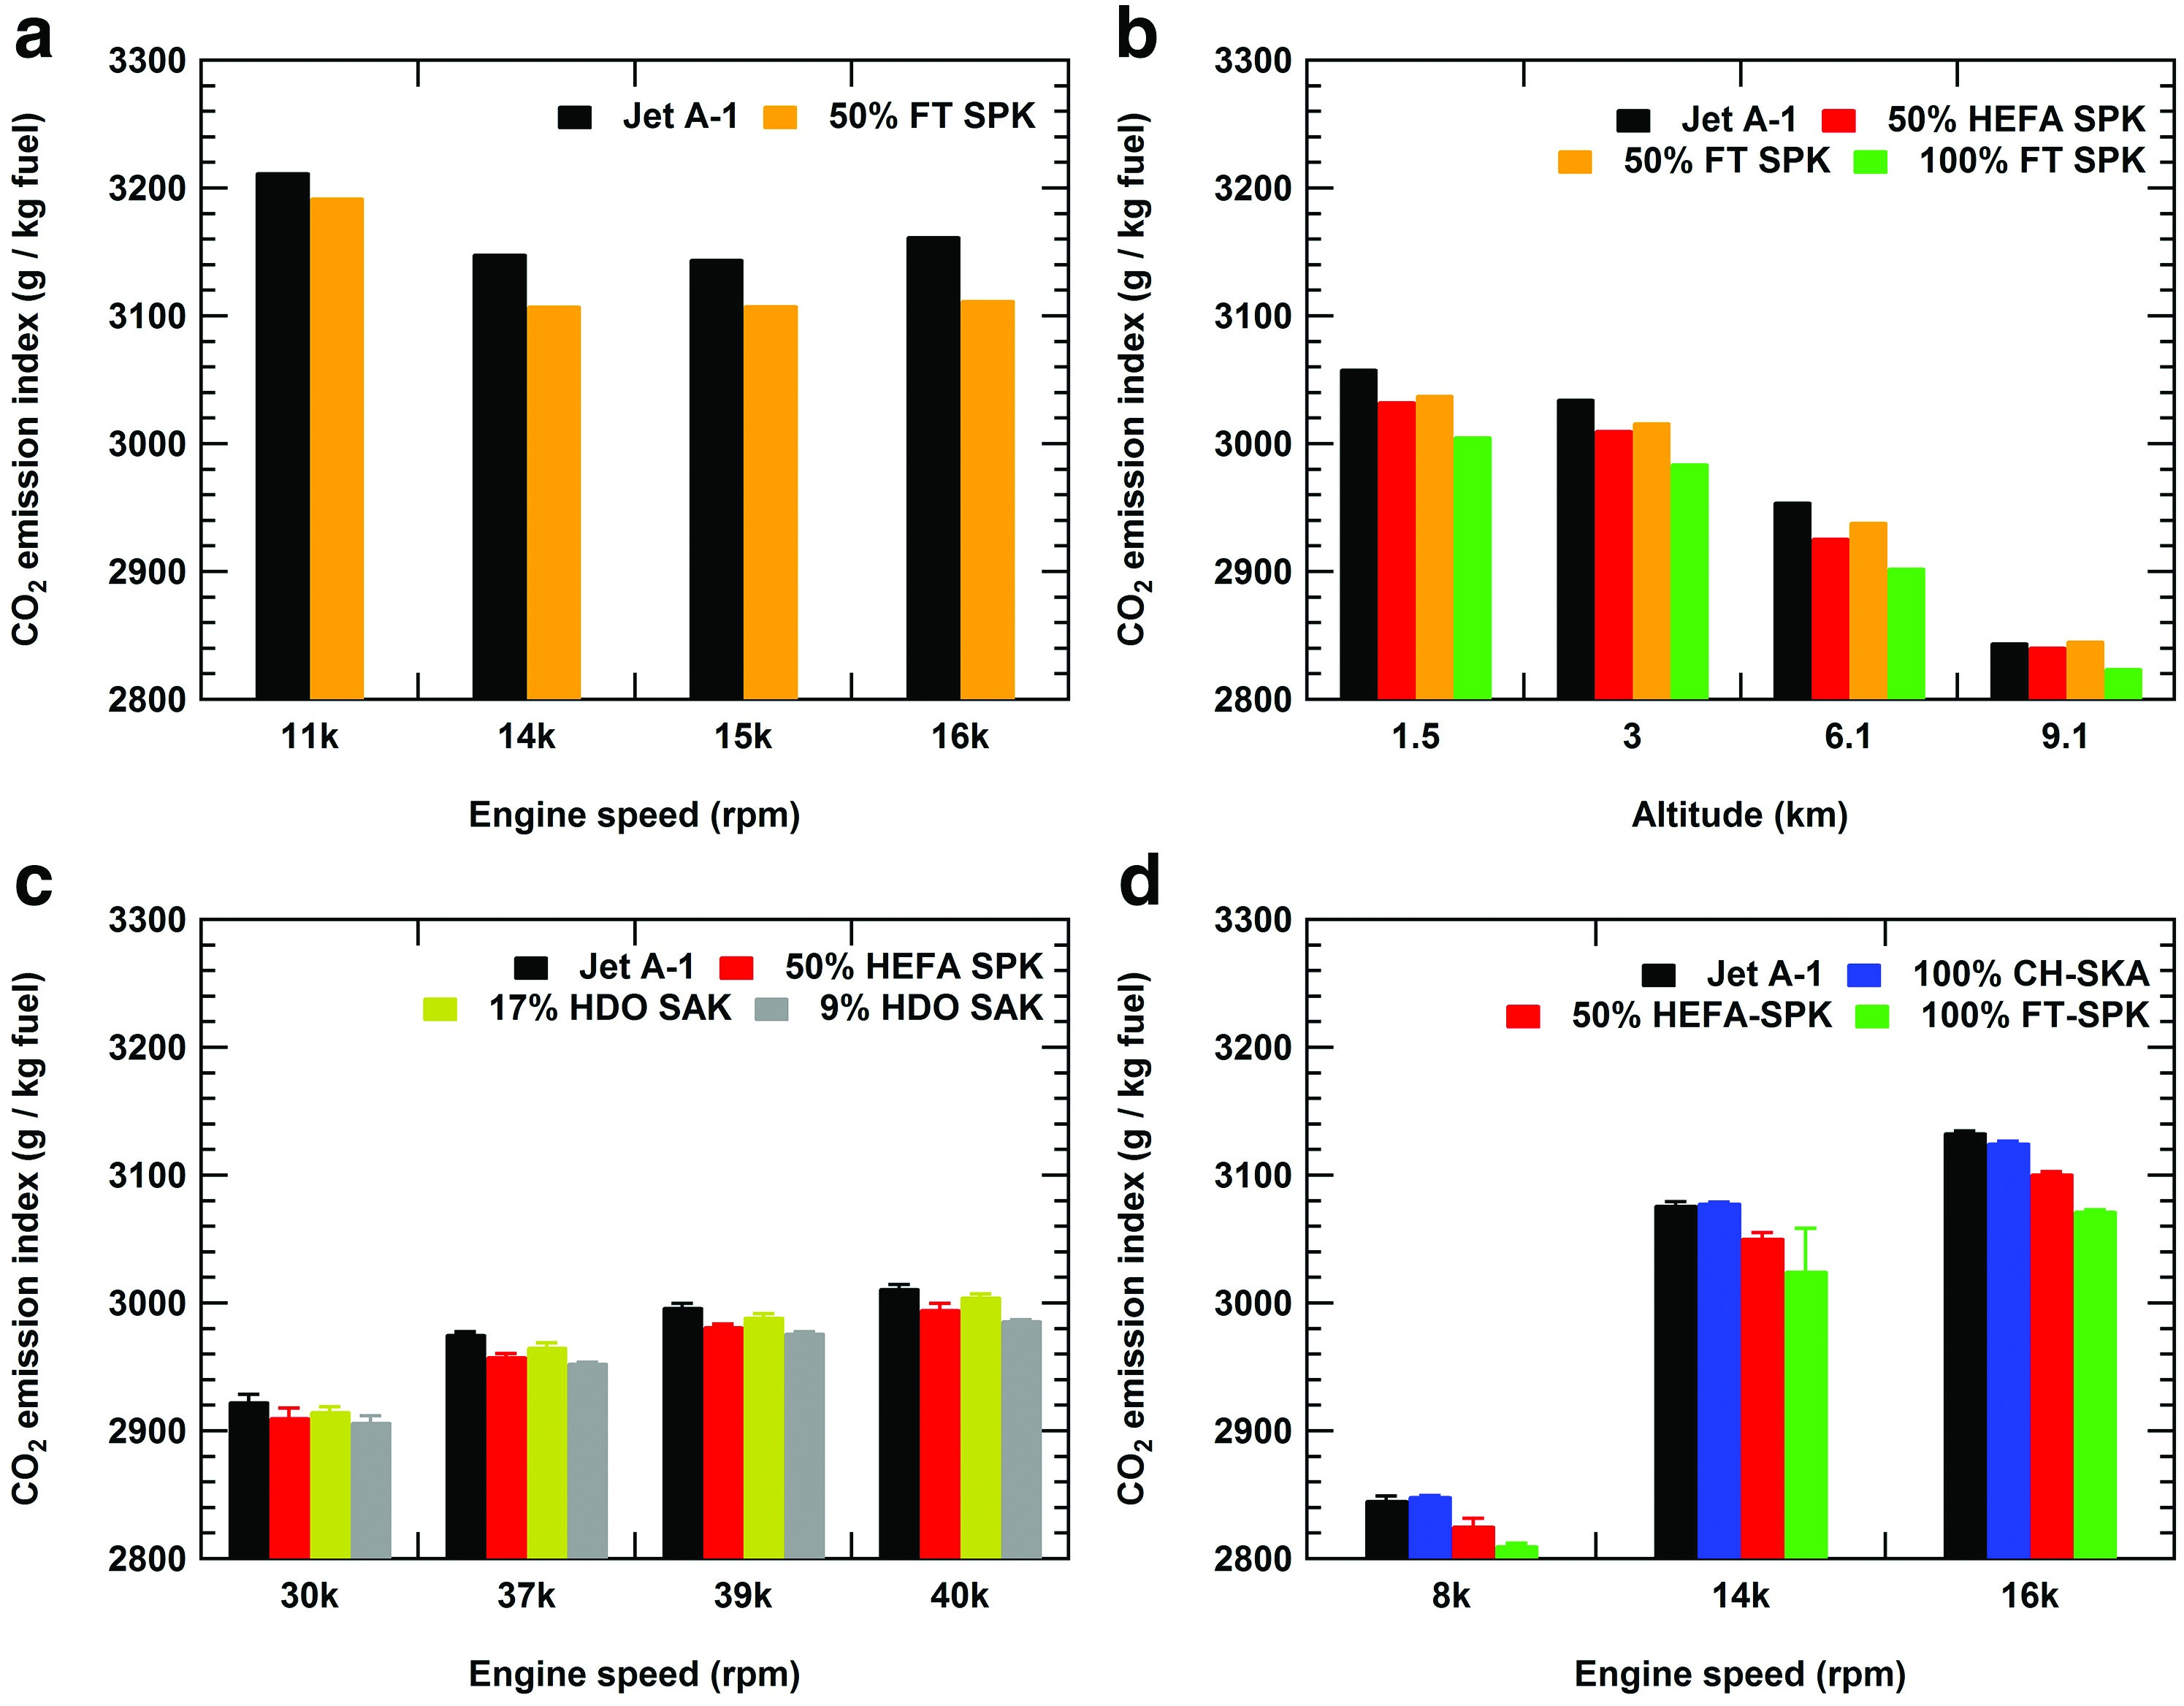
The gaseous emissions measurements included CO2, CO, THC, NO and NOX. In the case of F-404-400, Sulphur Dioxide (SO2) emissions were also recorded. The gaseous emissions from alternative fuels were found to be comparable to those from the conventional jet fuels on all the four engines, as can be seen from the representative results for CO2 and NOX in Figure 5 and Figure 6 respectively. Small differences were observed in the CO2 emissions results that were attributed to the dependence on the hydrogen-to-carbon ratio in the various fuels.
Figure 6.
NOx emissions results: (a) F-404-400, Jet A-1 vs. 50% FT SPK; (b) T-56-A15, JP-8 vs. 50% HEFA SPK; (c) TRS-18-046-1 at four altitudes, Jet A-1 vs. 50% FT SPK, 50% HEFA SPK and 100% FT SPK; (d) TRS-18-046-1 at 3 km, Jet A-1 vs. 17% HDO SAK, 9% HDO SAK and 50% HEFA SPK; (e) CF-700, Jet A-1 vs. 100% FT SPK, 100% CH SKA and 50% HEFA SPK.
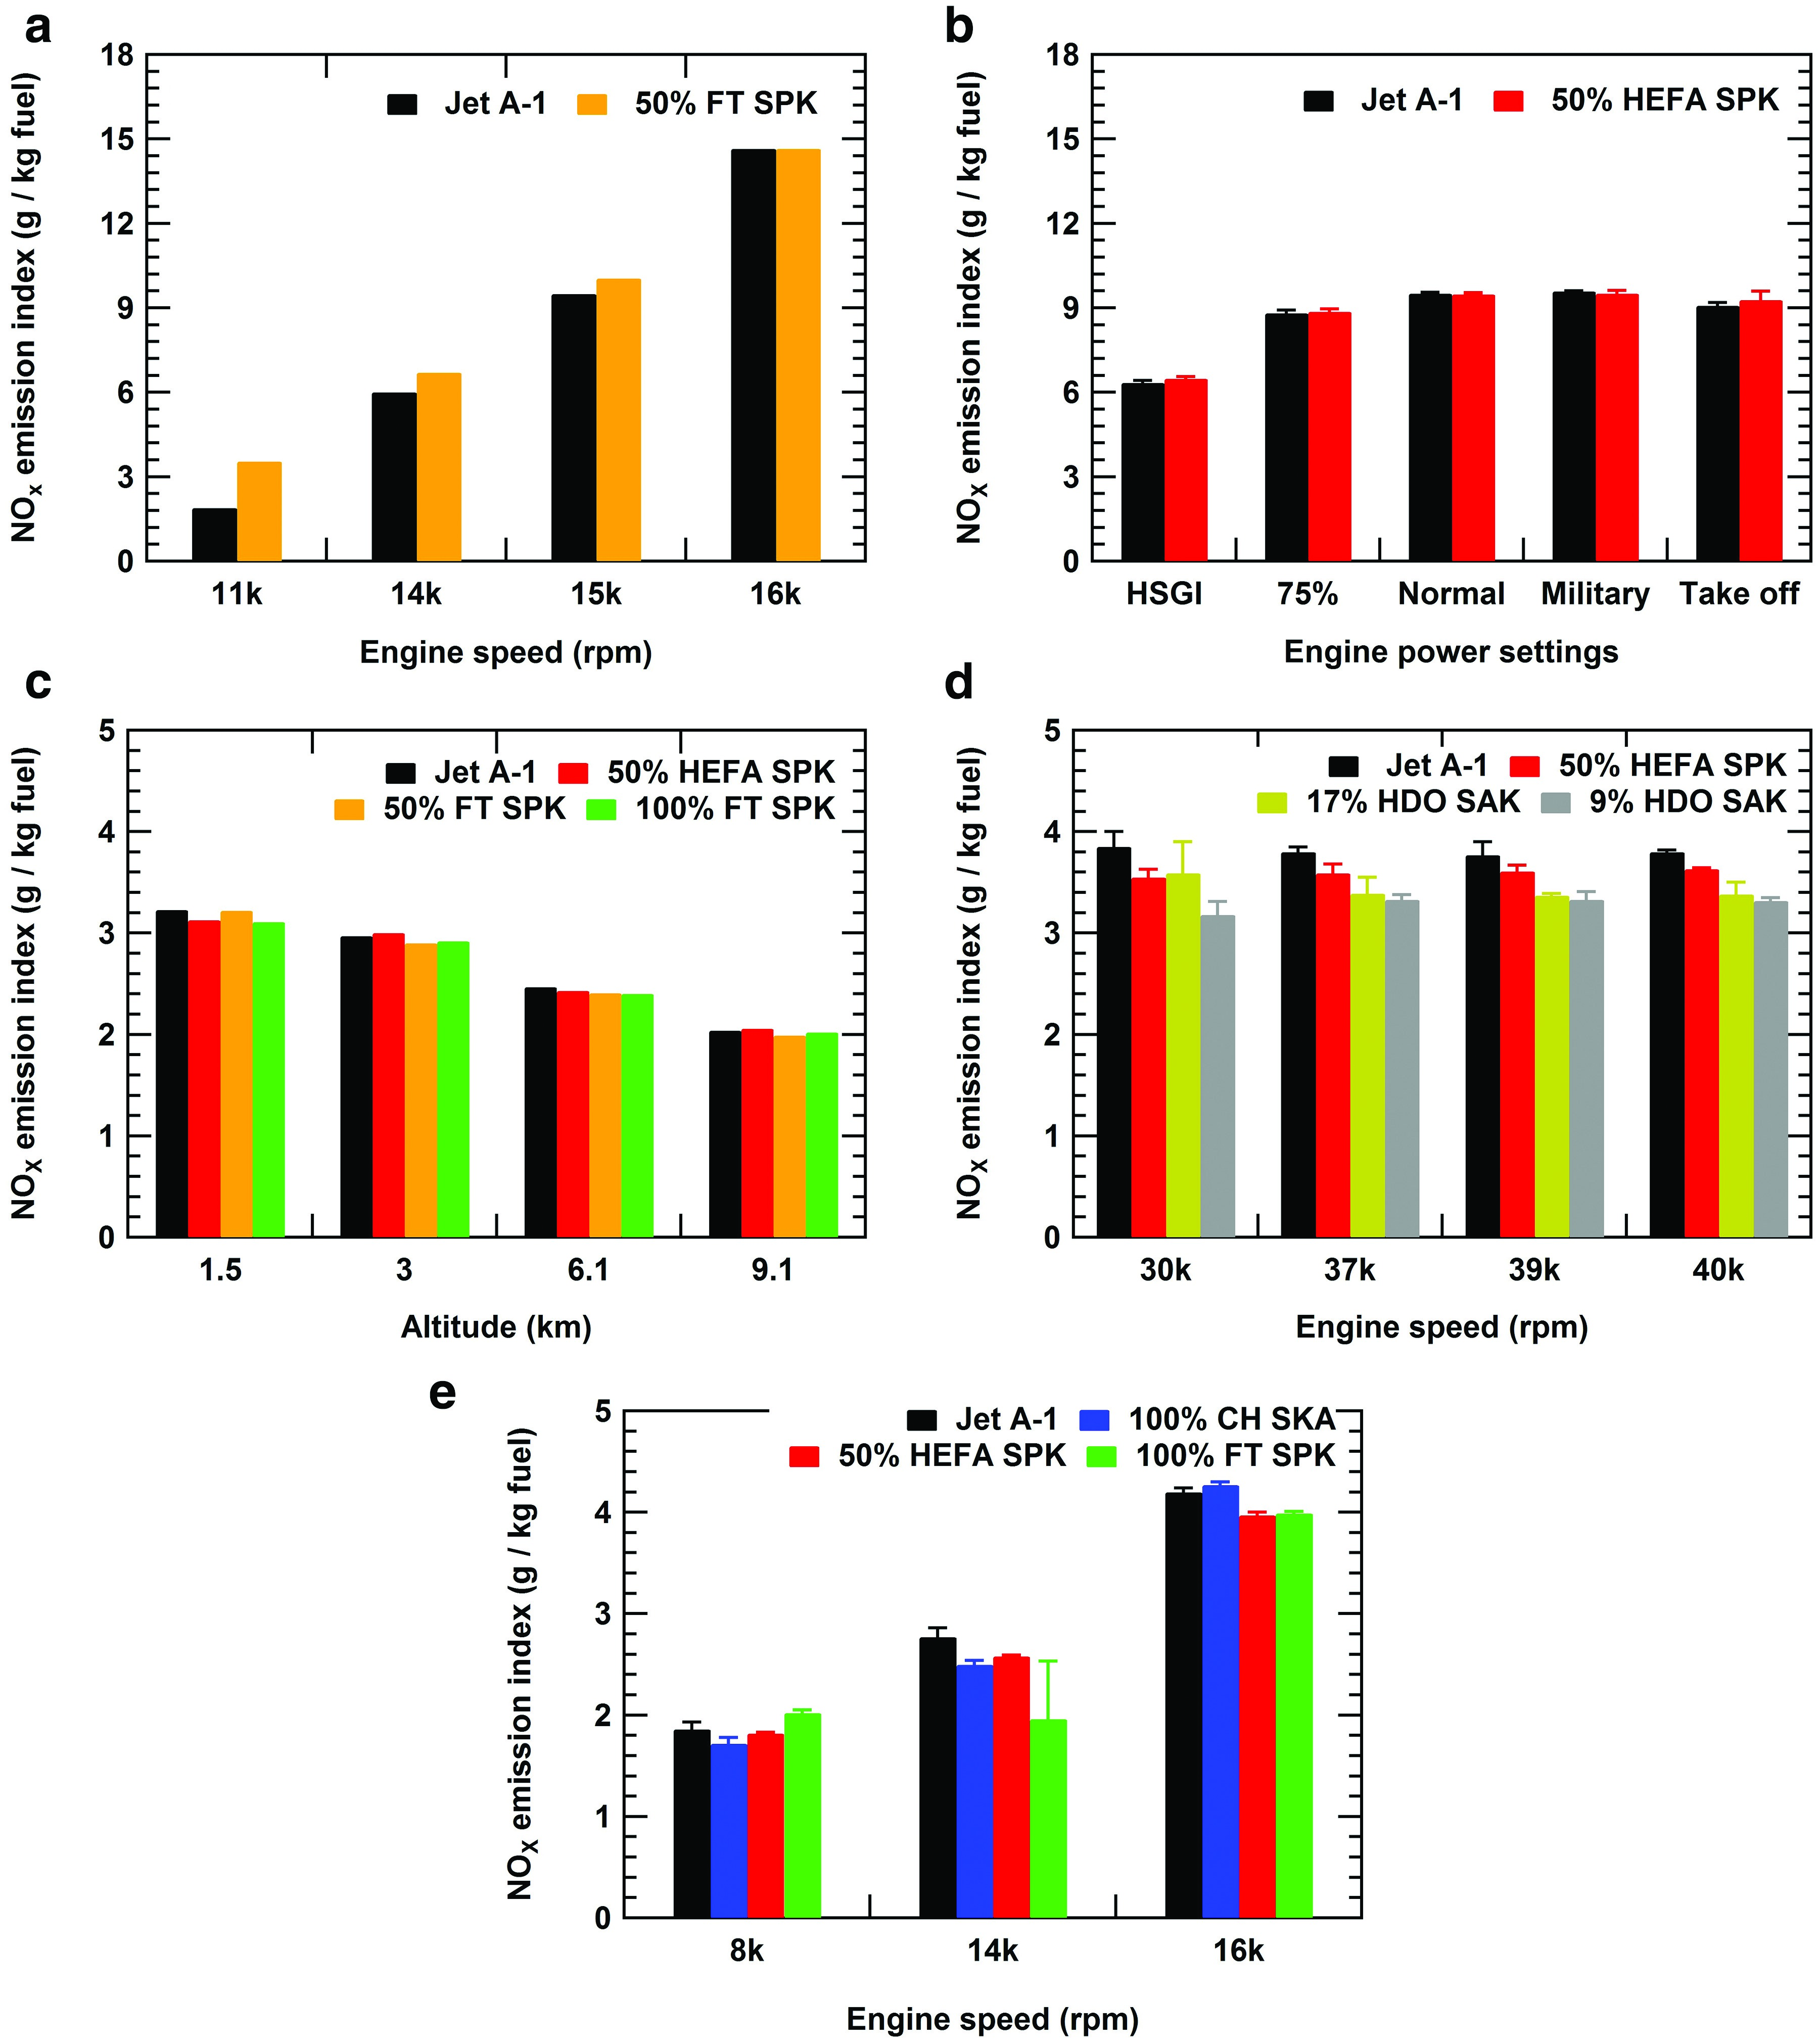
Figure 5.
CO2 emissions results: (a) F-404-400, Jet A-1 vs. 50% FT SPK; (b) TRS-18-046-1 at four altitudes, Jet A-1 vs. 50% FT SPK, 50% HEFA SPK and 100% FT SPK; (c) TRS-18-046-1 at 3 km altitude, Jet A-1 vs. 17% HDO SAK, 9% HDO SAK and 50% HEFA SPK; (d) CF-700, Jet A-1 vs. 100% FT SPK, 100% CH SKA and 50% HEFA SPK.
As for the PM emissions, both the number density and mass were measured. In the case of CF-700, Black Carbon (BC) mass was also measured. The results are shown in Figure 7 and Figure 8 respectively. Even after discounting for the measurement uncertainties, the differences in PM emissions from alternative fuels were quite significant compared to the conventional fuels and even between the alternative fuels. These differences were attributed to the levels of sulphur, aromatics and hydrogen contents in the fuels; the types of aromatics in the fuel; and hydrogen-to-carbon ratio of the fuels 04.
Figure 8.
Particulate Matter/Black Carbon emissions results: (a) F-404-400, Jet A-1 vs. 50% FT SPK; (b) T-56-A15, JP-8 vs. 50% HEFA SPK; (c) TRS-18-046-1 at four altitudes, Jet A-1 vs. 50% FT SPK, 50% HEFA SPK and 100% FT SPK; (d) TRS-18-046-1 at 3 km, Jet A-1 vs. 17% HDO SAK, 9% HDO SAK and 50% HEFA SPK; (e) CF-700, Jet A-1 vs. 100% FT SPK, 100% CH SKA and 50% HEFA SPK.
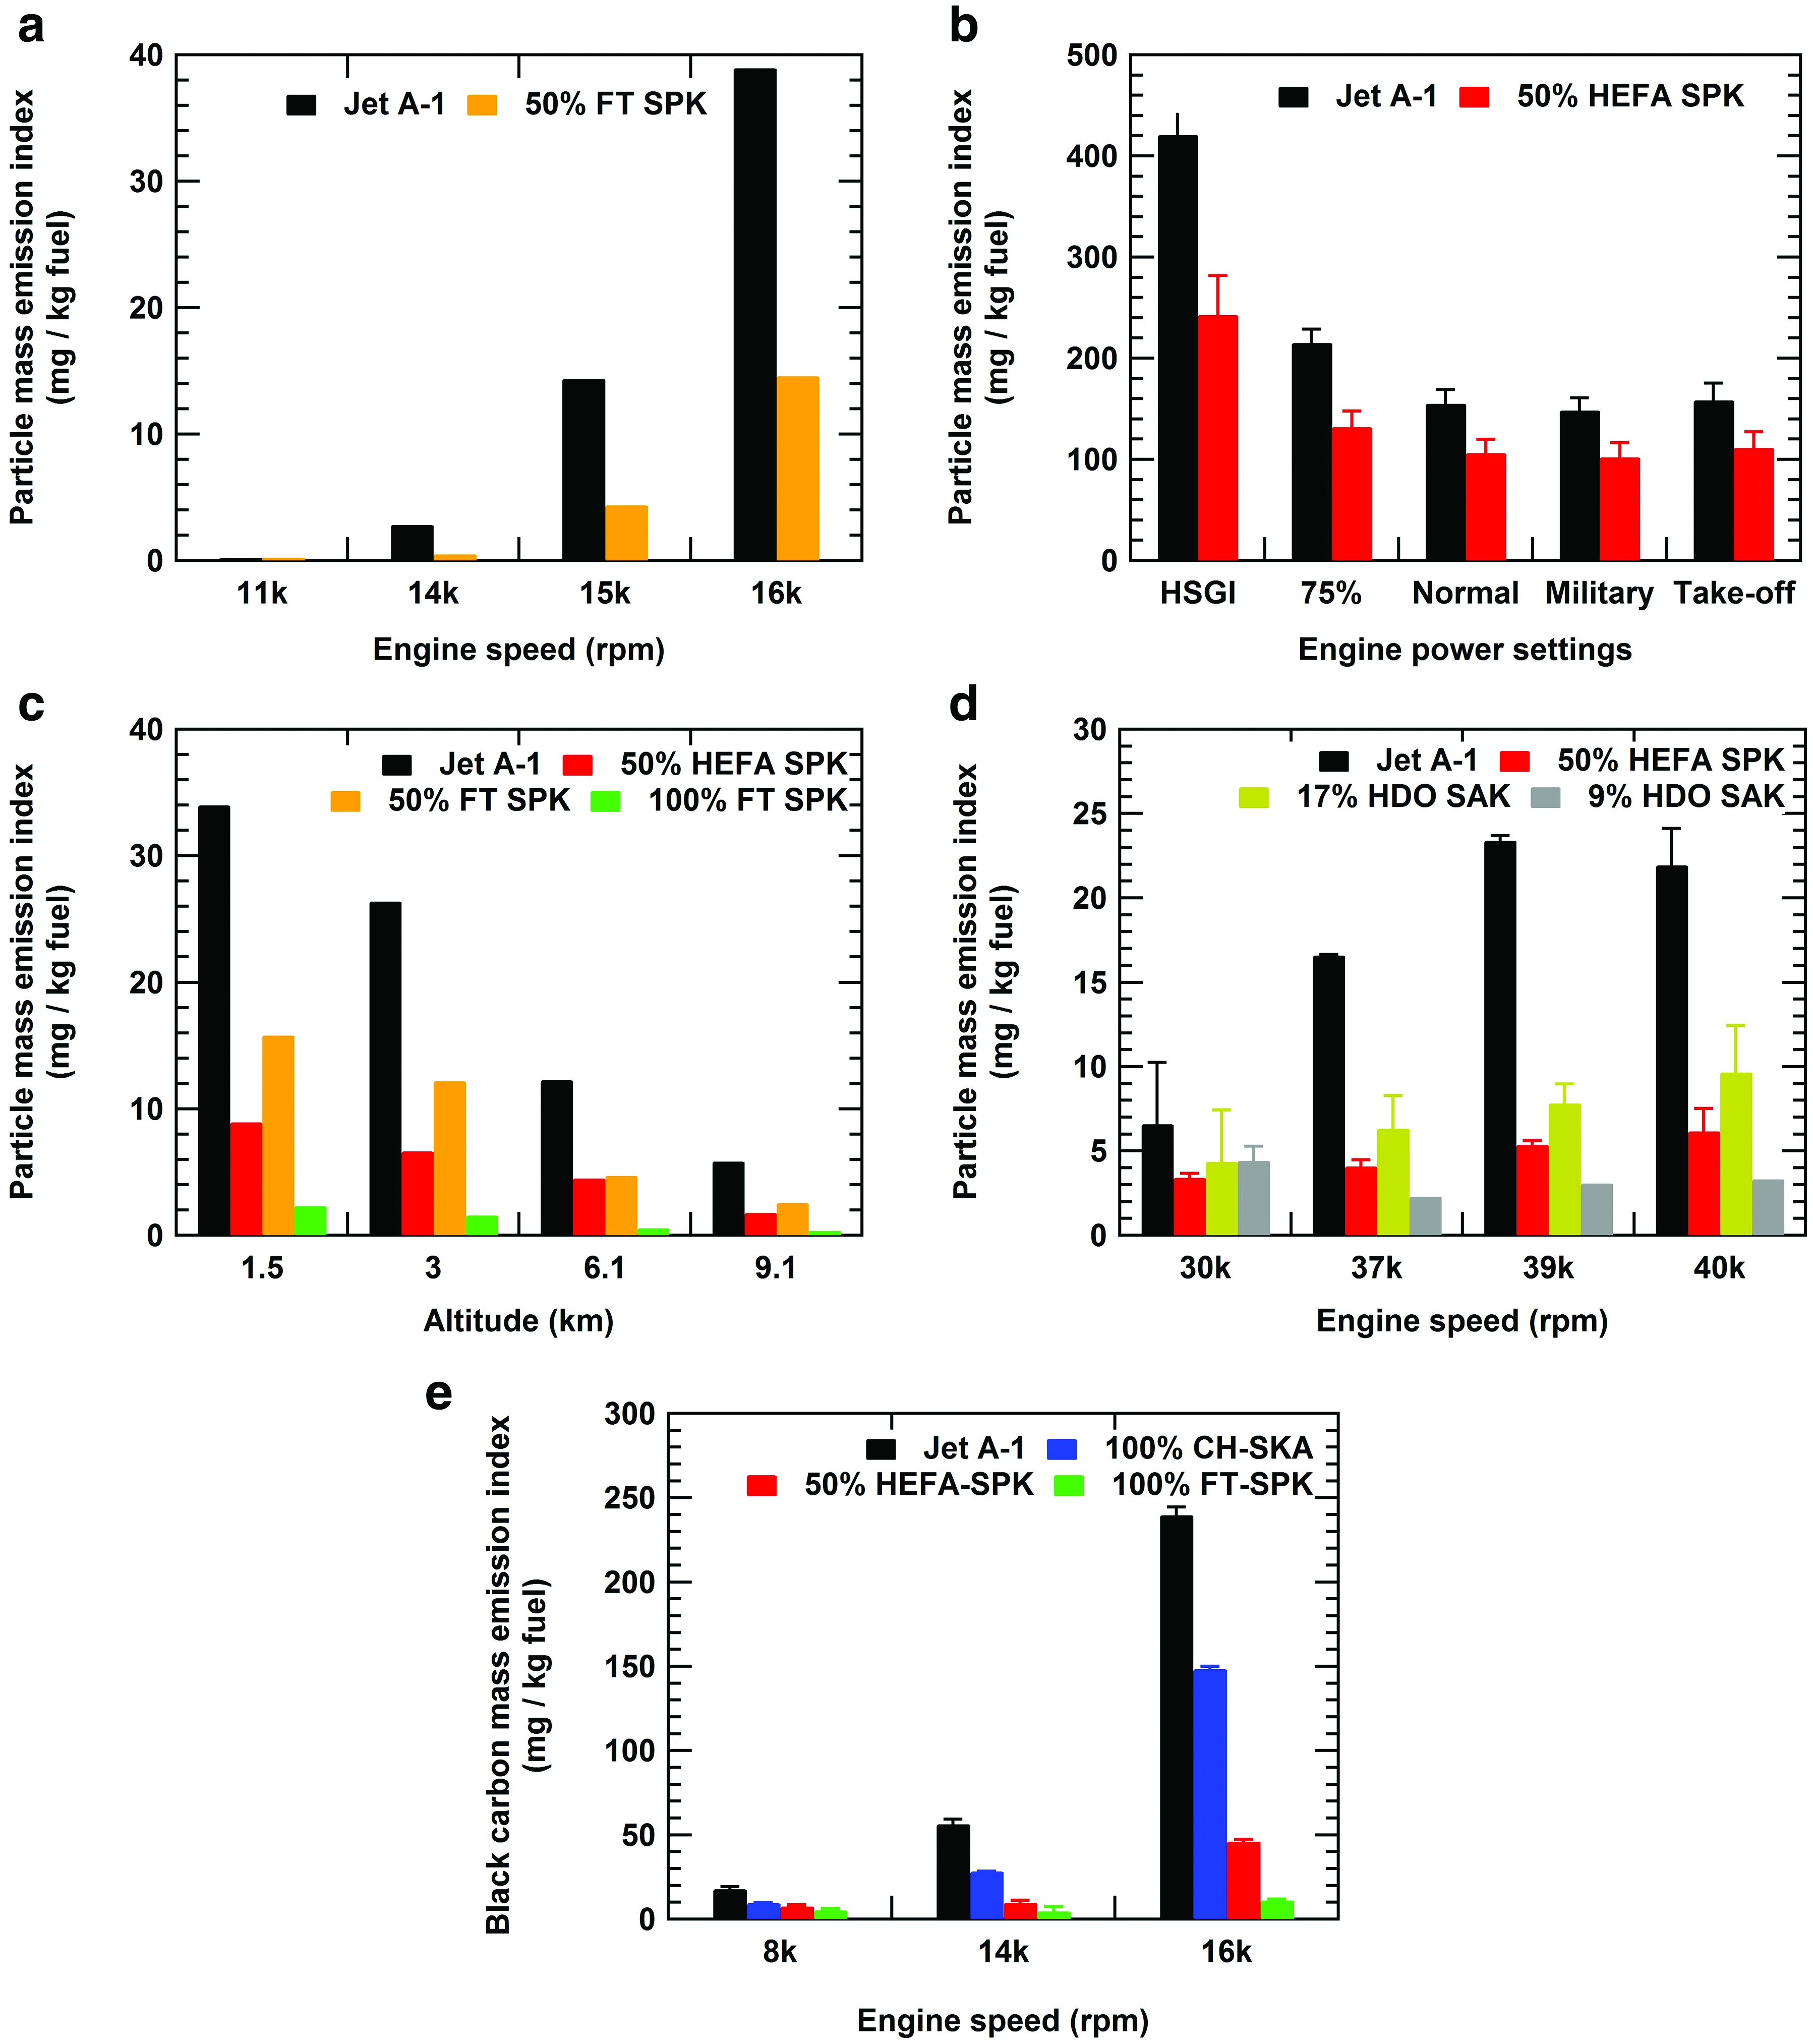
Figure 7.
Particulate Matter number emissions results: (a) F-404-400, Jet A-1 vs. 50% FT SPK; (b) T-56-A15, JP-8 vs. 50% HEFA SPK; (c) TRS-18-046-1 at four altitudes, Jet A-1 vs. 50% FT SPK, 50% HEFA SPK and 100% FT SPK; (d) TRS-18-046-1 at 3 km, Jet A-1 vs. 17% HDO SAK, 9% HDO SAK and 50% HEFA SPK; (e) CF-700, Jet A-1 vs. 100% FT SPK, 100% CH SKA and 50% HEFA SPK.

Conclusions
The benchmarking data presented here was acquired during qualification testing using four different engine platforms and six different alternative fuels and blending components. The tests were performed at sea level and at test-cell simulated altitude conditions. A summary of the results in terms of percentage differences in SFC, CO2, NOX and PM from the use of alternative fuels, relative to the baseline petroleum-based Jet A-1 or JP-8 fuels, is given in (Table 1). These percentage differences should be viewed in consideration with the measurement uncertainty estimates reported in the test and measurement methodology section above.
In terms of engine performance and operability, the results validate the general understanding that if the alternative fuels fall within the range of certified (e.g., ASTM) specification limits then their performance would be comparable to conventional fuels and their use on current engines would be transparent to the operators with no considerable differences in engine behaviour.
Similarly, the gaseous emissions from alternative fuels were also found to be comparable to those from the conventional jet fuels with only a small degree of dependence on the hydrogen-to-carbon ratio of the fuel that shows up in the CO2 emissions results.
As for the PM or BC emissions, the dependence on the fuel chemical composition is quite significant. It was found that these emissions are strongly dependent on the level of hydrogen and aromatic contents in the fuel; the type of aromatic constituents in the fuel; and the hydrogen-to-carbon ratio of the fuel. All alternative fuels showed a reduction in PM/BC emissions, both in terms of number density and mass emission rates. Reductions as large as of about 90% were observed during certain test campaigns.
Appendices
Appendix A.
Appendix A. Properties of test fuels.
Table 1.
Selected specifications of engines reported in the article.
Table 2.
Selected properties of fuels reported in the article.
Appendix B.
Appendix B. Summary of relative differences in parameters of merits.
Table 1.
Percentage differences in parameters of merits (POM) relative to the baseline conventional fuels (Jet A-1 or JP-8). Negative values indicate measured values lower than the baseline fuel and vice versa. These are the maximum values measured over the range of operating conditions at which the engines were tested for a given fuel or a fuel blending component.
| Engines | POM fuels & blends | ∆SFC (%) | ∆CO2 (%) | ∆NOX (%) | ∆PM number density (%) | ∆PM mass (%) |
|---|---|---|---|---|---|---|
| F-404-400 | 50% FT SPK in JP-8 | 0.6 | −1.8 | +83.2 | −73.2 | −86.2 |
| T-56-A-15 | 50% HEFA SPK in JP-8 | 0.3 | −1.1 | +3.2 | −31.6 | −42.3 |
| CF-700 | 100% FT SPK | −2.2 | −1.8 | −29.4 | −96.4 | −95.9Table 1 |
| 50% HEFA SPK in JP-8 | −1.8 | −1.0 | −6.5 | −60.4 | −82.1Table 1 | |
| 100% CH SKA | −1.0 | +3.7 | −7.7 | −23.6 | −47.8Table 1 | |
| TRS-18-046-1 | 100% FT SPK | 1.3 | −2.3 | +9.2 | −99.6 | −96.3 |
| 50% FT IPK in JP-8 | 0.4 | −2.3 | +71.0 | −90.4 | −70.0 | |
| 50% HEFA SPK in JP-8 | 0.9 | −1.3 | +10.6 | −80.6 | −79.7 | |
| 17% HDO SAK in HEFA SPK | −0.5 | −0.5 | −15.9 | −68.6 | −63.8 | |
| 9% HDO SAK in HEFA SPK | −1.5 | −0.8 | −17.3 | −94.0 | −86.6 |