Introduction
In turbomachinery applications, air is spilled from the upstream compressor and bled through the cavities separating stators and rotors of the turbine stages to prevent ingestion of hot gas below the platforms. This avoids the consequent overheating of the disk and bearings. When injected into the mainstream, purge flow can also be used to cool the rotor platform, but the non-uniformity of the static pressure field at the cavity exit and the interaction with the secondary flows limit its effectiveness. The mechanisms responsible for this are well documented in several computational and experimental works.
23 compare experimental data and numerical predictions and verify that the purge flow is entrained by the rotor hub passage vortex, increasing its intensity and promoting its lift-off from the platform. The impact of mixing losses and increased secondary flows due to the injection of cavity flow is found to be of the same order by 25. 27 confirm that the circulation of the hub passage vortex is increased by the entrainment of purge flow. The strengthening of the secondary flows is attributed to the negative incidence of the rim seal leakage flow by 22. They observe that the entrainment of the purge air into the secondary flows facilitates its migration towards higher span-wise locations and removes it from the endwall, thus limiting its effectiveness as coolant. The preferential injection of the leakage flow towards the suction side of the blade is also clearly visualized.
Consistent considerations are reported by 16, when studying the interaction of purge air with the mainstream on a turbine with contoured endwalls. A thorough computational aerodynamic investigation is accomplished by 15. Their findings are validated experimentally 14 and comprehensively summarize and link the mechanisms regulating purge flow injection and its interaction with the main flow. For the turbine studied, the adhesion of purge air is limited to the proximity of the suction side of the blade until 20% of the wetted surface.
As far as the cooling effectiveness of the rim seal leakage flow and its impact on heat transfer are concerned, several experiments can be found in literature, mainly from linear cascades. One of the earliest works in this regard was published by 03. Coolant is observed to be swept towards the suction side of the passage. The resolution of the method was later improved by 13. Consistently, 11 demonstrate that purge flow can be effective in cooling the front portion of the passage and visualize the leakage flow moving towards the suction side of the blade. Similar observations are made by 28.
High-resolution data is provided in 19 by means of IR Thermography on a cascade presenting endwall contouring. They report an increase of the heat transfer on the suction side of the passage with higher leakage flow injection. The technique is similar to the one used in the present paper, as it relies on a contoured endwall heater (developed by 18) and on infrared imaging.
Data from rotating facilities is not as readily available due to the technical challenges of measuring on the rotating frame. 04 uses iso-flux foils and arrays of thermocouples to measure heat transfer contours in a low-speed facility. Time-resolved heat transfer and film cooling measurements in short-duration facilities are found in literature, but are often taken at discrete locations (e.g., by means of heat flux gauges). Examples are the early works by 02, 01 and 07. More recently, 06 find a reduction in gas temperature due to purge flow injection, again on the suction side of the passage.
Aim of the current work is to observe the effect of realistic rim seal leakage flows on the rotor endwall heat transfer with high-resolution data acquired on the rotating frame of reference. Complemented with unsteady computational fluid dynamics (CFD) predictions, the experimental results are interpreted with reference to the interaction of the purge flow with the hub endwall secondary flows.
Methodology
Experimental setup
The axial turbine research facility LISA of the Laboratory for Energy Conversion (LEC) at ETH Zürich is a long-duration, moderate-speed, low-temperature rotating facility. It consists of a quasi-closed air loop including a centrifugal compressor, a two-stage heat exchanger, a 3 m-long flow conditioning stretch for flow uniformity upstream of the turbine, the turbine itself and a calibrated Venturi nozzle for mass flow measurements. The flow undergoes an acceleration upstream of the turbine stage, thus reducing further the impact of any non-uniformities left after the conditioning stretch. The heat exchanger controls the turbine inlet total temperature Tt,in to an accuracy of ±0.3 K
A DC generator, coupled to the turbine shaft via a gearbox, acts as break by converting the mechanical power produced by the turbine into electrical power, which is fed back to the grid. The rotational speed is controlled with an accuracy of ±0.02% (±0.5 rpm). A torque meter is installed on the vertical shaft between the turbine and the gearbox. At the exit of the test section, two successive rows of deswirl vanes recover the static pressure before going through the venturi nozzle and back to the compressor. For more details on the rig the reader is referred to 27.
A 1.5 stage, high work turbine configuration is installed in the test section of the facility. Both airfoils and endwalls have a complex 3D geometry optimized for minimizing the aerodynamic losses.
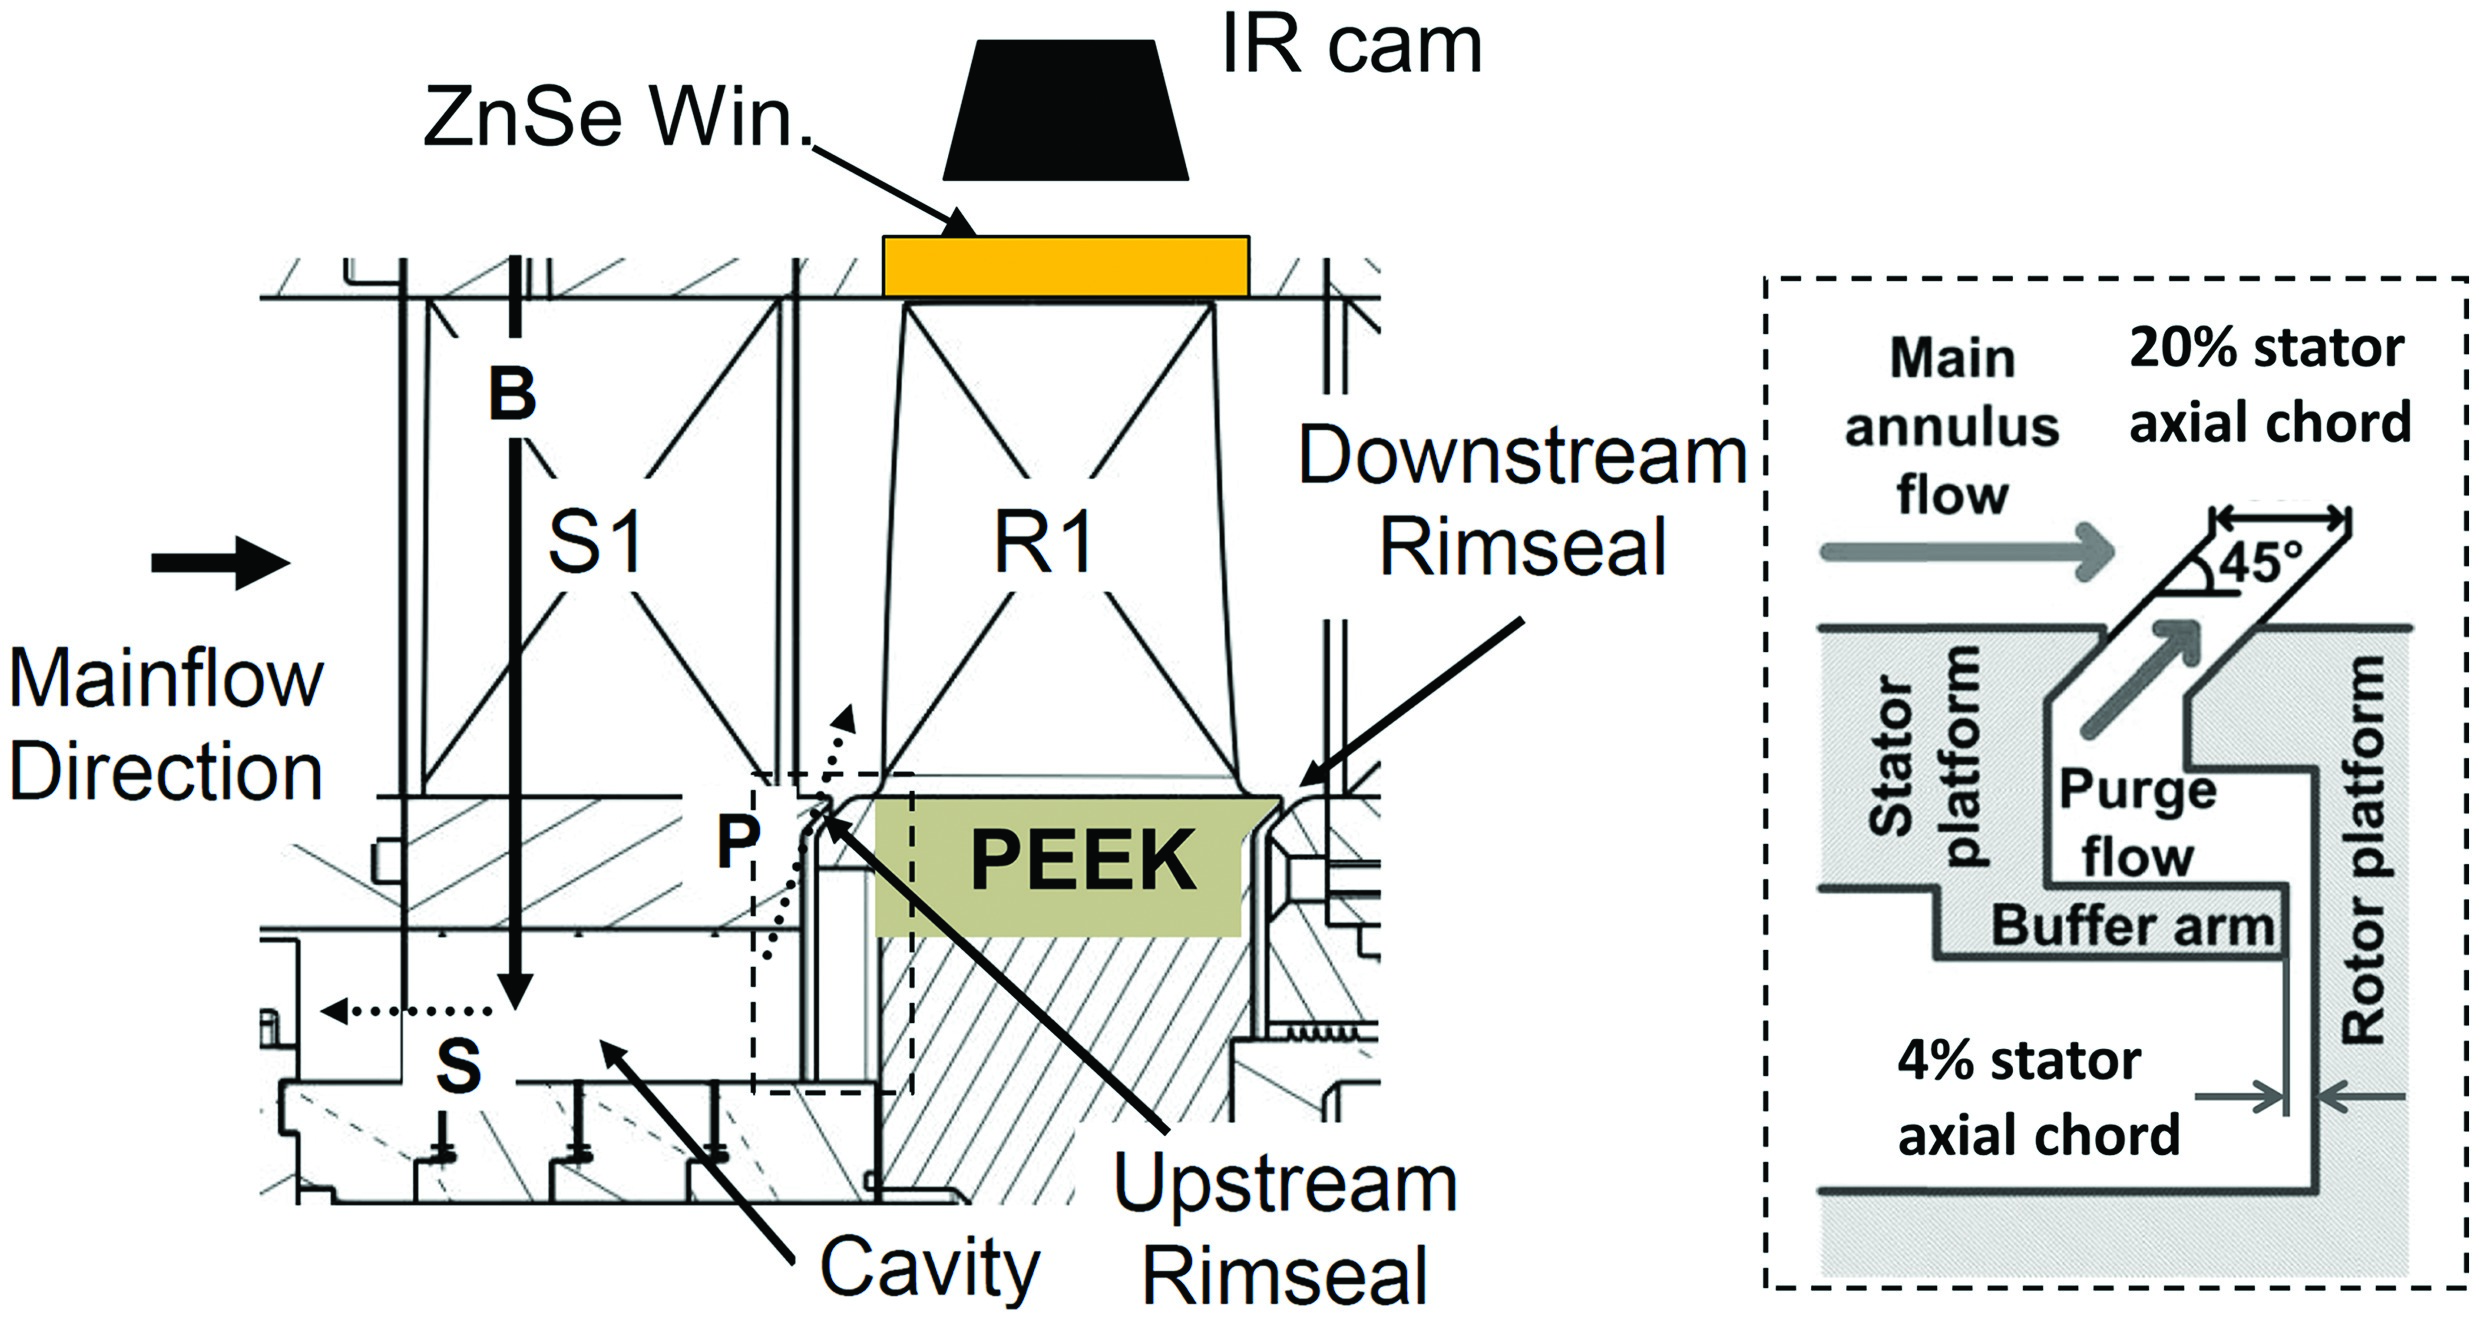
Air is spilled from the main air loop upstream of the flow conditioning stretch and fed to the stator/rotor cavity through the first stator vanes. The amount of by-pass flow “B” (see Figure 1) is measured via a standard nozzle. The purge flow mass flow rate is calculated as the difference between the total by-pass mass flow rate and the secondary leakage flow following the path through the drum, labeled “S” in Figure 1. The injection ratio (IR) is then defined as:
Figure 1.
View from an axial plane of the purge flow path (left). A schematic of the optical setup is included; detail of the stator-rotor rim seal cavity (right).
where
The facility is set up for heat transfer measurements on the rotor by adapting the infrared-based technique used by 17 for stationary parts.
A FLIR SC7300L IR camera records thermograms of the rotor endwall through three IR-transparent ZnSe (Zinc-Selenide) windows mounted on the rotor casing (schematically shown in Figure 1). The camera can be traversed to access more of the inlet portion of the passage.
A controlled thermal boundary condition on the rotor hub endwall surface is achieved by installing a thermally insulating insert (Polyether-ether-ketone or PEEK) in the platform. The insert is instrumented with a film heater deposited on the endwall surface and 9 PT100 RTDs embedded in the substrate, 1.5 mm below the endwall surface, to monitor the conductive heat losses. The heater is obtained by directly depositing a metallic multilayer (10 nm Cr, 200 nm Ni, 10 nm Au) on the CNC-machined PEEK insert by e-beam physical vapour deposition and then by laser cutting the film. A serpentine of uniform width of 1.65 mm is produced with a gap between tracks of 55 μm. High-emissivity paint (ɛ = 0.98) is applied on the whole rotor to allow for accurate temperature measurements and minimize spurious reflections. A correction factor Sq for local heat flux non-uniformities is applied to the nominal value of average heat flux produced by the heater based on the results of step-wise transient heating tests. The electrical heat flux generated by Joule effect is then calculated as:
Where P = i∙V is the electrical power fed to the heater and A is the surface area of the hub endwall. The signal from the PT100 is read out by an on-board data acquisition system sending the readings to a computer via Wi-Fi. The resulting solid temperatures have an error of ±0.5 K.
Power is fed to the data acquisition system and to the heater separately through a two-channel slip ring. The DC power sent to the heater is measured with a voltmeter and an ammeter with an uncertainty of less than ±1.6%.
Measurement procedure
Measurements are performed at steady state for the nominal operating conditions for the rig, summarized in Table 1. The infrared camera records sequences of 1,000 images with two different integration times (10 μs and 50 μs), for two camera positions and four power settings of the heater. In total, each test case comprises of 16,000 images. The acquisition of a frame is triggered once per revolution by the signal coming from an optical tachometer. The two distinct views of the endwall allows for the covering of the inlet portion of the endwall passage until ~80% of its axial extent. Once an infrared camera acquisition is completed, the electrical power fed to the heater is increased to the next level. The average heat flux produced by the endwall heater ranges from 1.4 kW/m2 to 8.1 kW/m2. The different views of the passage are mapped onto a mesh of the rotor endwall by means of projective geometry as explained by 17. Further details on the geometrical transformation of the images can be found in 10. The long and short exposure data sets are combined after registration and deblurring to produce a high-dynamic range picture of the thermal field. The resolution of the final thermograms is of 0.36 mm/pixels, but due to the movement of the rotor during the integration time, the temperature contours are smeared over 0.97 mm in the circumferential direction.
Table 1.
Operating conditions of the rig.
Feeding current and voltage are constantly monitored, while the solid temperature is recorded in bursts of 5 s during the infrared camera acquisitions.
Calculation of the heat transfer quantities
The calculation of the convective heat flux
Where
With ɛ being the emissivity of the surface, σ the Stefan-Boltzmann constant, Tw the wall temperature and Tt,rel the rotor-relative total temperature at the rotor inlet, here taken as a reference temperature for the heat transfer by radiation. The conductive heat loss
In , Tw is the wall temperature measured at the normal projection on the endwall of the PT100 location and Tsub is the substrate temperature read by the PT100 thermometer. For each heat flux level, an average value of conductive loss is calculated over the passage and used in the energy balance of . The average values fall between 1.6% and 6.8%.
Finally, the convective heat flux
The linear fitting procedure is illustrated in Figure 2.
Figure 2.
Linear fit procedure to calculate heat transfer coefficient h (slope) and adiabatic wall temperature Taw (intercept).
Locations 1–4 are shown in Figure 3.
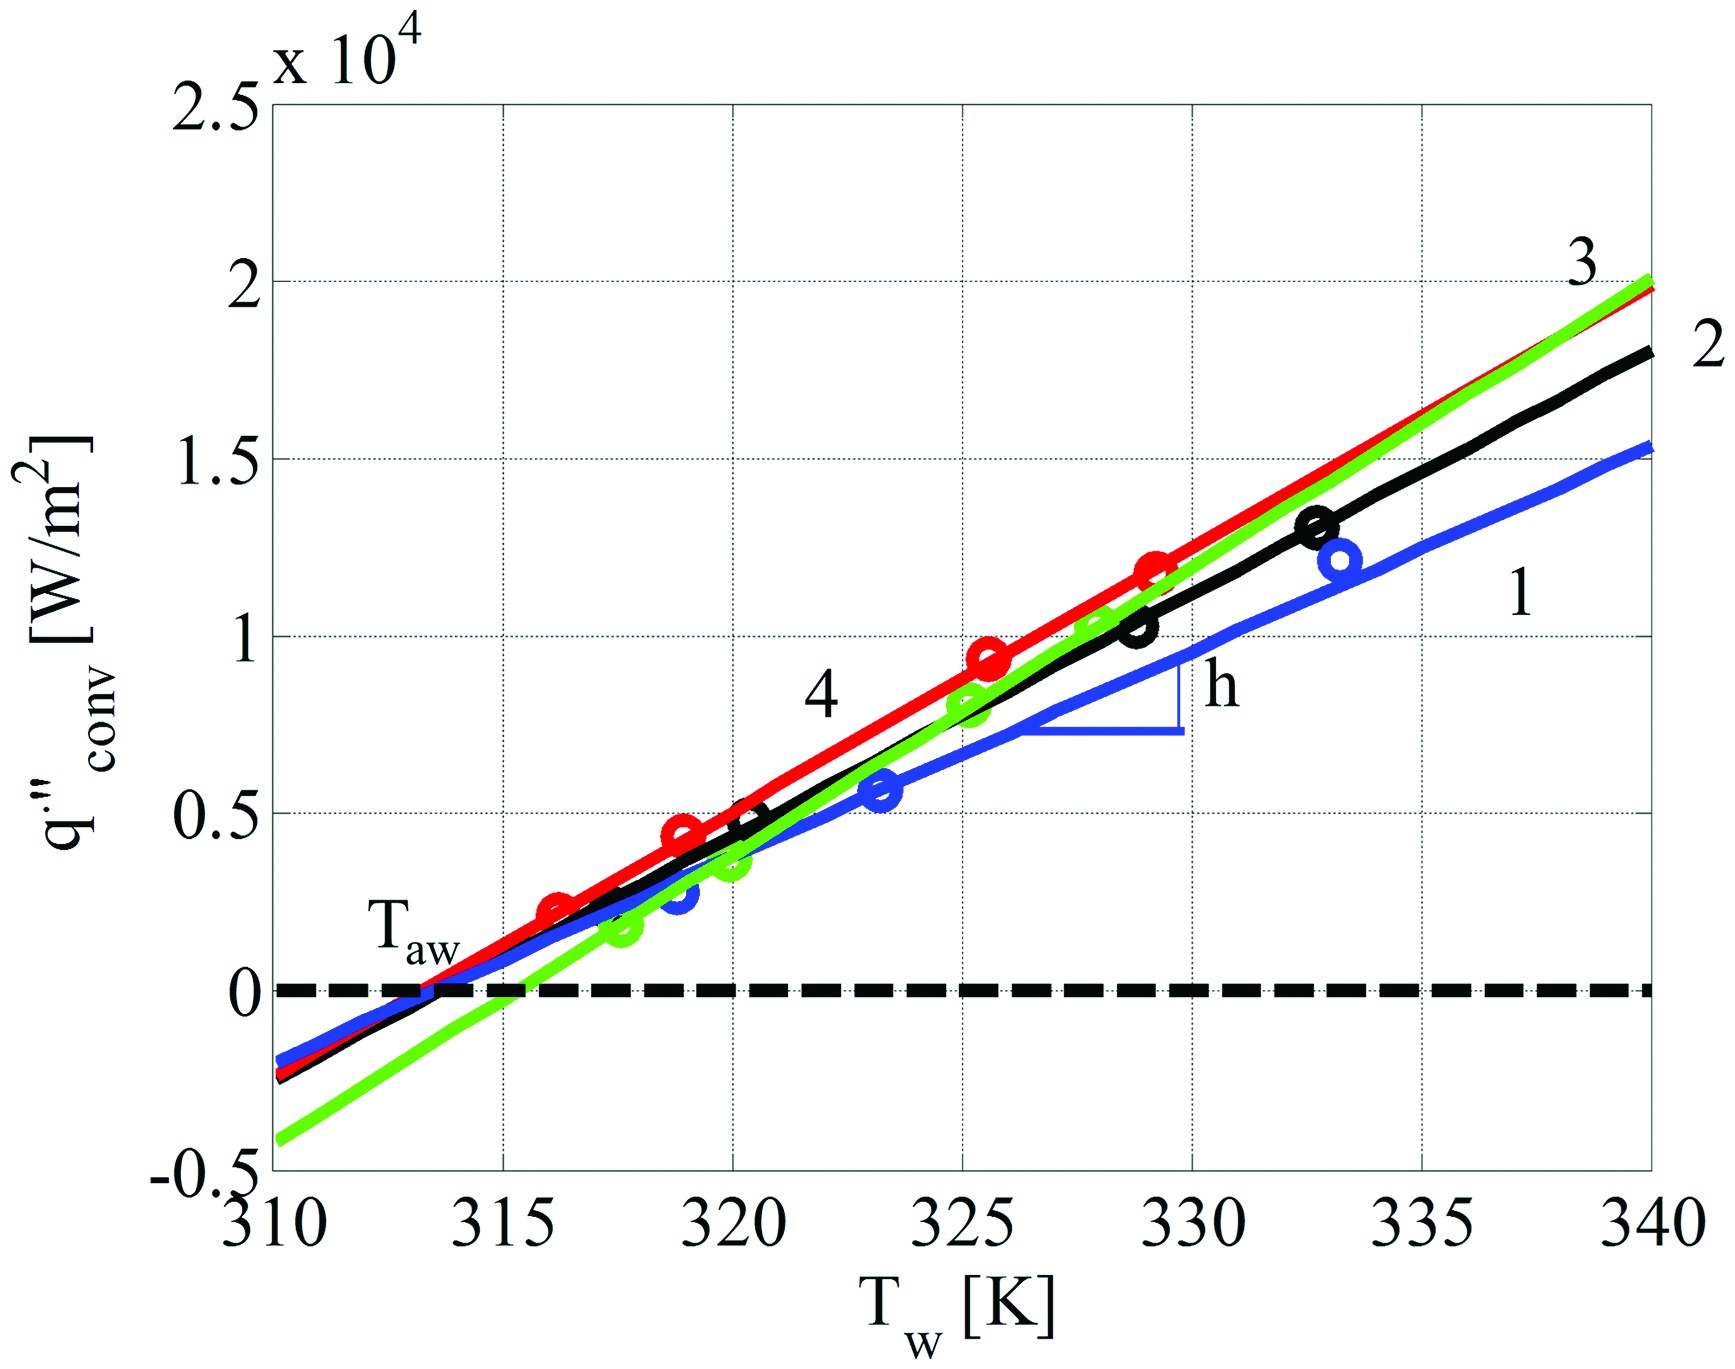
The heat transfer coefficient corresponds to the slope of the lines, while the intercept at
Computational setup
Transient CFD simulations were performed on a 20° sector of the complete 1.5 stage turbine, including the hub cavity. The mesh was generated in AutoGrid5TM by Numeca. Approximately 2M cells were used for each passage with an average y+ < 1. The simulations were conducted in ANSYS CFX v15.0 with experimental boundary conditions:
- total pressure and total temperature at the inlet;
- static pressure at the outlet;
- an IR = 0.8% for the cavity flow;
- two uniform endwall heat flux values for the Nusselt number calculation;
- an endwall equivalent sandgrain roughness of ks = 12 μm, representative of the the high-emissivity coating.
The Shear Stress Transport turbulence model and a temporal resolution of 50 time steps per rotor pitch were used. Three complete rotor revolutions ensure a converged aerodynamic flow field with adiabatic walls. An additional revolution was then conducted for each of the two wall heat flux boundary conditions. The results shown are derived from data that was time-averaged over this last revolution.
For comparison, also a steady state result is shown, derived from a mixing plane model. Mesh, boundary conditions and turbulence settings are identical to the transient setup.
Results and discussion
Distributions of measured heat transfer quantities on the rotor endwall are shown for the reference case: nominal operating condition of the facility with no injection of purge air. For the sake of clarity, the data shown in the all of the contour plots (except the uncertainty distributions) have undergone 100 iterations of Laplacian smoothing with an under-relaxation coefficient of 0.5 in Tecplot 360®. The main parameters of operation are summarized in Table 1.
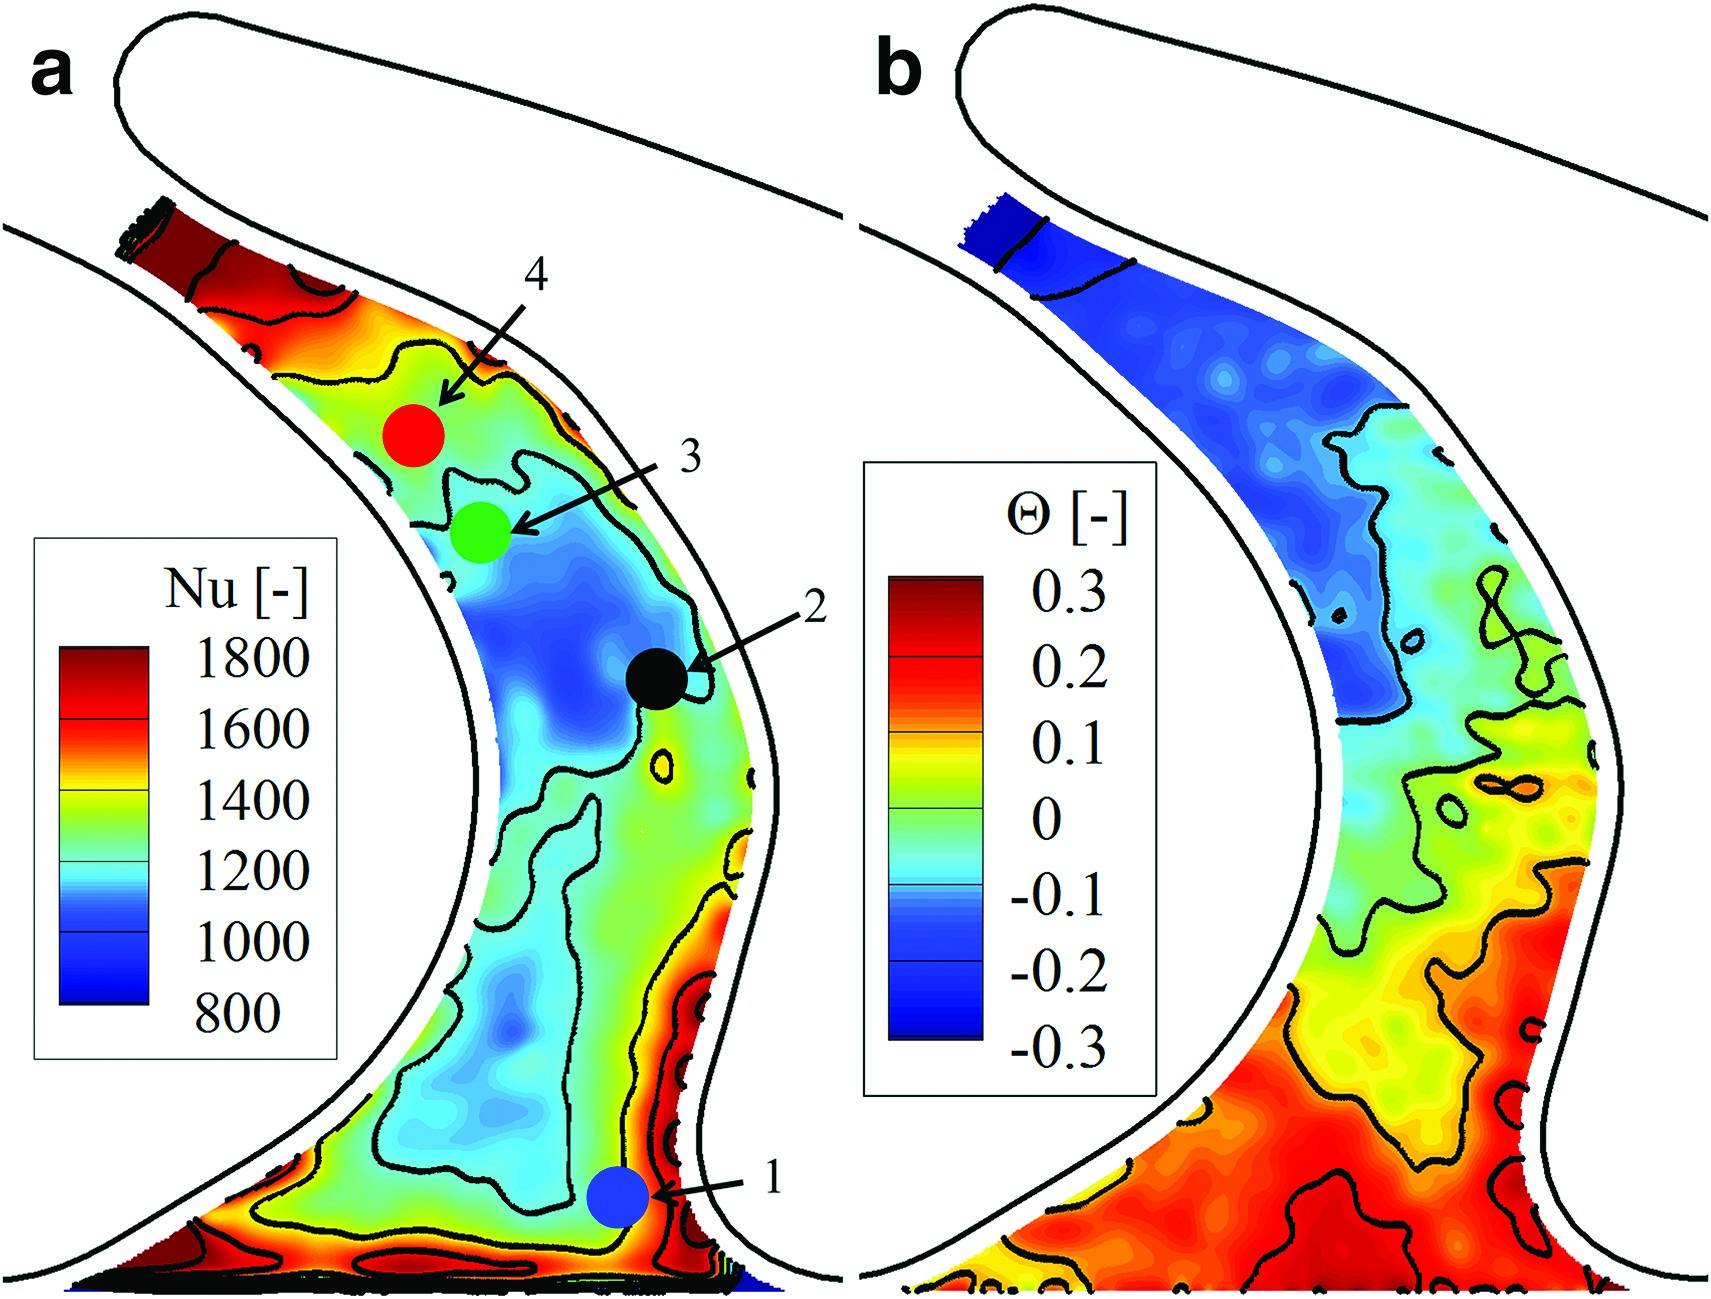
In the Nusselt number distribution of Figure 3 the following observations can be made:
1) a high rate of heat transfer at the very start of the passage is justified by the start of the thermal and aerodynamic boundary layer, since it corresponds to the start of the heated rotor endwall;
2) a wedge-like region with nearly uniform heat transfer is observed close to the entrance of the passage;
3) a higher heat transfer level is recorded close to the pressure side of the leading edge of the blade that can be related to the formation of the pressure leg of the horseshoe vortex;
4) the Nusselt number increases due to flow acceleration moving closer to the throat section of the passage.
The observations are consistent with studies from cascades 03, 13, 12.
The adiabatic wall temperature distribution is shown in Figure 3 in terms of its difference to the rotor-relative total temperature at rotor inlet Tt,rel, normalized by the relative dynamic temperature at rotor inlet (see ).
Where w∞,in is the relative velocity at rotor inlet and Cp,in is the specific heat at constant pressure for air at the static conditions at rotor inlet. As expected, the adiabatic wall temperature drops while the flow accelerates and expands. The triangular region in the middle of the passage inlet marks the partition between the suction and pressure legs of the horseshoe vortices, while the shape of the contours seem to correspond to the migration of the passage vortex towards the suction side of the blade.
Uncertainty analysis
The propagation of the uncertainties to the final results is evaluated by successively perturbing the input parameters of the processing software according to the method described by 20. In particular, the main relative contributions to the mean square error averaged over the passage come from:
- conductive losses (70%);
- variability of the scaling factor Sq with different power levels (22%);
- surface temperature (6%).
The conduction losses
The correction factor Sq variability is within 3.7% on average over the whole endwall surface, from tests performed in the range 0.9 kW/m2 to 2.3 kW/m2.
The remaining contributions come from uncertainties on the surface emissivity ɛ = 0.98 ± 2%, electrical power (±1.6%) and relative total temperature at rotor inlet (±1 K).
Effect of purge air on heat transfer quantities
Results are presented for the two injection rate settings of 0.8% and 1.2% referred to the reference case with no purge air injection (0.0%). Particularly, variations in Nusselt number and adiabatic wall temperatures are shown respectively in terms of percentage of the reference Nusselt number (Figure 5) and (Figure 6) and a non-dimensional temperature difference θ (Figure 5) and (Figure 6). The two quantities are defined as:
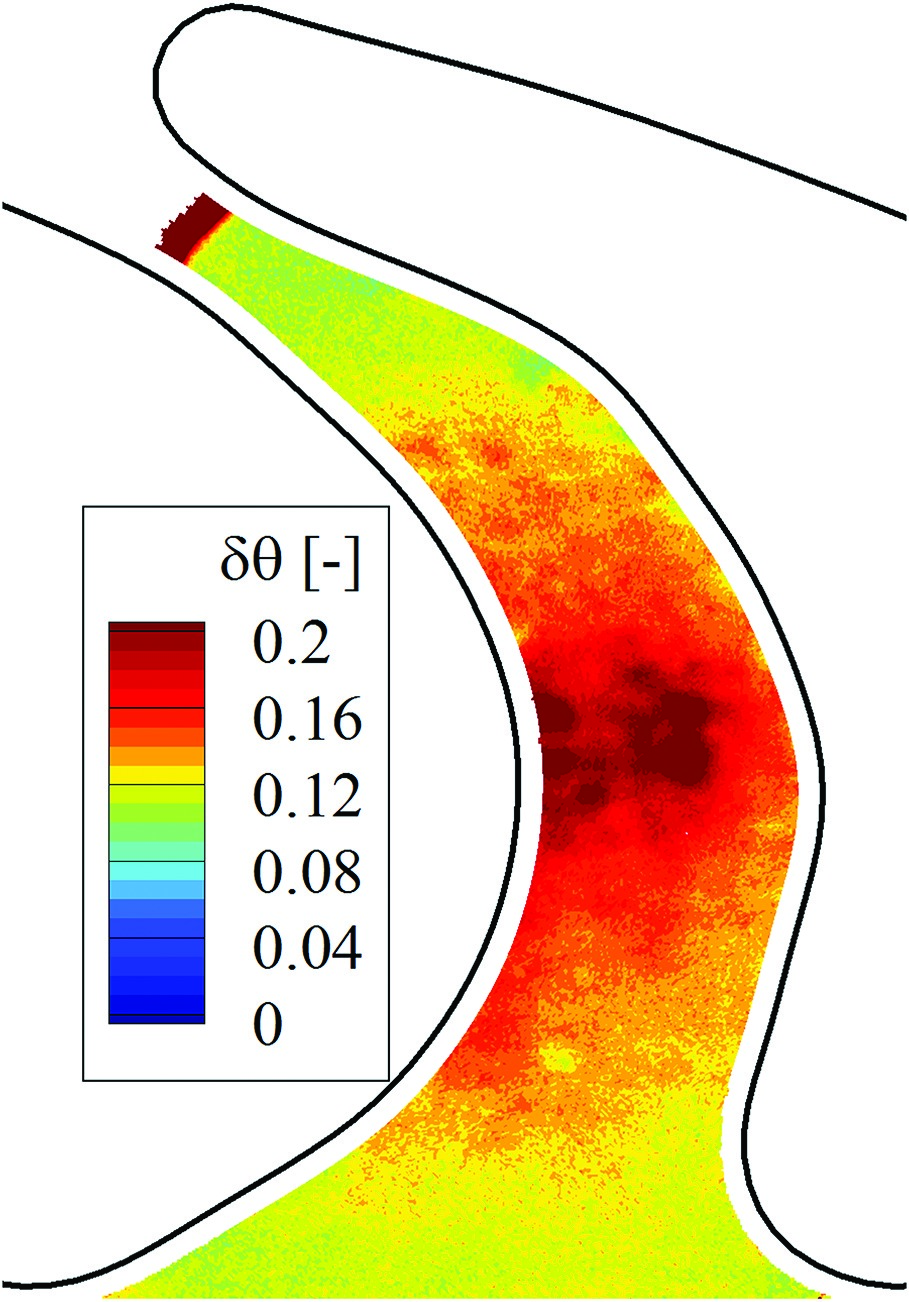
Figure 6.
a) Comparison between reference case (IR = 0.0%) and IR = 0.8%. Nusselt number relative difference; b) non-dimensional adiabatic wall temperature difference .
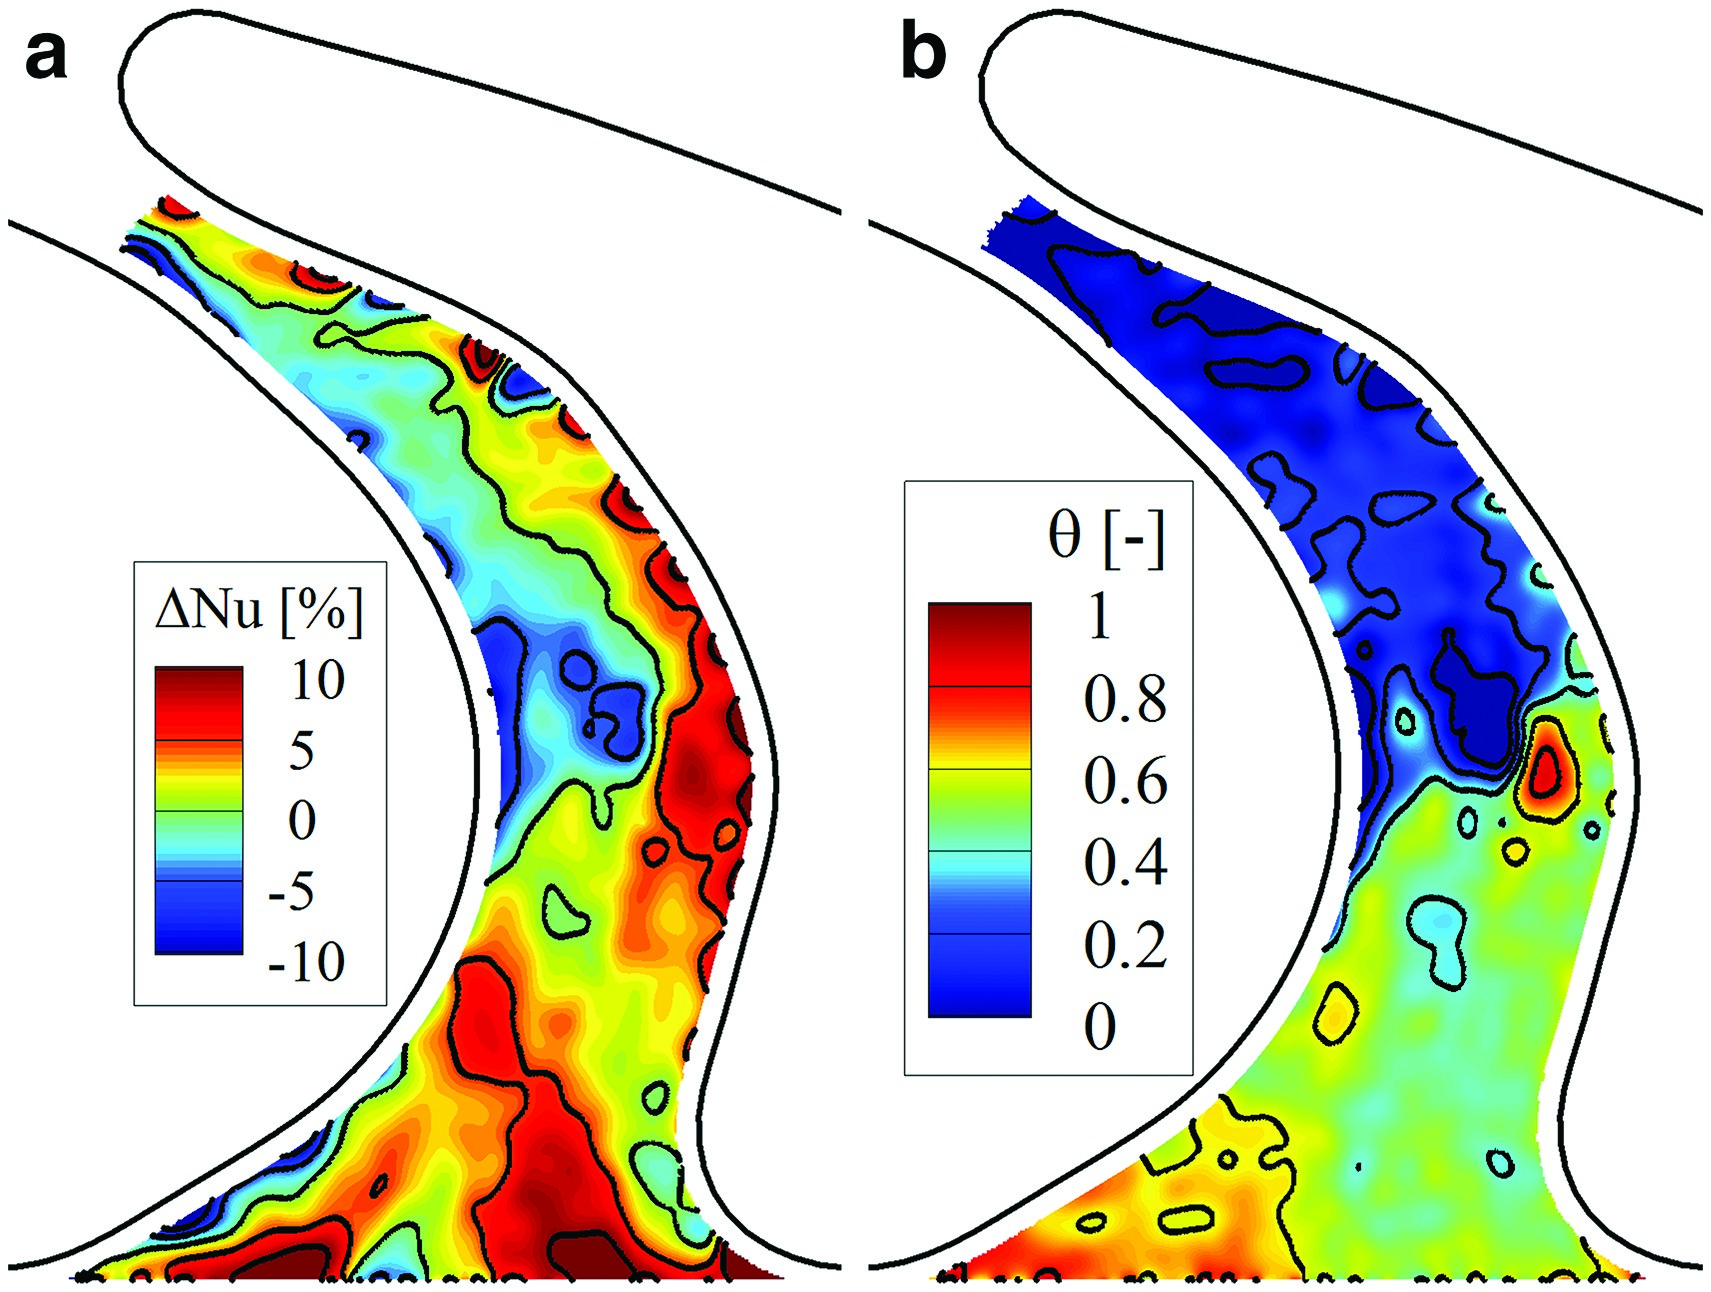
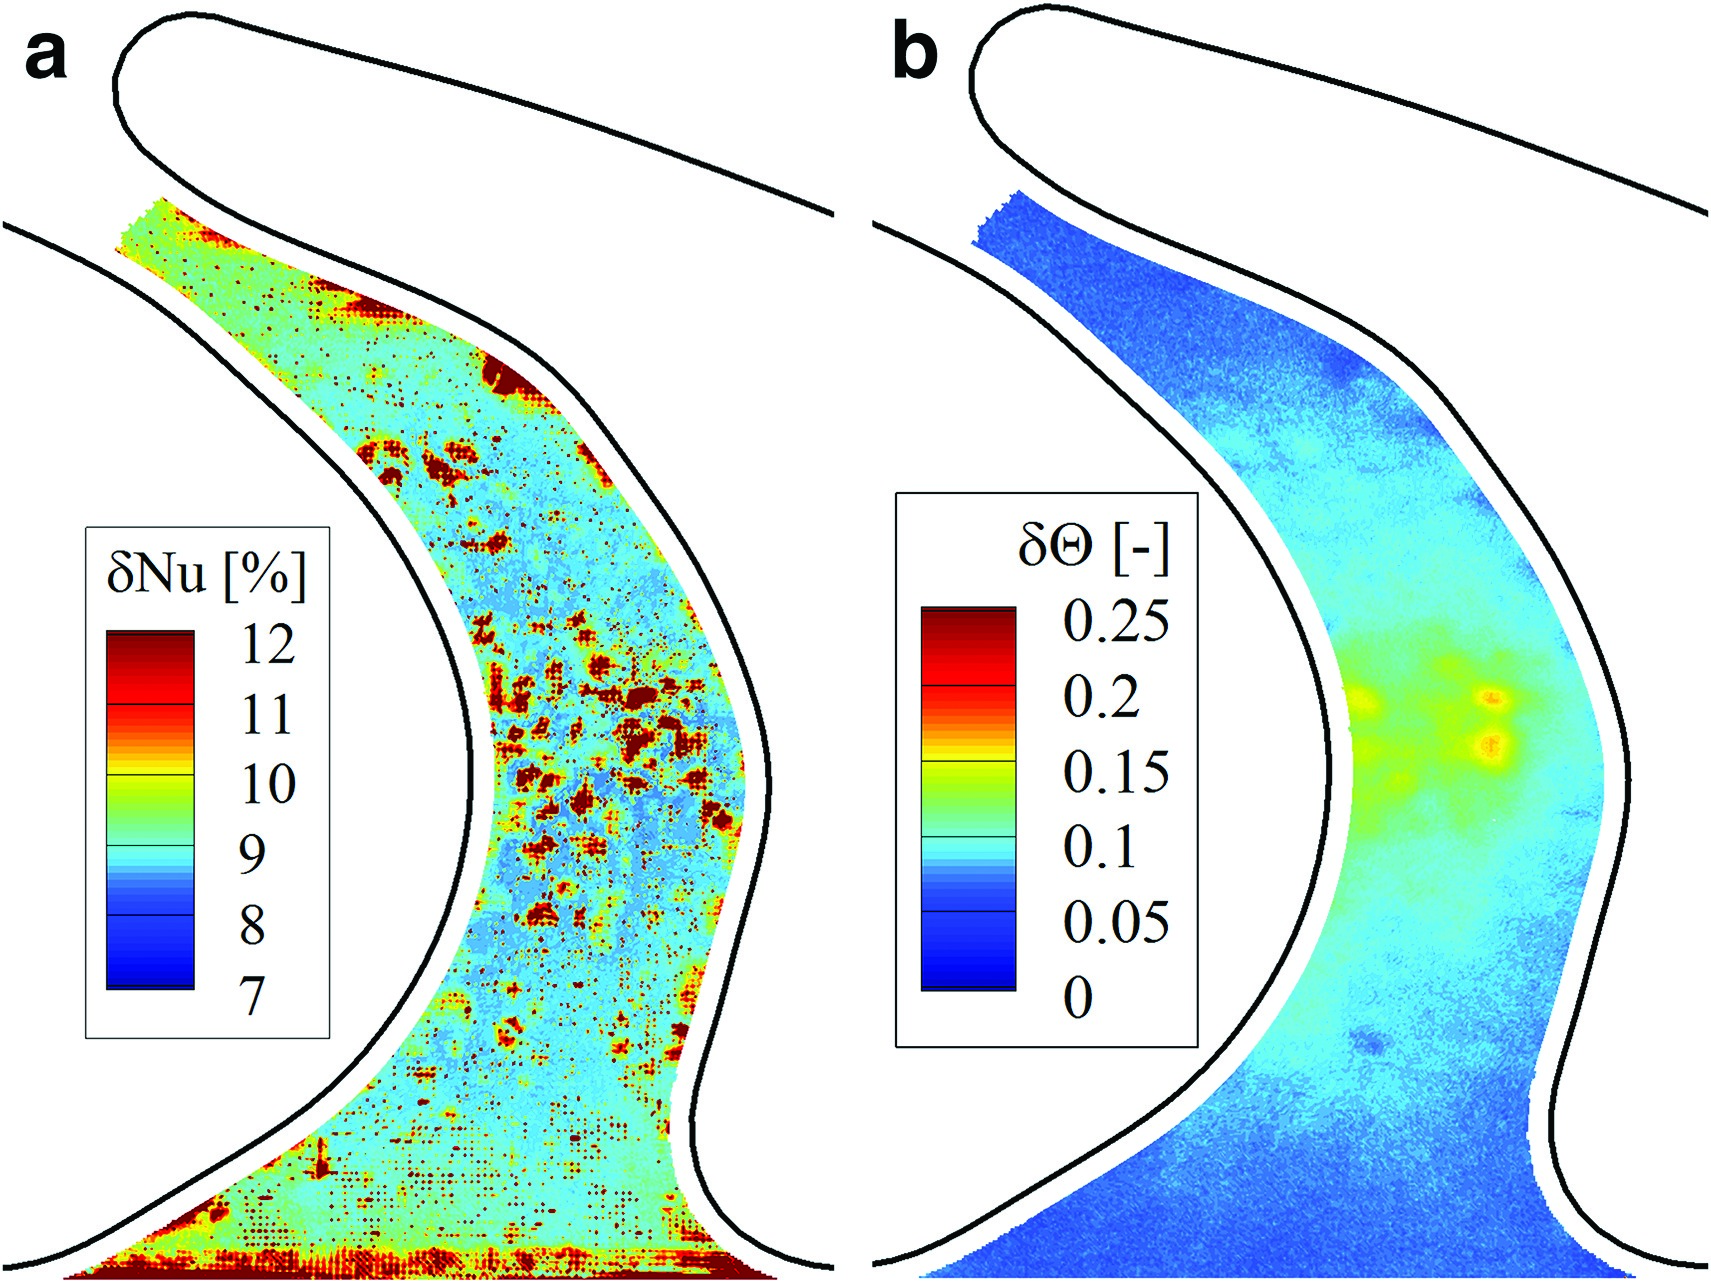
Figure 5.
Experimental uncertainty distributions for non-dimensional adiabatic wall temperature difference.
In , Taw is the local adiabatic wall temperature for the test case of interest, Taw,0.0% is the adiabatic wall temperature of the reference test case with no purge flow injection, Tt,rel,purge and Tt,rel,MAIN are respectively the rotor-relative total temperatures of the purge flow and of the main flow, obtained by means of probe measurements. Due to the operations in and , the uncertainties in ΔNu and θ are higher than the ones shown in Figure 4. An analytical calculation of uncertainty propagation shows that the uncertainties in ΔNu are ~14% on average over the whole endwall, while the uncertainty in θ is shown in Figure 5.
Figure 4.
a) Experimental uncertainty distributions for Nusselt number; b) non-dimensional adiabatic wall temperature.
The definition (9) enables a qualitative assessment of the cooling effect of the purge flow over the endwall. In the current study, density ratios are not representative of cooling conditions in actual engines, being in the order of 1. Furthermore, in this experiment, the cavity flow presents a rotor-relative total temperature higher than the one of the main flow by (2 ± 0.2) K.
Variations of Nusselt number on a point-wise basis are shown in Figure 6 and Figure 7, respectively for IR0.8% and IR1.2%, while laterally averaged profiles of Nusselt numbers are presented for all cases in Figure 8.
Figure 8.
a) Circumferentially averaged Nusselt number for all test cases; b) circumferentially averaged non-dimensional adiabatic wall temperature (see ).
Error bars represent a 95% confidence interval.
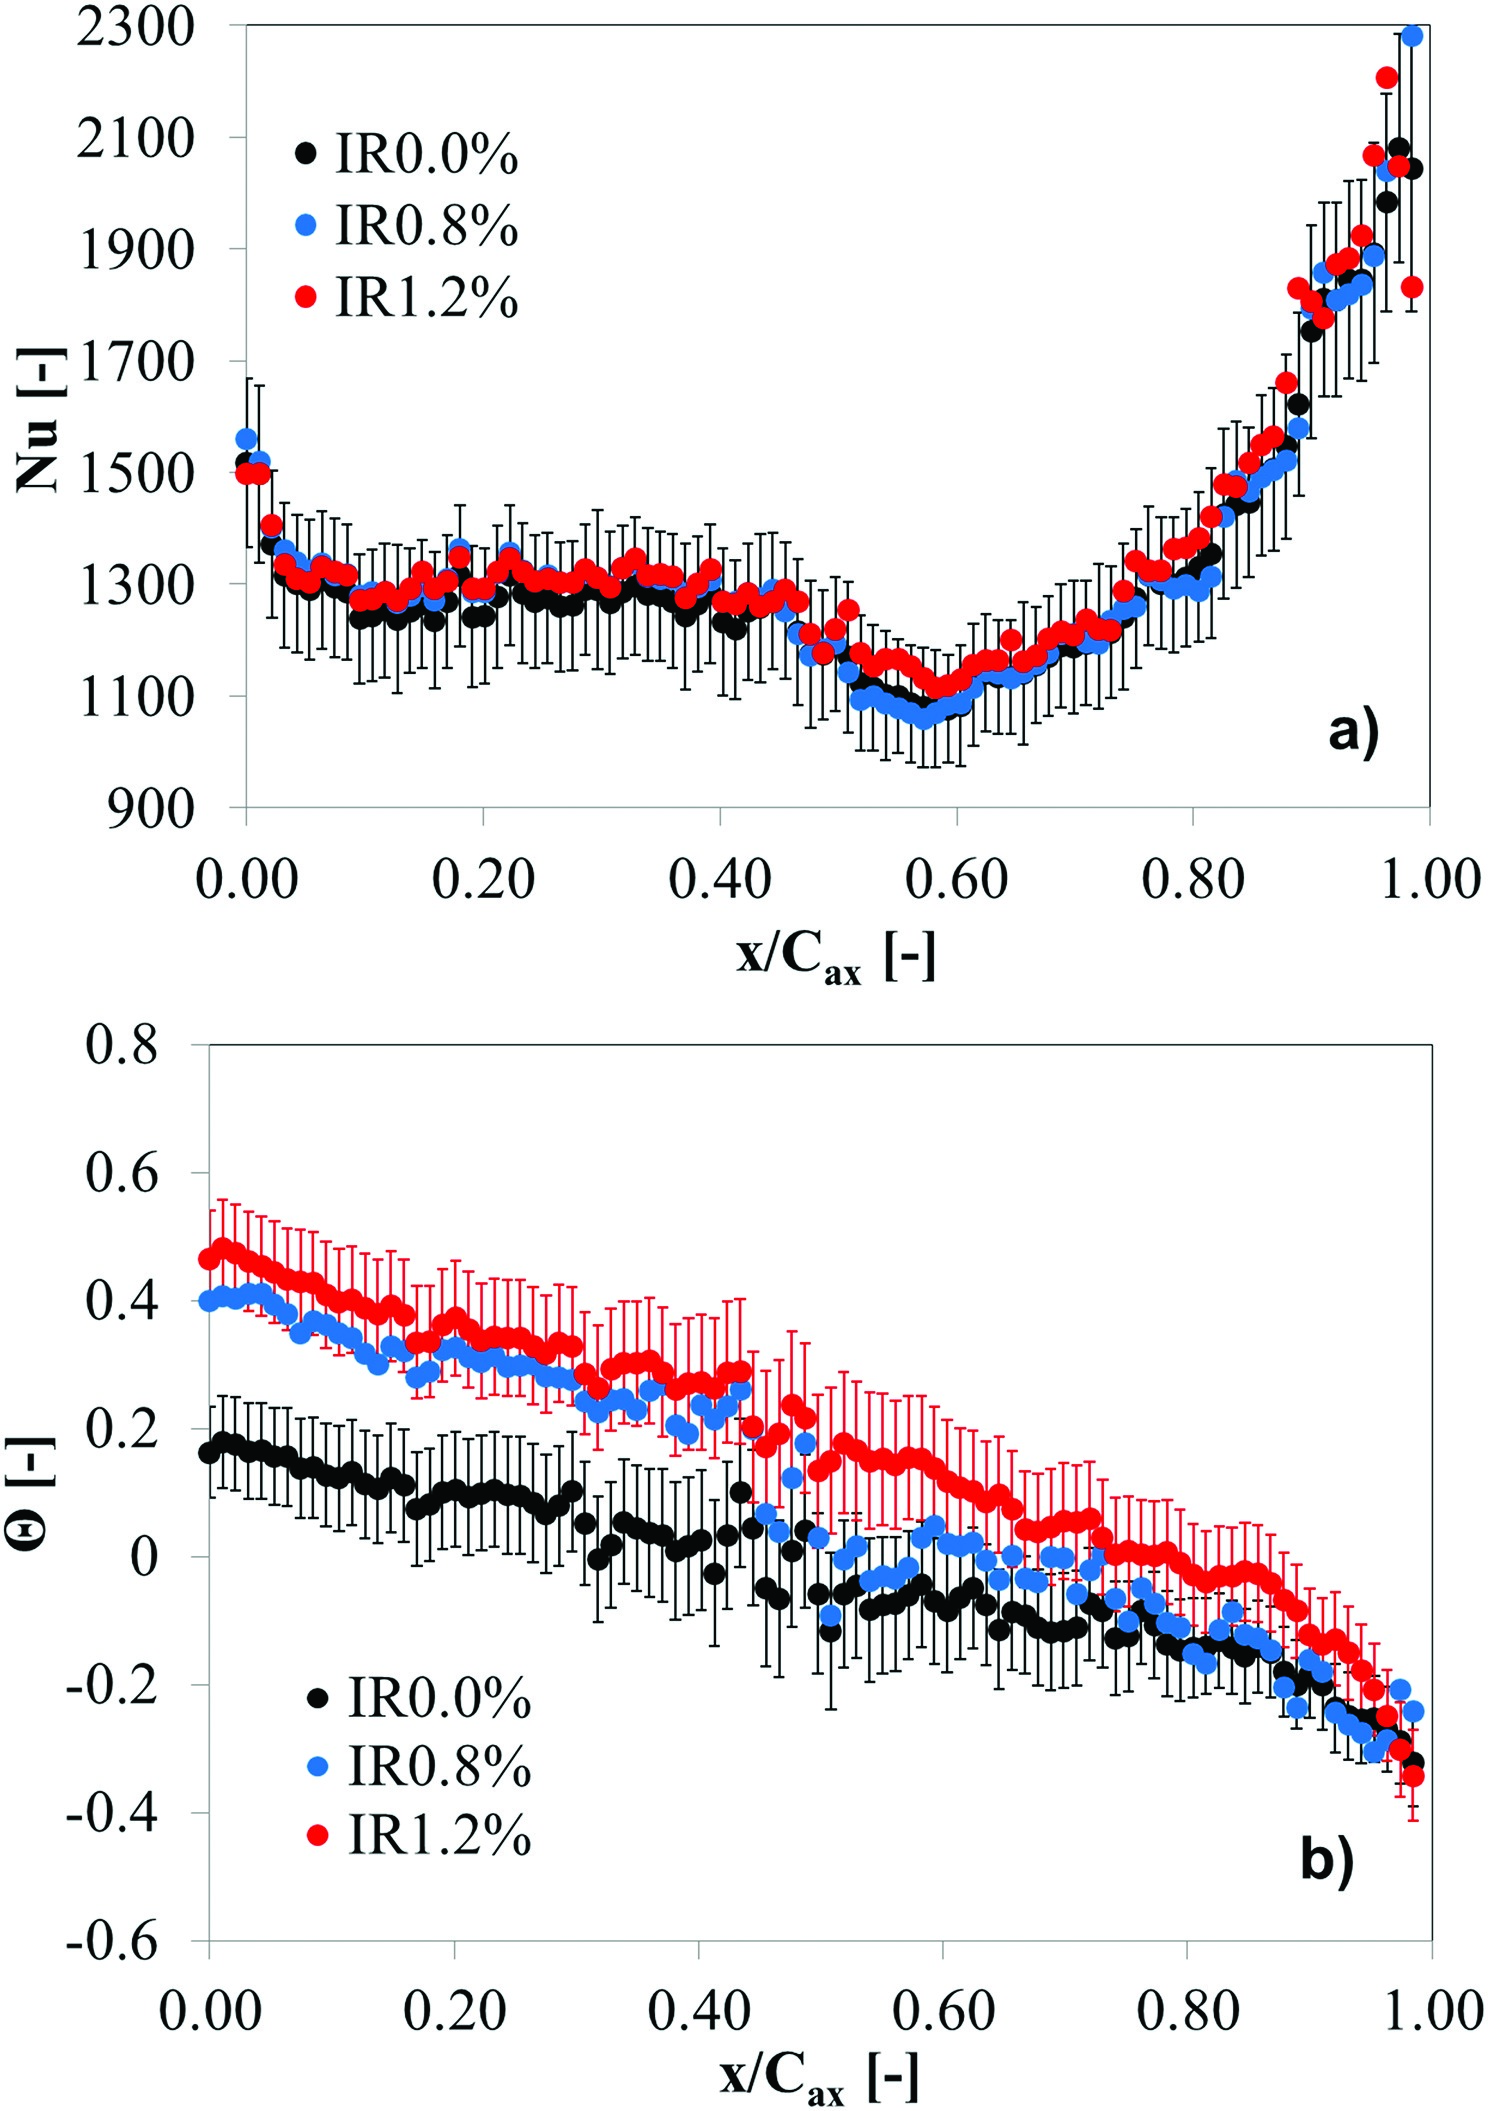
Figure 7.
a) comparison between reference case (IR = 0.0%) and IR = 1.2%. Nusselt number relative difference; b) non-dimensional adiabatic wall temperature difference .
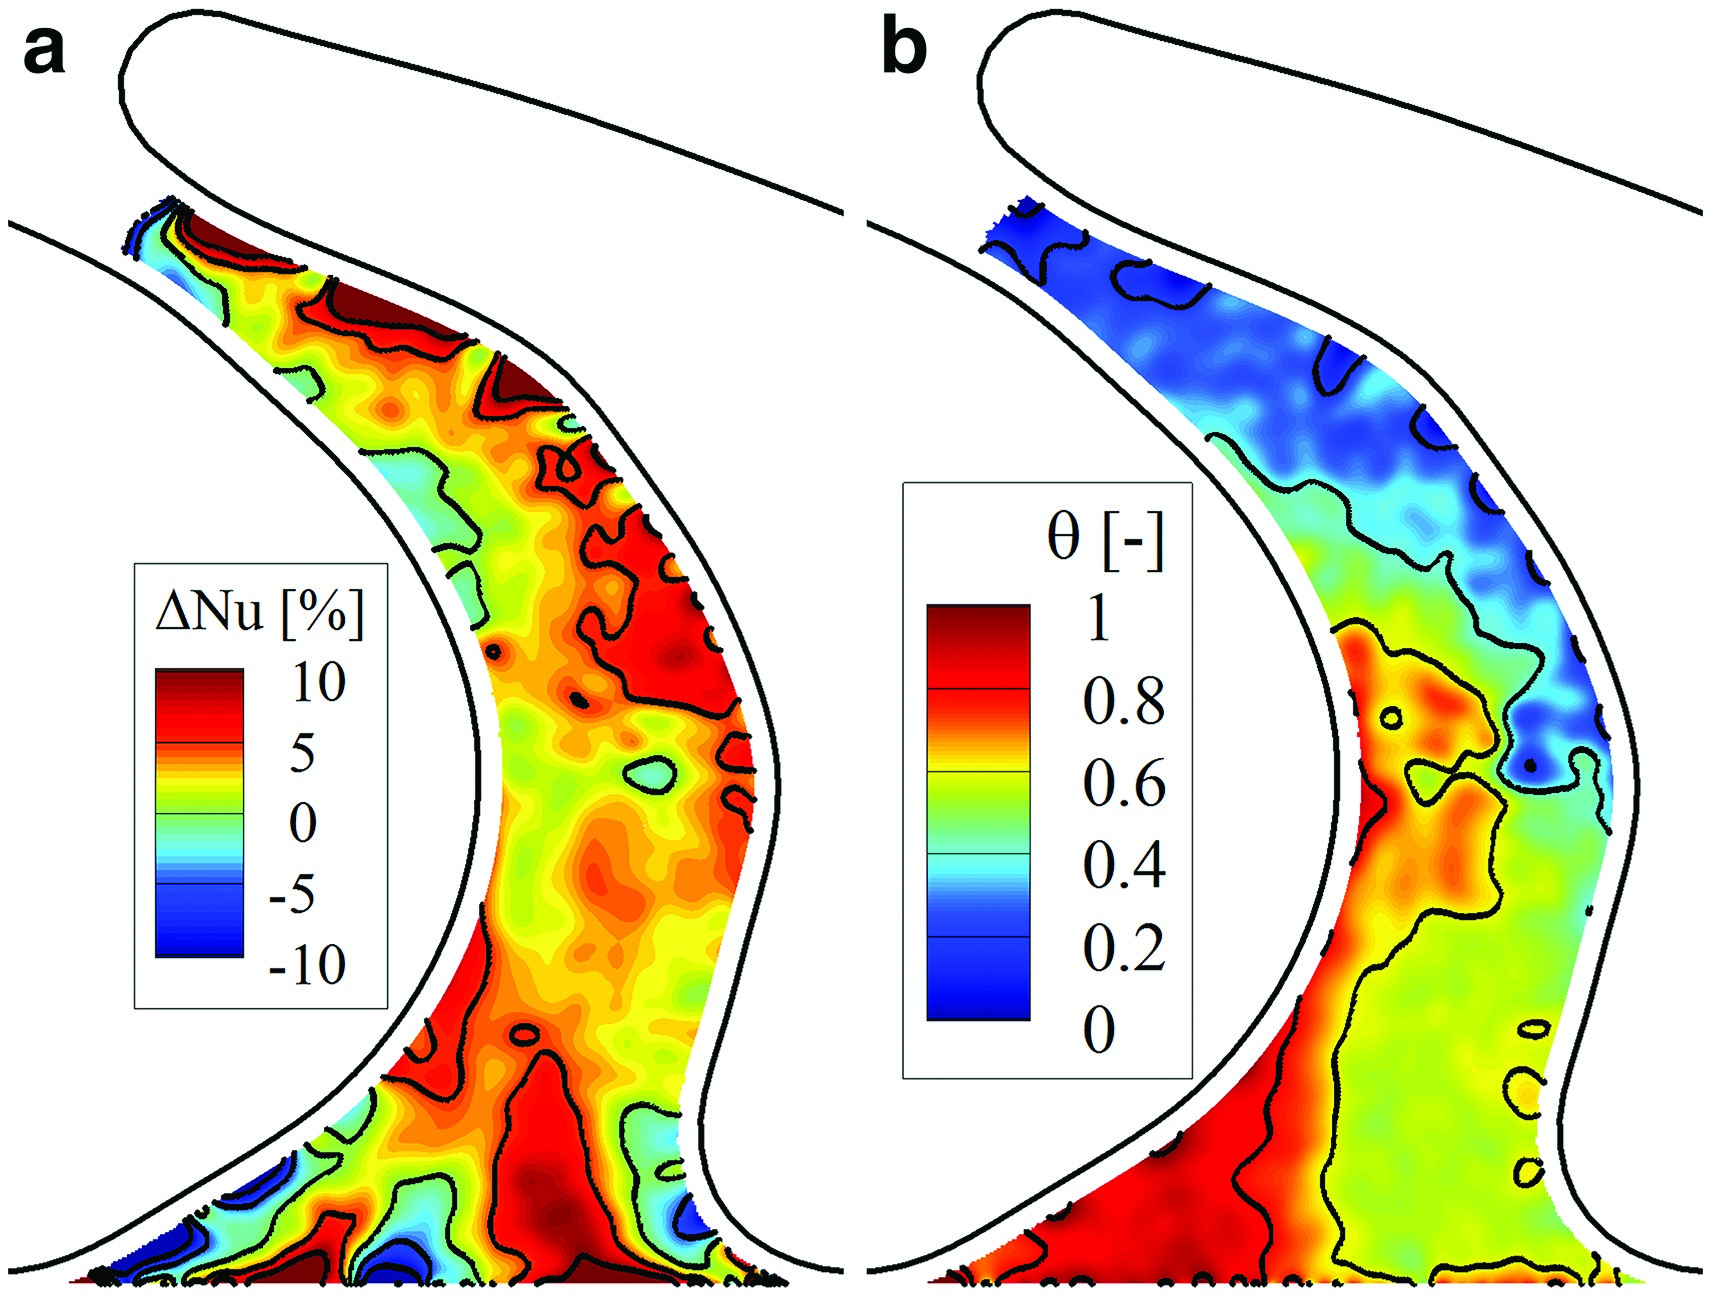
Differences in Nusselt number induced by different rates of purge air injection are generally within the measurement uncertainties both on a local and on a circumferentially averaged basis. Nonetheless, at the very inlet of the passage, close to the suction side of the rotor blade, pairs of islands presenting increases up to 20% of the reference case and decreases of the order of 5% are consistently observed in both Nusselt number distributions recorded for IR0.8% and IR1.2%. The patterns suggest a strengthening of the suction side leg of the horseshoe vortex producing an increase of heat transfer due to the downwash acceleration and a milder decrease corresponding to the upwash acceleration. Similar effects have been observed in turbulent boundary layers perturbed by longitudinal vortices 09. Moreover, increases up to 20% are also recorded closer to the pressure side of the blade and affecting a wider area spanning towards the suction side. This can be related to the strengthening of the passage vortex due to the entrainment of purge flow. Additionally, it is worth noting that the area of Nusselt number increase in the proximity of the pressure side of the blade has a lesser axial extent in the IR1.2% case. This suggests an earlier lift-off of the passage vortex due to the higher radial momentum of the purge flow.
The adiabatic wall temperature distributions underline for both cases (Figure 6) and (Figure 7) how the purge flow is most effective as coolant in the proximity of the suction side of the rotor blade, as expected. In this location, the effect of purge air manifests itself as a local increase of the adiabatic wall temperature. Respectively, the increase is of 0.67 times the difference between the rotor-relative total temperatures of the cavity flow and the main flow for an IR0.8% and of 0.82 times for an IR1.2%.
The local character of the adiabatic wall temperature variation highlights how the purge air has a potential application as coolant for specific rotor endwall locations (i.e., inlet of the passage towards the suction side of the blade).
On a circumferentially averaged basis, Figure 8 shows negligible impact of the purge air injection, while differences are still well distinguishable in Figure 8, especially towards the inlet and until ~30% of the rotor blade axial chord Cax.
Comparison with numerical predictions
Both predictions and experimental data for IR0.8% show the following features consistently:
- a high heat transfer region on the pressure side of the passage due to the horseshoe vortex formation;
- the increase of Nusselt number due to flow acceleration;
- two regions of lower heat transfer close to the inlet and downstream of the migration of the passage vortex towards the suction side of the passage.
Notice that the start of the boundary layer is not present in the CFD results, because the uniform heat flux boundary condition is imposed from further upstream (2% of Cax) in the model, compared to the start of the heated platform used in the experiments. This was necessary to overcome difficulties in meshing the cavity/main flow path interface.
The general underestimation of the heat transfer level is attributed to the effect of wall roughness, not properly captured by the simulations. An estimation of the non-dimensional sandgrain roughness
can be given based on the measured sandgrain roughness ks, the mass-averaged relative velocities w measured by probes, Fanning’s friction factor f as calculated by 05 and the kinematic viscosity of air ν at the mass-averaged static conditions measured at inlet and outlet of the rotor. The values are ks+~28 at the inlet of the passage and ks+~47 at the outlet and fall – according to the classification of 21 –, in the transitionally rough regime (5 < ks+ < 70). The doubling of ks+ across the passage can explain, in particular, the divergence of the two corresponding laterally averaged Nusselt number curves in Figure 10.
Figure 10.
Circumferentially averaged Nusselt number profiles.
Shaded area represents experimental uncertainty.
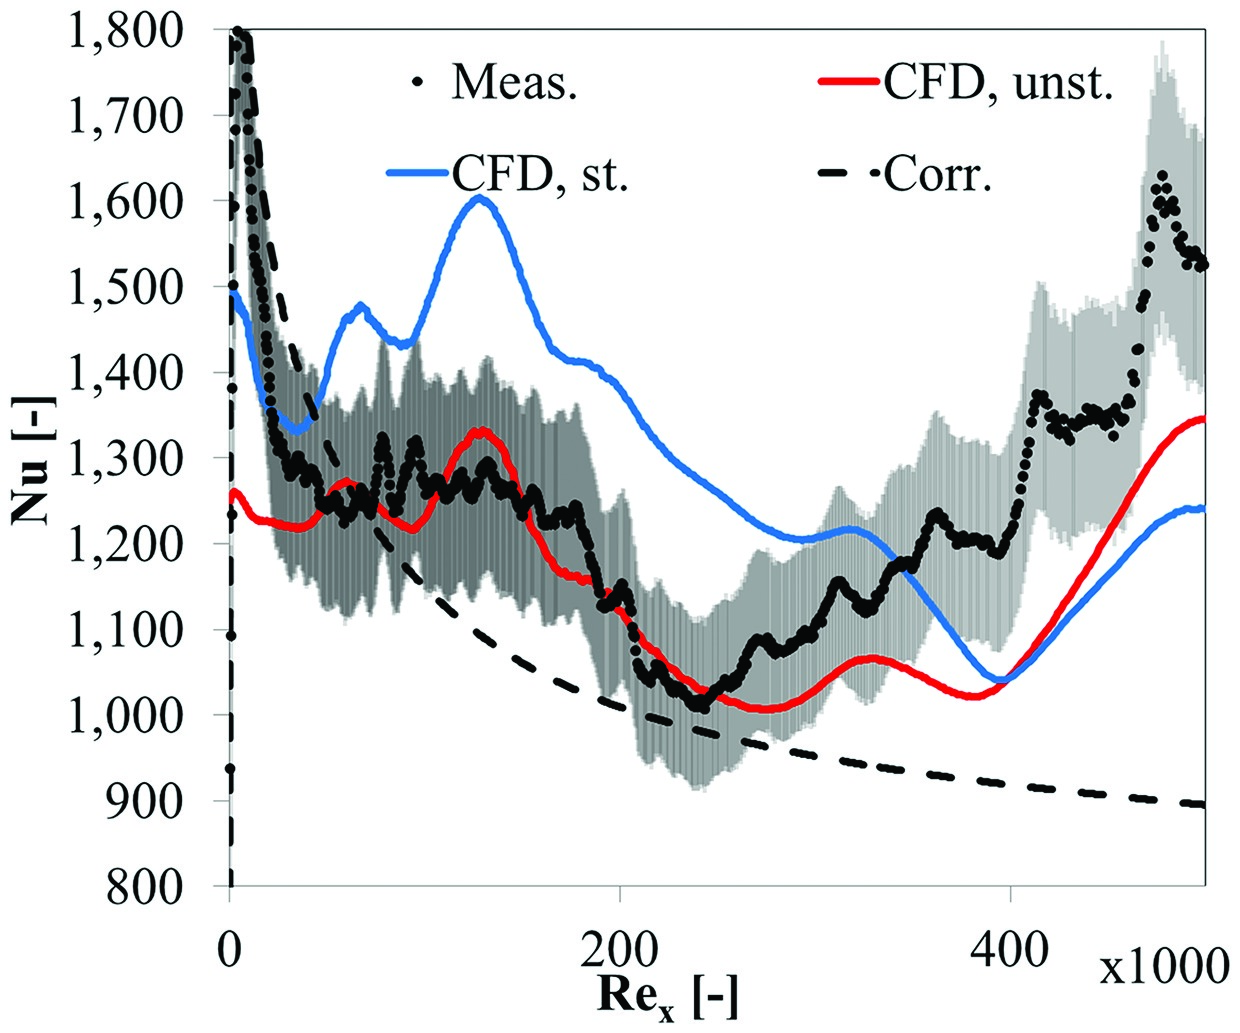
The circumferentially averaged Nusselt number profiles of Figure 10 show good agreement between the experimental data and the unsteady simulations until about 50% of the axial extent of the passage. From this point on, the flow acceleration becomes of relevance and the increase in heat transfer due to the thinner boundary layer is underpredicted. The discrepancy is attributed to a not captured wall roughness effect. The steady CFD simulation tends to overpredict the heat transfer significantly (20–30%). The comparison is completed with a flat plate correlation for turbulent boundary layers on surfaces with uniform heat flux:
The correlation matches the experiments in the initial part of the passage (until ~15–20% of its axial extent), until secondary flows and flow acceleration occur.
Conclusions
The main conclusions of the current work can be summarized as follows:
1) the spatial resolution and sensitivity of the IR-based technique developed for this work are sufficient to detect local variations in heat load due to flow features and the effects of purge air injection on the adiabatic wall temperature on the rotor endwall;
2) overall, the effect of purge flow on the Nusselt number distribution falls within the measurement uncertainty. However, the observed trends show a change in the secondary flow patterns and, particularly, a strengthening effect of purge air injection on the horseshoe vortex and passage vortex;
3) purge flow has a relevant effect on the heat fluxes close to the suction side of the rotor passage, up to ~30% of its axial extent. It does alter, in fact, the adiabatic wall temperature by bringing it closer to its own rotor-relative total temperature. An increase in the local adiabatic wall temperature of 67% of the temperature difference between cavity flow and main flow is reported for an IR of 0.8%. The increase grows to 82% for an IR of 1.2%. These results suggest that purge flow can effectively be used as rotor platform coolant in the specific region of the passage close to the suction side of the rotor blade;
4) unsteady heat transfer predictions show agreement within the experimental uncertainty until ~50% of the axial extent of the passage. Steady state simulations, on the other hand, overpredict heat transfer by up to 20–30%. The computational effort of running unsteady simulations is paid off by greater accuracy in the predictions.
Nomenclature
A
endwall surface area
Cp
specific heat of air
Cax
axial chord of rotor blade measured at midspan
d
RTD sensor distance from endwall surface
h
heat transfer coefficient
i
current
IR
injection ratio
k
th. cond. of air at rotor inlet static conditions
ks
equivalent sandgrain roughness
ks+
non-dimensional equivalent sandgrain roughness
mass flow rate
Nu
Nusselt number based on axial chord and thermal conductivity of air
P
electrical power
Pr
Prandtl number
heat flux
r
turbulent recovery factor
Re
Reynolds number
Sq
heat flux scaling factor
T
temperature
uτ
friction velocity
V
voltage
w∞
mass-averaged, rotor-relative flow velocity
y+
1st cell height, non-dim. by viscous unit