
Introduction
Atomization of liquid fuels plays an important role in gas turbine combustion as its quality has a direct consequence on combustion efficiency and emissions of pollutants. As such, spray characterization is an essential step in the development of gas turbine combustors and fuel injectors, requiring reliable diagnostic techniques.
To fully characterize a spray large amounts of information are needed. Macro features, including overall spray dimensions such as width and cone angle are typically determined by photographic flow visualization. Micro features, such as droplet size, spatial distribution and velocity, require the application of more sophisticated diagnostics. Non-intrusive, laser based measurement tools, are widely used for this purpose and can provide the experimenter with substantial data about the spray.
The current state-of-the-art technique for measuring the size of droplets in a spray is the phase Doppler anemometer (PDA), which is able to simultaneously measure both droplet size and velocity at a rate in excess of 20 kHz. PDA is a point based technique, requiring a large number of measurements be made at different locations over the entire spray to completely map the spatial distribution of droplet size and velocity. This is time consuming and consequently expensive given the high cost of testing at gas turbine representative pressures. Planar laser-based measurement methods, such as Laser Induced Fluorescence (LIF)/Mie ratio-metric imaging, have the potential to collect much larger amounts of data within considerably shorter time periods compared to PDA. Unfortunately, such imaging techniques have serious drawbacks and limitations.
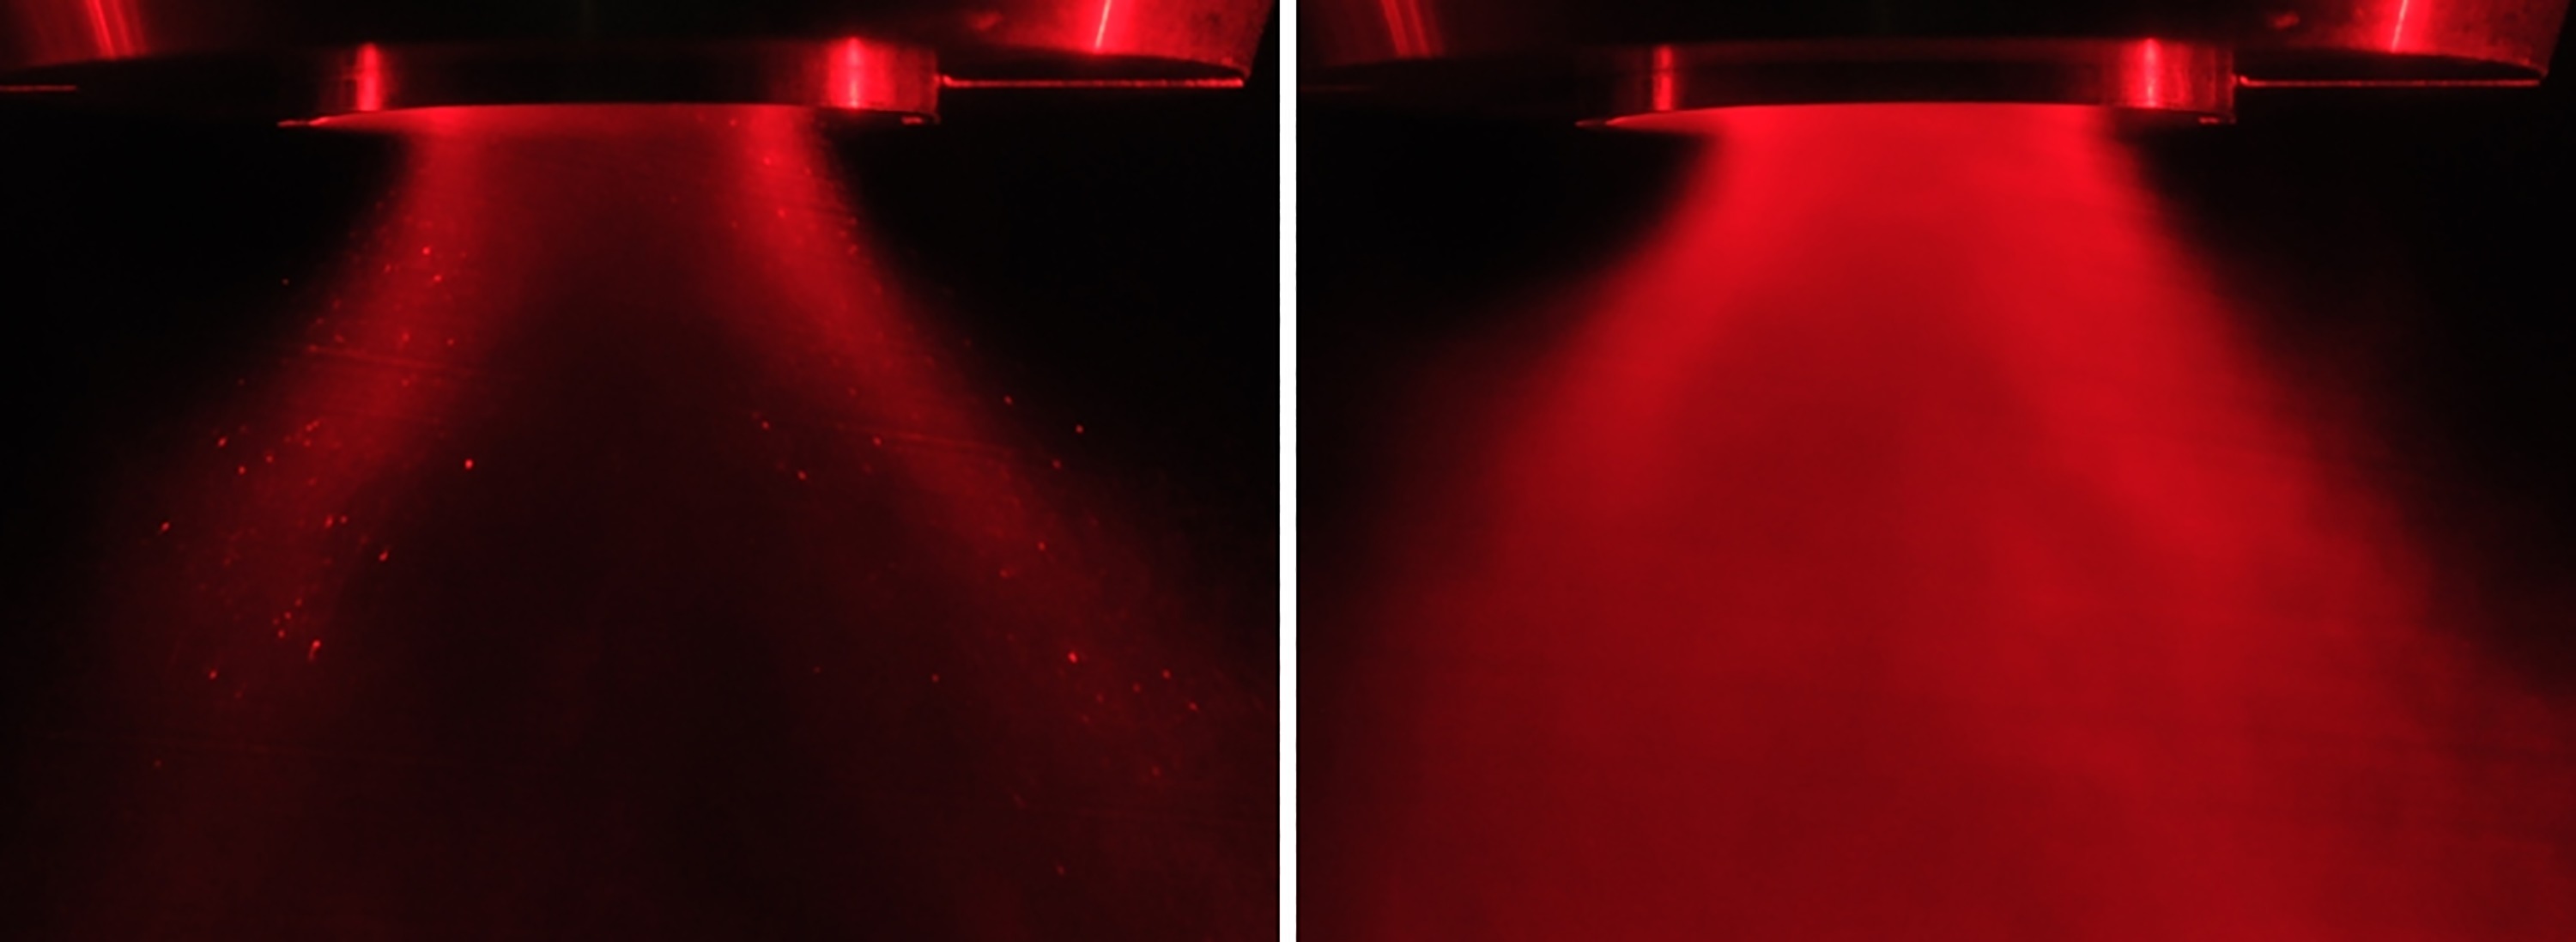
As the number of particles in the spray increases as a result of higher liquid flow rates and improved atomization, measurements become more and more challenging due to the laser light attenuating as it travels through the spray. This is exacerbated further by virtue of the light being scattered multiple times as it travels from its source to the detection plane, producing erroneous signals in the process and making features on the interior of the spray difficult to measure. These phenomena explain why many of the conventional images of hollow cone sprays found in the literature have visible cores at low flows and pressures, but appear to be solid cones at high power conditions. An example of this is demonstrated in Figure 1, which shows how the centre of a hollow cone spray is visible at lower ambient pressure, but is obscured at higher pressures by the multiple scattering caused by the dense field of droplets.
Figure 1.
Laser sheet images of a hollow cone fuel spray at low and high pressure. Left: Ambient Pressure = 3.4 atm. Right: Ambient Pressure = 10 atm.
A method for suppressing the multiple scattering effects has been demonstrated by Berrocal and co-workers (Berrocal et al., 2008). They used a laser sheet with a modulated intensity profile (i.e. sinusoidal intensity pattern) and post processing algorithms to generate images of a spray that are free of multiple scattering artefacts. Using PDA, (Mishra et al., 2015) showed that a LIF/Mie ratio-metric image collected with conventional laser sheet imaging could not be calibrated because the resulting intensity ratios in the image did not correspond to a singular droplet Sauter-mean diameter (SMD). By incorporating a Structured Laser Illumination Planar Imaging (SLIPI) strategy into the measurement system, they were able to apply LIF/Mie imaging to capture images that could be calibrated. This work represented a significant advancement in spray diagnostics, as it enabled the measurement of a SMD map in a few seconds: a task that would take hours with conventional methods. However, they only presented data at one axial plane for one image. As a result, questions still remain in regard to how widely the calibration can be applied, which is the focus of this paper.
Methodology
Test facility
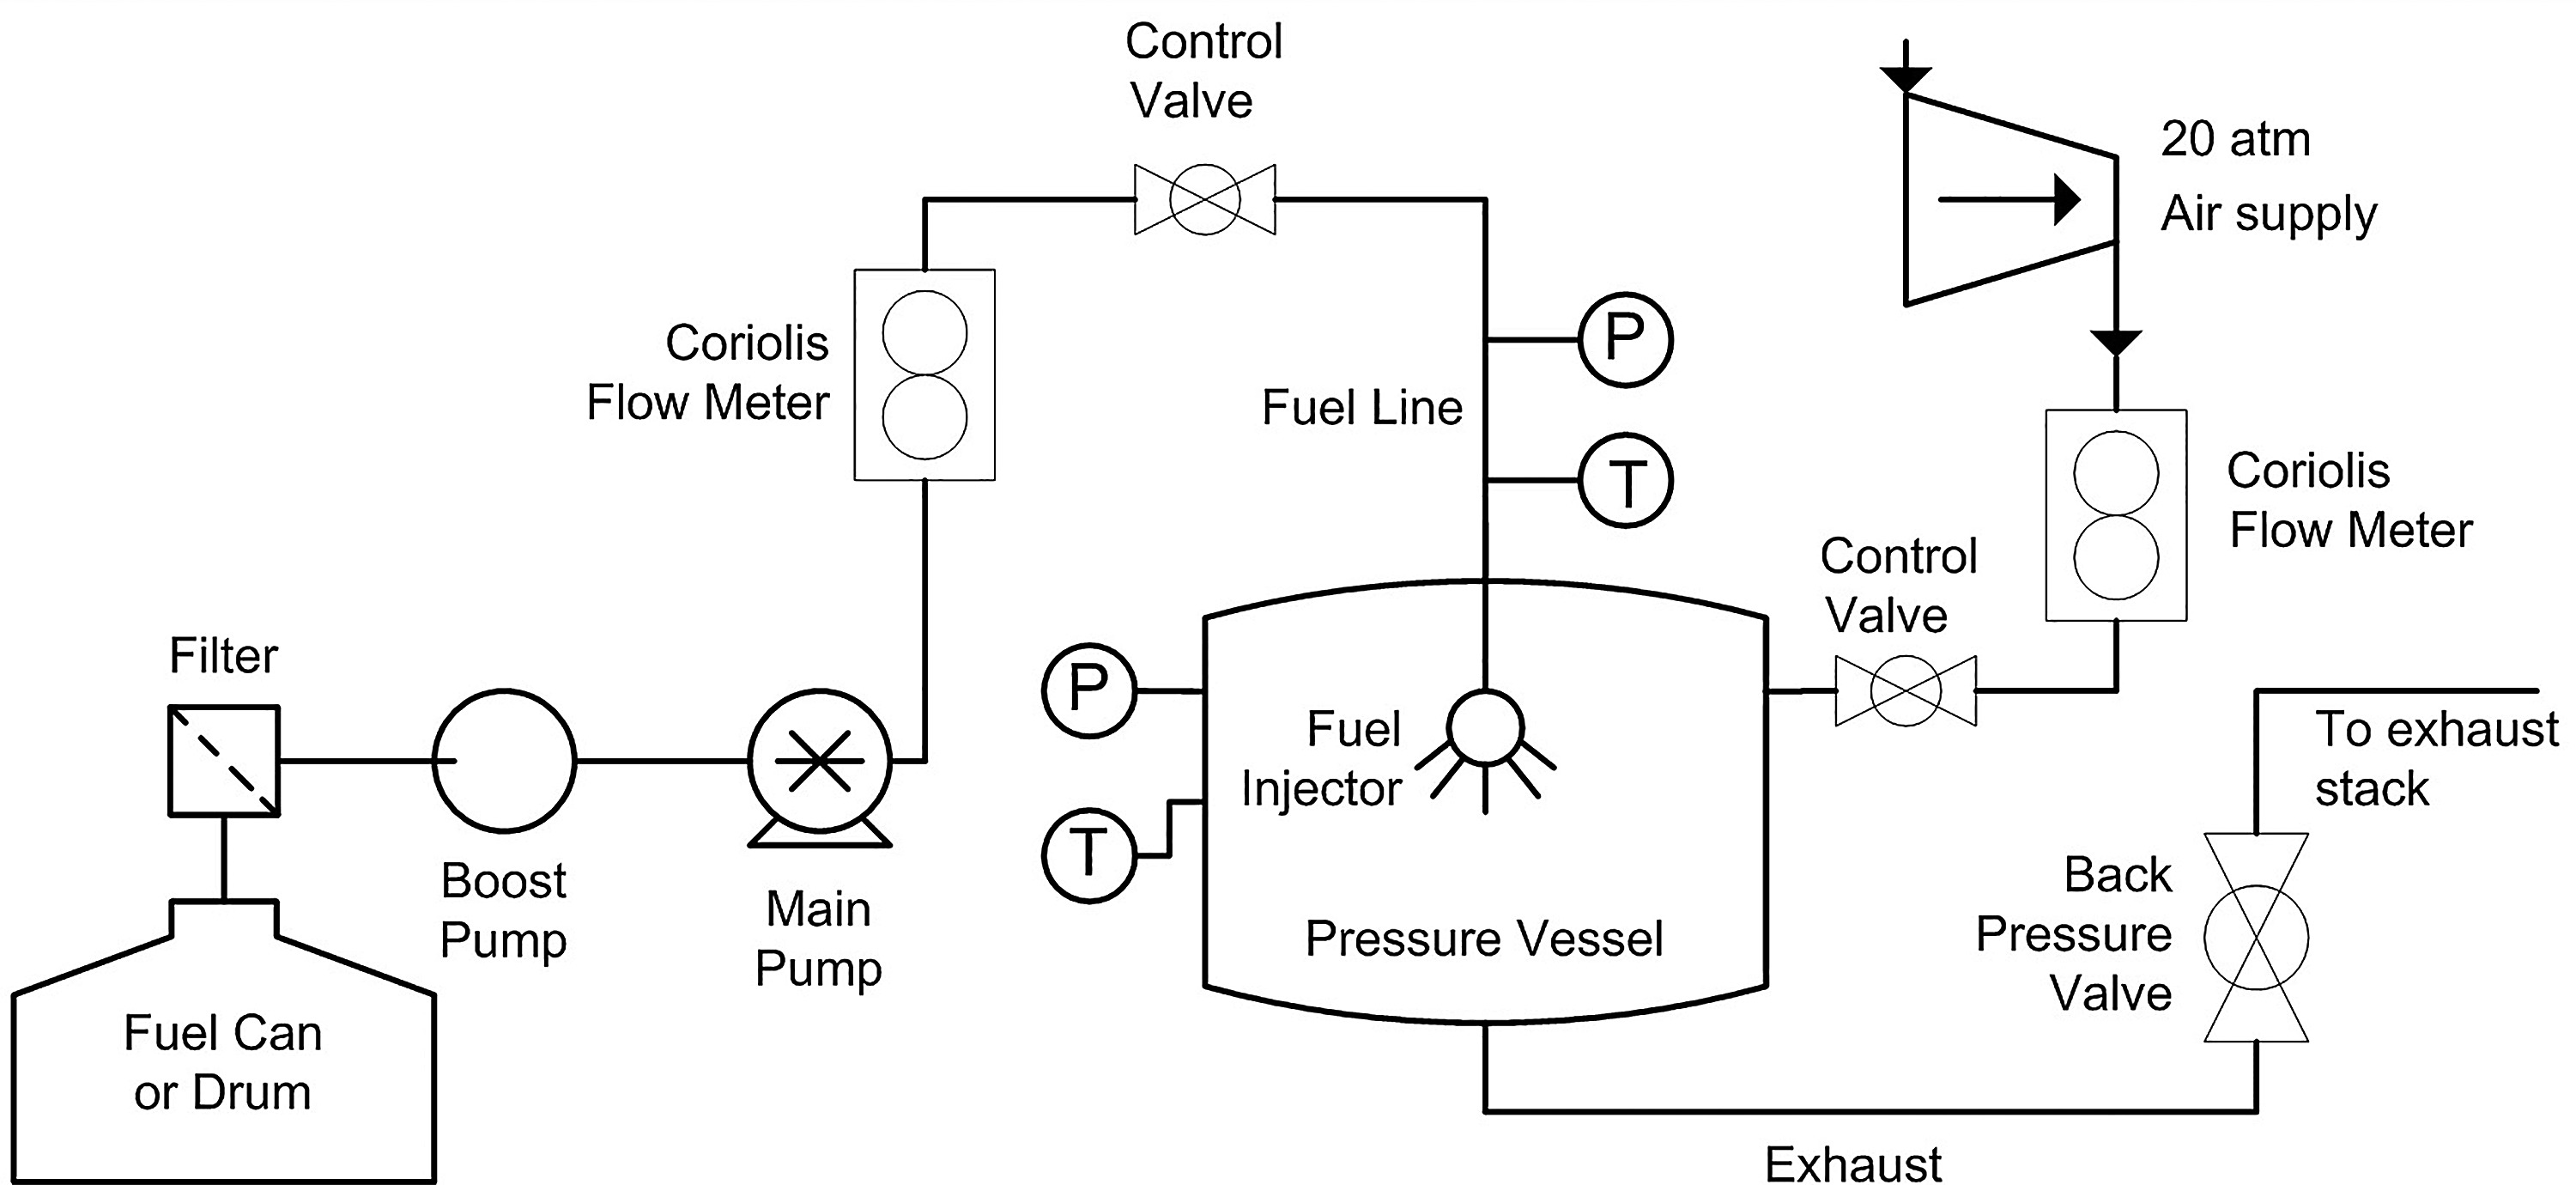
All testing was completed in the National Research Council of Canada's (NRC) High Pressure Spray Facility (HPSF) in Ottawa, Canada. This test rig consists of a pressure vessel with large optical access that can be used to study sprays over ambient pressure conditions ranging from near atmospheric to 20 bar(a). The piping and instrumentation diagram used for all tests is shown in Figure 2. Process control is achieved via Lookout software, while operating conditions are monitored and recorded using LabView software. Further details on the operation and capacity of this facility can be found in (Corber, 2007).
Optical diagnostics
In order to assess the capability of the SLIPI based LIF/Mie ratio-metric method to provide robust and quantitative droplet sizing data, experiments were carried out on sprays over a range of liquid flows and ambient pressures using both conventional and alternative fuels as well as a calibration fluid as shown in Table 1. Conventional laser sheet images were collected to help visualize global spray features as well as to offer a comparison to the SLIPI images. PDA measurements were made at selected points in order to calibrate the SLIPI images and obtain SMD maps of the sprays.
Table 1.
Test fluid properties.
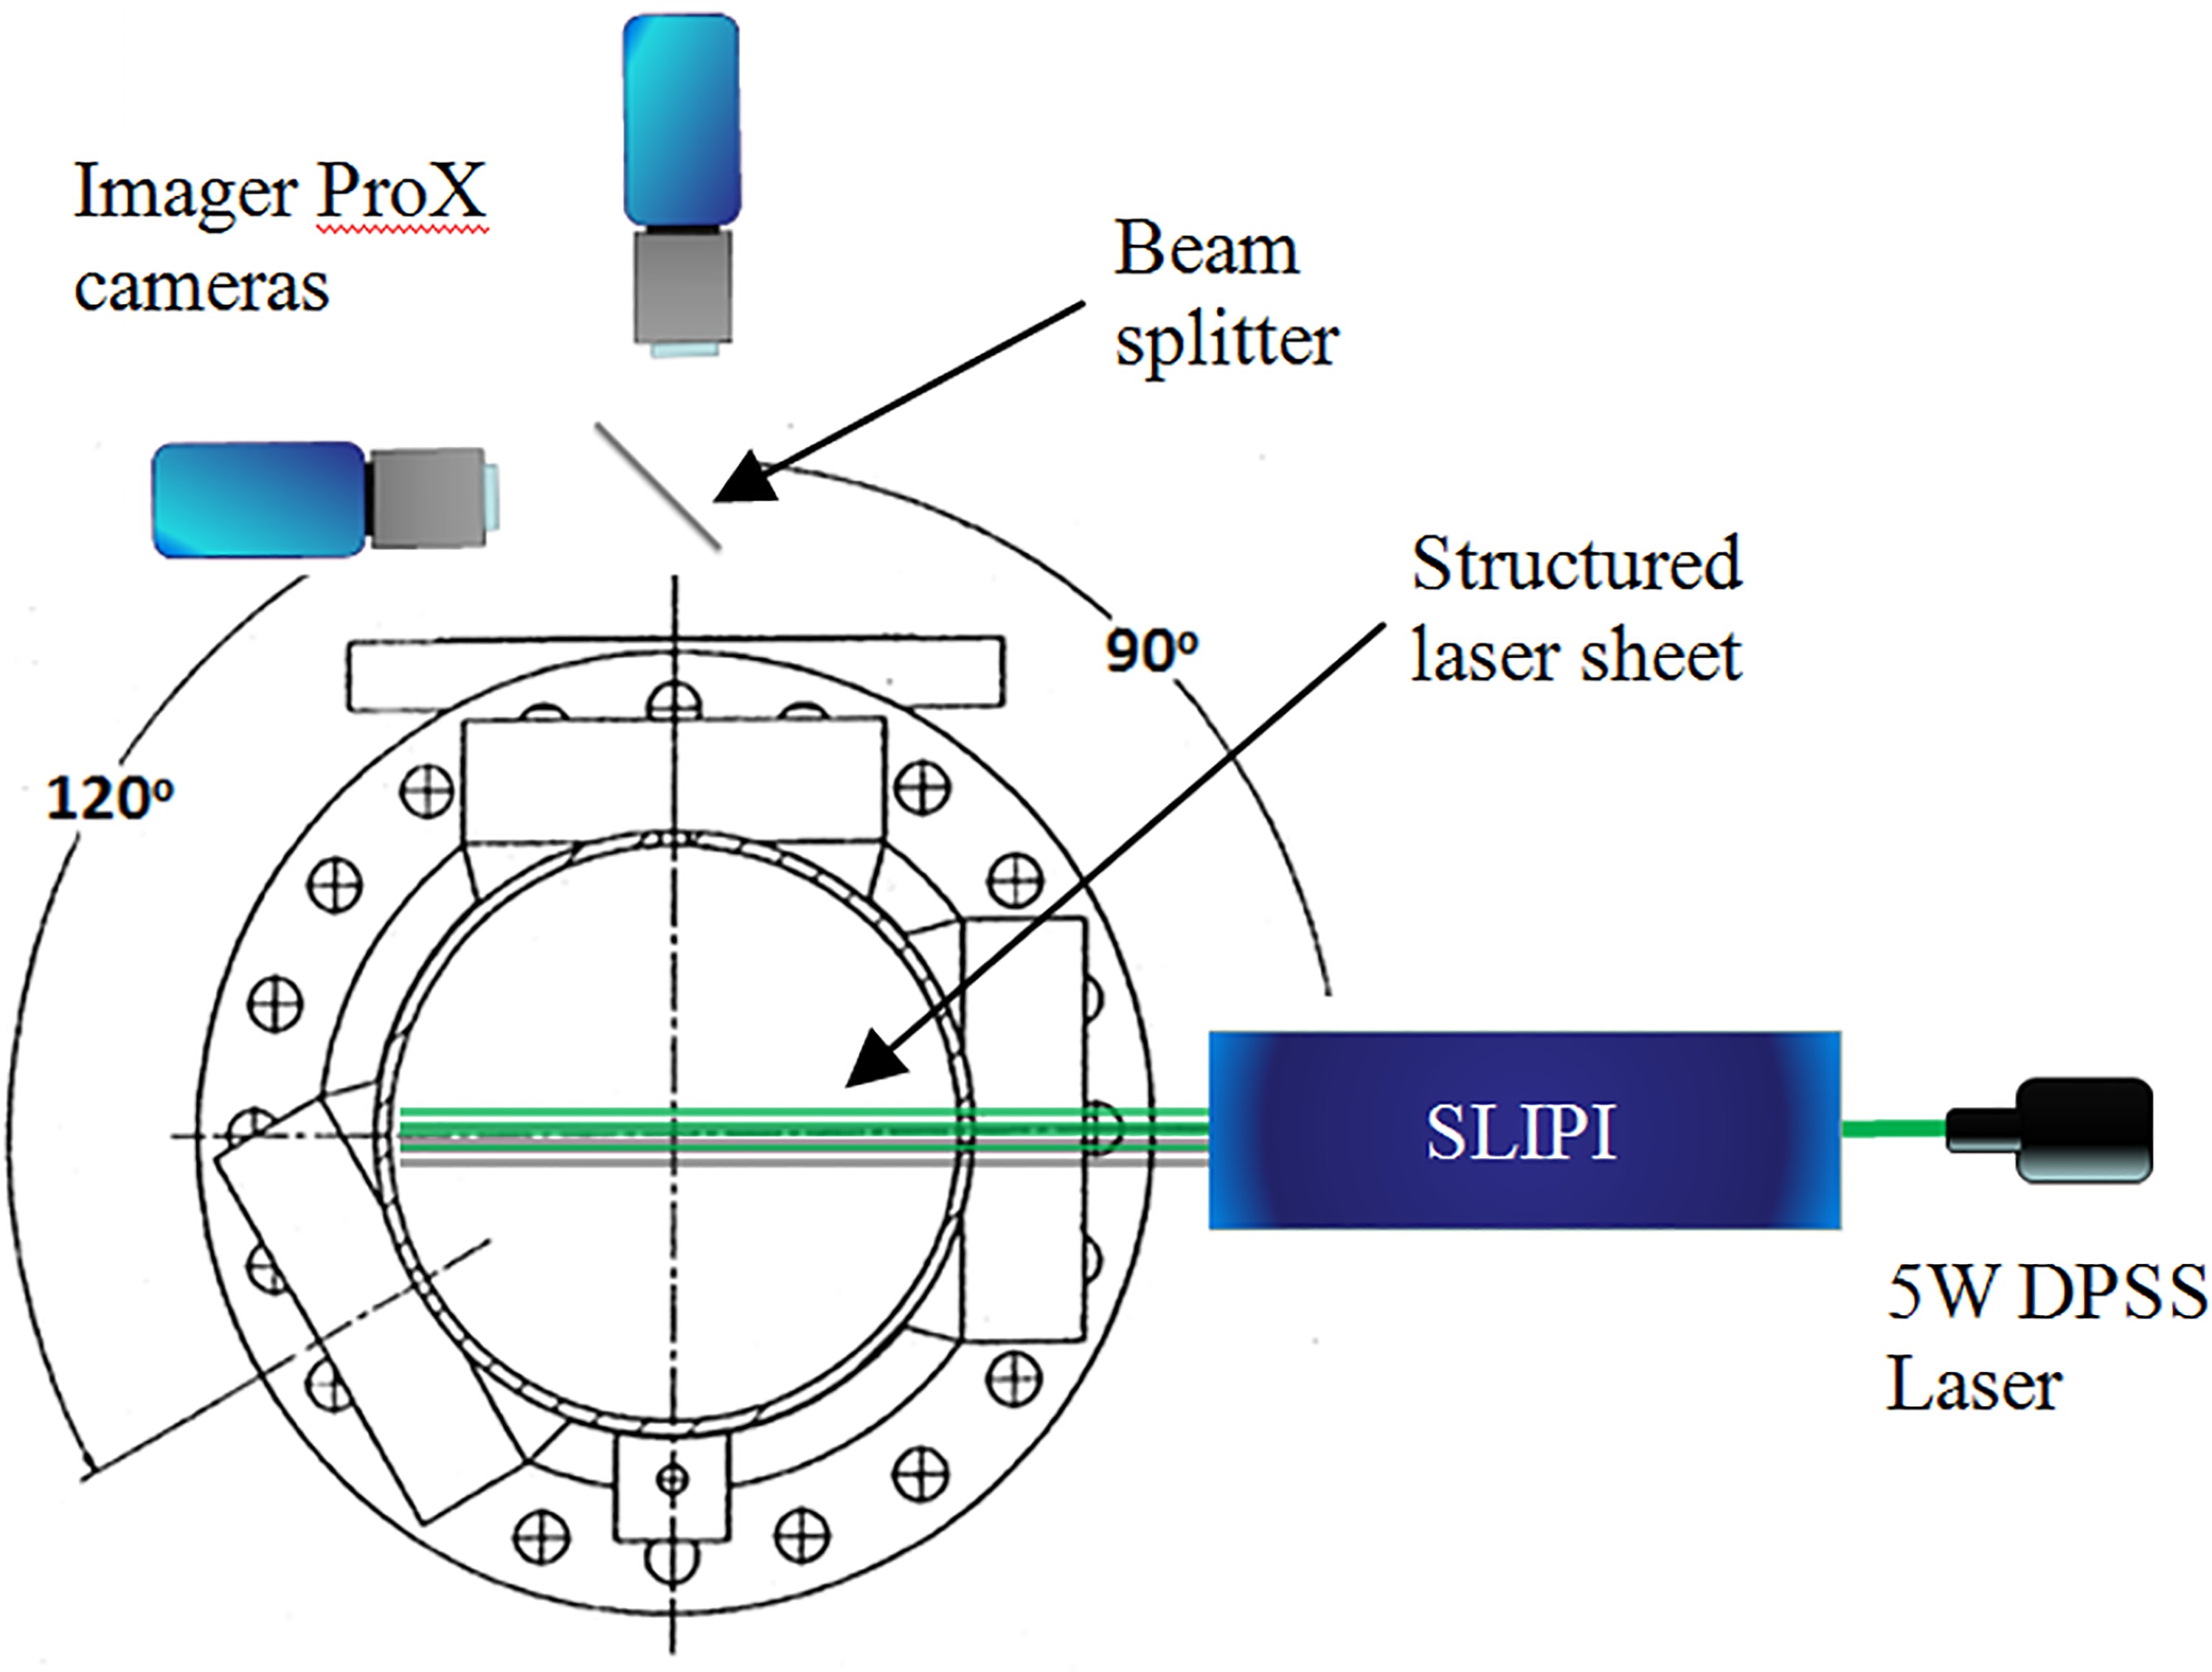
The conventional laser sheet imaging instrumentation employed a 5W DPSS laser, manufactured by UltraLasers, as the light source. It operates at 532 nm and was equipped with sheet forming optics. A Cannon 5D Mark II digital SLR, equipped with a Canon 24–105 f4.0 L-series lens, was used to capture the images. The ratio-metric imaging technique involves doping the fuel with a fluorescing dye, and illuminating the spray with a laser sheet. Two images of the spray are then collected simultaneously, with one of the cameras using a filter to collect the LIF signal, and the other the Mie signal. These two images are then combined to give the LIF/Mie ratio which is nominally proportional to SMD. A more detailed explanation of the technique can be found in (Mishra et al., 2015). The system used to capture LIF/Mie images uses the same laser as the conventional imaging that is then modulated using a universal grating based structured laser illumination planar imaging optics module manufactured by LaVision Inc. Two LaVision Imager ProX cameras controlled by a programmable timing unit are used to capture pictures of the spray. The system was set up to only view half the spray, which allowed for a greater vertical field of view, while still optimizing the resolution of the camera's chip. The configuration is shown in Figure 3.
For conventional drop sizing and velocity measurements, a commercial Phase Doppler Particle Analyzer (PDPA), manufactured by TSI Inc. was used in this study. The system consists of a TM250 transmitter, equipped with a beam expander and a 500 mm lens. This results in a velocity range of −225 m/s to 1,125 m/s. The receiver, model number RV2100, was orientated in the 30 degree forward-scatter configuration. Using this optical path, the PDPA can measure particle diameters from approximately 1–266 µm.
Fuel nozzle
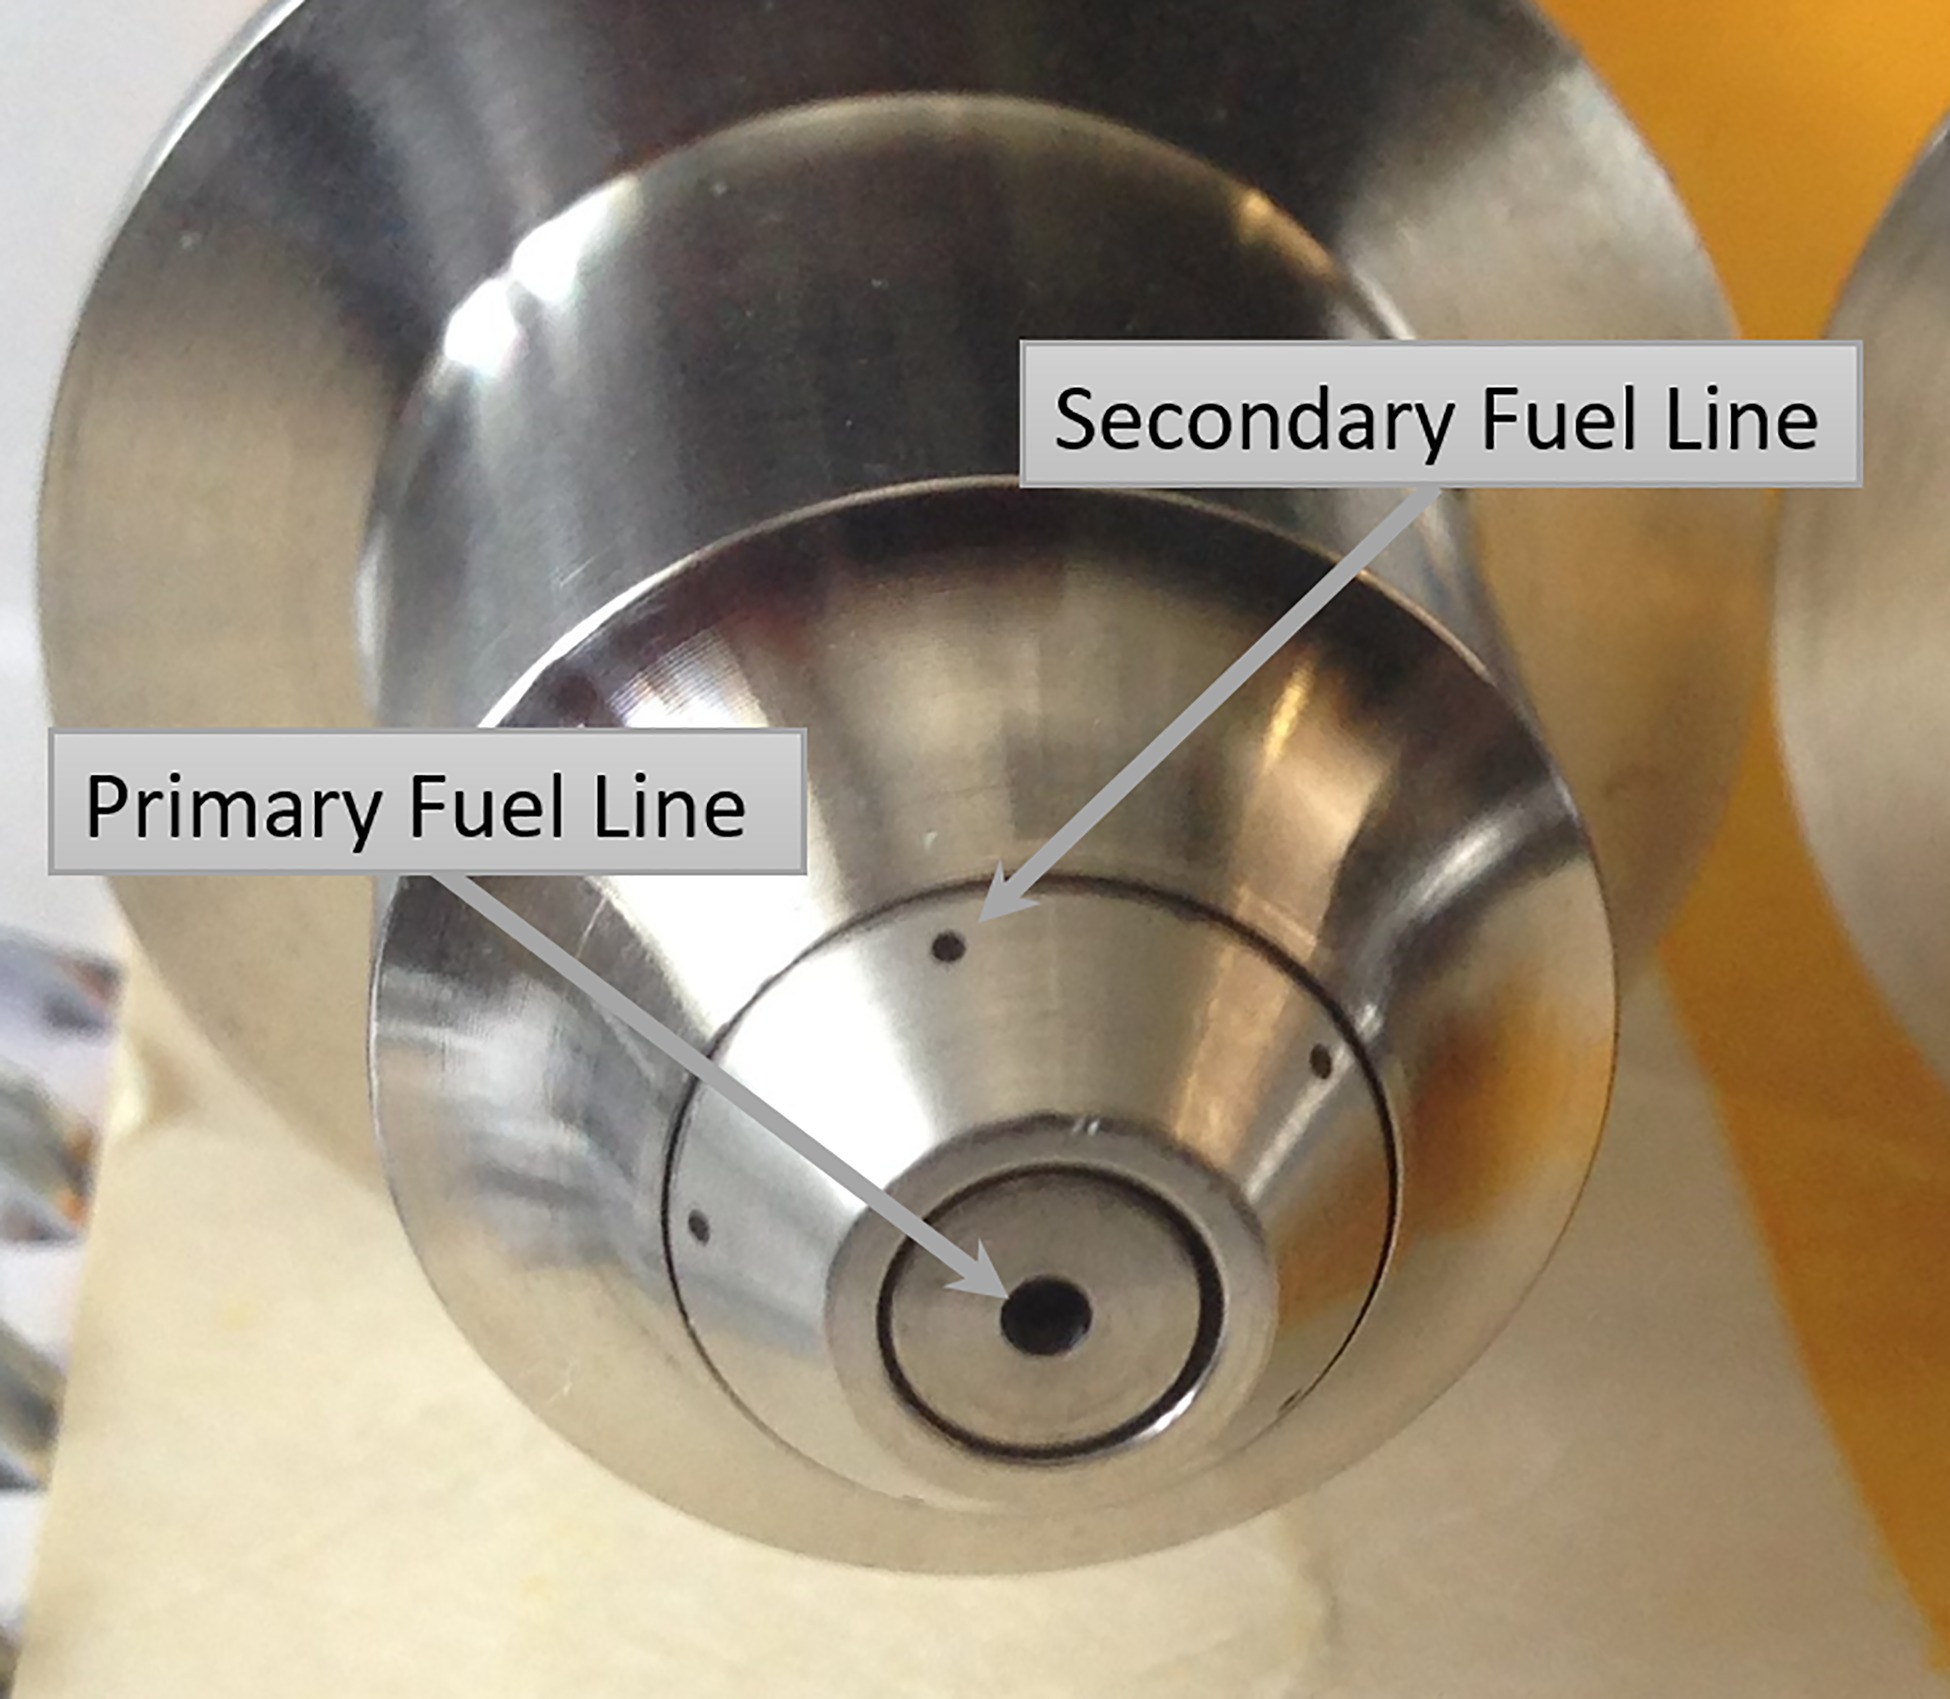
All testing was conducting using an aero-engine derived fuel injector. A photograph of the nozzle is shown in Figure 4. For the results reported here, only the pilot fuel line was used, which is a simple-orifice type pressure atomizer. It has a flow number (FN) of 0.2 g/s/kPa1/2 and produces a hollow cone spray. For further details on the design and operation of the fuel injector see (Corber et al., 2018).
Test liquids
Three test liquids were employed in this study. A brief summary of their distinguishing features is shown in Table 1. These fluids were selected for their range of physical properties, as well as represent separate categories: calibration fluid, conventional jet fuel, and alternative jet fuel respectively.
Test matrix
The complete test matrix for the experimental campaign is shown in Table 2. It is derived from the test points provided by the National Jet Fuel Combustion Program (NJFCP), more details of which can be found in (Colket et al., 2017). It has been expanded slightly to cover a wider range of flows than those used in previous work (Corber et al., 2018) so that the application of the SLIPI LIF/Mie method can be tested over a greater variety of spray shapes, sizes, and droplet diameters. All three fluids were tested at these operating conditions.
Table 2.
Test matrix.
Results and discussion
Due to space limitations, the presented results will focus on a limited number of test cases. Specifically, these include data for the A-2 and C-3 fuels at a flow rate of 5 g/s, at a rig operating pressures of 3.4 atm and 10 atm.
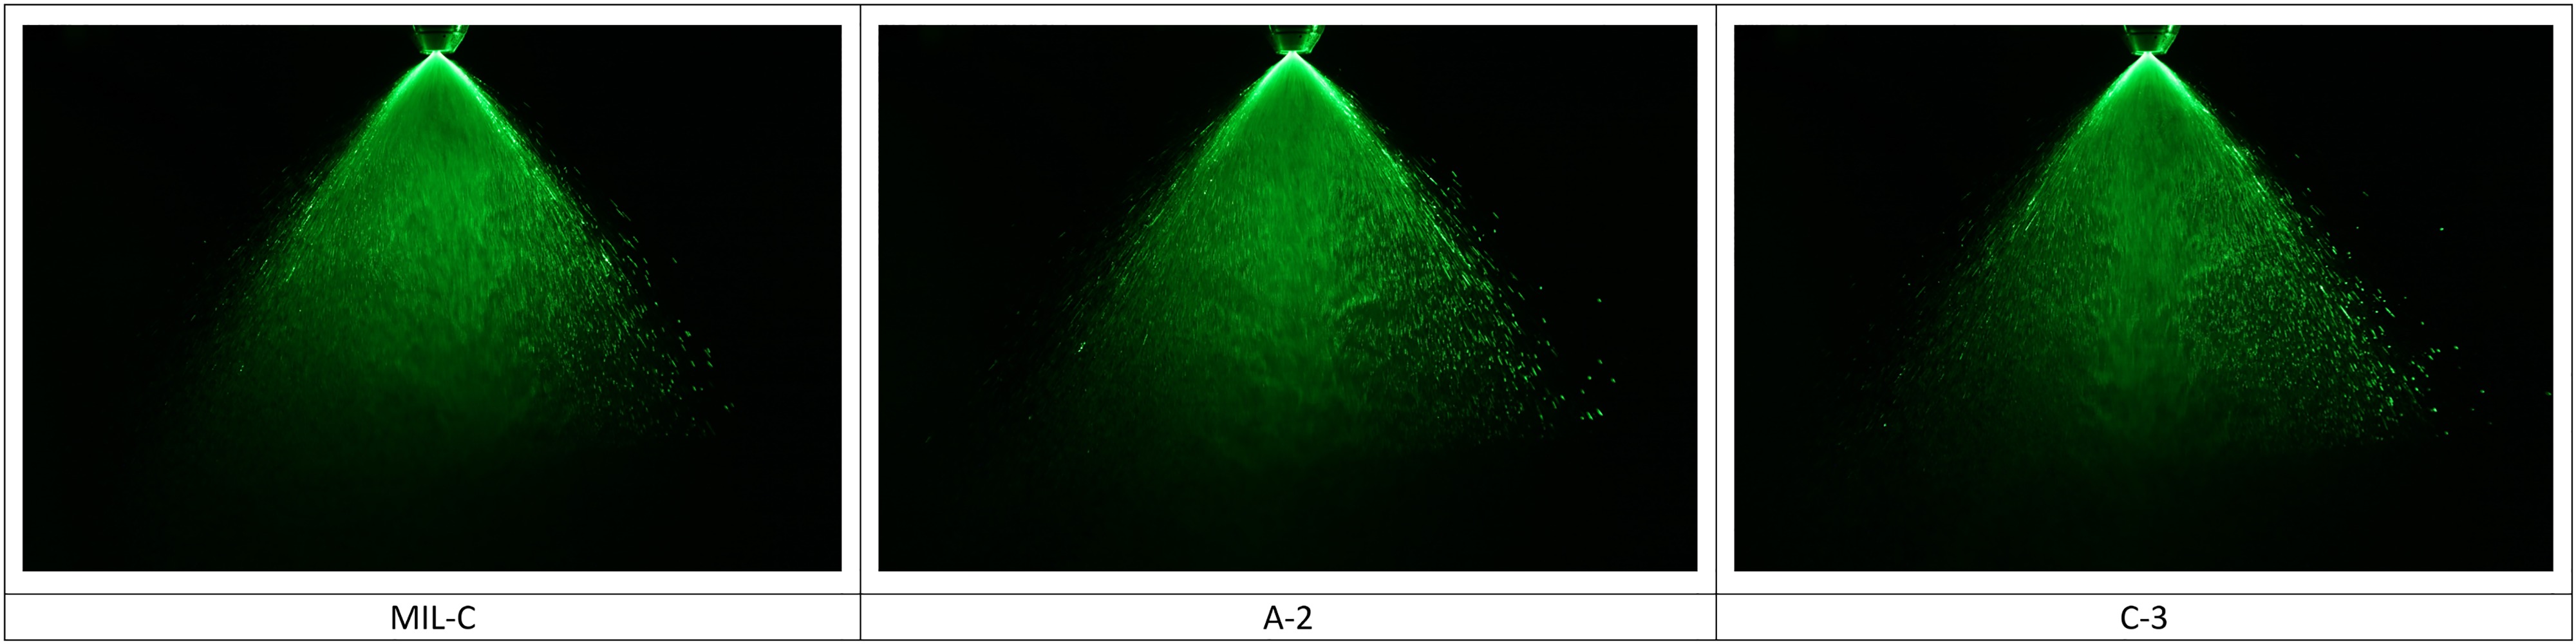
Conventional laser sheet imaging - results
A sample of the conventional laser sheet images collected is shown in Figures 5 and 6. These pictures offer qualitative details with regard to the spray's overall features such as cone angle and quality of atomization. Details with regard to the spray's interior structures, such as if the spray is a solid or hollow cone, cannot be determined from these images. At the operating conditions presented, very little difference is observed between the various fuels. This is consistent with data found in the litterature for this type of injector (Lefebvre and McDonell, 2017). The results demonstrate that the spray changes significantly with rig operating pressure. As the ambient pressure increases the spray's cone angle collapses, resulting in a much narrower spray.

Phase doppler anemometry results
Sample sets of PDPA data showing the radial distribution of droplet SMD for two test fuels at two axial locations downstream of the injector are given in Figures 7 and 8. During commissioning of the experimental setup, data points were taken across the entire width of the spray, and the measured droplet sizes were found to be symmetric about the centreline. Subsequent tests were then reduced to sampling on only half of the spray to lessen time and cost.
Figure 7.
Droplet SMD measured by PDA at 25.4 mm from the nozzle face for MIL-C, A-2 and C-3, where the filled and un-filled symbols represent the 10 atm and 3.4 atm conditions respectively. Fuel mass flow 5 g/s.

Figure 8.
Droplet SMD measured by PDA at 50.4 mm from the nozzle face for MIL-C, A-2 and C-3, where the filled and un-filled symbols represent the 10 atm and 3.4 atm conditions respectively. Fuel mass flow 5 g/s.

The PDPA was set up to collect 50,000 samples per point. A validation rate of 90% was achieved for the majority of cases, resulting in 45,000 valid droplet samples at each radial location.
The PDPA data qualitatively agree with the laser sheet images, indicating that a higher ambient pressure results in narrow sprays. It also indicates that the lower viscosity fuel, A-2, atomizes better (smaller droplets) than the higher viscosity C-3 fuel. This difference in atomization was however found to diminish at higher ambient pressures for the injector used in the investigation. Additionally, these plots indicate that the droplets size increases with increased ambient pressure as well as with increased axial position. These results agree well with those found in the literature (McDonell et al., 1994).
SLIPI ratio-metric images results
Figure 9a shows the typical resulting image generated by the SLIPI LIF/Mie ratio-technique. It is the result of the combination of 150 Mie and 150 LIF SLIPI images. The normalized counts displayed in the figure are effectively the pixel-by-pixel ratio of the LIF and Mie images. Provided the fluorescing dye is evenly distributed throughout the liquid, the LIF signal is roughly proportional to the droplet volume. Since the Mie signal is roughly proportional to the droplet surface area, higher counts indicate areas in the spray with larger droplets (i.e. larger volume to surface area). Based on the work of (Mishra et al., 2015), the LIF/Mie ratio pixel count should correspond to a discreet SMD anywhere in the image. However, the count value itself is dependent on a number of parameters including, but not limited to, laser power, camera exposure time, particle number density, dye concentration, as well as the image processing methods. As a result, the absolute value of the pixel count is arbitrary, so in order to compare one ratio-metric image to another, pixel counts should be normalized. These normalized pixel counts cannot be used to determine droplet size directly, so in order to convert the image into a map of the droplet sizes an in-situ calibration is required to convert the intensity ratios to SMD's. The droplet size data collected by PDA was used to accomplish this, with the white dots in Figure 9b showing the corresponding location of those measurements.
Figure 9.
Uncalibrated SLIPI LIF/Mie ratio-metric image of C-3 spray with geometric scale. Fuel flow 5 g/s, P3 = 10 atm. (a) Raw image. (b) Post processed image with location of PDPA data.
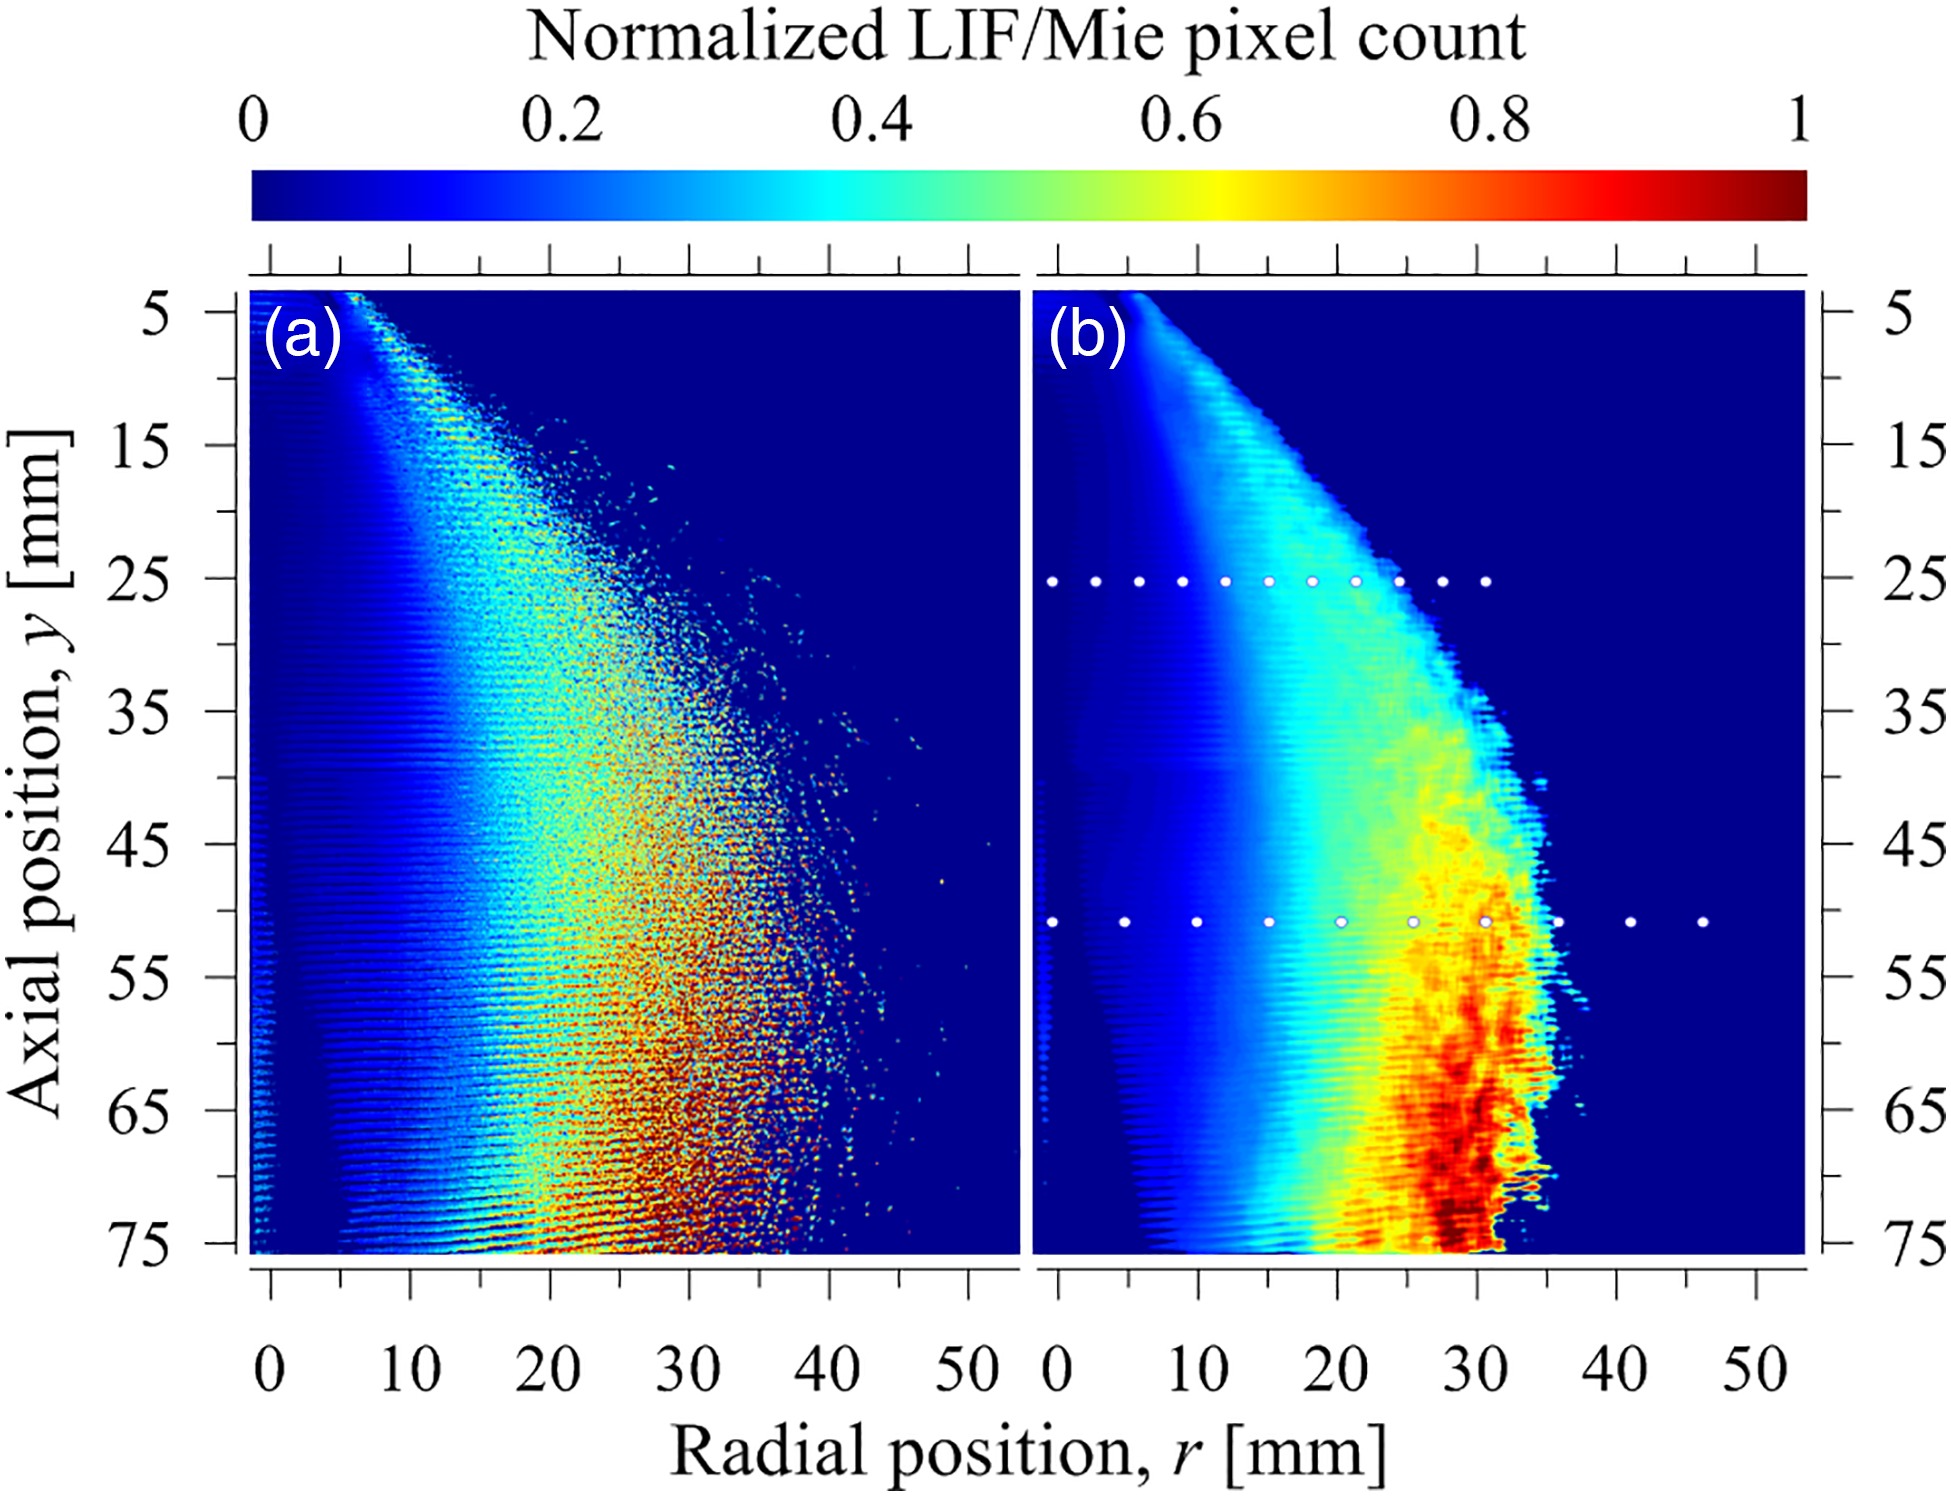
This technique does require a limited amount of image post processing. In order to reduce residual noise, a 20 × 20 pixel median filter, equivalent to 1 mm × 1 mm area in the flow, was applied to the images. Figure 9b shows a resulting post processed image.
PDA data was collected at two or more axial locations in the spray to determine the robustness of the calibration within a single image. This was also done to help determine if the location of the calibration measurements affects the SMD to pixel count calibration curve. To determine the consistency of the calibration across operating conditions and test fuels, calibration curves have been generated for MIL-C, A-2 and C-3 at two rig operating pressures for a liquid flow rate of 5 g/s. The results are shown in Figure 10.
Figure 10.
Calibration curves for MIL-C, A-2, C-3 LIF/Mie ratio-metric images at P3 = 3.4 atm and 10 atm. Fuel mass flow 5 g/s.
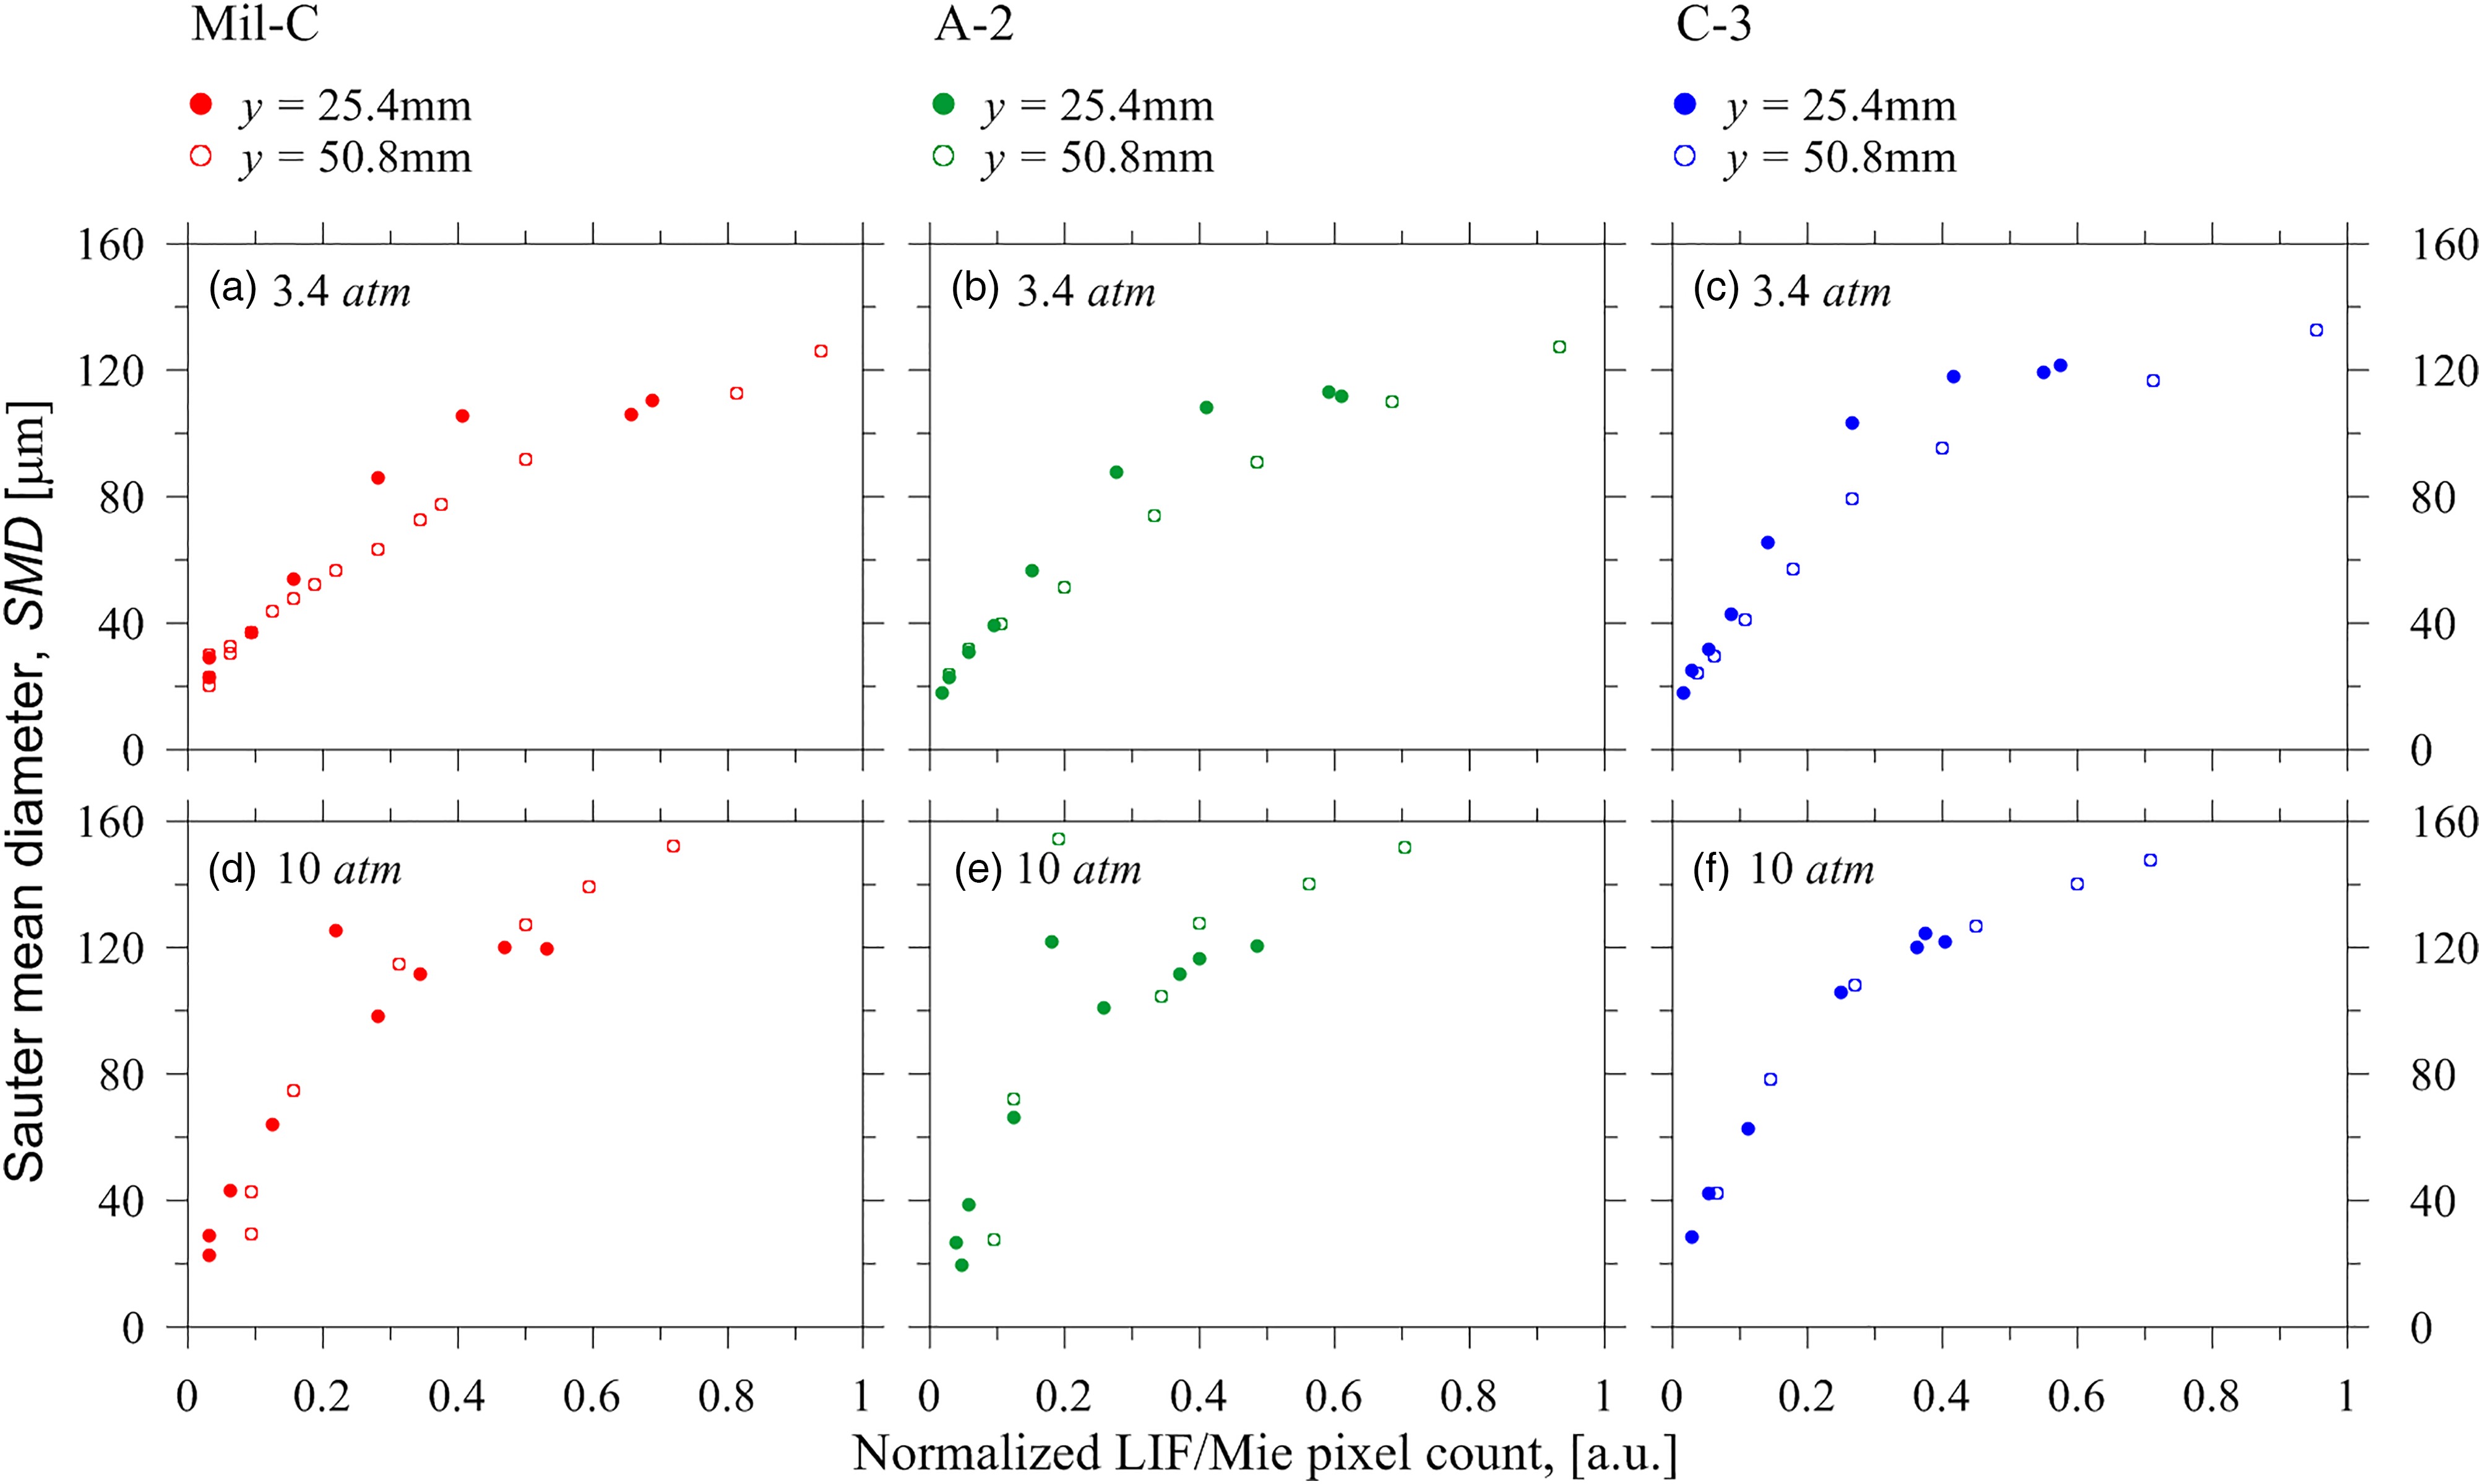
Figure 10 shows the overall shape of the calibration curves to be consistent across all cases. At the 10 atm condition the calibration curves generated from the PDA data at 25.4 mm and 50.8 mm planes correlate closely, while for the 3.4 atm condition, the correlation between the two axial planes is not as high. Of all cases shown, the C-3 fuel at 10 atm offers the best results, with a nearly identical pixel count to SMD curve. There are several factors that help explain this. Based on the PDA data, the C-3 fuel at the 10 atm condition produces the spray with widest range of droplet sizes. As a result, this offers the largest calibration range, helping to reduce uncertainty. In addition, these larger droplets fluoresce and scatter the light with greater intensity. This leads to superior signal to noise ratios which also assists in improving the accuracy.
In order to determine the exact mechanisms causing the difference between the upper and lower planes for the 3.4 atm condition (i.e. Figure 10a–c) further investigation is required. A detailed examination into the sources of uncertainty, in conjunction with a statistical analysis for a large number of cases will need to be completed before conclusions can be drawn.
A second order exponential decay function was fit to relate pixel count to SMD in the LIF/Mie images. When applied to the image shown in Figure 9b, the result is a planar map of the droplet SMD's in the spray, and is shown in Figure 11. This plot is generated from a single calibration curve. It is observed to have the same overall trend as the PDPA data with larger droplets at the exterior of the spray, which increase in size as they travel downstream. Based on Figure 11, a single SLIPI LIF/Mie ratio-metric image can provide a spatially resolved droplet SMD's map. This is significant, since in order to produce the same chart, hundreds of PDA points and several hours of testing would be needed.
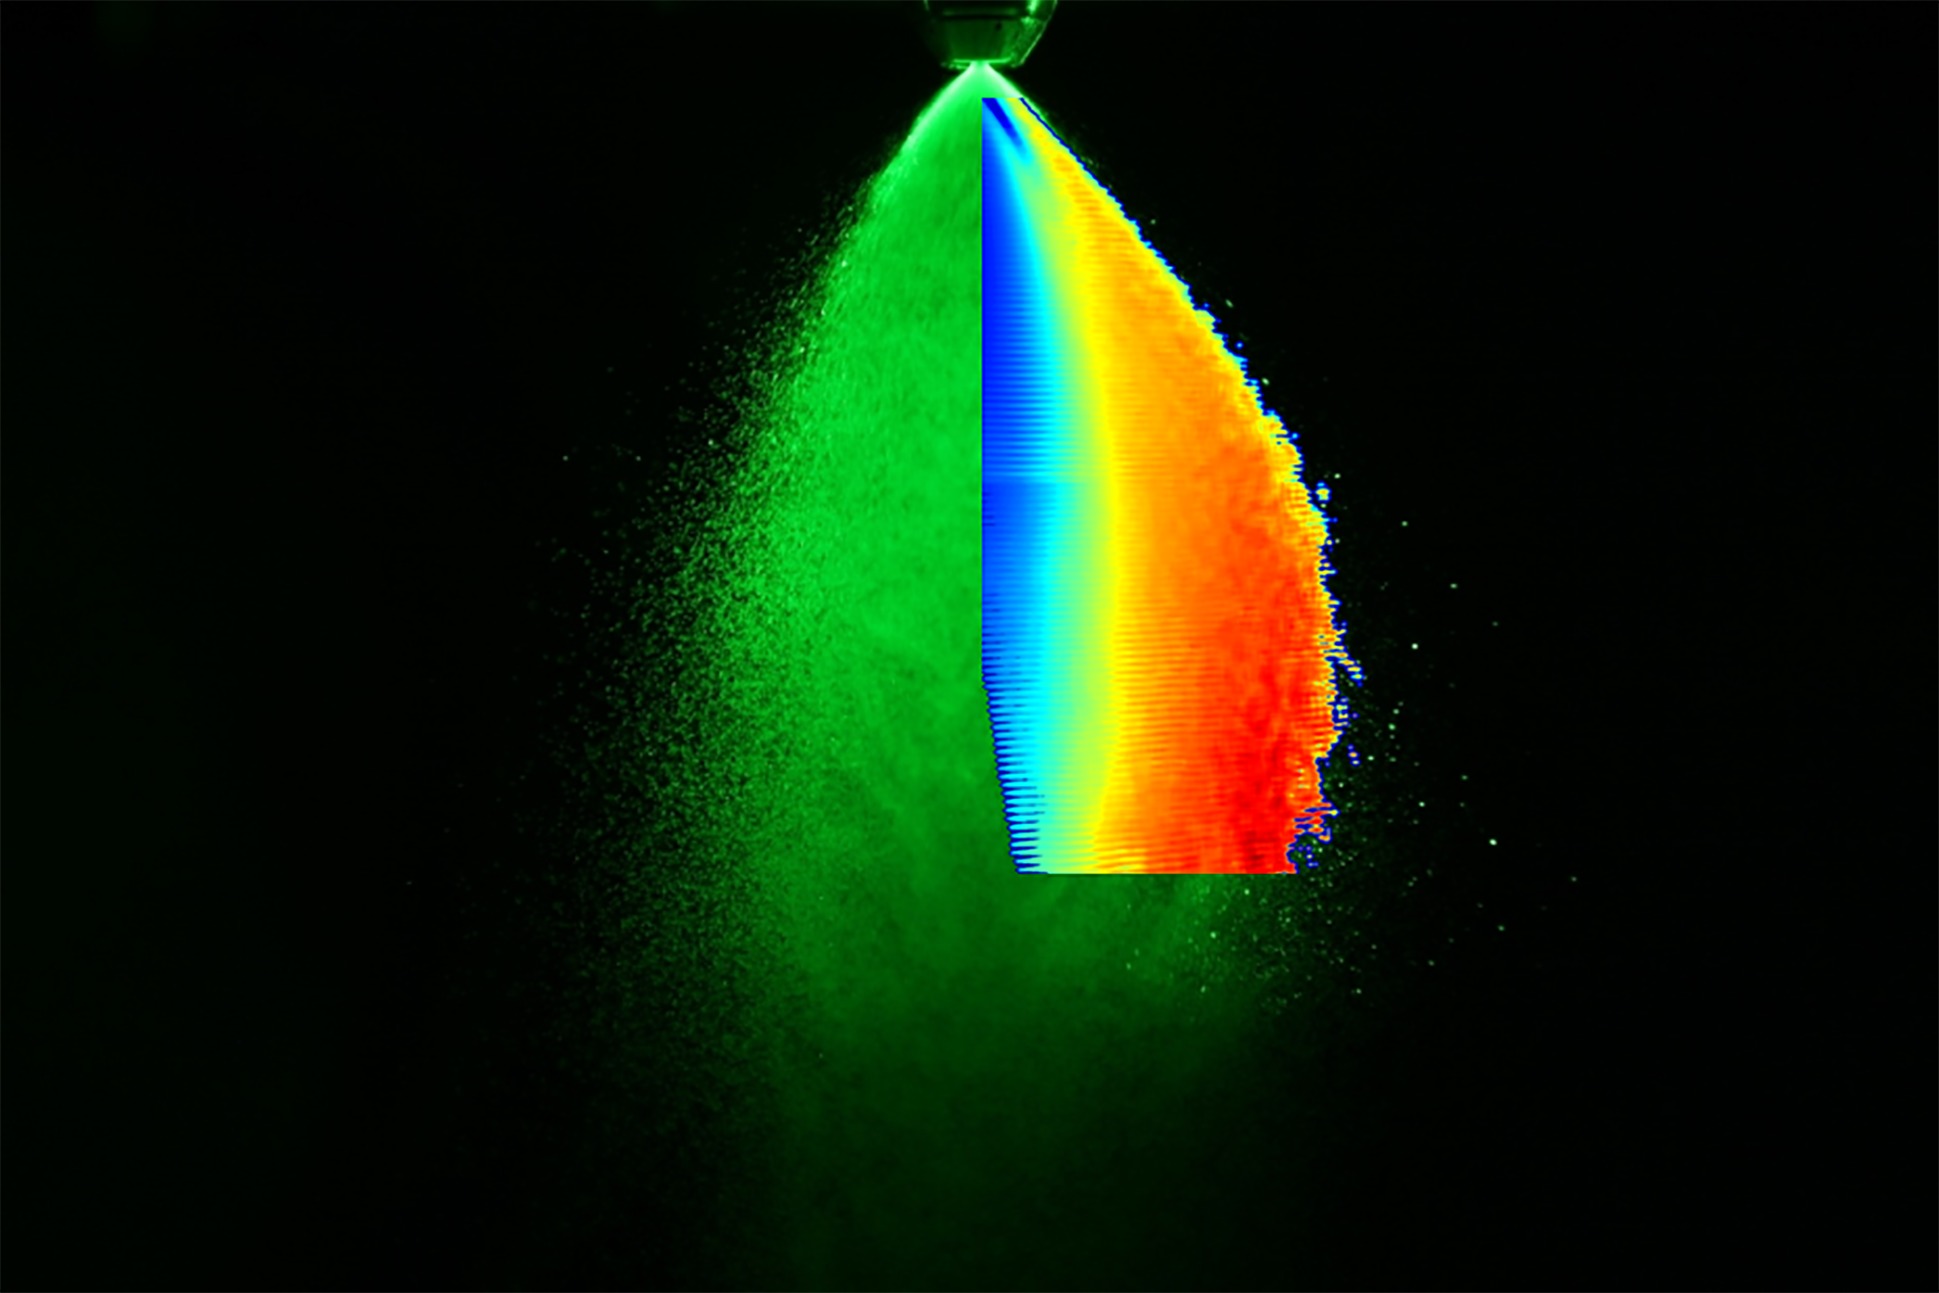
Figure 11.
Planar SMD map (Calibrated SLIPI LIF/Mie ratio-metric image) of C-3 spray. Fuel flow 5 g/s, P3 = 10 atm.
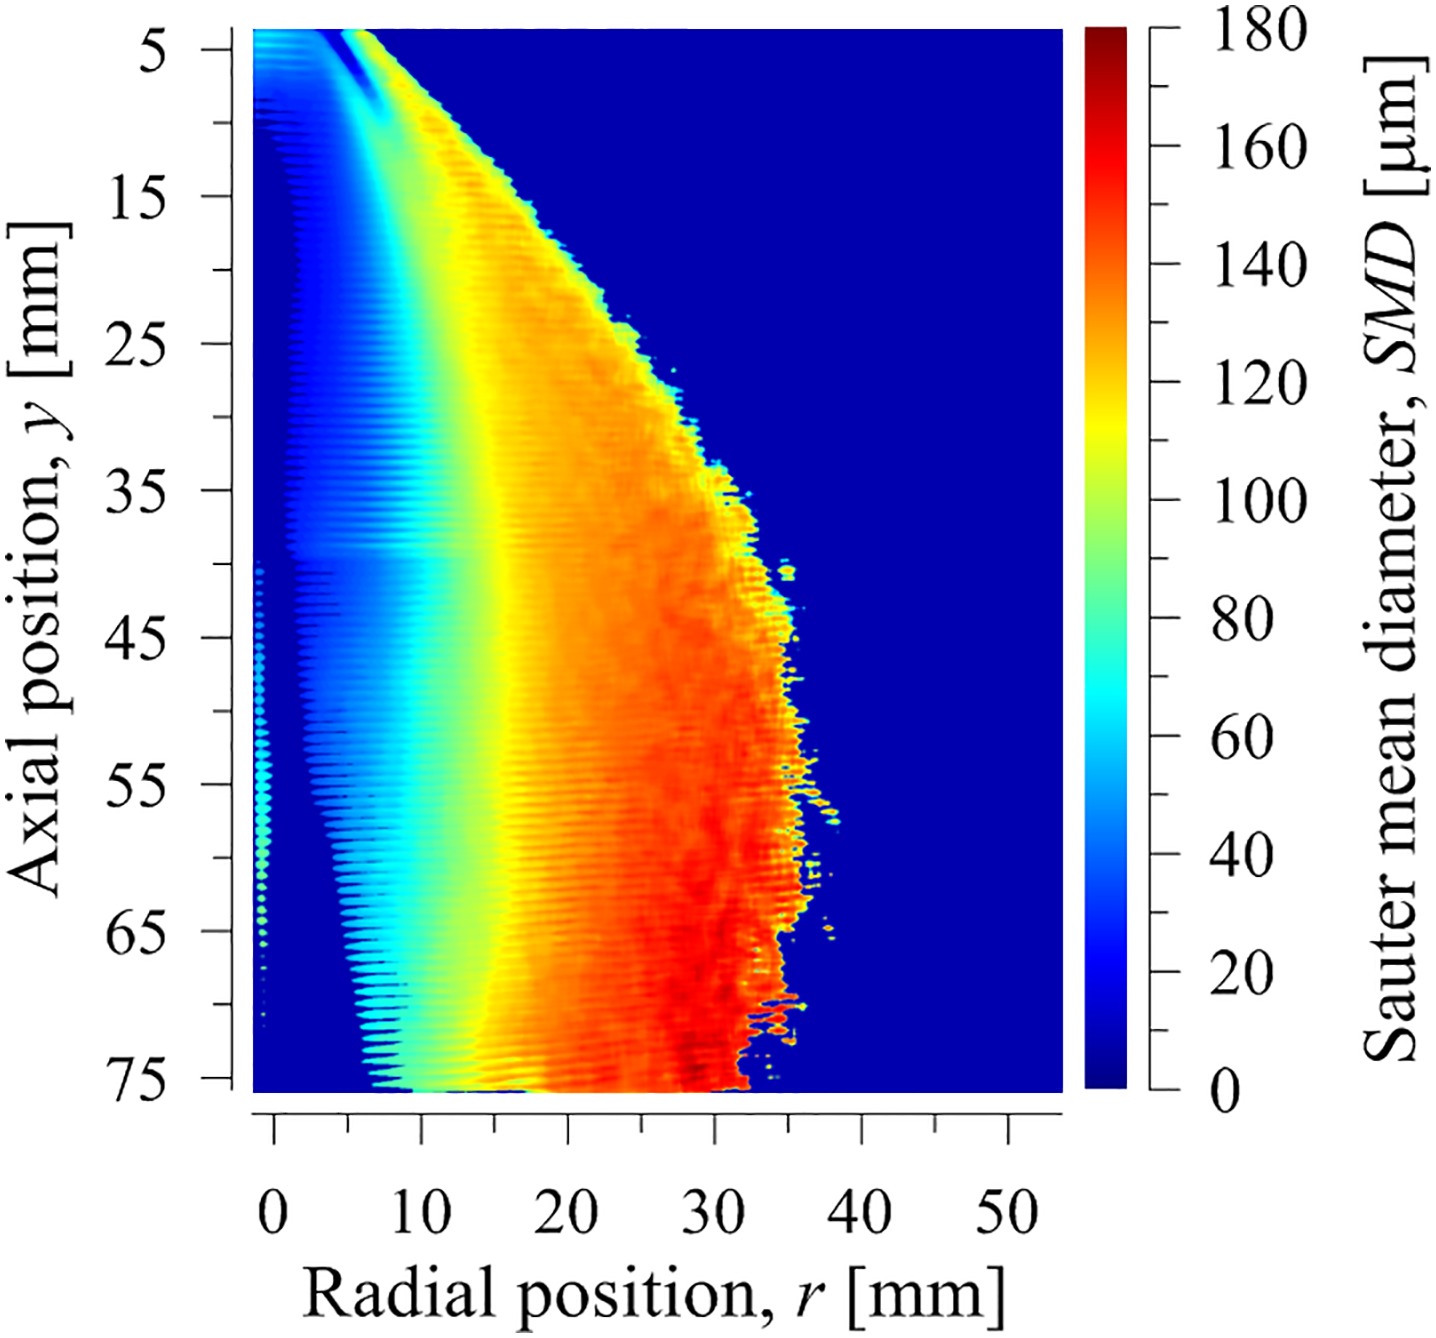
Figure 12 shows a comparison between a conventional laser sheet image, and a calibrated SLIPI ratio-metric image. While both offer details about the shape of the spray, there is significantly more information in the latter. The SLIPI demonstrates the hollow cone nature of the spray, as well as trends in droplet size. Even though a calibration may still be required in many applications to determine the exact SMD distribution, these results show a measurable gain in capability over conventional diagnostics.
Conclusions
An experimental investigation to assess the calibration of LIF/Mie ratio-metric imaging using a structured light source has been presented. Tests were conducted using a nozzle calibration fluid, a conventional jet fuel and an alternative jet fuel, over a range of ambient pressures between 1.1 and 10 atm. PDA was used to measure the size of the droplets in the spray at two axial planes. The PDA data was then used to calibrate the LIF/Mie intensity ratios in the SLIPI images. The resulting calibration curves were then compared to determine their consistency across a single image, as well as between operating conditions and test fluids. This comparison showed the best agreement was achieved at higher ambient pressures, with the high viscosity fuel offering the best precision. This is due to the higher viscosity fuel spray having the widest range of droplet sizes, which not only gives a wider calibration curve, but also results in better signal to noise ratios in the final image. The relatively poor agreement between the calibration curves at the lower operating pressure indicates the need for a comprehensive uncertainty assessment to determine the robustness of this method. This incongruity also shows the importance of collecting PDA calibration data at locations in the spray that offer as large a range of droplet sizes as possible. In order to determine those locations, it is recommended that for an experimental campaign in which ratio-metric images are to be calibrated, the LIF/Mie images should be collected first. This will allow the experimenter to determine where the small and large particles exist so that the PDA data points can be collected strategically. The results shown here indicate that a single calibration curve may have the potential to be applied across multiple test points, provided the droplet size range is large enough, and that the signal to noise ratios in the images are sufficiently high. This is noteworthy since it will allow for large amounts of spatially resolved SMD data to be collected from a limited amount of PDA points, greatly reducing the time and cost of testing.
Nomenclature
P3
test section pressure, kPa
ΔPf
differential fuel pressure, kPa
mf
mass flow of fuel, g/s
mw
mass flow of wash air, kg/s
CCD
Charged Couple Device
DPSS
Diode-pumped solid-state
FN
Flow Number
HPSF
High Pressure Spray Facility
NJFCP
National Jet Fuel Combustion Program
NRC
National Research Council
LIF
Laser Induced Fluorescence
PDA
Phase Doppler Anemometry
PDPA
Phase Doppler Particle Analyzer
PTU
Programmable Timing Unit
P&ID
Piping and Instrumentation Diagram
SLIPI
Structured Laser Illumination Planar Imaging
SMD
Sauter-Mean Diameter (D32), µm