
Introduction
Non-Newtonian fluids (NNF) are widespread in many industrial applications, such as in mining and food processes (Wilson et al., 2006; Praetorius and Schößer, 2017; Abulnaga, 2021). When high flow rates have to be guaranteed, centrifugal pumps are commonly installed. The choice of the appropriate pump for a pipeline or a plant is carried out based on the performances given by manufacturers, which are usually obtained with water. Consequently, when highly viscous or NNFs have to be managed the selection of the appropriate pump may be very challenging. Processing viscous fluids involves an increase in the expected friction losses (Gülich, 2003a, 2003b) to the point that huge performance drops and instability phenomena can also occur (Gülich, 1999). NNFs are usually considered high-viscous fluids that lead to the rise of degradation phenomena on the pump performance difficult to be modeled. As a result, to guarantee safe operations oversized pumps are commonly installed (Wilson et al., 2006).
In oil and gas applications, NNFs mostly consist of solid rock particles transported by water, e.g. kaolin or bentonite slurries, or crude oil, obtaining suspensions with shear-thinning behavior (Au and Leong, 2013; Ilyin and Strelets, 2018). Previous exper- imental investigations with shear-thinning slurries reported sudden head and efficiency drops at part load operations (Walker and Goulas, 1984; Occari et al., 2019; Zanini et al., 2023b). In addition, the flow rate of the best efficiency point (BEP) for viscous slurries can vary considerably with respect to the water one, as reported by Zanini et al. (2023a). Consequently, the working point should be set according to the mixture properties (rheology, solid content, etc …) to prevent excessive operating costs. Underes- timating the performance drop due to higher viscosity can also affect dramatically safety during operations and at the same time, high efficiencies must be guaranteed. Furlan et al. (2013) tested three paste slurries after having reduced the mixture gas content by purging air in an uncontrolled way before conducting tests with a centrifugal pump obtaining remarkable instabilities reduction. Recently, Zanini et al. (2023b) obtained huge head drops at part load operations with kaolin slurries. Tests were repeated after an air removal process and no more instabilities were detected suggesting that gas-locking phenomena were responsible for the detected drops in performance. However, the mechanisms that guide this phenomenon are still not fully understood. To predict the pump performance with high-viscous Newtonian fluids, several models were developed in the last century like the widespread Hydraulic Insitute method ANSI-HI 9.6. 7-2010 (2010) and the KSB method Holzenberger and Jung (1990). Several authors employed the HI institute method to predict the pump performance with non-Newtonian fluids (Kabamba, 2006; Kalombo et al., 2014; Buratto et al., 2017) or the KSB method (Li, 2000; Paternost et al., 2015) obtaining contrasting results. Since a lack of generality emerges from previous works from the literature, experimental tests are still fundamental to obtaining useful information about instability phenomena that can arise with NNFs.
In this work, an experimental investigation of the pump performance with shear-thinning fluids is carried out. Three solid concentrations of carboxymethylcellulose mixtures (CMC) are considered and the resulting performance is compared with the water baseline for two pump speeds. CMC is industrially relevant for many sectors such as biomedical, pharmaceutical, textile, con- struction, food, plastics, cosmetics, paper, and oil industries (Rahman et al., 2021). The choice of the testing fluid is also due to its transparency which allows the detection of possible trapped air bubbles. The derating method proposed by Walker and Goulas (1984) is also considered and the predicted performance are compared with the experimental results to test the model's reliability. Finally, a critical analysis of the performance results related to the effect of trapped air is presented. In this light, the present work aims to extend the knowledge of the detrimental effects that can occur in pumping shear-thinning fluids. In addition, useful data for future numerical validations and analytical performance models of centrifugal pumps handling shear-thinning fluids are provided.
Derating methods
Higher viscosity can lead to remarkable reductions in centrifugal pump performance (e.g., drops in pump head and efficiency) due to the increasing friction losses. Several reliable methods to predict the pump performance with high-viscous Newtonian fluids can be found in the literature (Holzenberger and Jung, 1990; ANSI-HI 9.6. 7-2010, 2010; Ofuchi et al., 2020). These meth- ods aim to predict the viscous performance in terms of volumetric flow rate (Q), head (H), and efficiency (η), starting from the performance obtained with water. The viscous performance can be derived using correction factors, which are usually defined as follows:
where the subscripts w and v refer to the water and the viscous performance respectively. These coefficients can be calculated according to the specific derating model. Here, the formulation proposed by the Hydraulic Institute ANSI-HI 9.6. 7-2010 (2010) is adopted. Each coefficient can be obtained from the calculation of the B parameter, which is a function of the performance at the best efficiency point (BEP) with water, the kinematic viscosity of the viscous fluid (νv), and the rotational speed of the pump (N), as reported in Equation (2).
Finally, the correction factors for the volumetric flow rate, head and efficiency can be obtained respectively by Equations 3–5.
Many authors from the literature tried to use the HI method to predict the pump performance with non-Newtonian fluids (NNF) employing a representative value of viscosity (Walker and Goulas, 1984; Kalombo et al., 2014; Buratto et al., 2017). Since the viscosity of an NNF varies with the imposed stress, defining a proper viscosity for the calculation of the derating coefficients may be very challenging. Walker and Goulas (1984) proposed to model the viscous fluid as a Bingham plastic. The value of the plastic viscosity, which is the gradient of the rheogram at high shear rates, is considered an effective viscosity ignoring the role of the Bingham yield stress. The plastic viscosity employed in the HI method is calculated at the highest shear rate tested during the rheological characterization of the fluid.
Experimental campaign
The main characteristics of the test facility and the experimental campaign are presented in this section. Water and three CMC mixtures of 0.5, 1, and 1.5 wt.% respectively are tested with a small commercial centrifugal pump for two pump speeds, i.e. 1,500 and 2,000 rpm, on an on-purpose test bench.
Experimental apparatus
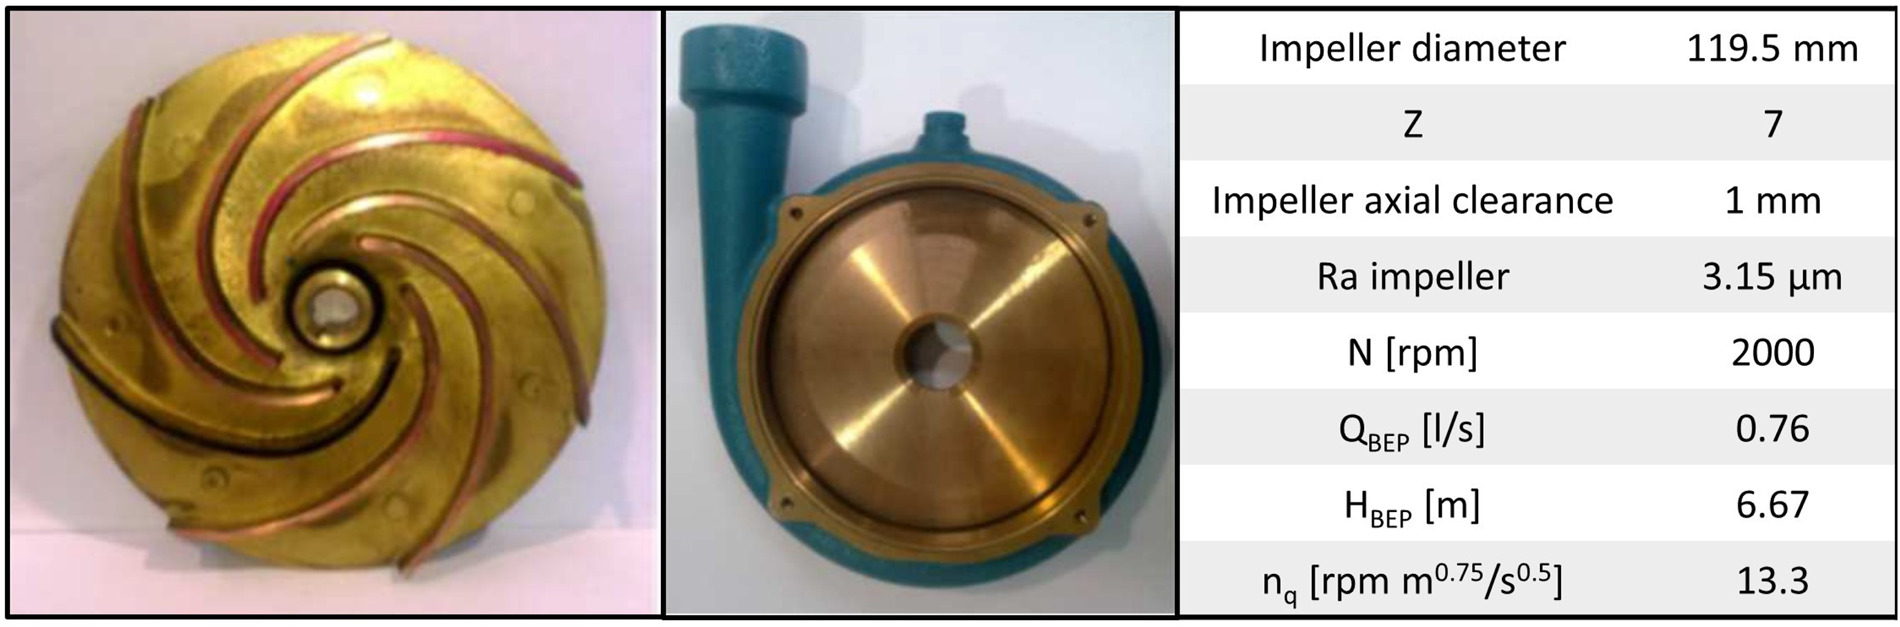
The experimental test rig located at the Engineering laboratories of the University of Ferrara (Zanini et al., 2023b) is here employed to evaluate the performance of a centrifugal pump handling non-Newtonian slurries. A sketch of the test bench is depicted in Figure 1. The main loop is made up of 1 1/2″ galvanized steel pipes with a thickness of 3.3 mm. Transparent acrylic glass pipes 250 mm long and 32 mm in diameter are employed at the pump inlet and outlet section to provide optical access to the incoming and exiting flow from the pump, respectively. A 100-liter tank guarantees the reservoir during the test, while a shell-and-tube heat exchanger ensures the constant fluid temperature during operations. The temperature control is performed through a chiller that adjusts the fluid temperature in the test bench close to 25°C varying the temperature of the refrigerant fluid. Preliminary test showed the effectiveness of the temperature control over all the test conditions reported in this work. The tested pump is actuated by a 1.1 kW inverter-driven electric motor, and a BURSTER 8661-5005 torque meter is interposed between the motor shaft and the pump shaft. The rotational speed is measured with a magnetic pickup that overlooks the electric motor fan. The volumetric flow rate is measured employing an electromagnetic flowmeter Endress + Hauser Proline Promag 55S (MID). According to the ISO 9906:2012 Standard ISO (2012), the pump static head is calculated with the pressure measurement sections located two diameters away from the suction and the discharge flanges. Each section is equipped with an absolute pressure transducer (range of absolute pressure of 0–2 bar for the suction and 0–6 bar for the delivery) and a K-type thermocouple. The measured values are the average of four equally circumferential-distributed taps connected by a ring manifold (Grade 1 ISO, 2012). Since non-Newtonian fluids can experience gas-locking phenomena (Furlan et al., 2013; Occari et al., 2019; Zanini et al., 2023b), here a Canon EOS 2000D 120 fps camera is installed facing the transparent delivery pipe to detect the potential air bubbles trapped in the fluid. A small commercial centrifugal pump with a semi-open impeller is here tested with water and CMC mixtures whose main features are summarized in Figure 2. The axial gap between the impeller and volute is set to 1 mm during installation.
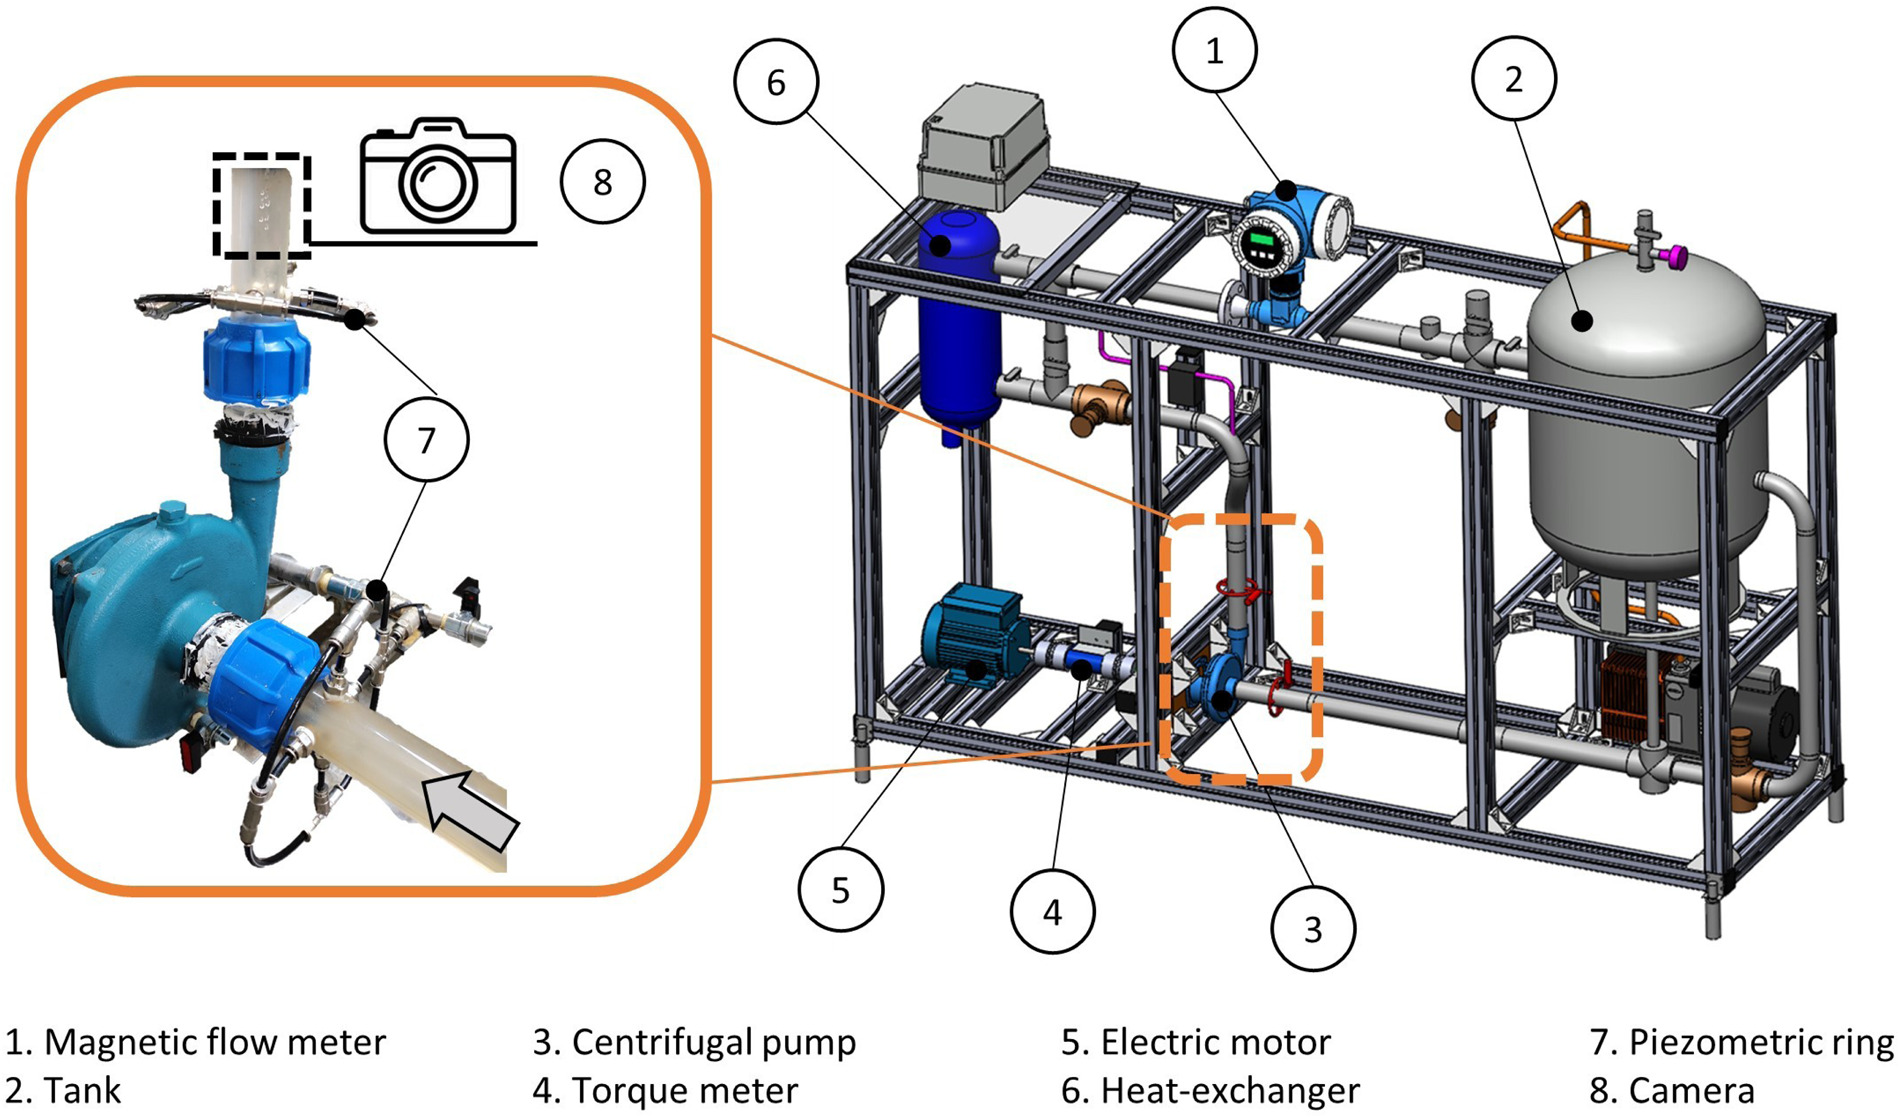
The same pump was previously tested by Occari et al. (2019) and Zanini et al. (2023b) with kaolin slurries and by Zanini et al. (2023a) with bentonite suspensions. Hydraulic connections and flexible pipes are added to join the main loop and the acrylic pipes in the pump suction and discharge sections.
Fluids characterization
Density and rheological measurements for the CMC mixtures are performed before the test campaign as follows. The density is obtained by weighing a measuring cylinder with a capacity of 100 ml filled with the fluid and the measurement uncertainty is estimated in ±0.5 ml. Rheological data are obtained with the rotational rheometer Rheometric Scientific ARES-LS equipped with 25 mm titanium parallel disks with a gap between the plates set to 1 mm. The rheological characterization is carried out for the range of shear rate (1–500) s−1, and the resulting flow curves are reported in Figure 3.
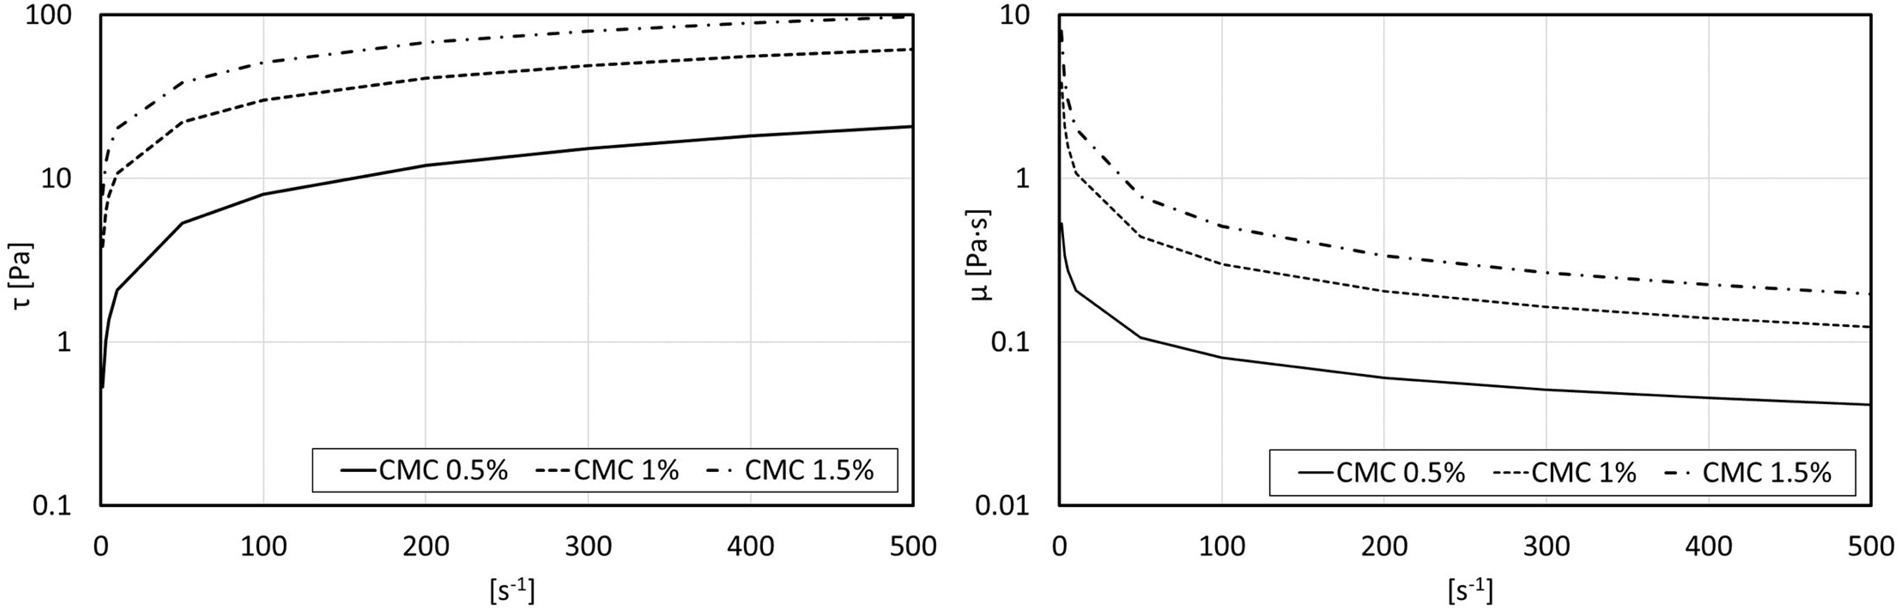
According to the literature (Benchabane and Bekkour, 2008), CMC exhibits shear-thinning behavior below a critical concen- tration (<1%), while above at 1%, CMC a transition behavior (shear-thickening to shear-thinning) may occur gradually increasing shear rate. Nevertheless, all the mixtures here considered show shear-thinning behavior, thus their apparent viscosity decreases with increasing the shear strain rate. The power-law model and the Bingham model are chosen to outline the fluid's rheology and are compared. The relation between shear rate and the shear stress acting on the fluid assumes the form reported in Equation (6) (Power-Law) or Equation (7) (Bingham).
where K is the consistency index, n is the flow index, τB is the Bingham yield stress and µP is the Bingham plastic viscosity calculated between 100 and 500 s−1. The coefficients of the rheolog ical models for each mixture are obtained from the best fitting of the experimental data using a nonlinear least-squares solver implemented in MATLAB®. The resulting density and the coefficients of the rheological models are summarized in Table 1.
Experimental procedure
The CMC mixtures are prepared in a mixing tank separated by the test bench. A precise amount of CMC powder is added progressively to 100 liters of tap water in order to obtain the heaviest concentrated mixture (1.5 wt.%). Care was taken to avoid the formation of lumps. The mixture is then left standstill for 48 h to ensure the complete hydration of the CMC, as suggested by Kabamba (2006). The remaining concentrations (1 and 0.5 wt.%) are obtained by diluting the first mixture. Once the selected mixture is stabilized, the loop is filled and the pump is kept running for thirty minutes before starting the test to ensure the stability of the acquired signals. The performance test is performed at constant rotational speed varying the flow rate in the loop thanks to a motorized globe valve located next to the pump delivery. Here, the performance is obtained by reducing the flow rate from the full load to the shut-off. Preliminary tests reported no hysteresis associated with the direction of flow variation (full load to shut off or vice versa). Image acquisition of the viscous flow at the pump delivery is carried out at full load before starting the performance measurements. Ten pictures for each condition are collected. In this investigation, water and three CMC mixtures at different solid concentrations are tested for two rotational speeds: 1,500 and 2,000 rpm.
Results
Pump performance
The pump total head (H), the inner power (Pi) and the inner efficiency (ηi) are calculated as follows:
where pd and ps are the static pressures at the pump discharge and suction, respectively, ρ is the fluid density, zd and zs are the heights of the measuring sections at the pump discharge and suction, Q is the volumetric flow rate, ω is the pump rotational speed, C is the mechanical torque, vd and vs are the fluid velocity at the pump discharge and suction. Since the suction and the discharge nozzles have the same diameter, the velocity head cancels. The pressure transducers and the correspondent measurement chain have been calibrated at the same time employing the pressure calibrator MicroCal PM200+, representing the in-house laboratory secondary standard which, in turn, is calibrated towards a primary laboratory standard certified in agreement with the Italian Accreditation Body (Accredia). The type B uncertainty is obtained by considering the uncertainty of the primary laboratory standard as the reference uncertainty UPLS and the residual uncertainty value of the pressure measurement chain ER. The first (UPLS) is supposed Gaussian distributed and consequently it is divided by 2 for calculating the standard deviation equivalents, while the latter (ER) is estimated considering the difference between the reference value and the average value of the signal provided by the measurement chain reordered for 2 s under a constant pressure input (generated and controlled by the MicroCal PM200+). This term is considered to have a rectangular probability distribution and for this reason, it is divided by 31/2. Finally, the evaluation of the type A uncertainty is carried out by estimating the standard deviation (considered as a Gaussian distribution) of the data set Uσ. The final assessment of the pressure measurement uncertainty is performed in Equation (11).
The propagation of the uncertainty is realized according to ISO/IEC Guide 98-3:2008 (ISO, 2008), which allows calculating the extended uncertainty uc for a given variable y as follows:
where xi are the dependent variables of the f function, which define the variable y, and u(xi) is the uncertainty related to each dependent variable evaluated as done for the pressure measurements in Equation (11). The resulting performance in terms of Head (H), shaft power (Ps), and efficiency (η) with the associated uncertainties are summarized in Figure 4.
Figure 4.
Pump performance: (a) head-1500 rpm; (b) head-2000 rpm; (c) shaft power-1500 rpm; (d) shaft power-2000 rpm; (e) efficiency-1500 rpm; (f) efficiency-2000 rpm.
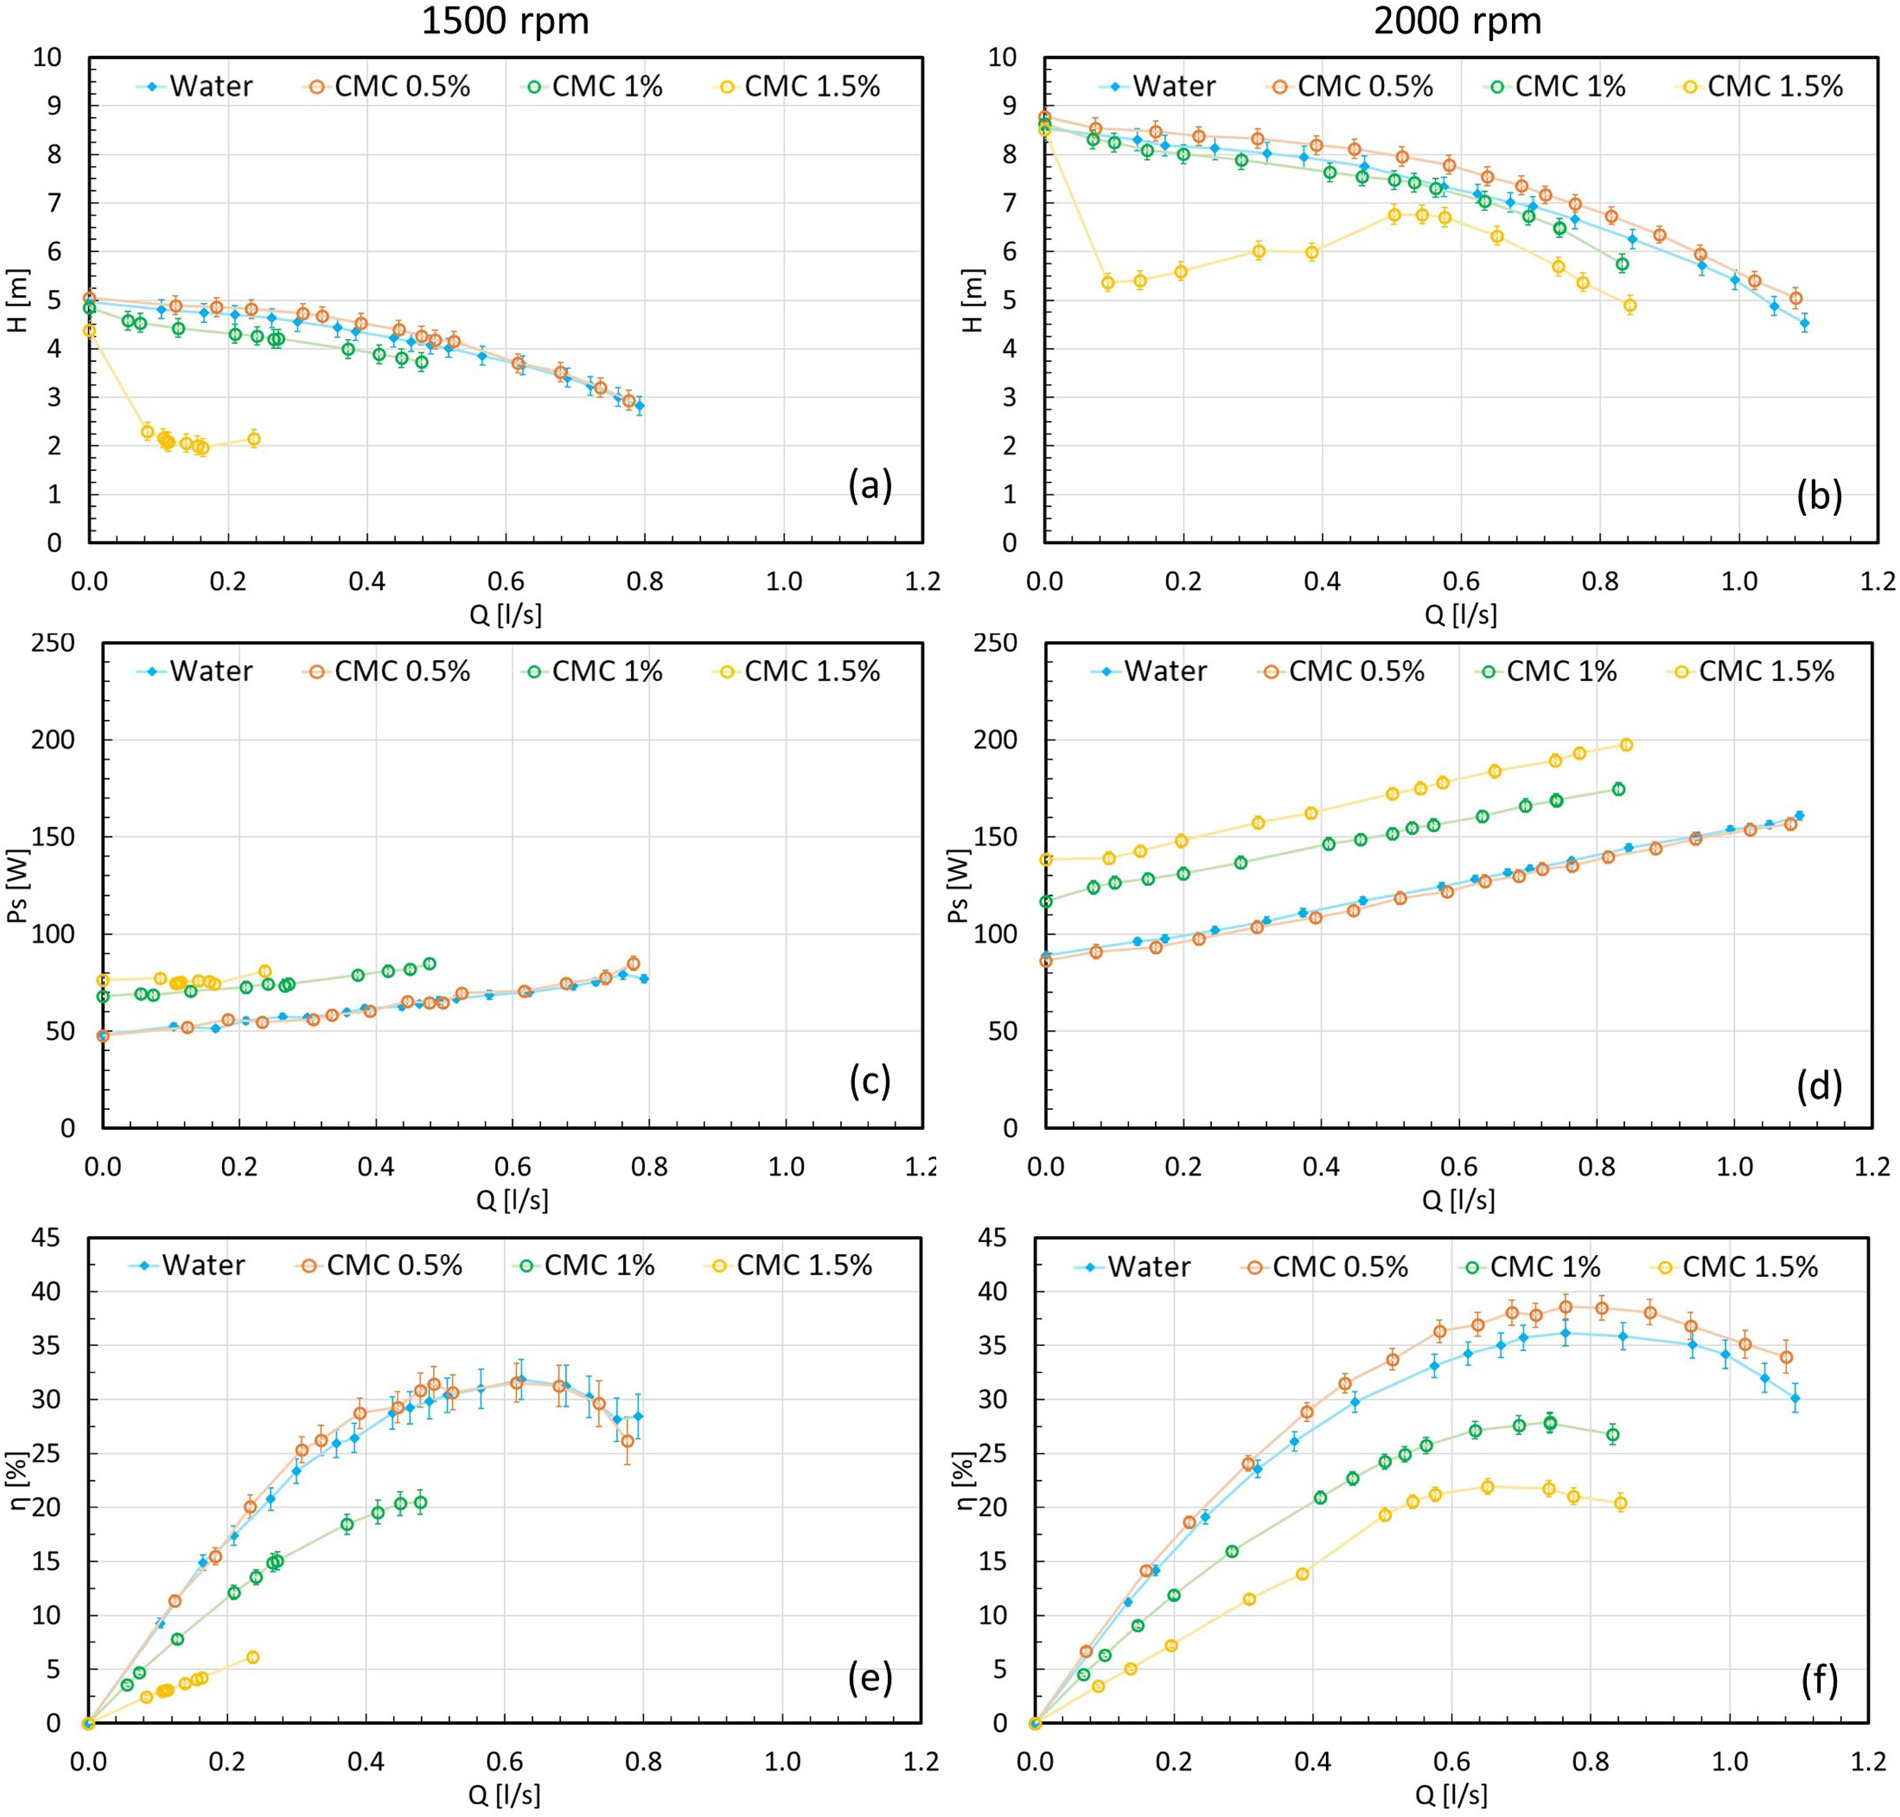
The water test (blue solid lines) is the reference performance with which to compare the results obtained with CMC slurries. For the 1,500 rpm test, the BEP is obtained at around 0.6 l/s with a pump efficiency of 32%, while for the test at 2,000 rpm, the highest efficiency is around 36% at 0.75 l/s. For both pump speeds, i.e. 1,500 and 2,000 rpm, the resulting viscous pump head shows a similar behavior increasing the solid content of CMC. For the lowest concentration (0.5 wt.%) the pump head exceeds the one obtained with water up to 5%, while the pump efficiency rises up to the 4% at 2,000 rpm. A more contained increase in efficiency is obtained at the 1,500 rpm. At the same time, the shaft power remains almost identical. This phenomenon, known as sudden-rising-head effect, was previously investigated by several authors in literature (Li, 2011; Aldi et al., 2017; Zanini et al., 2023a), and it can occur handling Newtonian fluids slightly more viscous than water. Previous works (Ohta et al., 1985) clarified that a semi-open impeller could exhibit better performance than a closed impeller at a high viscosity depending on the gap between the casing and blade tip. The observed performance increment is consistent with the outcomes of Li (2011) and Aldi et al. (2017). For the 1 wt.% slurry, a different behavior is experienced. The pump head reduces respect to the water baseline up to 12% and 10% at 1,500 and 2,000 rpm respectively. The shaft power increases up to 25% for both the rotational speeds and the pump efficiency drops at 20% (1,500 rpm) and 28% (2,000 rpm). Finally, the test with the heavier CMC mixture (1.5 wt.%), exhibits sudden performance drops at part load obtaining an unstable head curve, as found by Walker and Goulas (1984), Occari et al. (2019) and Zanini et al. (2023b). Head reductions up to 60% at 1,500 rpm and 40% at 2,000 rpm are experienced, while the highest pump efficiency drops to 7% and 22% for the test at 1,500 and 2,000 rpm respectively, without showing remarkable performance fluctuations. Shaft power increases to 25% and 55% with respect to the water baseline. Overall, as reported by Kabamba (2006) in testing CMC slurries, the BEP moves to lower flow rates increasing the solid content in the mixture.
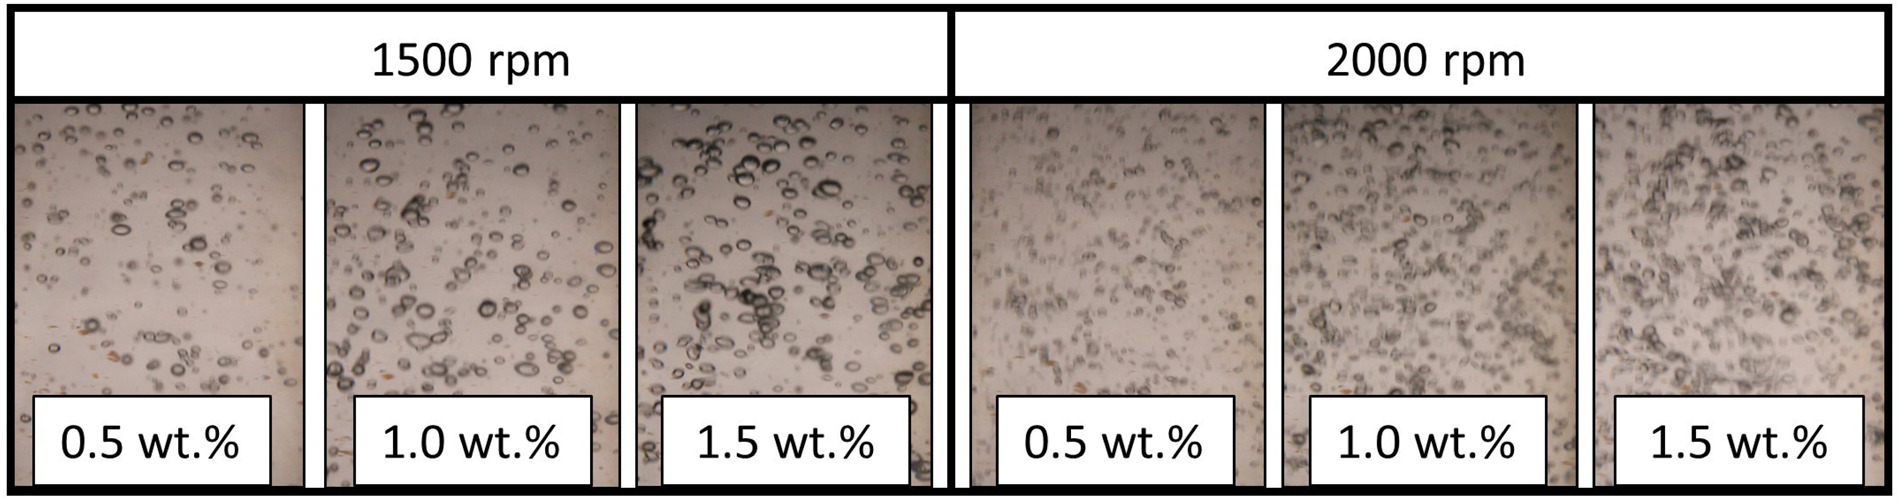
The performance analysis suggests associating the obtained performance instabilities with the gas-locking effect in the fluid, as found out by Furlan et al. (2014) and Zanini et al. (2023b). Also Gülich (2010) observed the same type of instability in studying the effect of free gas in water for different gas volume fractions. Some representative pictures of the mixture morphology at the pump outlet for different solid concentrations and pump speeds are shown in Figure 5. It appears clear how increasing the solid content involves a greater quantity of trapped air. On the other hand, the same mixture processed at a higher speed (2,000 rpm) is characterized by smaller particles due to the higher shear stress acting on the gas fraction (Mansour et al., 2018). Different air content increasing the solid concentrations corresponds to different behavior only at low flow rates when instabilities arise due to the presence of air bubbles. In light of this, higher CMC concentrations promote greater bubble trapping, and consequently, more bubbles detected during tests. Experimental data also reported that the discharge pressure trend follows the head one, so, the drops at low flow rates could be ascribed to the compressibility effects introduced by the air bubbles that change their characteristics (density and, thus, the occupied volume) over the pump. The compressibility effects due to the presence of air bubbles within the fluid generate a modification of the pressure value at the pump discharge section.
Walker and goulas approach
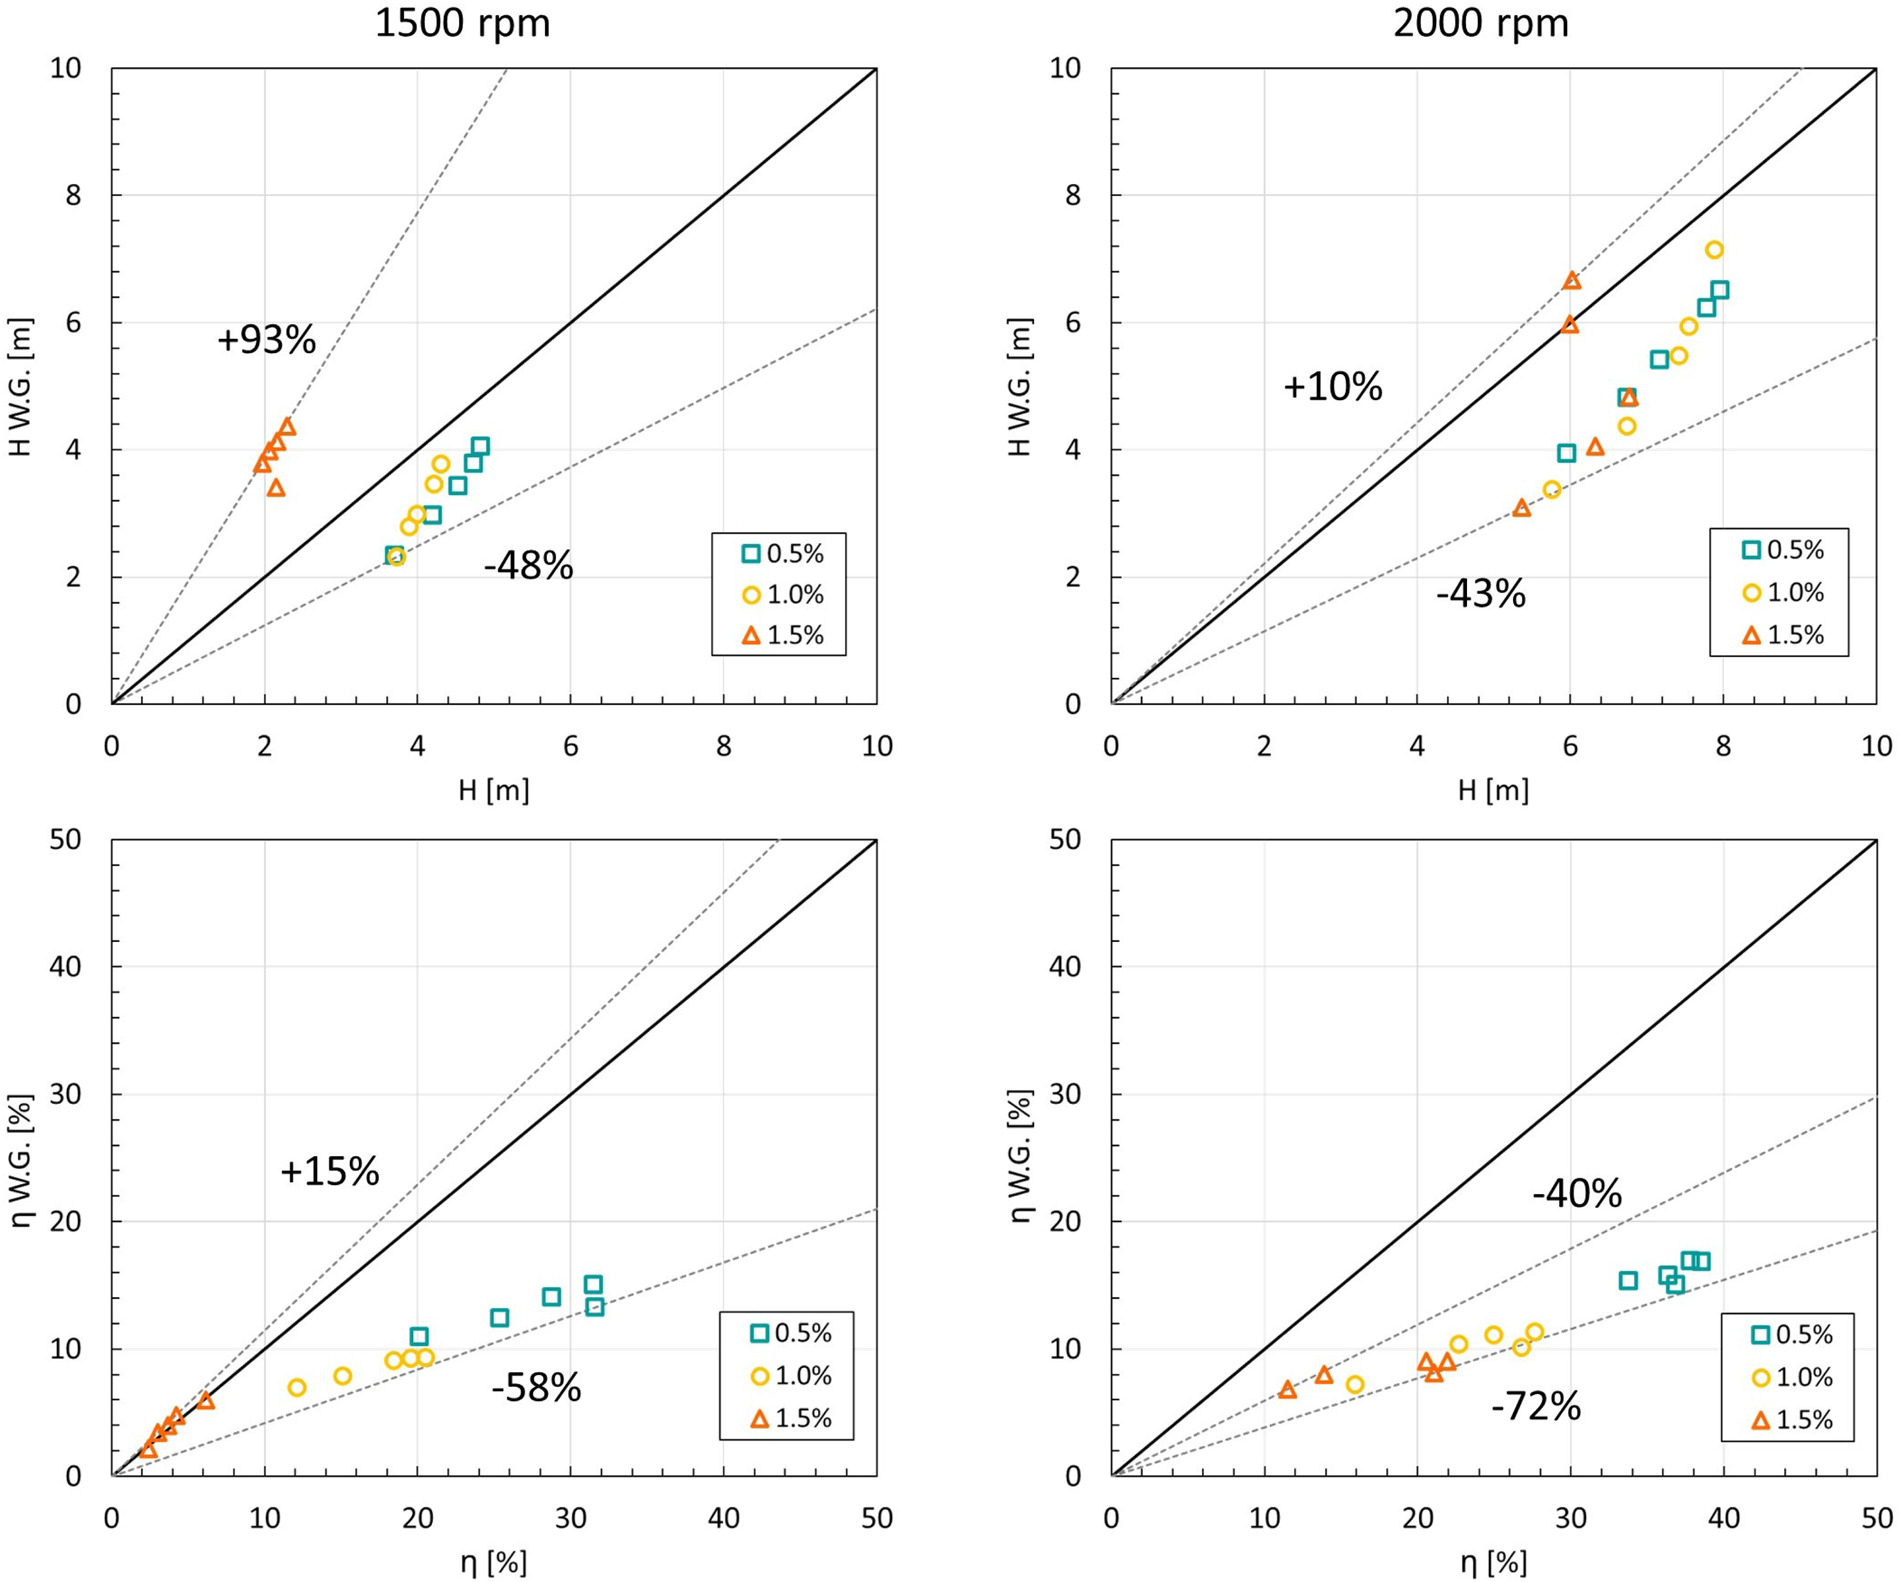
The ANSI-HI 9.6. 7-2010 (2010) method is adopted to predict the pump performance following the Walker and Goulas (WG) approach, i.e. considering the kinematic viscosity derived from Bingham's plastic viscosity in Table 1 as representative viscosity. Five data are considered for each test condition and compared. The experimental data are plotted against the predicted ones in Figure 6. Pump head at 1,500 rpm results underestimated by the WG approach up to 48% with lighter mixtures, while for the 1.5 wt.% head is overestimated up to 93%. The efficiency for the 0.5 wt.% mixture is underestimated up to 58%, while for the heavier slurry, an overestimation of the 15% is obtained. At 2,000 rpm, the pump head prediction bounds are more contained than for the case at 1,500 rpm but the predictions are more dispersed. The upper and lower limit are both obtained for the 1.5 wt.% mixture and they are respectively +10% and −43%. All predictions at 2,000 rpm underestimate the pump efficiency. The lower bound is found equal to −72% with 1 wt.% mixture while the upper bound is −40% for the 1.5 wt.% mixture.
Conclusions
In this work, an experimental investigation of the effect of solid content in shear-thinning fluids on centrifugal pump perfor- mance is carried out on an on-purpose test bench. Three CMC mixtures at different solid concentrations (i.e., 0.5, 1, and 1.5 wt.%) are tested with a small centrifugal pump with a semi-open impeller. The results show the performance deviation from the water baseline depending on the solid content. In addition, the experimental results are compared with the prediction of the Hydraulic Institute method. Overall, the outcomes can be summarized as follows:
The pump performance is strongly dependent on the solid content of the slurry. For low-concentrated mixtures (0.5 wt.%), the pump performance is close to the water baseline. Increasing the solid content (1 wt.%) leads to head and efficiency reductions up to 12% and 10% respectively. Finally, severe head and efficiency drops are detected, and part load for the most concentrated mixture (1.5 wt.%) with reductions up to 60% for the head and 25% for the efficiency.
Increasing the solid content in the mixture moves the BEP towards lower flow rates.
Image detection at the pump delivery highlights the presence of entrained gas in CMC mixtures. The more concentrated the mixture, the higher the gas content detected and the higher the performance drops experienced.
The Walker and Goulas approach predicts the pump performance with remarkable deviations from the experimental results. Pump head is predicted with deviations between −48% and +93% of the experimental results, while efficiency is predicted with deviations of −72% and +15% of the experimental results.
Nomenclature
BEP
Best efficiency point
C
Mechanical torque (Nm)
CH
Head coefficient (−)
CQ
Flow coefficient (−)
Cη
Efficiency coefficient (−)
CMC
Carboxymethylcellulose
Dimp
Impeller diameter (mm)
g
Gravitational acceleration (ms−2)
H
Pump head (m)
K
Consistency index (Pa sn)
N
Rotational speed (rpm)
n
Flow index (−)
nq
Pump specific speed (rpm m0.75 s−0.5)
NNF
Non-Newtonian fluid
Ps
Shaft power (W)
p
Static pressure (Pa)
Q
Volumetric flow rate (m3 s−1)
Ra
Average surface roughness (µm)
v
Fluid velocity (m s−1)
wt.%
Percentage by weight (%)
Z
Number of blades
z
Height (m)