
Introduction
Over recent years, aero engine manufacturers and institutes have moved their focal point of research from high to ultra-high bypass ratio (UHBR) engine designs. The reason is the endeavour to reduce specific fuel consumption (SFC), which is one driver for lowering direct operating costs (DOC) of an aircraft. To improve the SFC via the propulsive efficiency, the jet velocity has to be reduced, and thus the bypass ratio and fan diameter need to be increased. This allows for noise reduction due to reduced jet velocities and fan tip speeds, if the fan’s speed is reduced in rpm.
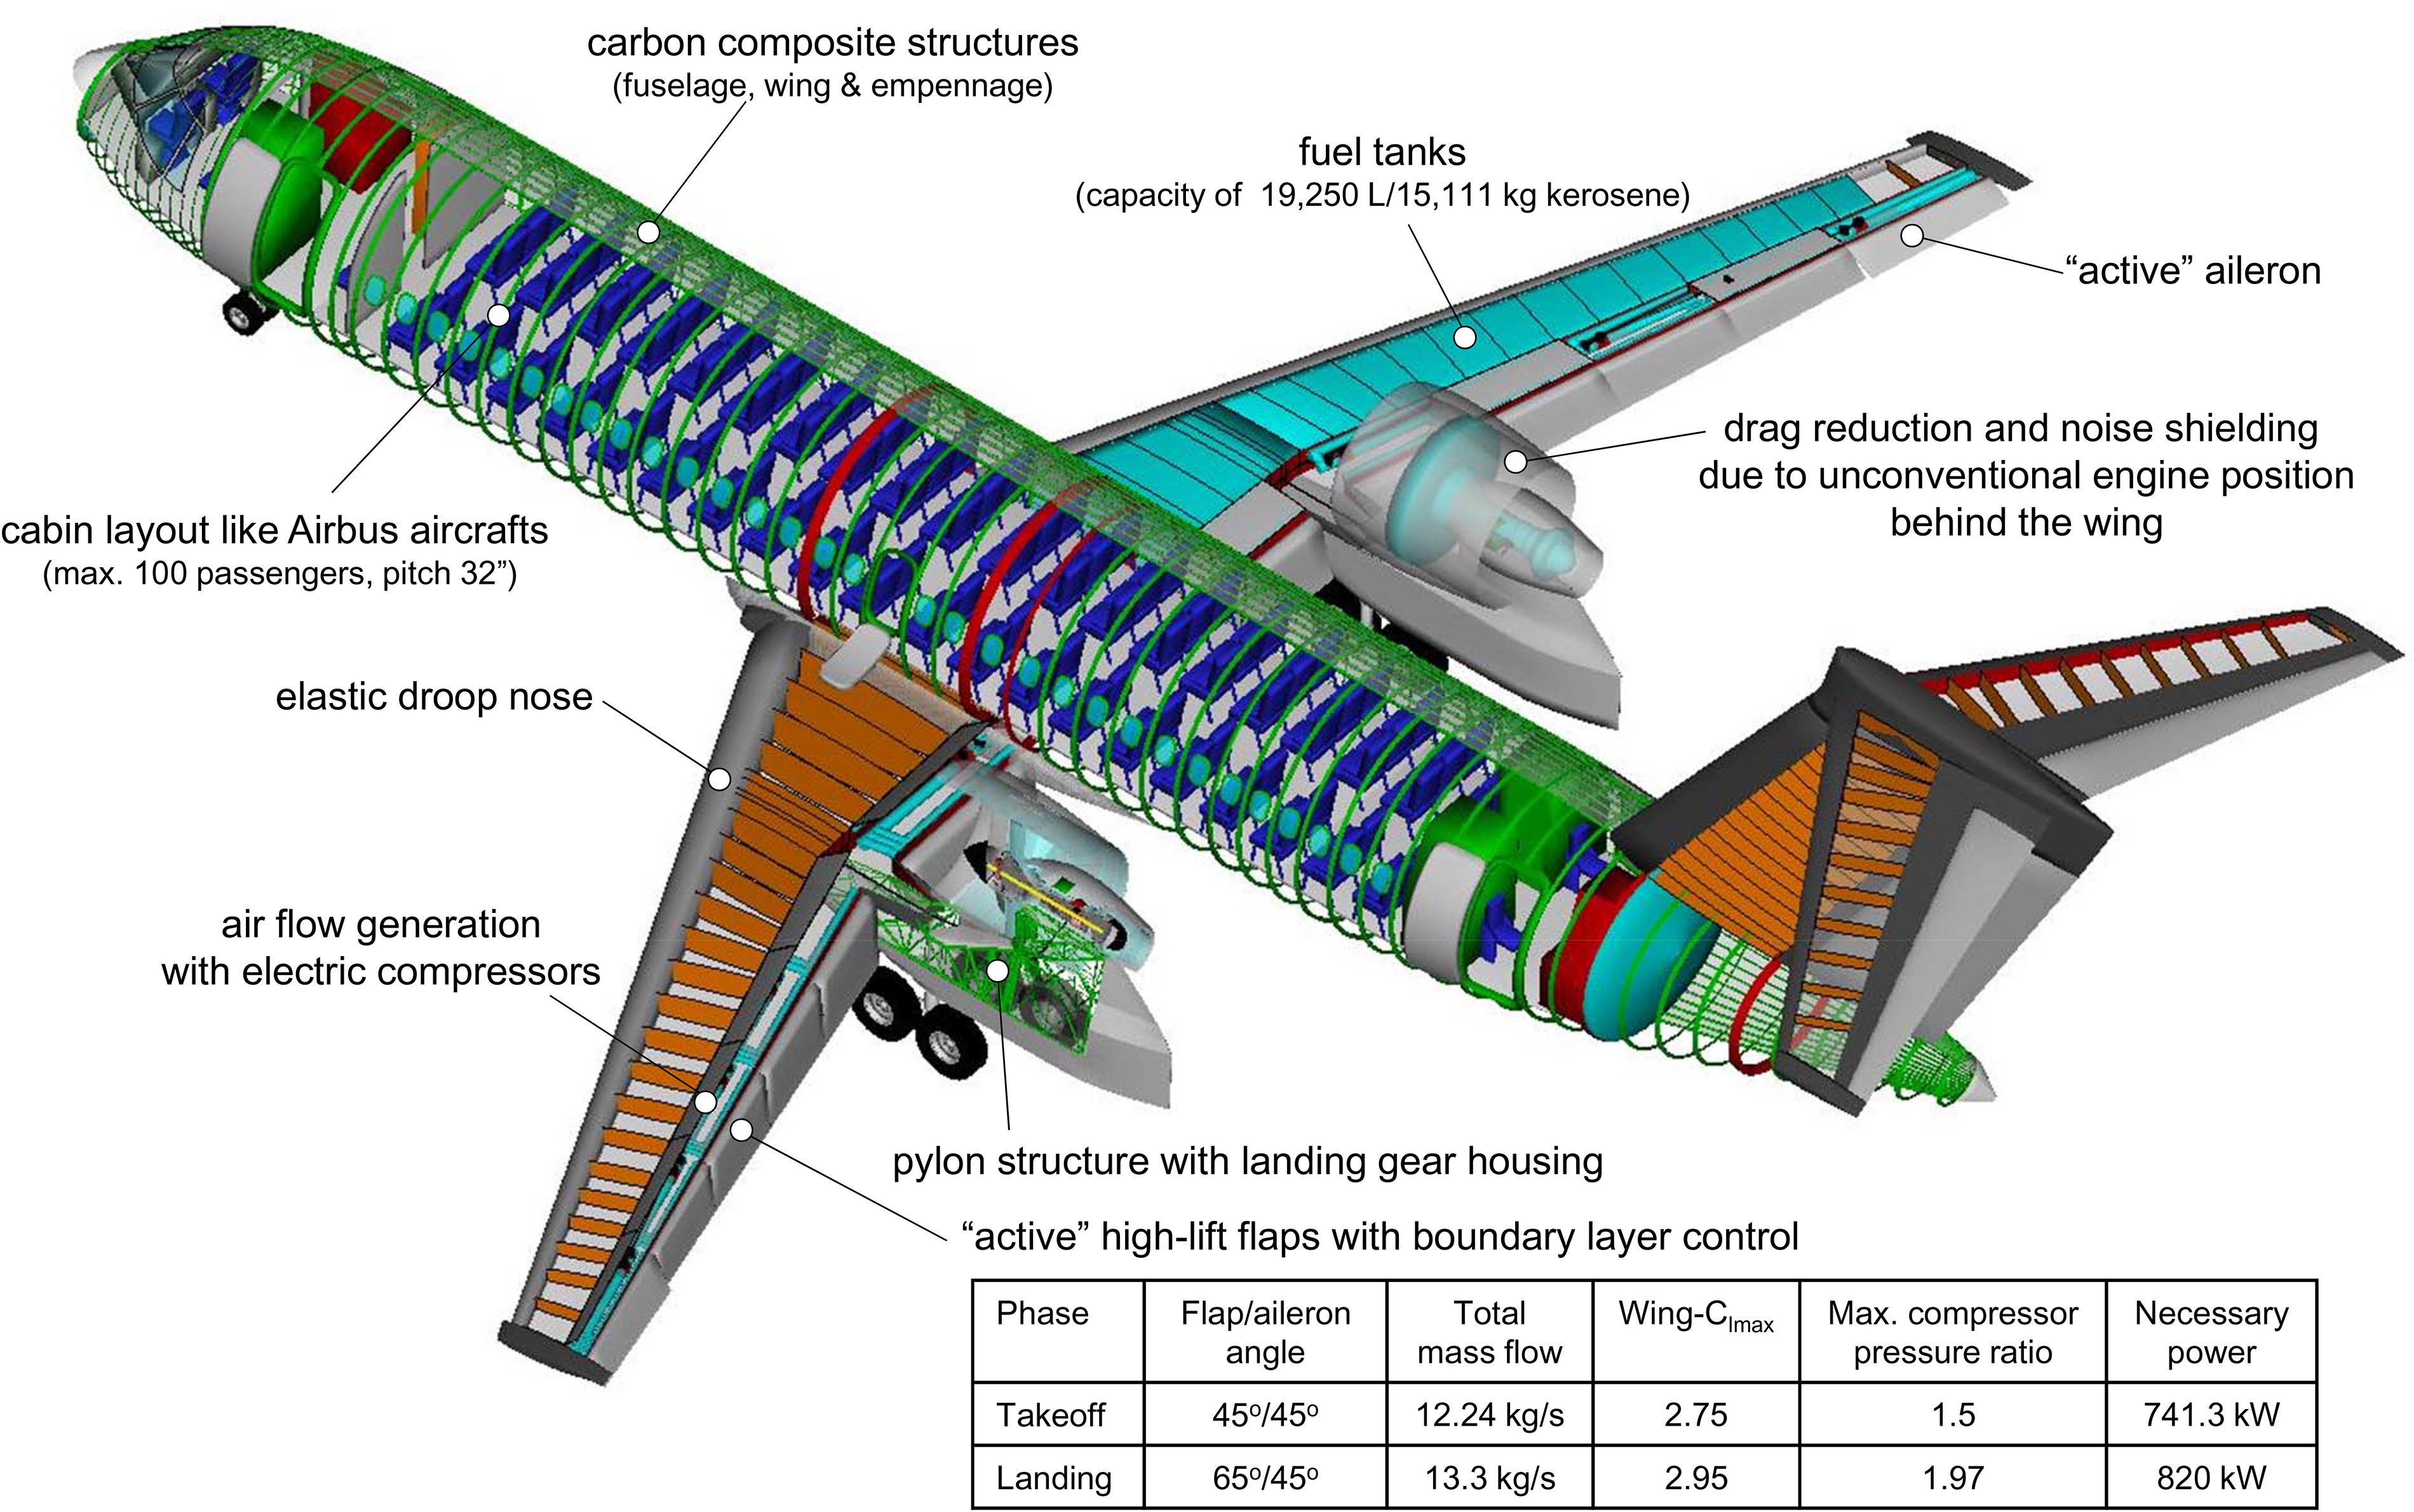
The reduced noise is positive in regards to the certification process and addresses the goals made by the Advisory Council for Aeronautics Research In Europe (2011), which published its “Flightpath 2050” guidelines in 2011. Within the German Research Foundation (Deutsche Forschungsgemeinschaft, DFG) the Coordinated Research Centre 880 (CRC 880) has been launched to develop methods in order to target the described guidelines and evaluate those methods by an overall aircraft design (Radespiel and Heinze, 2014). This aircraft is equipped with an UHBR engine, as seen in Figure 1.
Figure 1.
Aircraft configuration REF3-2015 within the CRC 880 with over the wing mounted engines (Heinze and Weiss, 2015).
For low fuel consumption and noise emissions, the UHBR engine architecture is characterized by a low specific thrust cycle following the above guidelines. Within this, the fan typically rotates at a lower speed and delivers a lower pressure ratio. To fulfill the thrust requirements a high mass flow is required. As fan diameter increases, the fan rotational speed needs to be reduced in order to maintain acceptable shock losses for high component efficiency as well as to reduce buzz-saw noise. In this case, a gearbox between the fan rotor and the intermediate pressure compressor (IPC) is required. The gearbox allows the low pressure turbine (LPT) which is mechanically coupled with the IPC, to run at a higher rotational speed. The relationships described above emphasize that the cycle parameters have to be carefully matched in order to benefit from the potential of a geared UHBR engine design.
An engine diameter study of a geared turbofan (GTF) with a variable bypass nozzle and an advanced counter-rotating turbofan engine for a Boeing 777-200 aircraft has been performed by Daggett et al. (2003). Focusing on the GTF, several engine studies have been investigated by varying fan diameter and bypass ratios (BPR). Having a BPR between 14.3 to 21.5 results in fan pressure ratios (FPR) of 1.45 to 1.32 and overall pressure ratio (OPR) of up to 75 with a technology readiness level date of 2015. The study clearly pointed out that while FPR decreases with an increase in fan diameter, SFC drops by up to 14% compared to conventional designs. Combining this effect with the reduced weight of a resized aircraft, the fuel consumption can be reduced down to 16%. By only taking into account fan, jet and airframe noise sources, the noise emissions are on the same level as today’s aircraft with a slight trend towards lower noise levels. Regarding the aircraft performance investigated by Daggett et al. (2003), the higher the engine diameter, the higher the sea level static thrust. Referring to Daggett et al. (2003), it is reported that the variable bypass nozzle does not show significant improvements in either fuel reduction or noise emissions for the chosen baseline aircraft.
While the described study of Ultra-Efficient Engine Technology (UEET) primarily focused on a Boeing 777-200 aircraft type, Hall and Crichton (2006) performed an engine design study for a blended wing body (BWB) configuration in the Silent Aircraft Initiative by the Cambridge-MIT Institute. Within this study, four different engine configurations based on a UHBR turbofan in an embedded installation were thermodynamically designed and mechanically investigated. For the cycle design, a technology readiness level of 2025 was chosen with a FPR of 1.45, a BPR of 15.5 and a turbine entry temperature (TET) of 1,880 K at top of climb (TOC) condition. Being driven by the vision of the Advisory Council for Aeronautics Research in Europe (2001) for 2020 the target SFC was set to less than 15 g/kNs at cruise. An embedded engine configuration was chosen for maximum noise shielding effects of the BWB. The optimization of the variable bypass nozzle leads to a maximum area variation of 35% with a decrease in jet noise of around 10% during approach. Thereby, fan rotor peak efficiency rose to almost 95%.
The concept of increased bypass nozzle area has been tested by NASA for a model turbofan in one of their wind tunnels, (Woodward et al., 2006). Increasing the nozzle area by 5.4% at cutback condition, a fan noise EPNL reduction of 2 dB and 3% higher stage thrust was observed. For higher rotor speeds (take-off condition), a reduction in EPNL of only 1 dB and 2% stage thrust increase were measured. For a further increase in nozzle flow up to 7.5%, an EPNL noise reduction of about 3 dB during approach condition was achieved. No changes were observed for high rotor speeds in the case of a 7.5% increased bypass nozzle area.
In a sensitivity analysis for varying fan pressure ratios and bypass nozzle areas, Michel (2011) discovered a jet noise reduction of sound pressure level (SPL) in the order of 2 dB for different flight conditions. For cruise, a SPL reduction in the order of 1 dB is reported.
In an attempt to determine the benefits of UHBR engines for a particular aircraft mission, this paper deals with the following issues:
the design of an UHBR engine for a regional aircraft which has been developed within the Coordinated Research Centre 880 (CRC 880) in order to fulfill the “Flightpath 2050” goals made by the Advisory Council for Aeronautics Research In Europe (2011),
the assessment of the performance and fuel consumption of UHBR engines compared to conventional turbofan engines,
the introduction of variable bypass area nozzles for UHBR engines and the effects on engine performance operability and SFC,
the consideration of UHBR engine designs for regional aircraft performance, in particular for the DOC,
and finally, an initial noise assessment at the source regarding a comparison between conventional turbofans, UHBR engines and UHBR engines with variable bypass nozzle area (VBNA).
Variable bypass nozzle application
Total thrust depends on the mass flow through the engine as well as difference between the flow velocity ejected by the nozzles and the flight velocity. For maximum propulsive efficiency, the flight and ejected flow velocities have to be matched. To keep the thrust constant, the mass flow has to be increased. Thus, the SFC decreases due to the low specific thrust cycle.
In general, the fan operation is balanced with the bypass nozzle to achieve the required thrust with best propulsive efficiency at design point. At off-design, i.e. take-off, the fan operation is not in accordance to the bypass nozzle design. Hence, an adjustment of bypass nozzle area at off-design results in an improvement of fan operation. Based on the isentropic pressure ratios of fan and nozzle, opening the bypass nozzle at constant rotor speed leads to FPR changes (Michel, 2011).
Assuming that a given thrust has to be achieved at a certain operating point, the fan can operate, in principle, at a lower pressure ratio moving away from the surge line. This relationship leads to a lower nozzle velocity and a correspondingly higher propulsive efficiency (Michel, 2011):
Rearranging Equation (1) emphasizes the resulting drop in FPR for increased propulsive efficiency:
According to Daggett et al. (2003), higher BPR is accompanied by lower FPRs, which implies lower noise emission referring to Woodward et al. (2006).
Methodology
In order to pursue the objectives, several tools were used in consecutive order. As a cycle design tool for each jet engine model, GasTurb 12 (Kurzke, 2015) was used. The engine characteristic data was transferred to the Preliminary Aircraft Design and Optimization (PrADO) tool in order to redesign an existing aircraft of the CRC 880 and then estimate its direct operating costs (DOC). The PrADO tool is an in-house software developed by the Institute of Aircraft Design and Lightweight Structures (IFL) at TU Braunschweig over the last few decades (Heinze, 1994). For the initial noise assessment of the engines, two tools from DLR were used. The first tool was the Parametric Aircraft Noise Analysis Module (PANAM), described by Bertsch (2013), which is used to perform the noise prediction of the engines. The second tool was SHADOW and further explained by Lummer (2008). It is used to consider the shielding of the sound generated by the fan.
Engine cycle calculations
GasTurb (Kurzke, 2015) is a commercial tool which provides characteristic curves for each component. After choosing the engine cycle, setting the ambient condition and the design point values such as mass flow, BPR, TET and component efficiencies, each engine station was calculated. For the study discussed herein, net thrust and OPR were estimated iteratively by varying inlet mass flow and pressure ratios. For designing low pressure cycles with lower SFC at a given BPR, the nozzle velocities have to be chosen taking fan, LPT and gearbox efficiencies into account since they have to convert the entire bypass power.
The secondary air system, bleed air and power offtake could be also included in the calculation design procedure. Usually, several operating points are considered in an engine design. In order to have an adequate aerodynamic engine sizing, the TOC operating point was used as a design point in the present study, which was also done by Hall and Crichton (2006). Since TOC and cruise operating conditions are very similar to each other and the impact of cruise segment in block fuel consumption for a short-range aircraft is relatively small, the engine sizing perspective was found to be more relevant for this study. All off-design points had to be defined for both normal flight operation and safety relevant certification points. The main physical values, such as temperatures, were checked for all other operating points to meet realistic limits given, i.e. in Grieb (2009).
Furthermore, GasTurb is able to generate a rough geometry based on the chosen design input values, albeit the geometry was adapted manually afterwards to meet realistic dimensions as stated in Grieb (2009). Based on the pressure rise within a component, a number of stages were drafted. By implementing material data and checking the behaviour of the disks during off-design calculations, stress and burst margins were implemented to obtain realistic component dimensions and masses.
Preliminary aircraft design
The tool PrADO simulated the iterative overall design process in its core, and is shown in Figure 2 in the version which was used for the presented studies (Heinze, 1994). The core contained independent program modules which represented the contributions of the disciplines involved in the design process of an aircraft. The superimposed iteration simulated the interaction between the disciplines and reproduced positive or negative snowball effects on the final results. The iteration would be finished if important calculated parameters (e.g. maximum take-off weight) showed a convergence. The modules communicated with each other through a data management system (DMS) which allows a simple connection of external programs (e.g. like GasTurb) with PrADO. The database itself described a relative complete aircraft model after the first iteration that can be used for further studies outside of PrADO (e.g. noise assessment of the investigated configuration). The design core was enclosed by further loops which enabled an automatic variation or optimisation of independent parameters of the aircraft (e.g. wing area, aspect ratio, inputs for the fuselage geometry) and/or the engine concept (e.g. BPR, OPR) to find the best configuration for a defined objective function (e.g. minimal DOCs). The input for PrADO included the specification of the transport task (e.g. payload, range, desired cruise conditions), the independent parameters of the aircraft components and the engine, and all significant constraints defined by the civil aviation authorities (EASA/FAA) or by the user itself. The output of PrADO was a complete aircraft description with a 3D geometry model, component masses derived from a FEM structure dimensioning, aerodynamic and propulsion properties, flight data of the simulated missions, and an analysis of the direct operating costs.

In the application used for this paper, the engine program of PrADO was completely replaced by a call of the program GasTurb that provided all necessary data for the engine (see Figure 2). PrADO supplied the required air and power offtake requirements for the cabin and electrical compressor system of the active high-lift system from the aircraft system module, Koeppen (2007) and Werner-Spatz et al. (2012). This data was an important input for the engine design with GasTurb and the calculation of the off-design thrust and SFC characteristics. A further input for the engine design was the thrust requirement from the aircraft side (aerodynamics, masses and performance demands) that PrADO determined by checking critical flight situations at the end of an iteration loop (e.g. EASA/FAA minimum climb angle with engine failure). The GasTurb results were loaded into the DMS via an interface program and were immediately available to all modules for application in the overall process. In addition to reducing the noise signature, the unconventional engine position behind the wing (see Figure 1) also improved the drag in cruise due to flow interactions between the wing and the propulsion unit, as shown in American studies by Hooker et al. (2013). The investigations show a possible aircraft drag reduction of −5%. From the corresponding explanations, a drag breakdown can be made on a component level, which was compared with the ideal results without the installation effects of the aerodynamic module from PrADO. From the comparison of the drag areas containing friction, viscous pressure and wave drag, multipliers were derived, with which the calculated PrADO drag areas of wing, nacelles and pylons are corrected. Meanwhile, high-fidelity RANS results (TAU code of the DLR in Braunschweig, (Savoni and Rudnik, 2018)) for the UHBR aircraft are available in the CRC 880. They show a high agreement by the aircraft coefficients and confirm the simple correction approach for design applications.
Noise prediction
The Parametric Aircraft Noise Analysis Module (PANAM) can predict the aircraft system noise at the source or on the ground with low computational costs already within the preliminary aircraft design process (Bertsch, 2013).
PANAM incorporates semi-empirical models for the relevant noise sources on board of an aircraft. The relevant noise sources are divided into airframe and engine noise sources. Available airframe noise sources are leading and trailing edge devices (e.g. Slat and Fowler flap), spoilers, and landing gears. Engine noise sources include the jet and fan. Other engine noise sources, such as the compressors, turbines, and combustor do not contribute significantly to the overall noise of conventional engines (Huff and Envia, 2008) and are not modeled in PANAM.
The semi-empirical noise source models provide the sound pressure level for 1/3-octave bands as a function of directivity and model specific input, i.e. geometry and operation. PANAM considers moving source effects, such as the frequency Doppler shift and convective amplification, in addition to propagation effects, such as geometric spreading, atmospheric dampening, and ground absorption.
In this study, only the sound of the isolated engine at the source is simulated. The fan noise prediction model that is used in PANAM is the model of Heidmann (1979), with a modified underlying database as described in Bertsch (2013). According to the model, the fan sound level is approximately proportional to
where ηfan is the isentropic efficiency of the fan and
where (6) accounts for the jet exit velocity at the nozzle vnozzle accounts for the jet exit area A, and (8) accounts for the eddy convective amplification. The convective Mach number Mcon is defined as
where c denotes the ambient speed of sound and vflight the flight speed.
Shielding of the fan sound
The ray-tracing tool SHADOW has been developed in order to calculate the shielding of the engine’s fan sound by the airframe with low computational costs and adequate accuracy (Lummer, 2008). This makes the tool suitable for application in the preliminary aircraft design phase.
The low computational costs in SHADOW are achieved with the assumption that the engine fan sound can be represented by a single point source. Furthermore, the influence of flight velocity on the shielding effects is expected to be rather small, and hence is currently neglected.
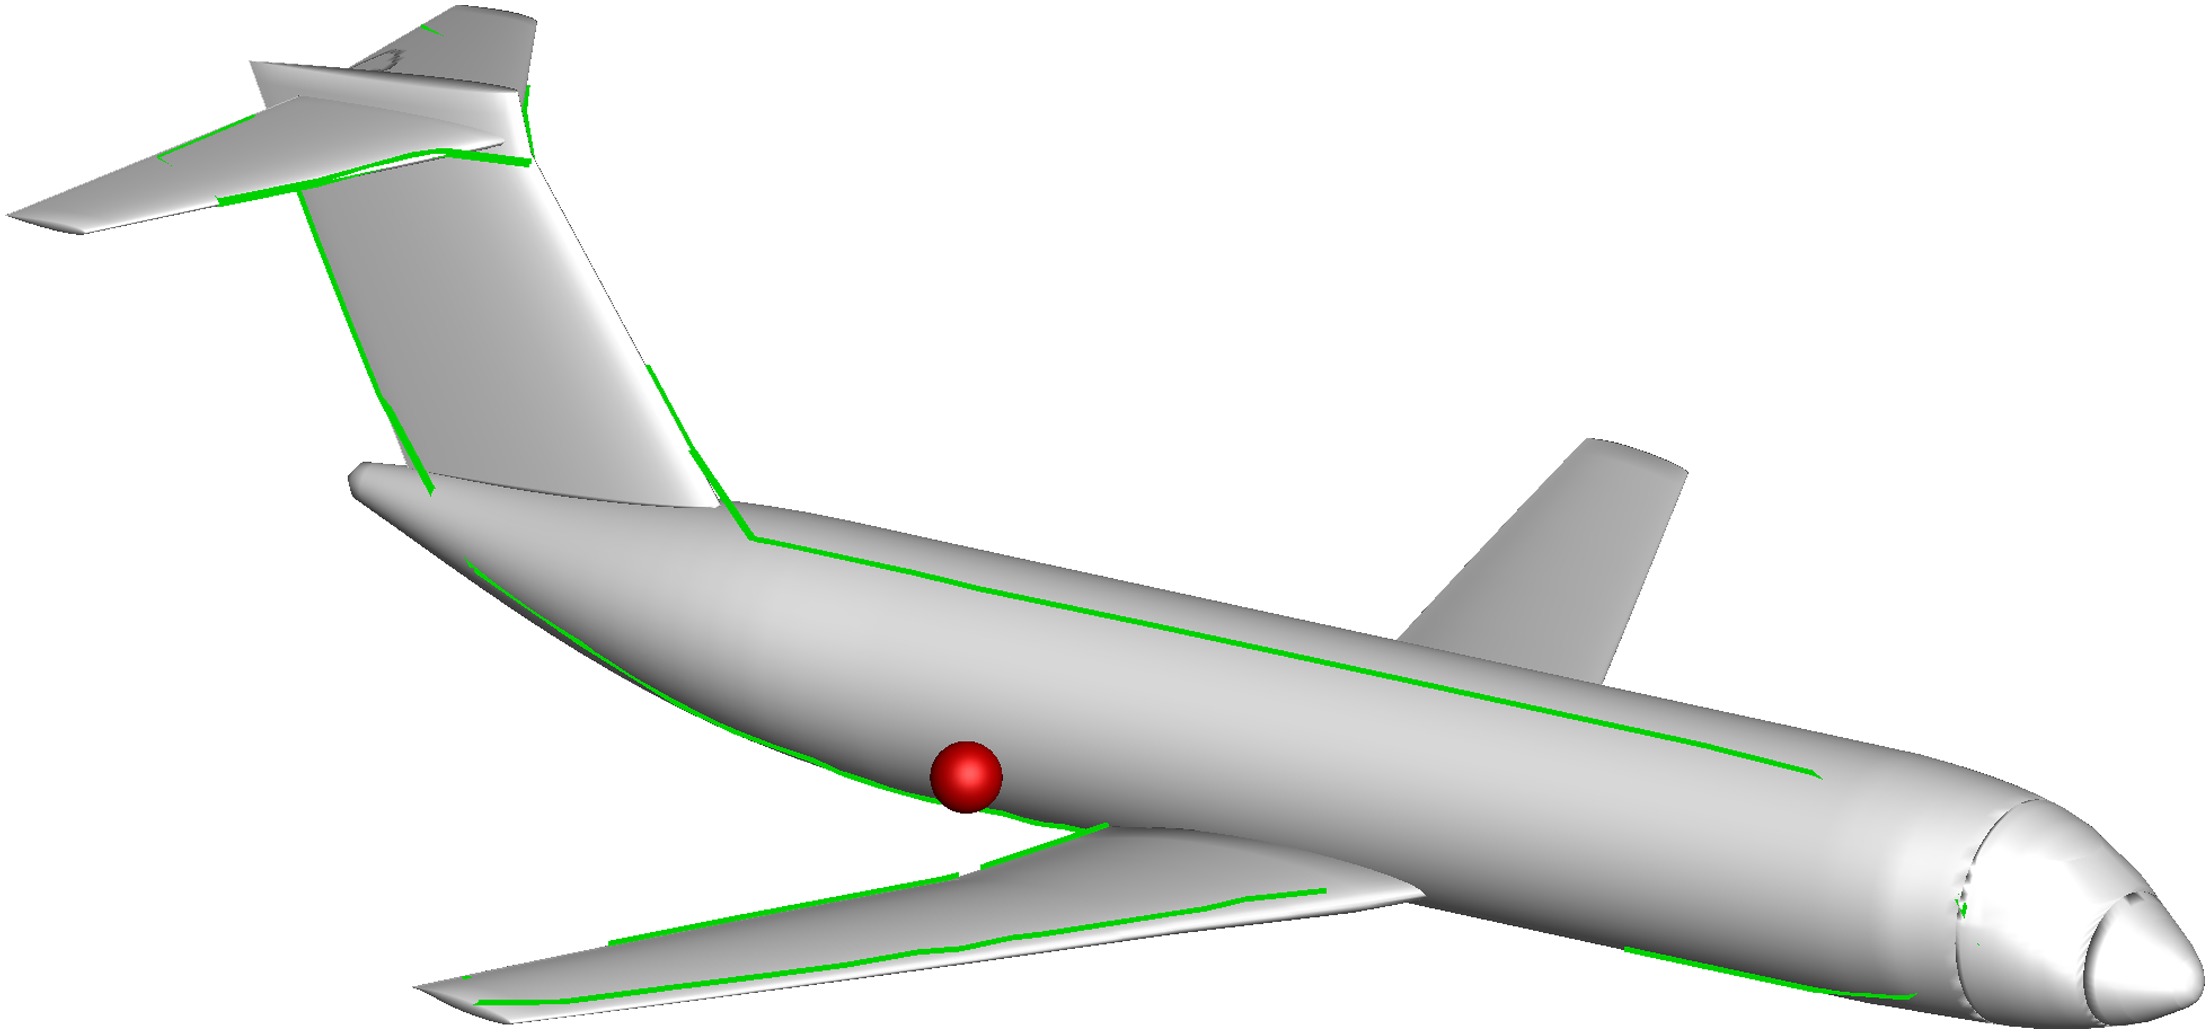
For each 1/3-octave frequency band, SHADOW solves a line integral along the shadow boundary on the airframe surface, as depicted in Figure 3. The tool provides an attenuation level, ΔLatt., in dB for each 1/3-octave band i and direction θ. The shielded fan sound for the i’th 1/3-octave band can then be calculated by
Description of the aircraft concept
The aircraft was designed to address the main goals defined in the “Flightpath 2050” (Advisory Council for Aeronautics Research In Europe, 2011) and in the predecessor “Vision for 2020” (Advisory Council for Aeronautics Research In Europe, 2001). By means of an active high-lift system, the aircraft is capable of taking off and landing on shorter runways which primarily exist on regional airports all over Europe. This allows faster point-to-point connections and reduces the capacity problems main hub airports will have in the future. In order to avoid increasing noise emission for the population living around those regional airports, the engines are mounted over the wing.
In Figure 1, the latest version of the aircraft developed within the CRC 880 is shown, which features available technologies for an entry-into-service date of 2025. The layout is a classic wing-tube-configuration with a swept, medium aspect ratio wing (26 deg, 8.3) in a low wing arrangement and a T-tail on the rear fuselage. The engines are installed over the wing trailing edge to reduce the installation drag between wing and propulsion unit in cruise, and also to decrease the perceived external noise due to shielding of the fan/LPC noise by the wing surface in front of the engine. The decision creates a serious disadvantage for the overall design of the aircraft. The heavy propulsion units include the danger of a tail strike during the rotation phase before lift-off if the aircraft’s center of gravity (CG) is in the rearmost position. To prevent this, the main landing gear legs must be situated near the engine. The lack of space in adjacent components (wing or fuselage) led to the decision to integrate the accommodation of the legs in the pylons. The consequences are a doubling of the wetted surface and relatively high thickness ratios of the cross-sections (about 13.5%) compared to an under-wing pylon. The studies by Savoni and Rudnik (2018) show that the unconventional pylon geometry, with its influences on the shock system of the wing, determines approx. 15% of the aircraft drag and reduces the benefits from the installation drag significantly.
The aircraft is designed for a range area between 2,000 km (with maximum payload) and 2,700 km (with maximum passengers) at a cruise Mach number of 0.78 at flight level FL 370 (11.277 km), which allows a flexible operation on more than 90% of European air routes. The maximum payload is 12,000 kg for 100 passengers with additional freight (2,200 kg). The requirement of a maximum runway length of 900 m (sea level, wet runway) is also crucial for the design of the aircraft. The realisation would allow it to operate from 65% of present-day European airports, which are designated by the ICAO. This means nearly a doubling of potential destinations compared to the current situation in Europe. The main dimensions of the aircraft can be summarized via the overall length of 32.8 m, height of 10.2 m and span of 28.7 m. With a wing reference area of 99 m2, the aircraft variant without a variable fan nozzle (UHBR17) features a maximum wing loading of 458 kg/m2. With supply of electrical power for the operation of an active high-lift system, the maximum thrust-to-weight ratio represents 0.586 at take-off and would be reduced to 0.28 by an engine failure.
The efficient UHBR propulsion system in combination with a full carbon primary structure of the aircraft leads to reduced take-off and landing weights, which helps to achieve the desired STOL requirements. The pivotal element is, however, the high-lift system with boundary layer control (BLC, Coanda principle), which consists of 12 plain flaps along the wing span. The necessary mass flow rates (during take-off: 12.2 kg/s, Cμ = 0.0173, during landing: 13.3 kg/s, Cμ = 0.0242) are generated by 12 electric compressors (one per flap segment), which are fitted between the rear spar of the wing box and the flaps. For the lift generation function, the flap deflections are 45° in take-off and 65° in landing configuration. The outer flaps also take the function of an aileron so that their base angles for the lift function are limited to 45° in all configurations. In these combinations, the active high-lift system operates at most favourable flow conditions shortly before transition to super circulation, which also leads to a target lift increment to the minimum power requirements for the compressor design. The maximum achieved local lift coefficient in profile direction perpendicular to the 25% wing chord line is 4.5 in take-off and 4.9 in landing configuration (position: 72% of the half span). Due to the wing sweep and the influences of the circulation, the wing achieves maximum lift coefficients from 2.75 and 2.95 in the mentioned configurations. The trailing edge flaps are combined with an elastic droop nose to prevent an early flow separation in the nose area. Through this, the usable range of the angle of attack can be enlarged, so that the aircraft operates in the take-off and landing phases with a slightly positive angle of attack.
The compressors (diameter 0.17 m, length 0.3 m) are supplied by an electric direct current network (600 V), that is connected with the engine generators. The transformations from or to alternating current are carried out by power electronic units, which are arranged after the generators and in front of the compressors. The mass flow rates determine the power requirement in combination with the necessary pressure ratios (see Figure 1) to obtain the slot exit speeds (Teichel et al., 2015). The corresponding model description is implemented in the design program PrADO and also provides the masses of the system components. This additional mass effort increases the operating empty mass and influences the aircraft design with increasing ramifications. For the CRC aircraft, the BLC system needs 741 kW in take-off configuration and 820 kW in landing configuration. To ensure that the active high-lift system continues without restrictions in the case of an engine failure, the values represent the necessary power offtake for one engine. The other aircraft systems required an additional 23.6 kW and bleed air of 0.88 kg/s mainly for the environmental control system under normal operating conditions. The mass required for the BLC system is 450 kg (variant UHBR17), of which 236 kg is for the 12 compressors. Power electronic units (46 kg) and cables need 101 kg. The rest represents the mass increase of the engine generators (total mass of the generators: 2 × 120 kg), which is necessary for the provision of the mentioned power requirements for the active high-lift system.
In Table 1, the operating points of the engines are summarized, which were determined by the design program PrADO and adjusted during the configuration development. Top of climb proved the most important case (case 1) for the design of the UHBR engine due to the combination of low air density and a necessary thrust surplus for the subsequent acceleration of the desired cruise Mach number. Besides the design point, several off-design points are listed in which all engines are operating (AEO). With these cases, it is checked whether the engine can provide the required thrust due to the flight situation and simultaneous supply the active high-lift system with electrical power. Further to that, the engine has to ensure a safe operation in case of an emergency, meaning one engine is inoperative (OEI). This includes the EASA CS-25 rules to minimum climb gradients during the different phases of take-off and landing. Cases 5 and 6 were defined in order to have sufficient thrust with running high-lift system for take-off on a 900 m runway length and concerning the ranking for the engine design equal to case 1. Cases 2 and 11 represent level flights under cruise conditions up to the maximum flight altitude of 12 km (FL 395). In these cases it is checked whether enough thrust is available for a stationary level flight. The combination of low air density with a high bypass ratio is critical here for the engine design.
Table 1.
Operating points for the jet engine.
1EASA CS-25.
Engine characteristics
Within this study, basically two different cycle designs were analysed: a typical conventional and a future geared UHBR turbofan engine. The determination of engine technology for the latter has been done by extrapolating trends written in Grieb (2009). Further to that, the UHBR engine has been retrofitted with a variable bypass nozzle. In the following, various engine cycle parameters at design point are compared.
Bypass ratio 5 engine
The first engine serves as a reference case due to its conventional cycle used nowadays in commercial single-aisle aircraft. Consequently, it has a BPR and OPR of 5 (BPR5) and 36, respectively. At design, the TET was set to 1,360 K with a maximum limit of 1,778 K during take-off (case 5). With the required thrust during TOC, the SFC achieved a value of 16.31 g/kNs. In order to attain this performance one fan stage, three IPC, ten high pressure compressor (HPC), two high pressure turbine (HPT) and five LPT stages were needed. This resulted in a total weight of almost 2,000 kg. Further cycle parameters are listed in Table 2 and correspond to values of a conventional two-spool turbofan.
Table 2.
Cycle design parameter for top of climb operating point (case 1).
Ultra-high bypass ratio engine
To determine the appropriate BPR for a future engine for the flight mission and aircraft, a sensitivity study regarding SFC and total engine mass was performed. Figure 4a shows the SFC for a conventional BPR5 engine and, in case of the UHBR powerplants, the SFC changes for increasing BPR. At high BPR, the SFC improvements stagnated and a further increase of the BPR was not reasonable. The improvements in SFC, however, had to be balanced with the aircraft design as the UHBR engine mass increased, see Figure 4b, mainly due to the higher fan module weight.
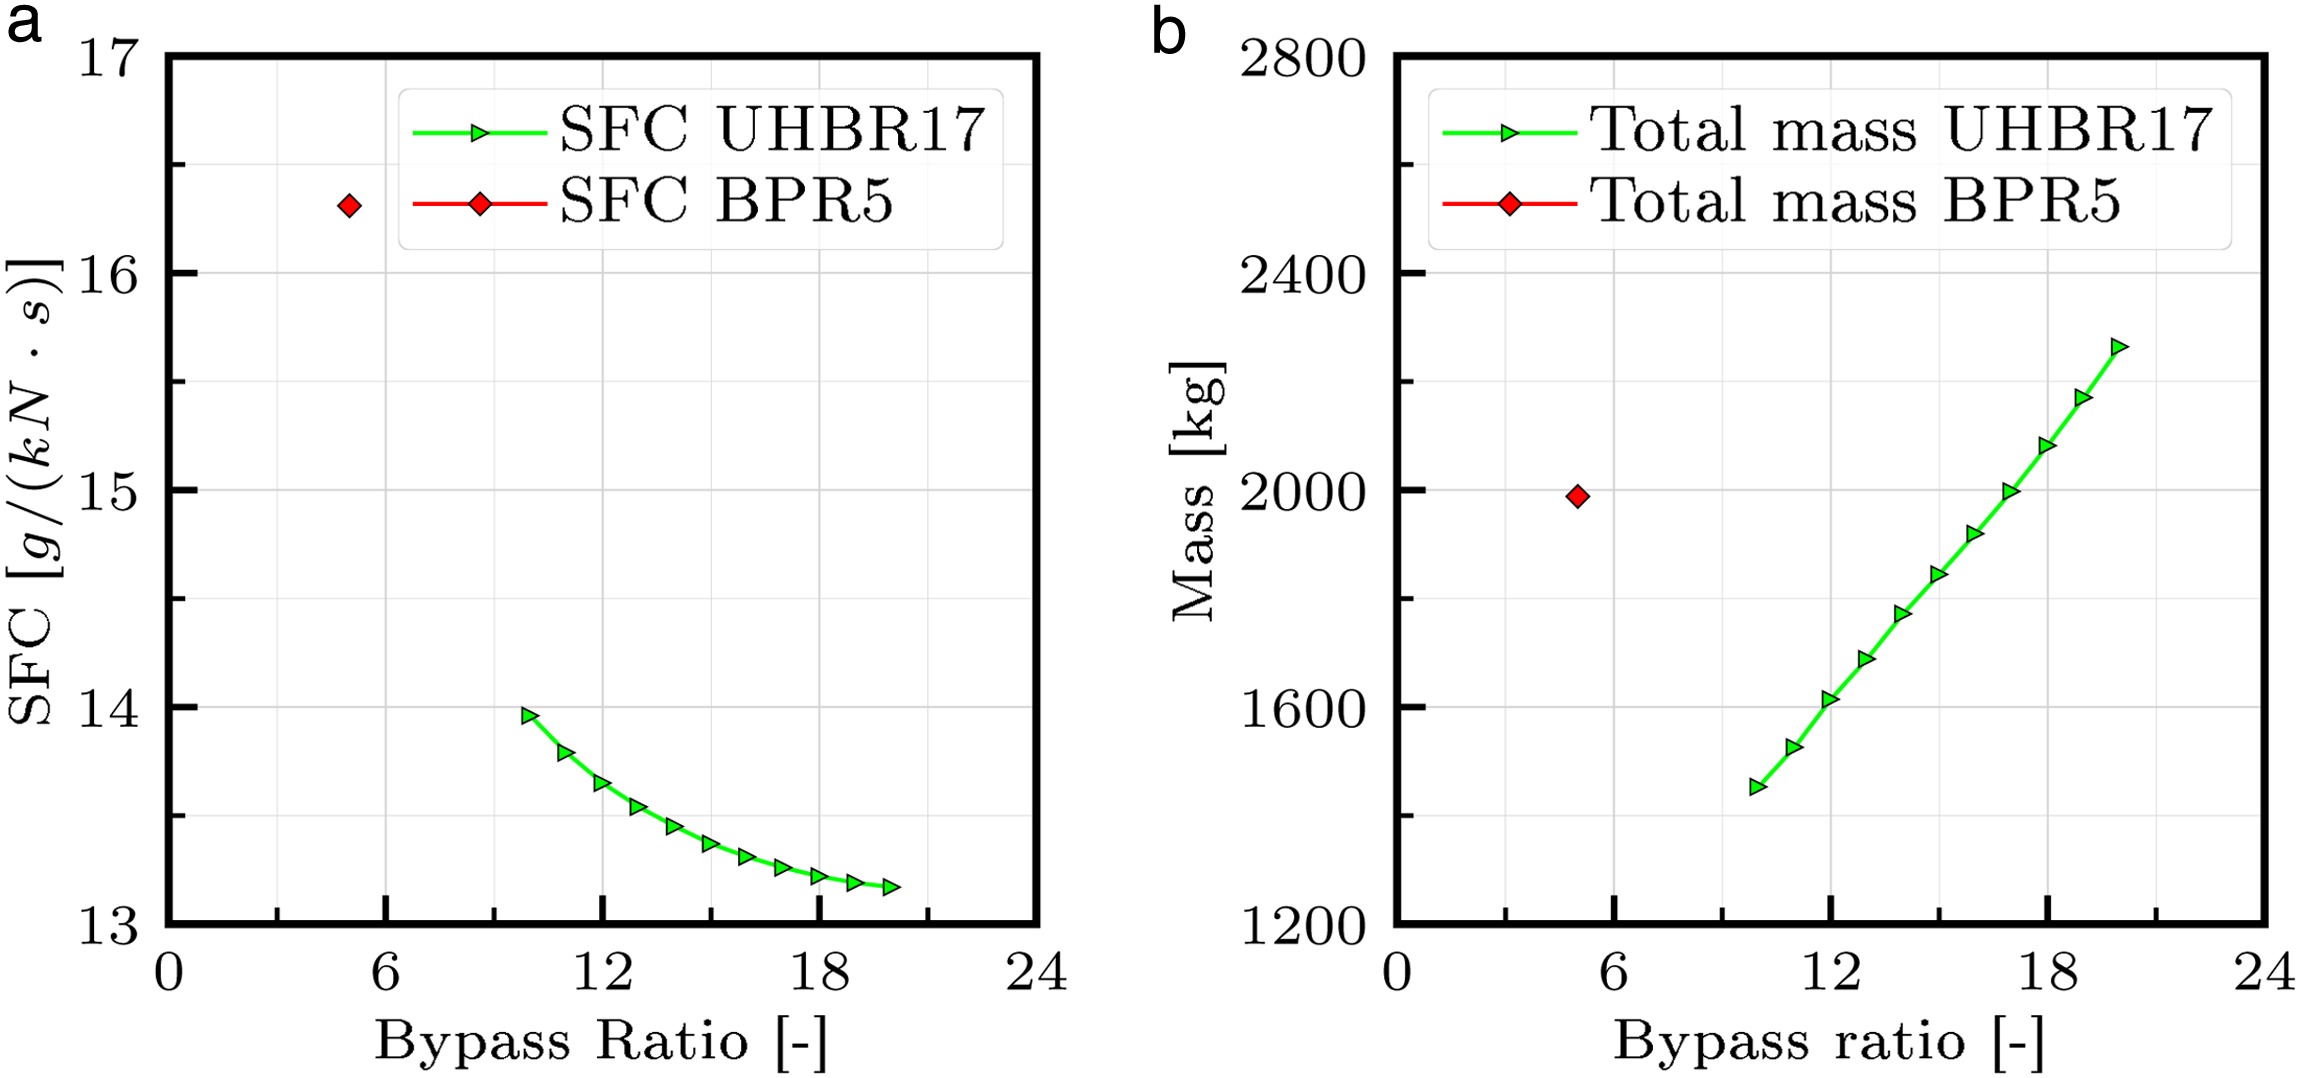
As a reasonable compromise, a BPR of 17 (UHBR17) with an OPR of 70 was chosen. This also followed the trends of Daggett et al. (2003) and Hall and Crichton (2006). The high OPR was achieved by higher pressure ratio per stage in the booster and HPC (1.35 and 1.5) compared to the BPR5 engine. The TET at design was set to 1,750 K with an SFC of 13.26 g/kNs. The higher OPR combined with a higher TET resulted in an increase of core efficiency by 5.1% when comparing the BPR5 to the UHBR17 engine. The SFC improved by 18.7%, as indicated in Table 2, which is comparable to Daggett et al. (2003). Thus, SFC improvement is a result of the 8.7% higher propulsive efficiency and 5.1% higher core efficiency for the UHBR engine. The design results in an FPR of 1.41 which is also in accordance with other references (Hall and Crichton, 2006). The low pressure fan system was characterized by a low rotational speed with a gear ratio of 3.3, which is similar to recent GTF engines.
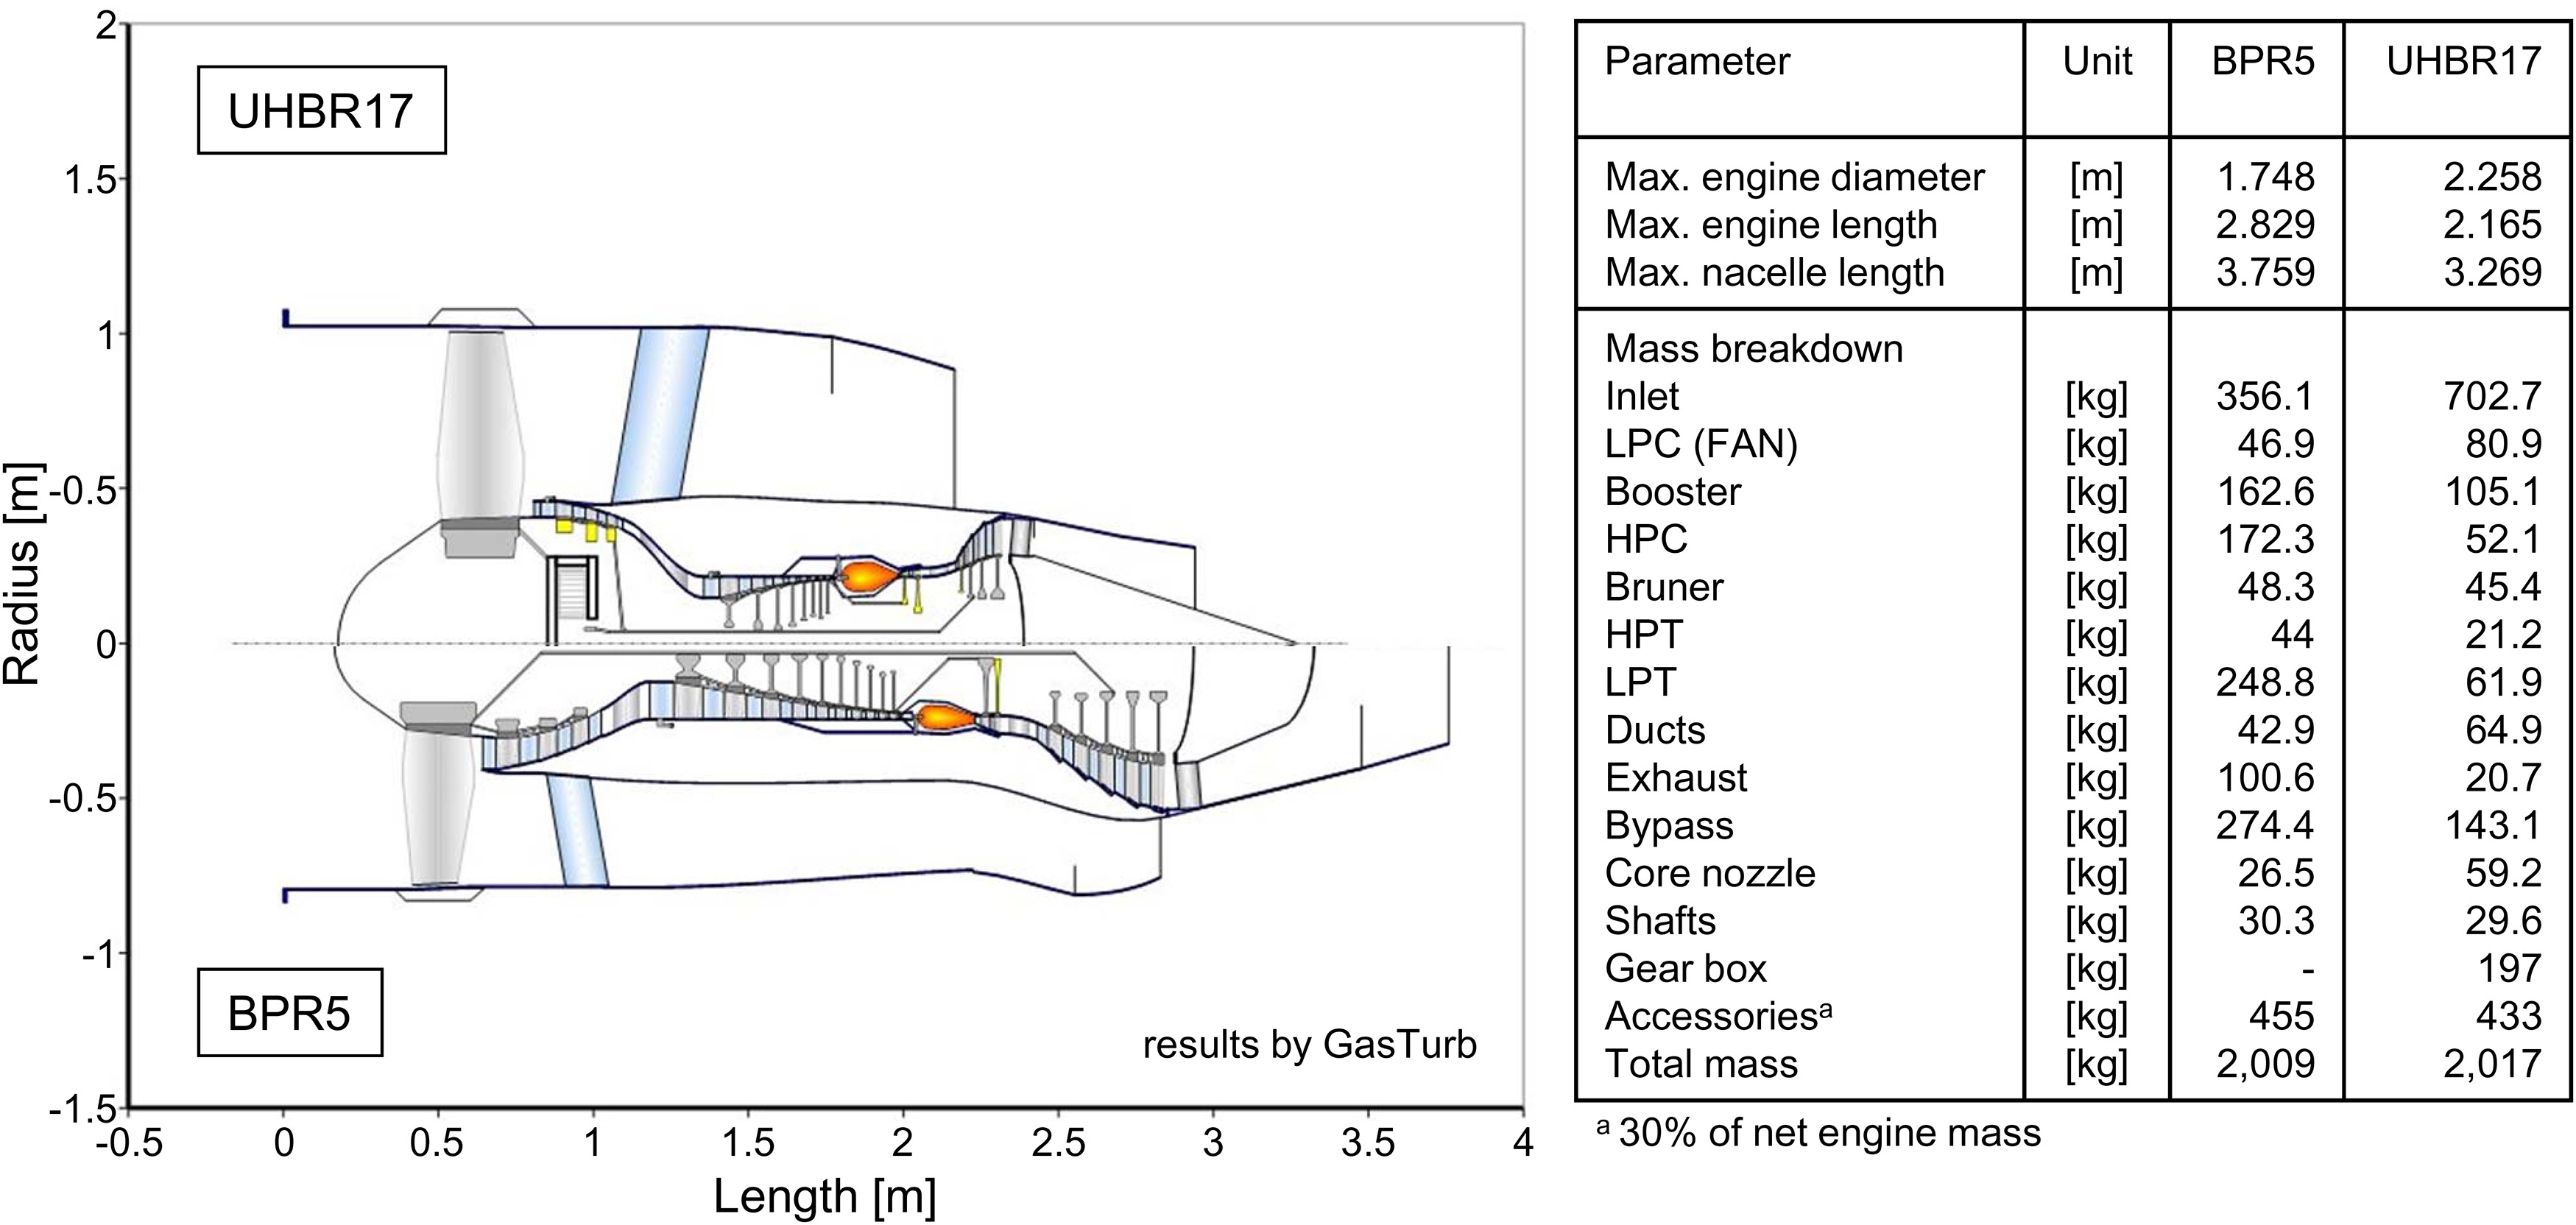
Figure 5 shows a schematic comparison of the dimensions of the two engines. The extent of diameter increase is influenced by the core diameter. However, the diameter of the UHBR17 engine is larger compared to the conventional engine, which may be expected as BPR increases. By applying similar material technologies (technology level 2025) to both engines, the different pressure ratios per stage led to the typical number of stages of today’s engines. The more stages per module, the larger the corresponding masses as indicated by the HPC and LPT mass. As a result of the larger engine length, the mass of the bypass nozzle of the BPR5 engine is increased compared to the UHBR17. Summing up, this provokes only a small deviation between both engine masses. However, the absolute values are smaller compared to the weight of conventional engines (Braeunling, 2009) due to the lighter materials used in this study.
Ultra-high bypass ratio engine with variable bypass nozzle area
The third engine was the same UHBR engine from the previous section, but additionally equipped with a variable bypass nozzle and hence not completely redesigned. At design point, both engines were therefore similar (see previous section). For the relevant off-design AEO flight phases (case 2: cruise, case 5: take-off, case 8: landing), the bypass area was modified in a sensitivity study. This is presented in the next section. The aim of this study is to show the performance and operability impact of a turbofan UHBR engine with an additional variable bypass nozzle.
Engine performance at off-design
Firstly, the off-design performance of the BPR5 and UHBR17 engine without a variable nozzle was compared followed by the above-mentioned SFC sensitivity study in case of a variable nozzle for the UHBR17 engine. In open literature, e.g. Daggett et al. (2003), an increase of thrust when opening the nozzle was reported. Therefore, an investigation was performed to estimate the thrust change for the UHBR17 engine with variable bypass nozzle and to highlight the performance change in the case of an engine retrofitting.
Comparison between BPR5 and UHBR17 engine
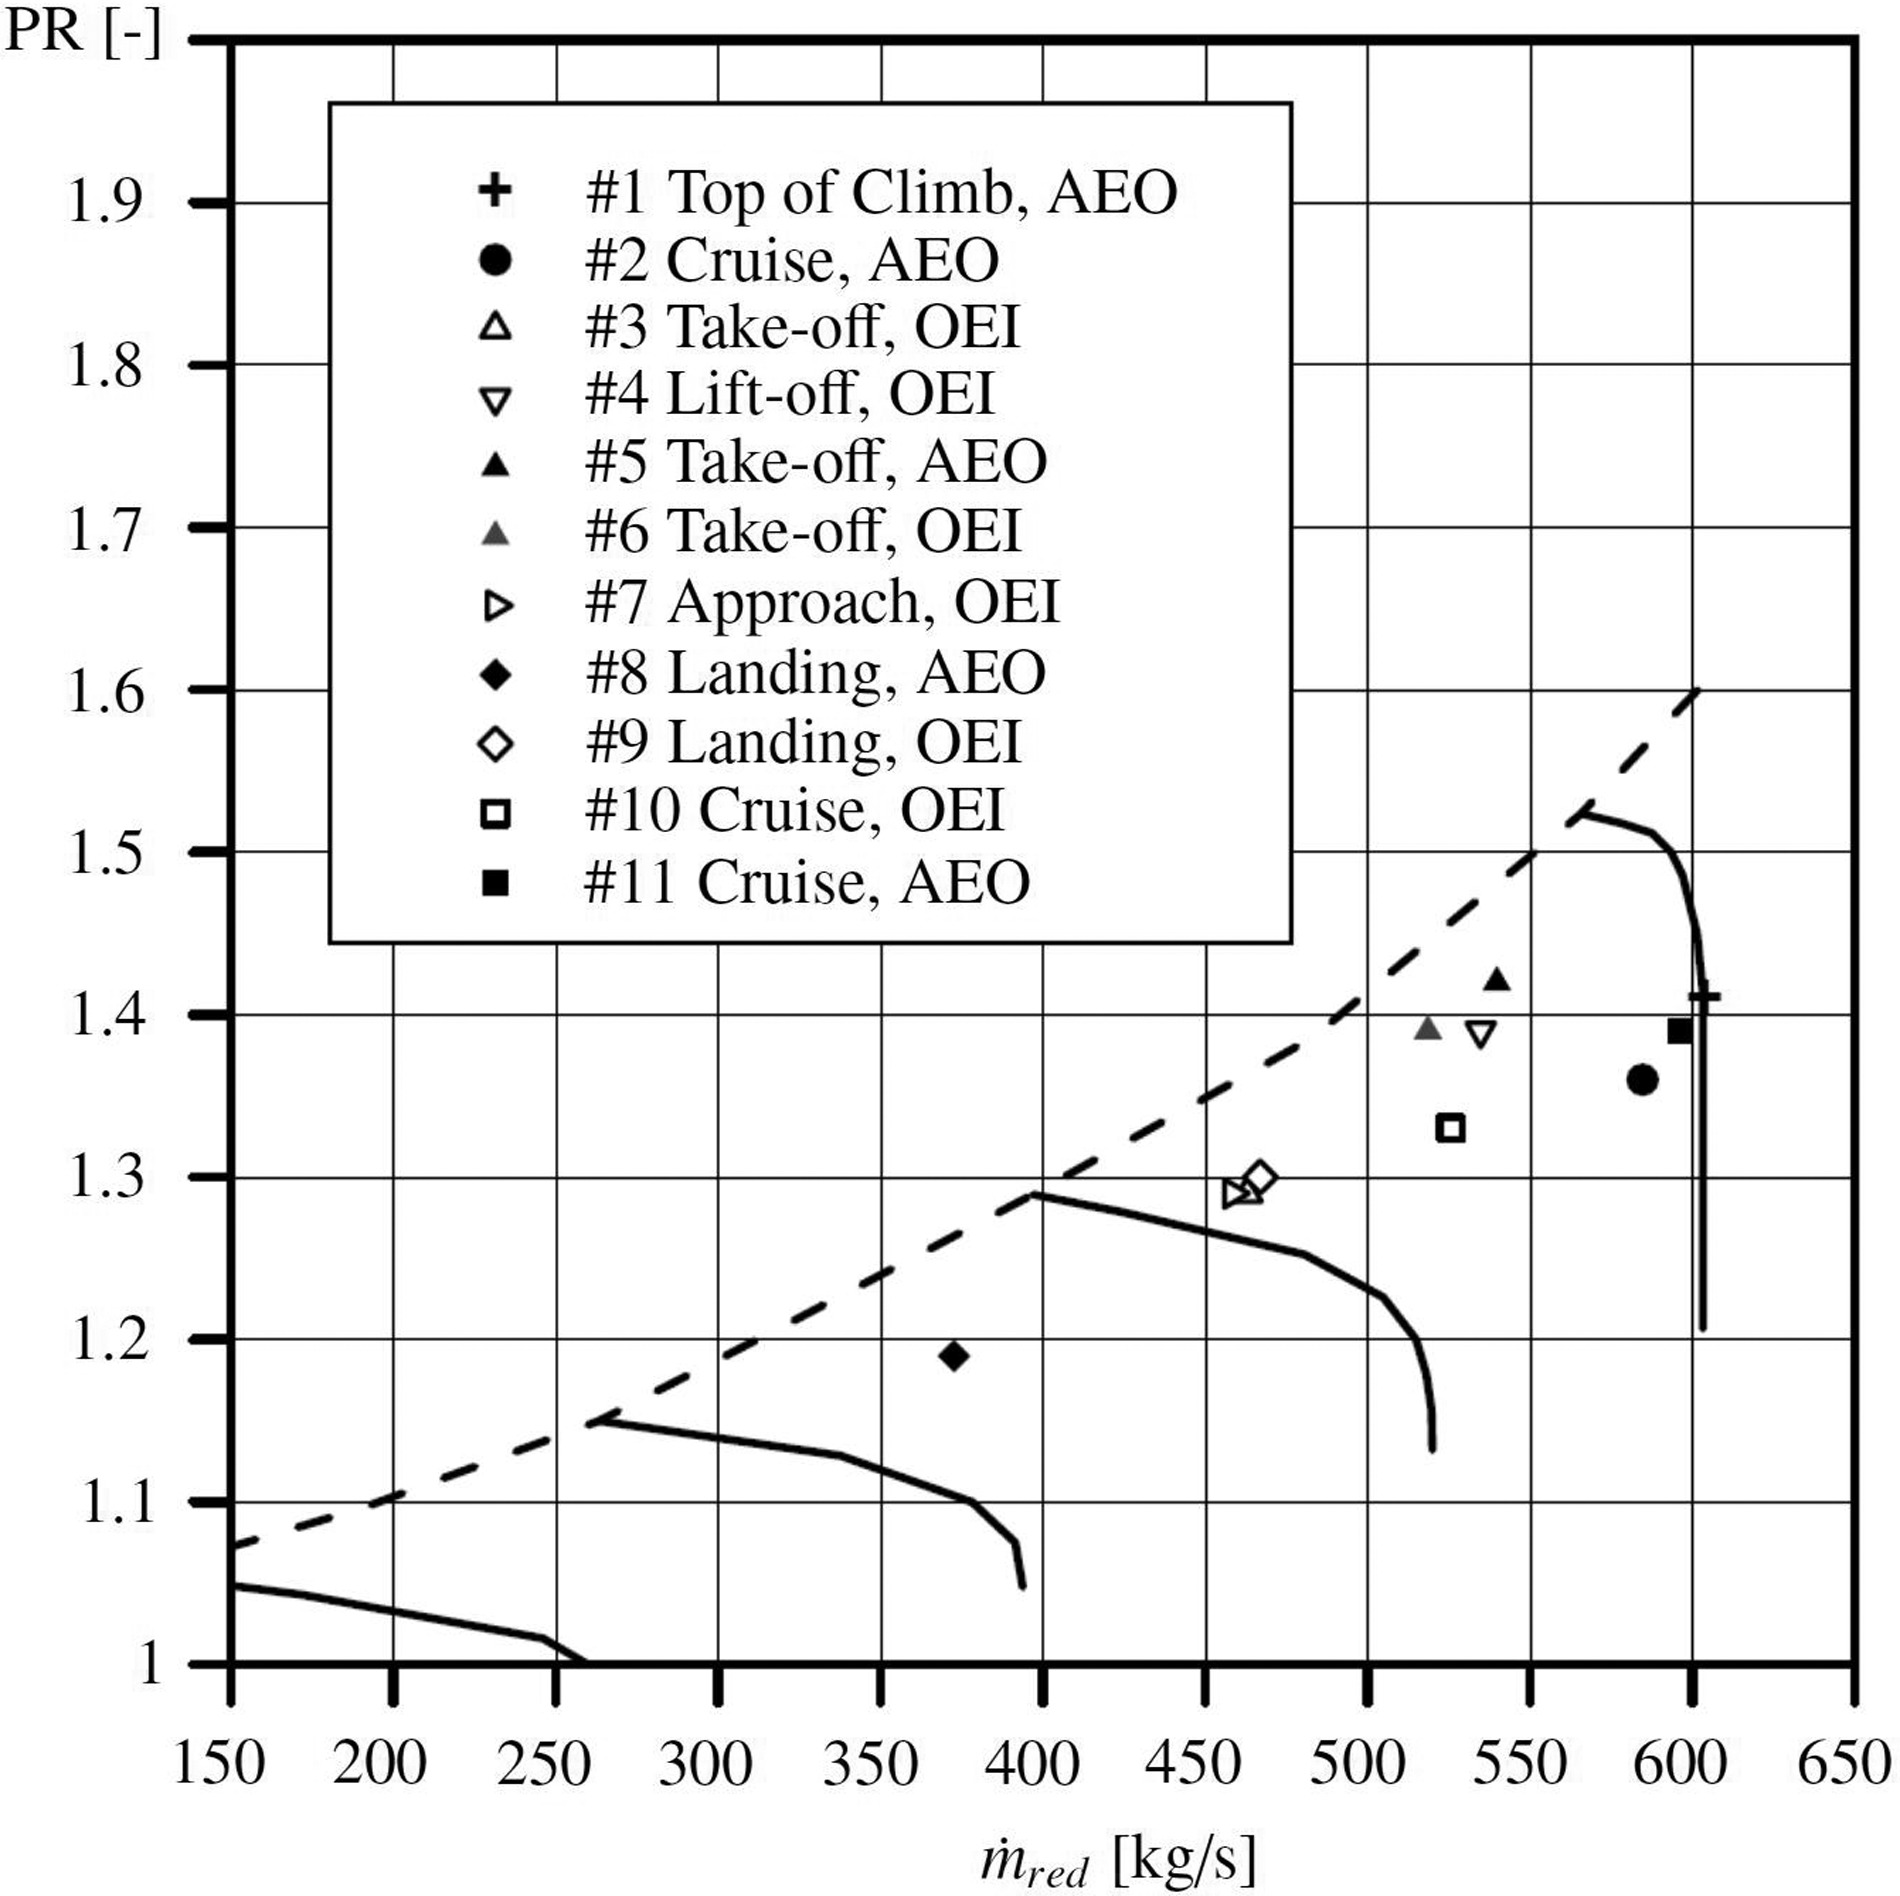
As stated earlier, the engines have to operate safely in all operating points given in Table 1. Figure 6 shows the scaled GasTurb fan map for the UHBR17 with all operating points which have a sufficient surge margin. This also applies to the safety relevant operating points. All points include their specific power offtake for the additional high-lift system. In the following, the operating points cruise (case 2), take-off (case 5) and landing (case 8) are investigated and noted in Table 3.
Table 3.
Selected cycle parameter for the cases 2, 5 and 8.
The main parameters directly affecting the thermal efficiency, TET and OPR, were used in this study to design the two engines with different technology levels. With the larger TET and OPR, the UHBR engine has a 5.1% higher thermal efficiency. During cruise condition, the bypass mass flow increases by more than 90% and hence, a favorable effect for specific thrust for the UHBR engine is the result (40.3% lower). This increases the propulsive efficiency by 8% and the SFC drops by 18%. This corresponded with Daggett et al. (2003), where it is reported that UHBR engine architectures can have a large influence on the SFC of short-range operating aircraft. Furthermore, the fan surge margin increased by 8.2%.
During take-off, the TET for the UHBR17 engine was high, but still around 2,000 K which is, referring to Grieb (2004), acceptable during the take-off phase. The same applies to the fan surge margin, which in accordance to Braeunling (2009) should be higher than 15%.
To summarize, for an UHBR engine design, a much higher engine mass flow is required to achieve the desired total thrust, while TET and OPR have to bring the thermal efficiency up for driving the bypass via LPT. This resulted in a SFC reduction between 18% up to 40% depending on the operating point when compared to conventional engines.
Variable area bypass nozzle effects on engine performance and operation
In order to estimate the minimum in SFC, the bypass nozzle area was varied between minus 5% and plus 15%. Values higher than 15% did not result in significant changes in SFC.
For constant thrust level the bypass mass flow increased by 8.3% when increasing nozzle area by 10% as illustrated in Figure 7a. This drop in nozzle capacity results in a lower fan pressure ratio. This will, in turn, lead to less sensitivity to crosswind induced inlet separation and higher stability margins at take-off. This can be observed in the surge margin of the fan, which increased for the scaled GasTurb fan characteristics in this study.
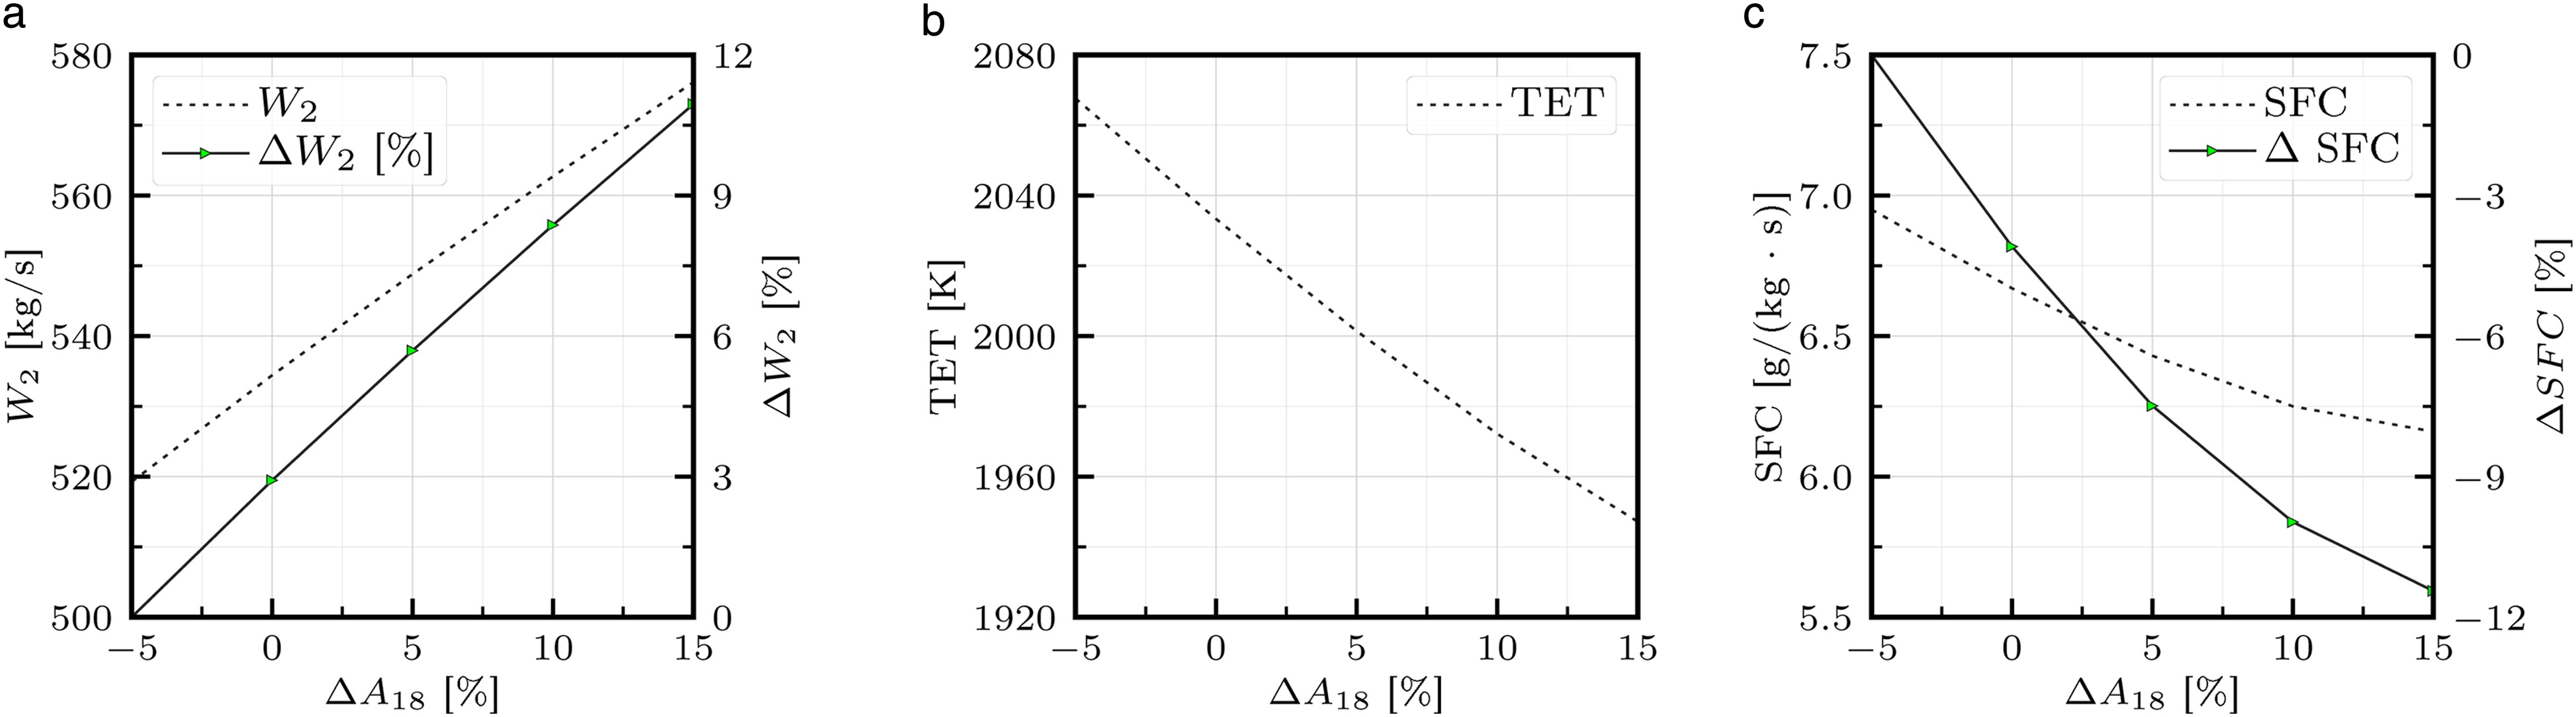
The drop in core mass flow is determined by the component capacities downstream, particularly the core nozzle. This drop resulted in a reduction of surge margin for the IPC (not shown here) by 12.9%. Therefore, about 85 K lower TET was required (Figure 7b) and hence, less fuel flow. The result was that the LPT had to provide less power to drive the low pressure system. Therefore, the SFC dropped by almost 7.7% during take-off as seen in Figure 7c. Within the sensitivity study cruise (case 2) and landing (case 8) were taken into account and are documented in Table 3.
As already stated in Michel (2011), the thrust can be increased by opening the nozzle. This is the case when allowing a higher rotational speed which must be secured by having sufficient burst margins. Hence, the limiting cases are the operating points at high speed levels, i.e. at take-off. Therefore, a study has been performed that investigated the amount of thrust when running the engine at higher speeds while taking into account sufficient stress and burst margins. Table 4 summarizes the change in thrust. The limiting character at take-off behavior is the reason why at case 5, the required thrust matches with the maximum available.
Table 4.
Change in thrust in case of maximum rpm and bypass nozzle area change for the cases 2, 5 and 8.
During landing (case 8), a much higher thrust, hence rotational speed, could be provided by the UHBR engine, even without a variable bypass nozzle. By increasing the bypass area during landing by 15% the thrust could be raised by 5%, which can be used for safety reasons or for decreasing SFC. Regarding fan surge margin, opening the fan nozzle again showed the beneficial effect. During take-off (case 5), the engine behaved in a similar manner which can be seen in Table 4.
In conclusion, the operational behavior for take-off and landing were reconciled by the investigations of Michel (2011). Generally, opening the bypass nozzle resulted in a larger fan surge margin. It was beneficial for the safety during take-off and landing conditions but adverse for cruise condition.
Aircraft considerations
For the DOC analysis as criteria for the engine assessment, the aircraft CRC 880 was redesigned for the three engine variants. The resulting main aircraft parameters are listed in Table 5 and also include the fuel masses for the design mission. For comparison purposes, an aircraft with conventional engine arrangement (CONEA) with UHBR17 engines is additionally presented. The relative parameter changes of the UHBR versions compared to variant BPR5 is presented in Figure 8, where the SFC modifications for different flight situation are also shown.
Figure 8.
Changes of main aircraft and engine parameters of UHBR concepts to the conventional engine BPR5.
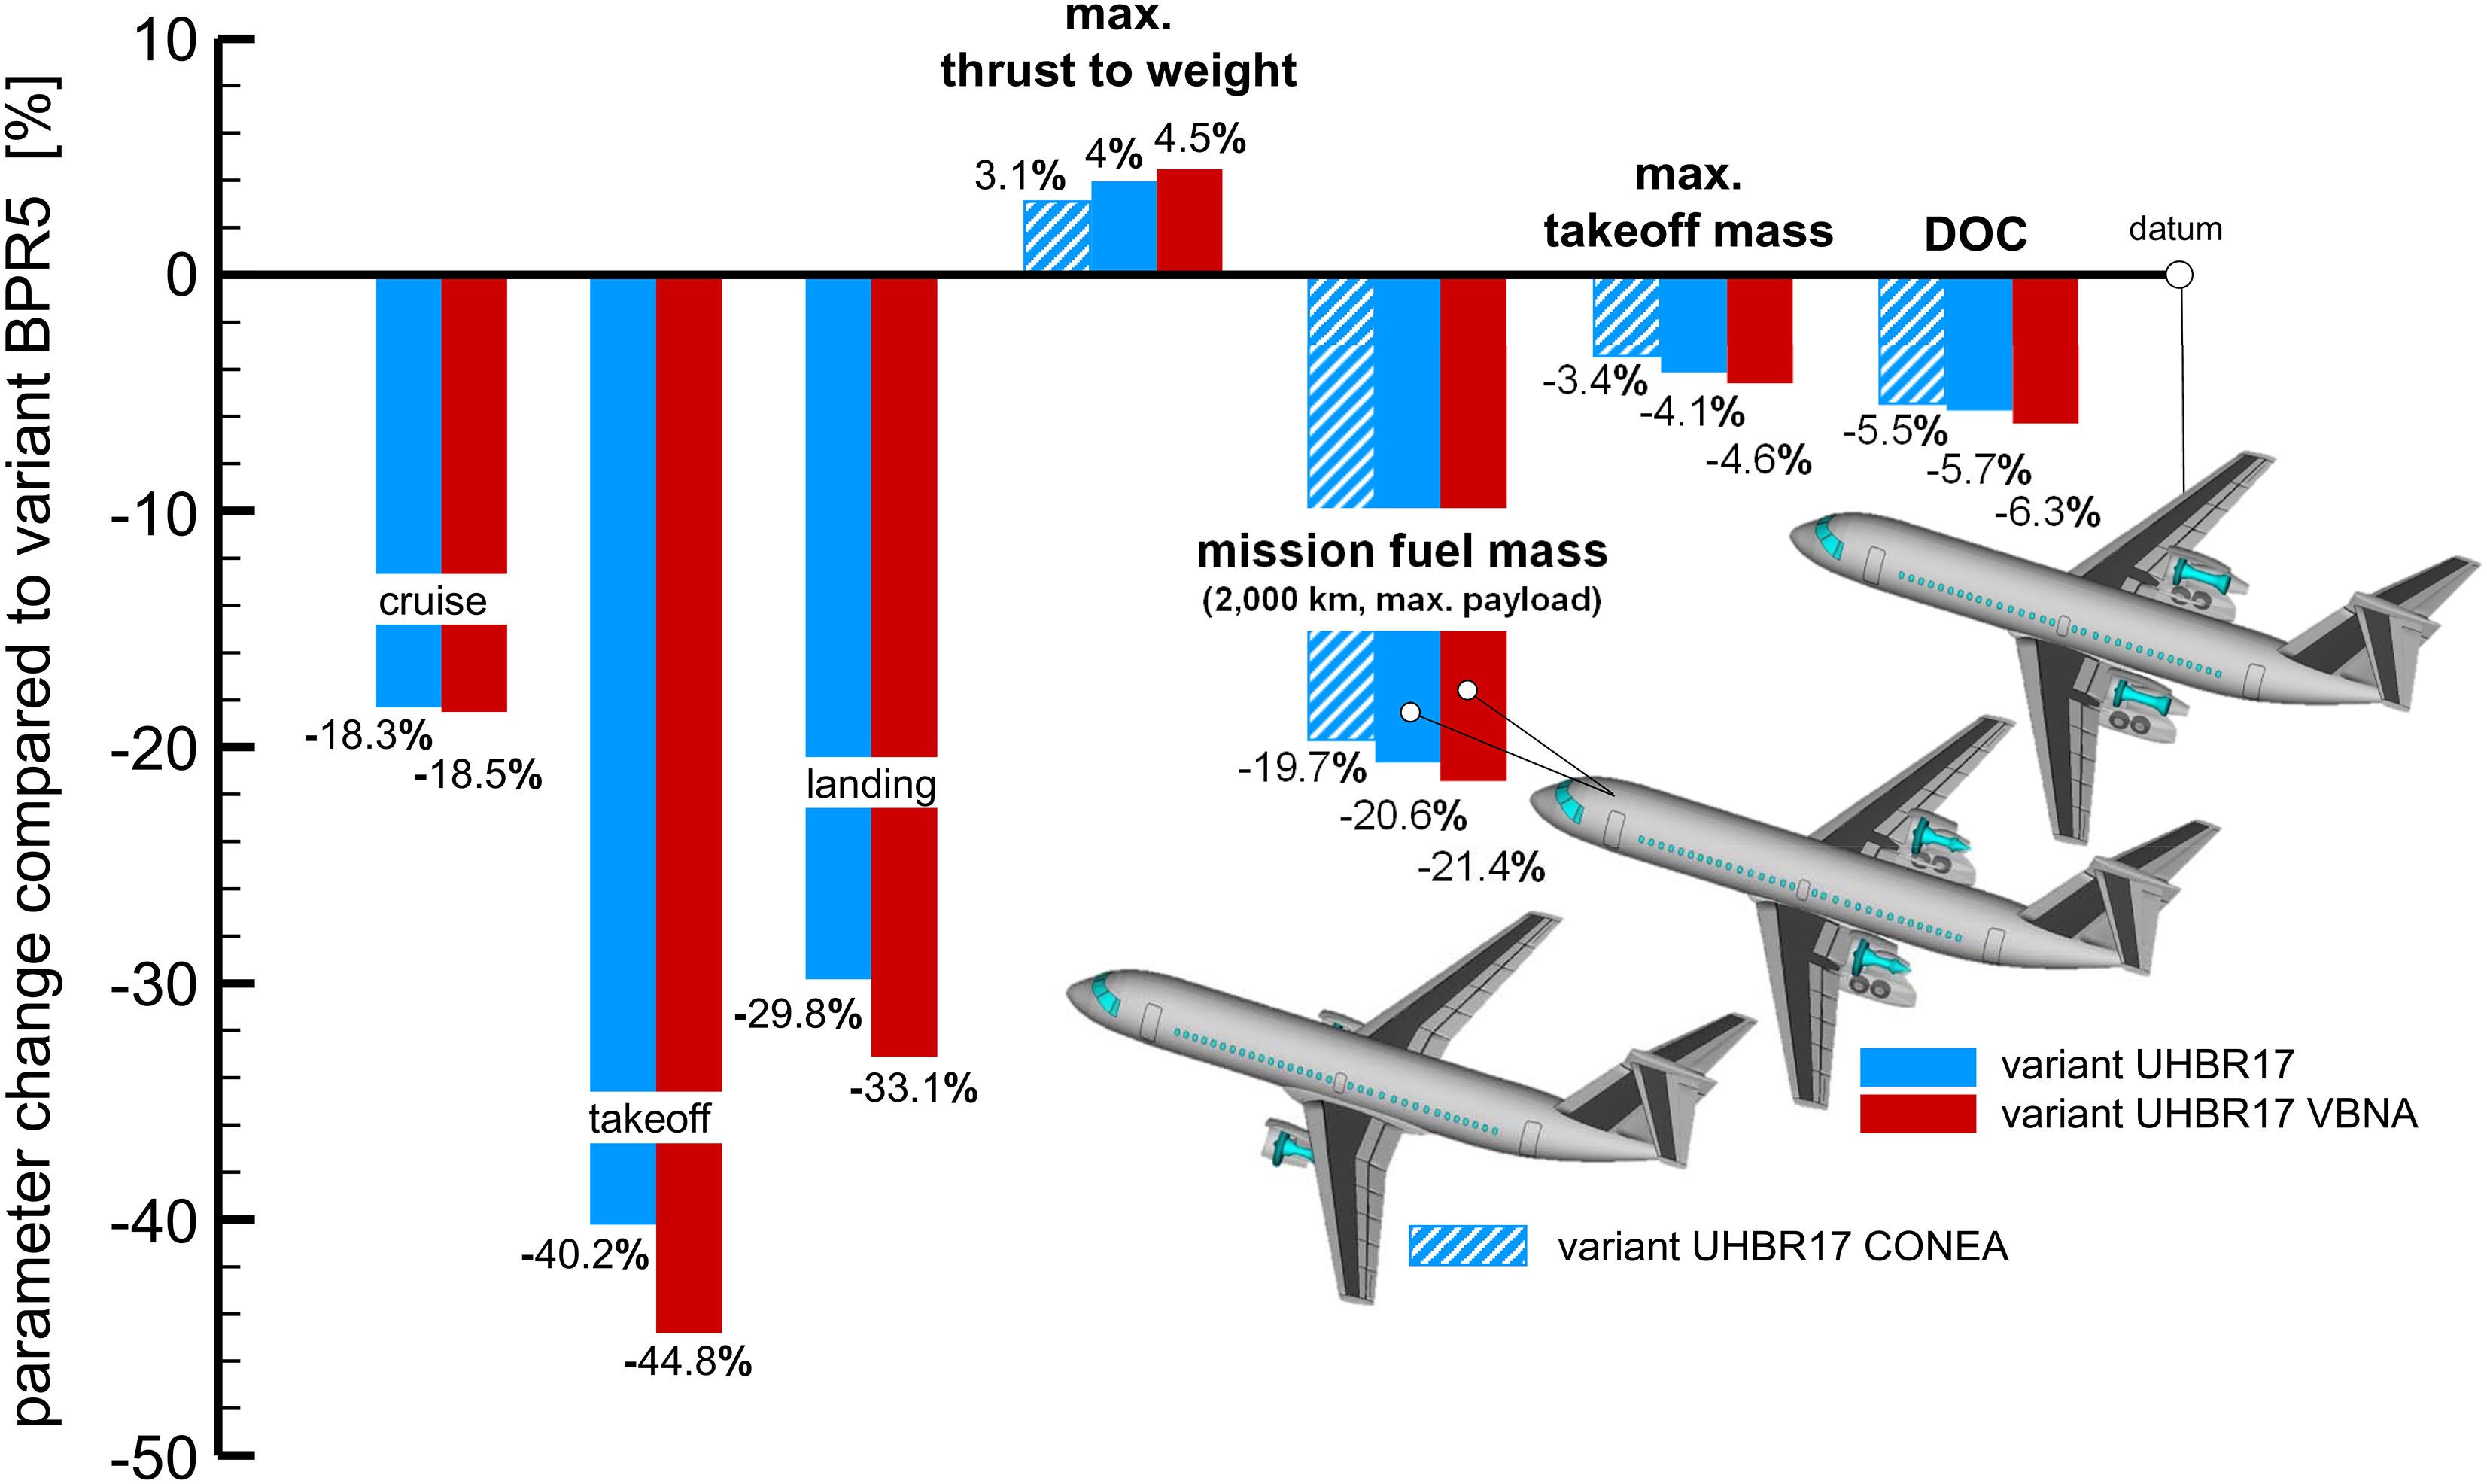
Table 5.
Design data of the CRC 880 aircraft REF3 with the different engine concepts.
asea level, BLC high-lift system off, bengine, nacelle and pylon, cdesign mission, d370 km range to alternate destination, 30 min holding in 1,500 ft and 5% of trip fuel, eaccording to cruise condition, faccording to EASA CS-25/FAR25 rules, sea level and wet runway, gsafety factor 1.429 instead of 1.667.
The DOC model is an in-house development of the IFL (Heinze, 1994) and is built like Airbus or Boeing methods (e.g. Airbus Industrie (1985)). The basic equation is
where KLFZ denotes the aircraft costs (depreciation, interest and insurance). Input is the aircraft price calculated according to Beltrano et al. (1977) from the component masses of the airframe and the engine mass. The term KKR summarizes the fuel costs which are low if the aircraft has good lift to drag ratios and low SFC values. The variable KBES represents the crew costs, KGEB the charges (landing fees, handling and navigation costs), and KW the maintenance costs for the airframe and the engine. The last portion is calculated by a method from Association of European Airlines (1989). The engine labor and material costs are estimated by regression functions as a function of maximum sea level thrust, BPR, OPR, number of compressor stages and shafts. The total costs are covered by the transport work TSKM (available seat kilometers), which is regarded as an equivalent to revenue. Normally, both parts are determined for the life-cycle of the planned aircraft. Table 6 shows the assumptions for the DOC calculation in integral form, which reflects the economic situation in the planned year of operation 2025. The basis was the detailed cost situation of 2011. It has been extrapolated with moderate inflationary factors. The fuel price was assumed to have a possible increase of 50% compared to 2011.
Table 6.
Assumed economic data for an in-service during year 2025.
For the BPR5 jet engine, this DOC parameter reached a value of 9.976 US-Cents per seat kilometer. Compared to the UHBR17 powerplant, the DOC parameter was 5.7% lower for the UHBR17 engine (9.403 US-Cents per seat kilometer). Although the drop in SFC is around 18.3% during cruise and for the necessary mission fuel −20.6%, see Figure 8, the DOC affected this less due to the relative small share of the fuel costs on the total operating costs (approx. 20%). The main reason is the low design range given by the defined scenario of the CRC 880. The fuel savings expected from the unconventional engine position are also low, with approx. −1%, which shows the comparison with a classic under-wing arrangement of the UHBR engine (Figure 8, UHBR17 CONEA). The reason is clearly the necessary pylon size for accommodating the main landing gear, combined with a higher pylon mass. This disadvantage should be changed through a fundamental revision of the wing plan form in further CRC research activities. However, a drop of more than 5% shows the potential UHBR engines will have compared to nowadays conventional jet engines.
On the other hand, the drop in DOC parameter from UHBR17 to UHBR17 with VBNA (9.347 US-Cents per seat kilometer) is relatively small at only 0.6%. It should be mentioned for a judgment of this value, that a DOC improvement of 1% denotes an increase of airline’s profit by 20%. The reason for this is the high thrust needed for reaching the runway length, in combination with the TOC requirements, which leads to engines running highly throttled in steady flight during cruise (65% of available thrust). So, the fan nozzle is only slightly closed and the engine operates nearly in the same conditions as the variant UHBR17 without a variable nozzle (SFC improvement −0.2%). An increase to a greater power setting of 90% would improve the SFC benefit to approx. −3.4%, which is significantly higher. In future studies, possible engine weight reductions due to a higher rotational speed in combination with a variable fan nozzle should be investigated. Similarly, this applies to a better matching between a variable bypass nozzle and the fan stage for various operating points. This further influences the SFC and therefore, the DOC parameter in a positive manner and should be investigated more thoroughly.
The investigations on the aircraft level assumed that the actuation system for the variable fan nozzle could be realized in a weight-neutral manner for the propulsion unit. Approaches could be the use of a modified mechanism of the thrust reverser or variable lips of a Chevron nozzle by shape memory alloy actuators. The last idea of United Technologies Research in cooperation with NASA can change the on-demand nozzle exit area by up to 20%, which would cover the operational range of the CRC engine. To judge the weight effect on the overall aircraft level, a sensitivity analysis was carried out. The result is that a nacelle mass increase of 50 kg increases the DOC value around 0.0162 US-Cents for the CRC design task. This means that the variant VBNA would lose its DOC advantage of −0.6% compared to the variant UHBR17 if the actuation system including modified flaps increases the nacelle mass to 168 kg (+24% of the total nacelle mass). The main effect is the increase of the powerplant price, which raised the aircraft costs by around 1.15%. The effort of the additional fuel consumption affects the life-cycle fuel costs only by approximately +0.58%.
Initial engine noise assessment
The introduction of an UHBR engine comes with the expectation of a significant noise reduction on the ground compared to an engine with lower bypass ratios, due to the reduced fan pressure ratio and jet exit velocity. A disadvantage of a UHBR in terms of noise is described by Leylekian et al. (2014). As the bypass ratio increases, an efficient nacelle has to be sized accordingly. A bigger nacelle results in additional and possible unacceptable weight and drag. Therefore, the nacelle of a UHBR has to be reduced in terms of length and volume in order to keep weight and drag acceptable. The reduced length, however, reduces the liner effectiveness, both at the front and back. Some technologies to overcome this disadvantage are described in Leylekian et al. (2014). Furthermore, the exhaust may interact more easily with the flow around the aircraft. These effects have to be considered when dealing with UHBR. For the initial noise assessment in this study no liners or additional interaction effects were considered.
The following sections describe the simulation setup and the results of the initial engine noise assessment at the source, i.e. at the emission. Note, that the variable nozzle is not optimized for noise.
Simulation setup
Different operating conditions that can occur during approach and take-off were selected for the assessment. A characteristic flight condition was deemed to be at an altitude of 3,000 ft (914.4 m) and a speed of Mach 0.3. The required thrust depended on the flightpath angle, acceleration, aircraft weight, and aerodynamics. The thrust can be calculated according to the simplified balance of forces in flight direction of the aircraft
where γ denotes the flightpath angle,
Four typical flight conditions were selected for noise analysis and listed in Table 7. Note, that these so-called noise operating points differed from the operating points selected for the engine design.
Table 7.
Thrust per engine for different operating conditions at Mflight = 0.3.
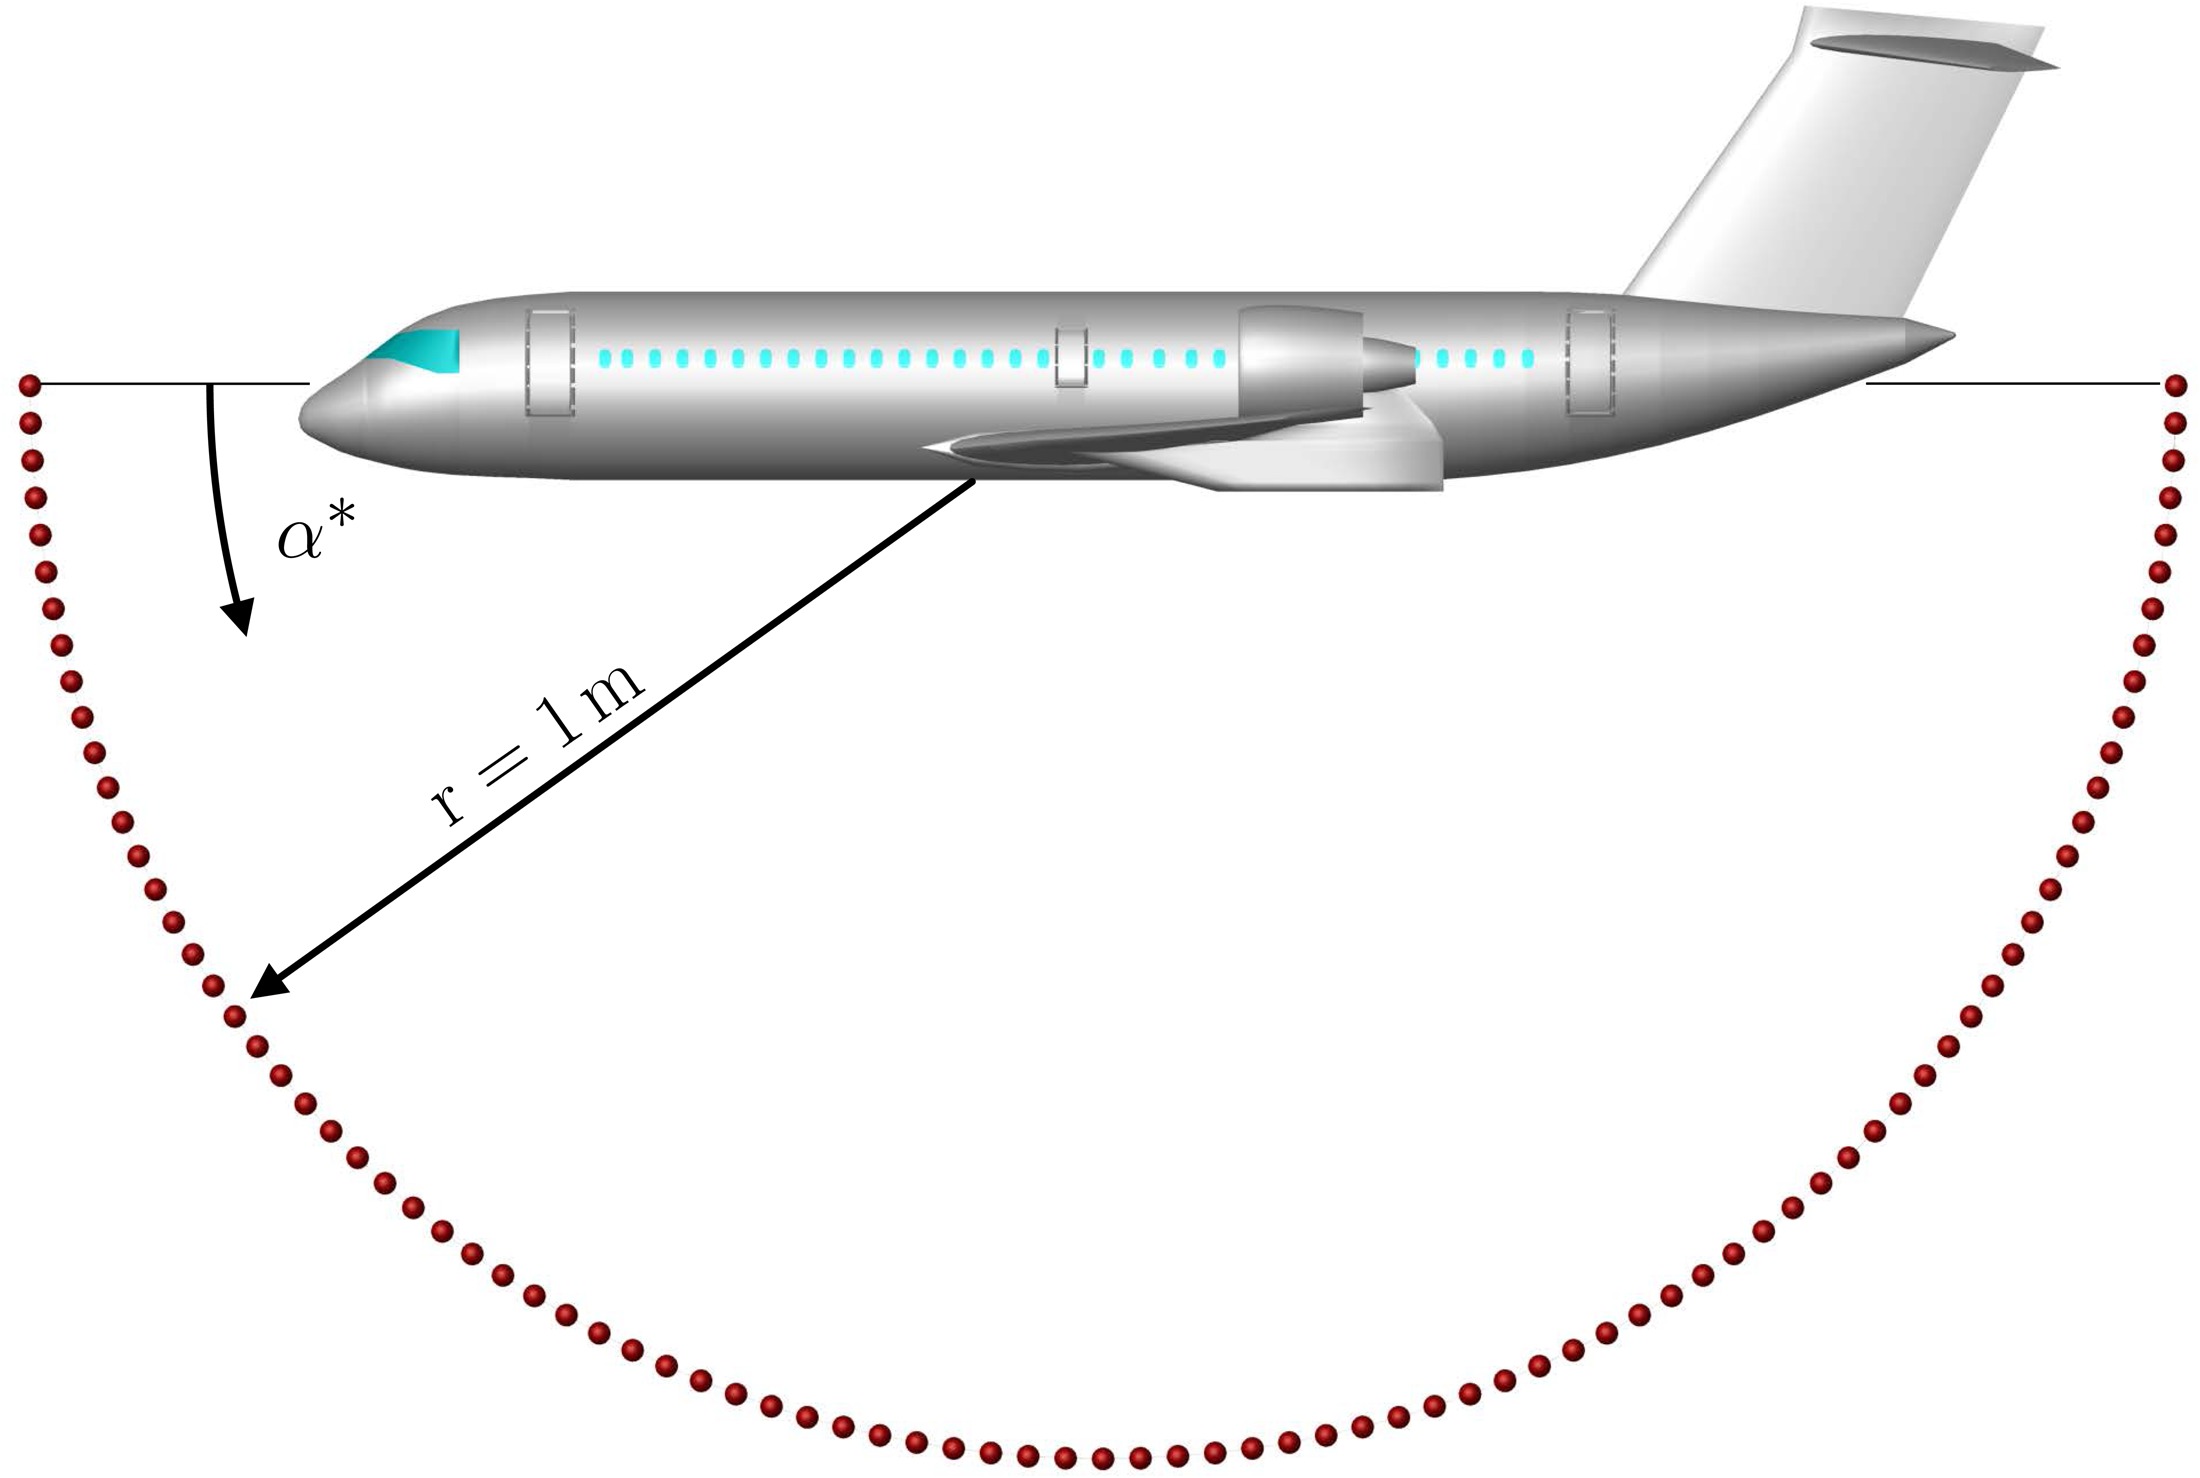
The sound emission of the engines was analyzed on a semicircle with a radius of 1 m that lay in the symmetry plane of the aircraft, see Figure 9. No propagation effects or frequency weighting, such as the A-weighting, are included for the analysis of the sound emission.
Results
The results of the engine sound emission are divided into three sections. The first section analyzes the sound shielding effect of the airframe. Secondly, the effect of the power offtake due to the high-lift system is assessed. The third section then compares all three engines at the four selected operating conditions.
Shielding effect of the airframe
The design of the CRC 880 aircraft features an engine location that offers significant shielding of the forward fan sound, see Figure 1. In Figure 10a, the directivity of the UHBR fan at operating point N4 is shown, in which the sound pressure level L is plotted against the emission directivity α*. The green line depicts the UHBR fan noise emission without shielding effects (isolated engine configuration), and the dotted gray line represents the emission with shielding effects. The directivity reveals a noise reduction of up to 25 dB in the forward direction. However, this noise reduction cannot be directly assigned to ground noise levels because of the remaining fan noise in the rearward direction, which is not influenced by shielding.
Figure 10.
Effect of shielding at operating point N4: (a) directivity, (b) spectrum at 60°, (c) spectrum at 135°.
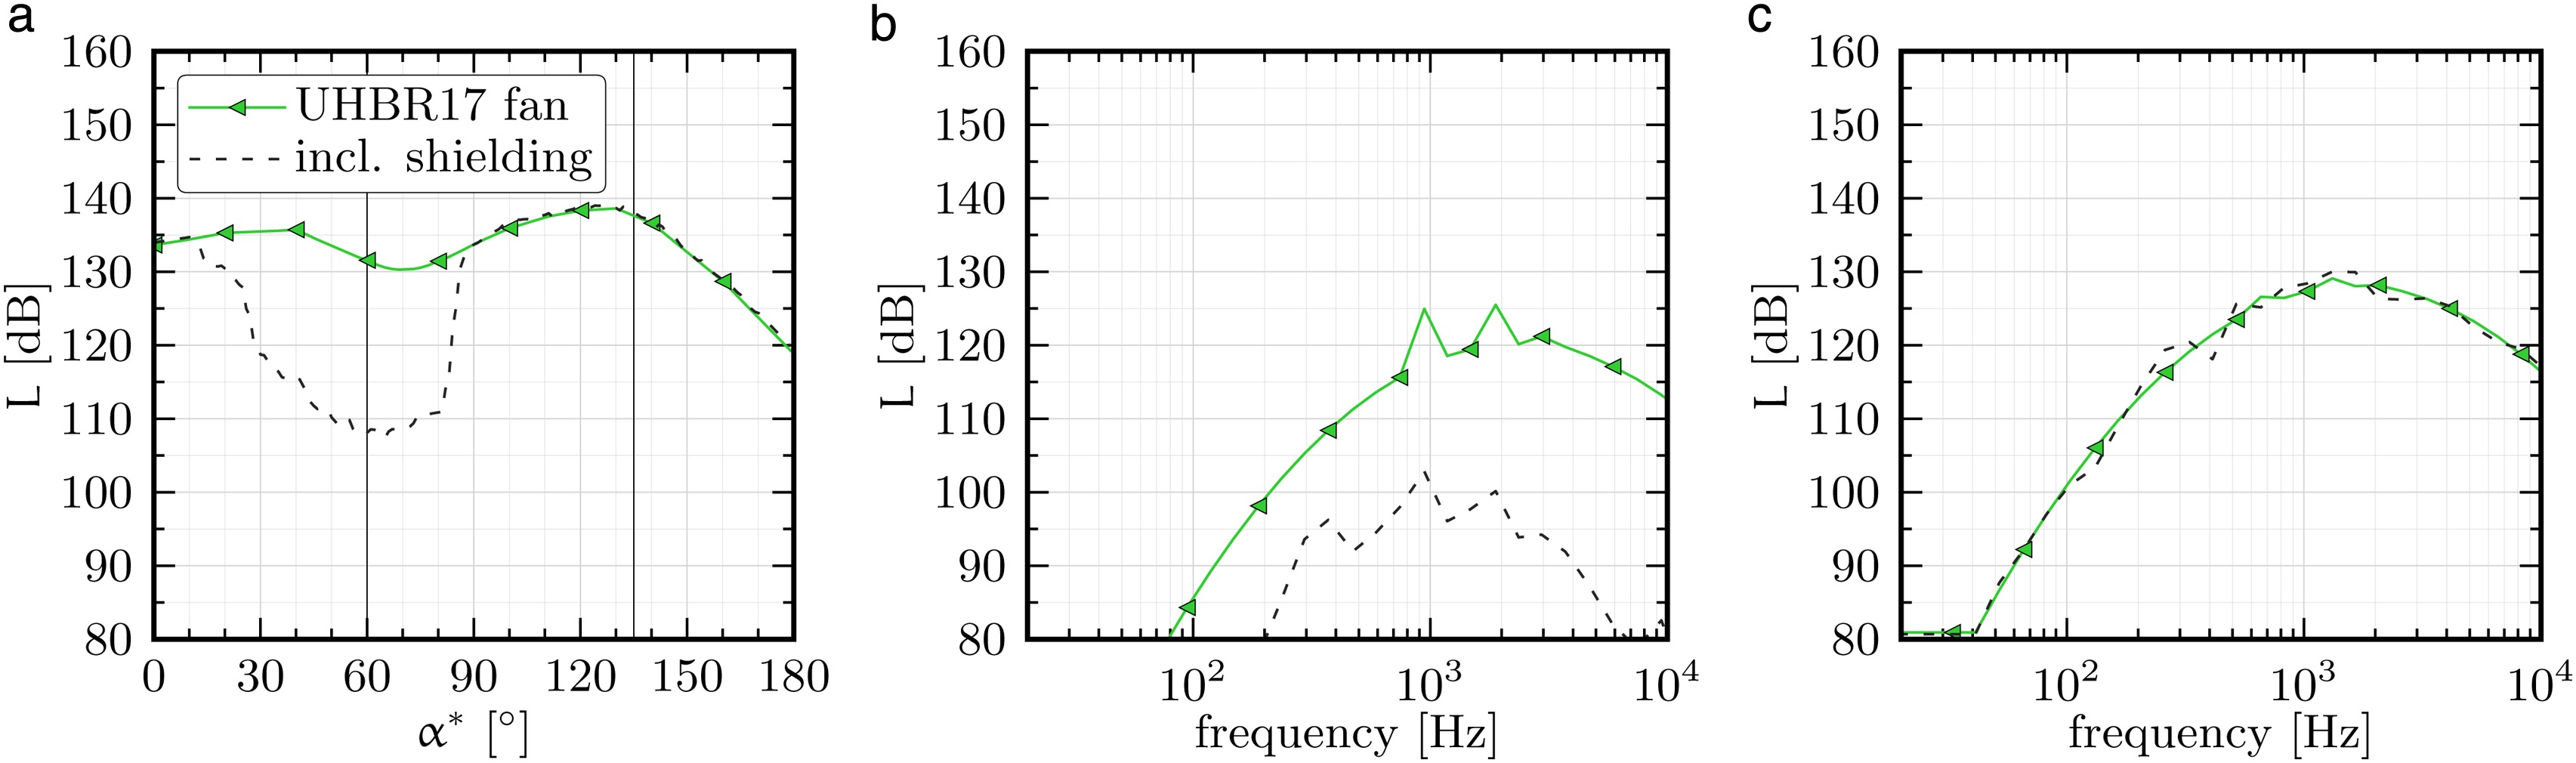
In Figure 10b and c, the spectra at 60° and 135° are shown, where the sound pressure level L is plotted against the 1/3-octave frequency bands in logarithmic scale. The spectrum at 60° indicates an increasing shielding effectiveness for higher frequencies. This is related to the ratio between the characteristic length of the object and the wavelength with its corresponding frequency. Generally, the greater the object compared to the wavelength, the better the shielding effectiveness is. For this aircraft, the projected wing chord can be seen as the characteristic length which relates to a frequency of ∼170 Hz. For sound above this frequency, the shielding effectiveness increases. As there is no object in the rearward direction, the shielding effect at 135° is negligible.
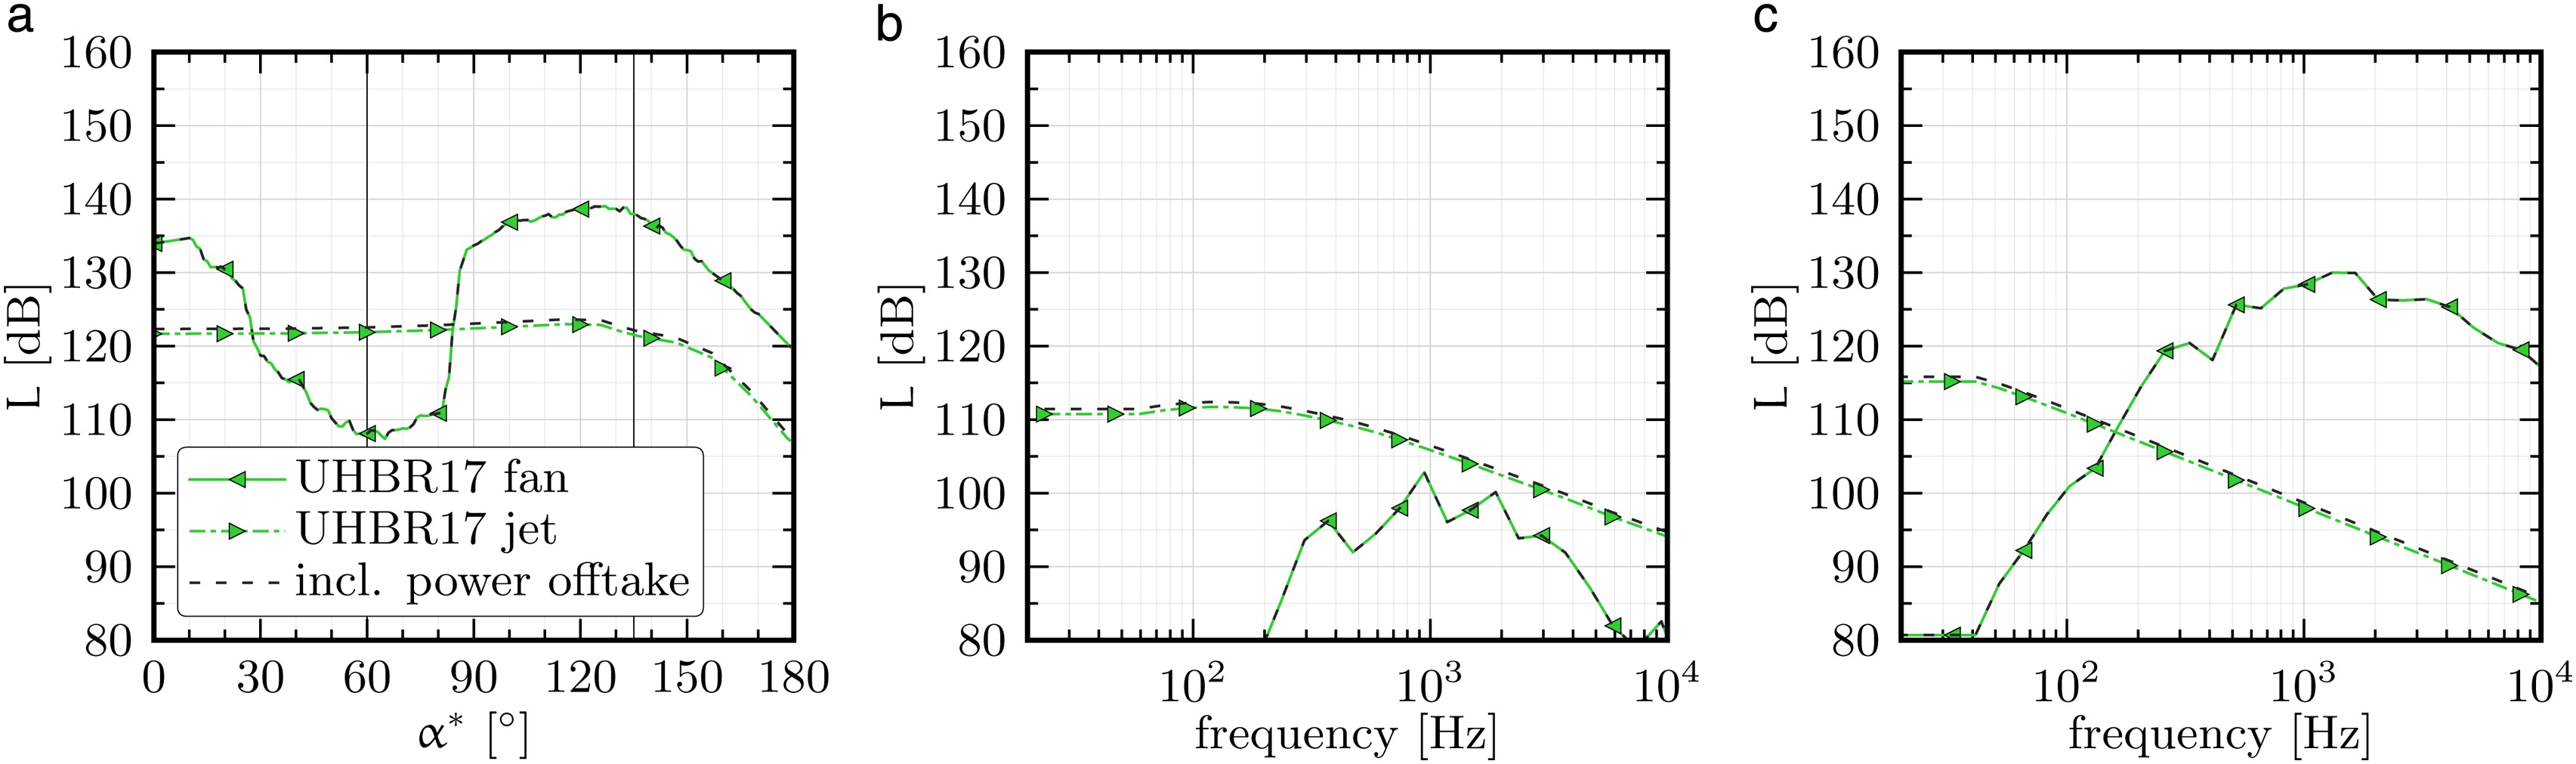
Effect of power offtake from the engine
Figure 11 shows the effect of power offtake at operating point N4 (Table 7) in the form of a directivity plot (a), a spectrum plot at 60° (b) and 135° (c). The dark green line depicts the UHBR17 fan, and the light green line the corresponding jet. The dotted gray line depicts the effect of maximum power offtake. As can be seen in the directivity plot, the effect of the power offtake on the engine results in a jet noise increase of less than 1 dB. As the jet noise is not the dominant sound source on the ground, this increase is negligible. It becomes even less important if the human perception is taken into consideration, where low and high frequencies are less relevant than frequencies in the mid range. Due to the accuracy of the engine noise model itself, it is anticipated that the effect of the power offtake can be neglected within the parametric aircraft noise prediction. It is therefore not further considered in the following section.
Comparison between the engine sound emissions
The directivity and the spectrum at 135° were evaluated for all three engines at the four operating conditions listed in Table 7. The components of the conventional BPR5 engine are depicted as red lines for the fan, and orange lines for the jet. The UHBR engine is depicted as dark green and light green lines, respectively. The effect of the variable nozzle is shown as dotted gray lines.
From the directivity plots on the left side of Figure 12 it can be seen that the UHBR is generally quieter than the BPR5 engine. Due to the shielding in the forward direction, the relevant directions are between 90° and 150°. In this area, the difference between the fan sound of the UHBR and the BPR5 ranges from about 7 dB at low thrust settings (operating point N1) down to 3 dB at higher thrust settings (operating point N4). The reduction occurs primarily at frequencies above 1,000–2,000 Hz, as can be seen in the plots on the right side of Figure 12. At lower frequencies, the sound levels increase. These differences arise because the blade passing frequency of the UHBR engine is generally lower than that of the BPR5 engine, i.e. the spectrum is shifted towards lower frequencies. The jet sound reduction at 135° ranges from about 23.5 dB at low thrust settings (operating point N1, jet not depicted here) down to about 12.5 dB at higher thrust settings (operating point N4). This reduction is significant for the isolated jet. For the perceived noise levels on the ground, however, it is believed that the jet noise is not dominant due to the low frequencies. The reduction of jet noise may be more relevant at lower flight speeds, e.g. at initial climb during take-off, at which the jet noise is more dominant.
Figure 12.
Directivity and spectrum for four operating points as presented in Table 7. A conventional BPR5 engine, an UHBR17, and an UHBR17 with VBNA are shown: (a) directivity - operating point N1, (b) spectrum at 135° - operating point N1, (c) directivity - operating point N2, (d) spectrum at 135° - operating point N2, (e) directivity - operating point N3, (f) spectrum at 135° - operating point N3, (g) directivity - operating point N4, (h) spectrum at 135° - operating point N4.

It can be seen that the effect of a variable nozzle (taking the nozzle area change into account) increases as does thrust. The variable nozzle reduces the fan sound by up to about 0.8 dB, which is a result of the reduced fan pressure ratio (beneficial) and the increased mass flow (adverse), see (5). The jet noise is reduced by up to 2.2 dB at 135° due to the reduced exhaust speed (beneficial, see (6) and (8)) and increased area (adverse, see (7)).
Conclusions
In summary, the study identified the benefit of ultra-high bypass ratio engines compared to conventional ones. Importantly, the engine has to be matched with the aircraft design. The engine with a bypass ratio of 17 lowered the SFC by 18% at cruise condition compared to the engine with a bypass ratio of 5. In all operating points investigated, the SFC improved by between 18 to 40% with sufficient fan surge margins. The reduction can also be explained by the increased propulsive efficiency up to 10%. All in all, this resulted in a reduction of DOC parameter by 5.7% for the prescribed over-wing aircraft configuration for a short-range distance. The fan sound at the source could be reduced by up to 7 dB for a specific altitude and Mach number. Although the jet noise was reduced significantly, it is likely that the overall noise on the ground was not affected by the jet noise reduction due to its low significance.
In this study, the variable bypass nozzle concept was implemented into the UHBR17 engine variant without a complete redesign of the engine to show the potential performance and operational advantages which may be required for high BPRs. An additional variable bypass nozzle further increased the benefit in SFC by allowing a better component matching and loading at low off-design speed. The larger the thrust difference between the operating points to the design point, the bigger the decrease in SFC was. From a safety perspective, a VBNA may provide a higher margin to the fan surge line at certain operating points. Both effects partially allow decoupling the sensitivities of low FPR fans close to their performance limit, from the off-design behaviour of the aircraft. The preliminary study regarding the rotational speed change showed a further approach the engine manufacturer could take for increasing safety and lowering SFC. In terms of noise, the variable nozzle reduces the fan noise by up to 0.8 dB, and the jet noise by up to 2.2 dB. The additional weight increment due to an actuation system for the variable fan nozzle was assessed as uncritical for the accessible DOC improvements.
An aircraft with over-wing mounted geared UHBR engines can considerably reduce fuel flow with lower noise pollution. All these design opportunities can make a contribution to fulfill the targets made by the ACARE in its “Flightpath 2050” goals for future air transport on regional airports.
Nomenclature
Symbols
A
jet exit area
c
speed of sound
CD
drag coefficient
CL
lift coefficient
CLmax
maximum lift coefficient
Cu
momentum coefficient
F
thrust
g
gravitational acceleration
KBES
crew costs
KGEB
charges
KKR
fuel costs
KLFZ
aircraft costs
KW
maintenance costs
L
sound pressure level
Li
sound pressure level for the i’th 1/3-octave band
Lfan
fan sound pressure level
Ljet
jet sound pressure level
ΔLatt.
attenuation of the fan sound pressure level
LE
leading edge
L/D
lift to drag ratio
m
aircraft mass
bypass mass flow
core mass flow
total mass flow
Mcon
convective Mach number
Mflight
flight Mach number
Mnozzle
nozzle Mach number
N1
low pressure shaft speed
N2
high pressure shaft speed
Nfan
fan shaft speed
SMfan
fan surge margin
TKSM
transport work
Tflight
static temperature of flight stream
Tnozzle
static temperature of nozzle jet
aircraft acceleration
vflight
flight velocity
vnozzle
nozzle jet velocity
V18,ideal
bypass nozzle jet velocity
V8,ideal
core nozzle jet velocity
W
aircraft weight
γ
isentropic exponent, flightpath angle
ηcore
core efficiency
ηfan
fan efficiency
ηLPT
low pressure turbine efficiency
ηprop
propulsive efficiency
πfan
fan pressure ratio
Abbreviations
ACARE
Advisory Council for Aeronautics Research in Europe
AEO
all engine operating
BLC
boundary layer control
BPR
bypass ratio
BWB
blended wing body
CG
center of gravity
CONEA
conventional engine arrangement
CRC
Coordinated Research Centre
CS
Certification Specification
DOC
direct operating costs
EASA
European Aviation Safety Agency
EPNL
effective perceived noise level
FPR
fan pressure ratio
GTF
geared turbofan
HPC
high pressure compressor
HPT
high pressure turbine
ICAO
International Civil Aviation Organization
IPC
intermediate pressure compressor
LPT
low pressure turbine
HPT
high pressure turbine
MIT
Massachusetts Institute of Technology
OEI
one engine inoperative
OPR
overall pressure ratio
PrADO
Preliminary Aircraft Design and Optimization
SFC
specific fuel consumption
SPL
sound pressure level
STOL
short take-off and landing
TET
turbine entry temperature
TU
Technische Universität
UEET
Ultra-Efficient Engine Technology
UHBR
ultra-high bypass ratio
VBNA
variable bypass nozzle area