
Introduction
An effective way of improving the efficiency of gas turbine engines is to reduce the usage of cooling air for combustor and first stage nozzles, as cooling air for these hot gas path components has to be compressed to the highest pressure point of the entire engine. However, developments of more efficient gas turbine engines are usually associated with higher combustion temperatures, which in turn requires the usage more cooling air if cooling technology remains the same, in addition to the use of advanced high-temperature materials. Rising pressure ratios of modern gas turbine engines make the cooling for hot gas path components more challenging as the compressor discharge air is at higher temperatures, making it less effective coolant for combustor liners and first stage nozzles.
Inadequate cooling for combustor liners leads to reduced life expectancy of combustor liners and can further lead to premature failures of combustor components such as melted liners as reported in literature (Ahmed et al., 2019). In order to lower the metal temperature of combustor liner to improve the longevity of the component, cooling parameters, such as the shape of cooling holes and the amount of cooling air, have been the focuses of previous studies (Goswami et al., 2004; Ahmed et al., 2019; Click et al., 2019). In addition, new materials for providing thermal barrier have been developed for improved cooling performance (Goswami et al., 2004).
Some unique properties of aerogels, including low thermal conductivity (k, 0.01–0.03 W/(m·K) at 300 K), low density (ρ, <0.1 g/cm3), and high porosity (φp, 75%–99%) (Yuan et al., 2012), make aerogels promising candidates for some of most extreme applications, such as laser targets (Fearon et al., 1987; Alon et al., 1995), microelectronic devices (Hrubesh & Poco, 1995; Xiao et al., 2000), magnetic nanocomposites (Casas et al., 2001), acoustic dampening elements (Cross et al., 1989; Forest et al., 2001), micro-particle capturers (Anderson and Ahrens, 1994; Horz et al., 2000), and heat insulators (Alkemper et al., 1995; Kwon et al., 2000; Moner-Girona et al., 2001; Reim et al., 2005; Bardy et al., 2007; Pacheco-Torgal et al., 2018). Most prominently, aerogels are utilized as thermal insulators in the areas of clothing, construction, aerospace, and energy due to their extremely low thermal conductivities. Aerogels for thermal insulation applications usually take the form of thermal blankets; it should be noted that thermal characteristics of aerogel blankets vary with manufacturing processes (Bardy et al., 2007; Pacheco-Torgal et al., 2018). Silica aerogel has been the focus of prior experimental studies due to its low thermal conductivity (Reim et al., 2005; Bardy et al., 2007). In particular, silica aerogel has been applied as insulation covers or coating for gas turbine applications such as YSZ fine powder coating and insulation for bearing system (Fenech et al., 2009; Miller, 2015), however, the material has not been directly applied to gas turbine combustors for liner insulation.
This paper reports a preliminary, proof-of-concept study to evaluate the possibility of using silica aerogels as thermal insulation to gas turbine combustion liners. A natural gas fired, swirling-flame combustor was used to reproduce the combustion environment that is typical to a gas turbine combustor by operating it at an equivalence ratio of 0.83 (air flow rate at 700 slpm, and methane at 60 slpm). In addition, cooling air was supplied to silica aerogel blankets to provide transpiration cooling at three flow rates at 200, 300, and 400 slpm by suppling cooling air into a chamber that feeds silica aerogel blankets through a perforated steel plate as the metal liner. Temperature profiles of the perforated steel plate on the cold side of the silica aerogel blanket were measured using an infrared camera that was calibrated by referred method (Hoffman and Diggers, 2015) as well as conventional thermocouples. The present work also plans to investigate the degradations of silica aerogel blankets after being exposed to high-temperature combustion products for extended period of time.
Experimental setup and procedure
Experiments for testing silica aerogels as thermal insulation to combustor liners were performed in a lab-scale combustion rig shown in Figure 1a. Natural gas was used as the fuel, where the composition of the natural gas was analysed to be consisting of 94% methane, 3.3% ethane, 1% nitrogen, 0.5% carbon dioxide, and 0.2% propane by volume. The fuel and compressed air were supplied to the combustor at 60 slpm and 700 slpm, respectively, producing a combustion mixture at an equivalence ratio of 0.83. Both air and fuel lines were individually filtered and metered. Fuel and air were mixed upstream to the combustor using a mixer before the mixture was introduced into the nozzle of the combustor.
Figure 1.
Schematic of the experimental set-up: (a) combustor chamber, (b) cooling liner, and (c) location of temperature measurement points with coated high-temperature cement.
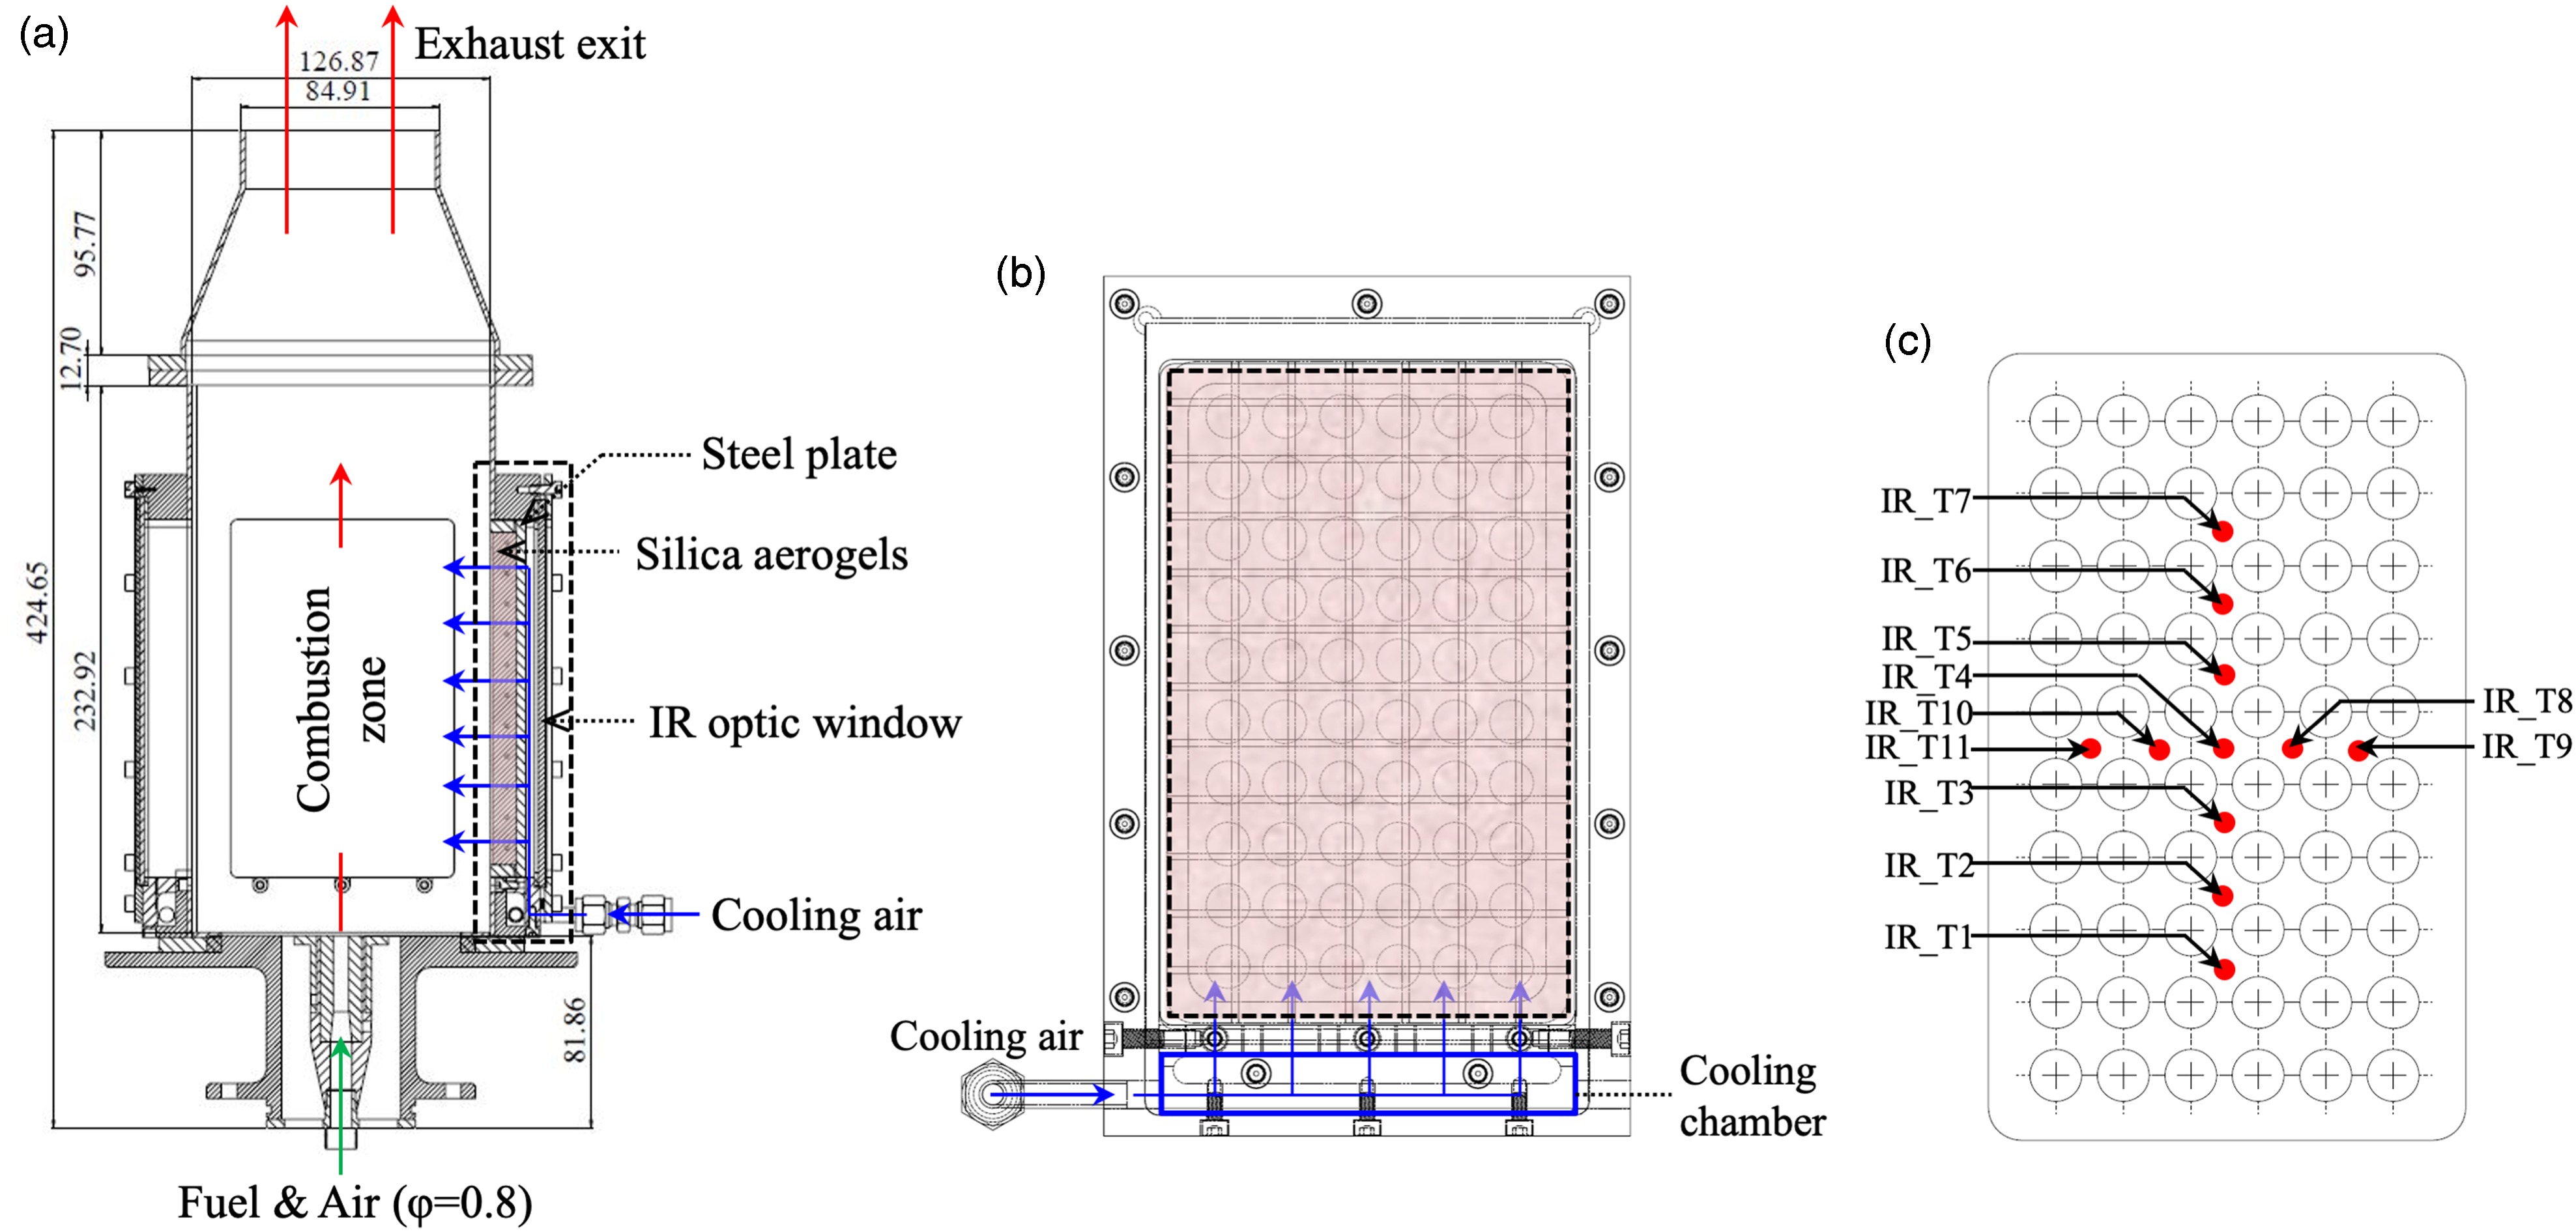
A cross-section of the test section where the silica aerogel blanket was installed is enclosed by a dashed rectangle in Figure 1a. Starting from the left side of the dashed rectangle, the aerogel blanket is in direct contact with hot combustion gas as the thermal insulation. The aerogel blanket was attached to a stainless-steel box, which is indicated by the shaded areas. The aerogel blanket was secured to the steel box by a matrix of 12-gauge Inconel rods that pass through the centre of the aerogel blanket individually and form a grid to secure the aerogel blanket to the metal box, as illustrated in Figure 1b. All aerogel blanket test samples were cut to have a perfect fit in the metal box which measures to be 82 mm × 142 mm. The surface of the aerogel flushes with the steel box, which in turn flushes with the combustor inner surface. It should be noted that the steel box consists two parts: the flat baseplate that mimics combustor liner and the rectangle ring that holds the aerogel blanket. A layers of glass-cloth adhesive tape (Nitto No.188UL) was sandwiched between the metal baseplate and the rectangle ring to minimize the heat conduction to the base metal plate via the contact with the steel rim surrounding the aerogel blanket, so that the heat conduction through the aerogel blanket can be isolated and studied. The baseplate of the steel box is perforated with an array of 60 oversized holes to allow transpiration cooling air to pass through the steel plate with a negligible pressure drop, as can be seen from Figure 1b. The transpiration cooling air subsequently passes through the aerogel blanket to form a cooling film over the aerogel blanket as the primary protection to the material with some added benefits of taking heat away from the aerogel blanket; the flow of transpiration cooling air is indicated by arrows in Figure 1a.
Three transpiration cooling air flow rates between 200 and 400 slpm were tested in this study as listed in Table 1. The adiabatic flame temperature calculated using natural gas and combustion air flow rates is reported in the table as well as the bulk temperatures after combustion products mixing with cooling air. In addition, although not listed in the table, the extreme case of zero transpiration cooling air was tested, where the silica aerogel blanket was exposed to combustion products at the adiabatic flame temperature unprotected. The silica aerogel blankets used in this study were Pyrogel HPS acquired from Aspen Aerogels, Inc; properties of the product are shown in Table 2.
Table 1.
Test conditions for combustion testing of the silica aerogel samples.
Table 2.
Physical properties of Pyrogel HPS.
| Thickness (la), mm | 10 |
| Max. Use Temp (Tlimit)., K | 923 |
| Density (ρ), kg/m3 | 200.2 |
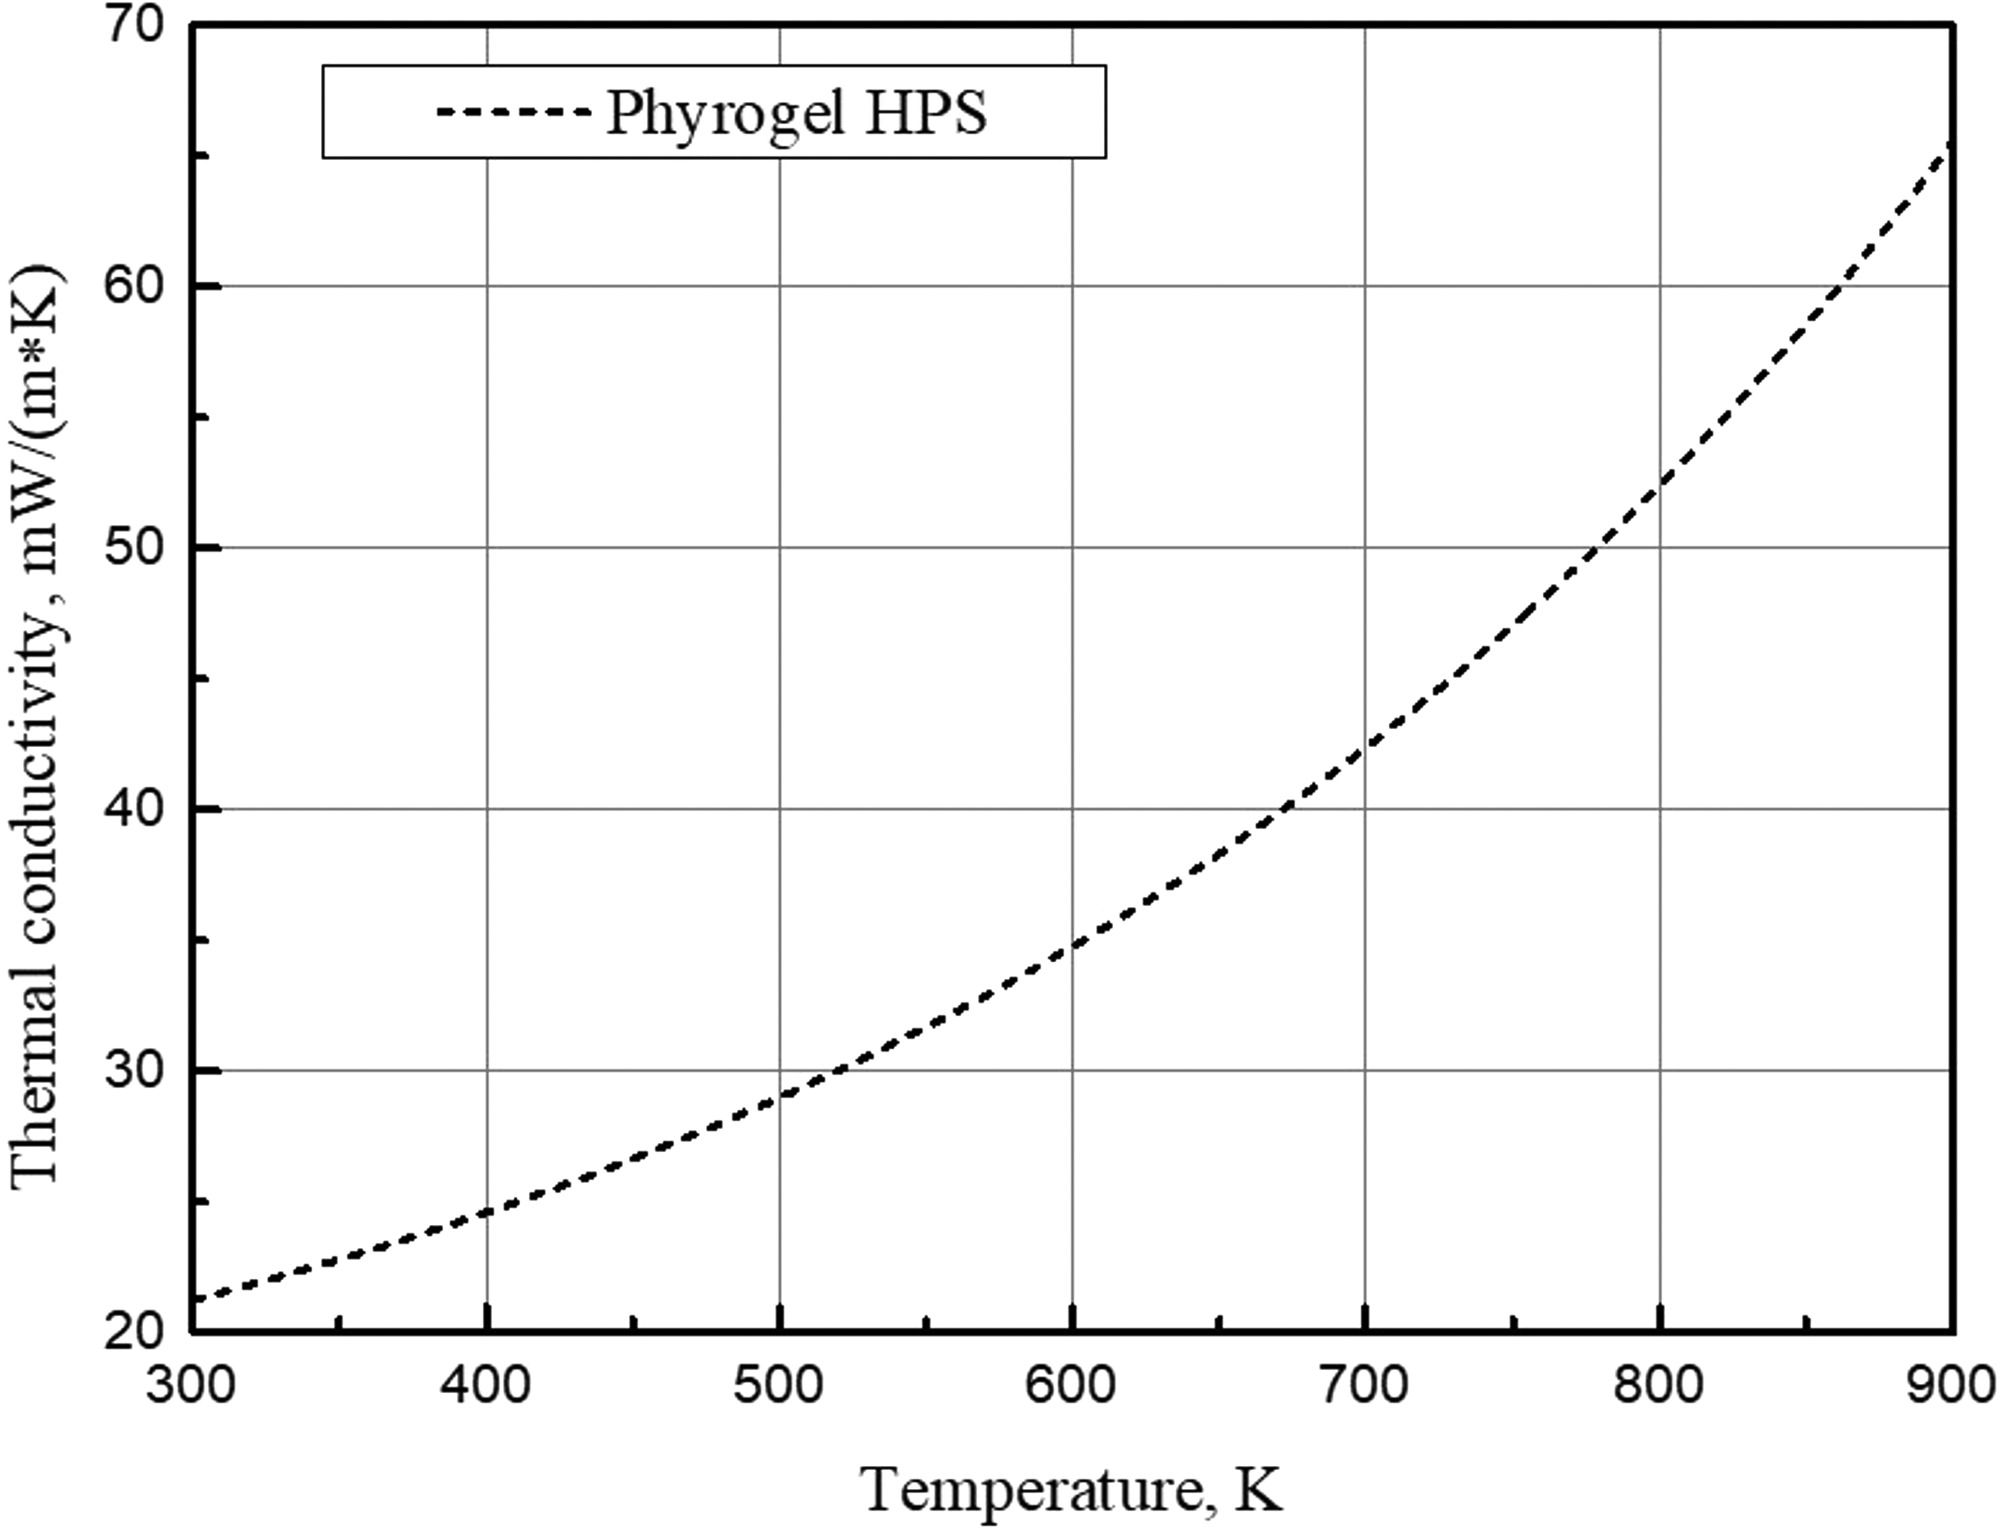
| Thermal conductivity (k), mW/(m·K) | Referred in Figure 2 |
A gap between the backside (or the cold side) of the baseplate that mimics the combustor liner and an IR optical window form a passage for transpiration cooling air to be distributed to the entire area of the aerogel blanket. The direction of the cooling air flow inside the gap is indicated by the solid line feeding the arrows as shown in Figure 1a. The IR optical window enables the measurements of 2D temperature distribution of the baseplate using an IR camera. To distribute the cooling air uniformly into the cooling air passage between baseplate and the IR window, the room temperature cooling air was first introduced into a cooling chamber as indicated in Figure 1b, which was subsequently fed through five choked holes into the cooling air passage between the baseplate and the IR optical window.
The temperature distributions on the back side of the baseplate were recorded as an indicator of the effectiveness of aerogel blanket as the thermal insulation to the combustor liner. Thermal infrared images of the back side of the steel baseplate were taken using a thermal infrared (IR) camera (FLIR A655sc 25°) with a temperature accuracy of ±2°C or ±2% of the reading. The 640 × 480 pixel IR camera sensor has a spectral range between 7.5 and 14 µm. The IR camera was pointed at the test section 0.5 m away from the IR window. An average transmission of 0.63 was quoted for the coated silicon IR over the spectral window of the IR camera by the IR window manufacturer Nivo Technology. To facilitate temperature measurements using IR imaging, a total of 11 small areas were coated with a thin layer of zircon based cement to minimize the uncertainty in metal surface emissivity due to metal oxidation at elevated temperatures. The cement was the No. 8 Electrotemp Cement from Sauereisen Inc. and has a service temperature up to 1,426°C. The emissivity of the electrotemp cement was determined to be 0.89 from calibration measurements as will be discussed next. The areas covered with electrotemp cement are illustrated in Figure 1c. It should be noted that thermocouples (TC) were installed on the surface of the back side of the baseplate as well. However, it was found that TC readings were subject to much larger uncertainties comparing to those from IR images for two primary factors: (1) heat losses from TC beads to wires were difficulty to quantify due to the fact that TC wires that were exposed to cooling air were in bundles and changed directions, and (2) the contacts between TC beads and the steel baseplate could be with imperfect. To have more consistent temperature evaluations, temperature readings from IR images are preferred and reported in this study.
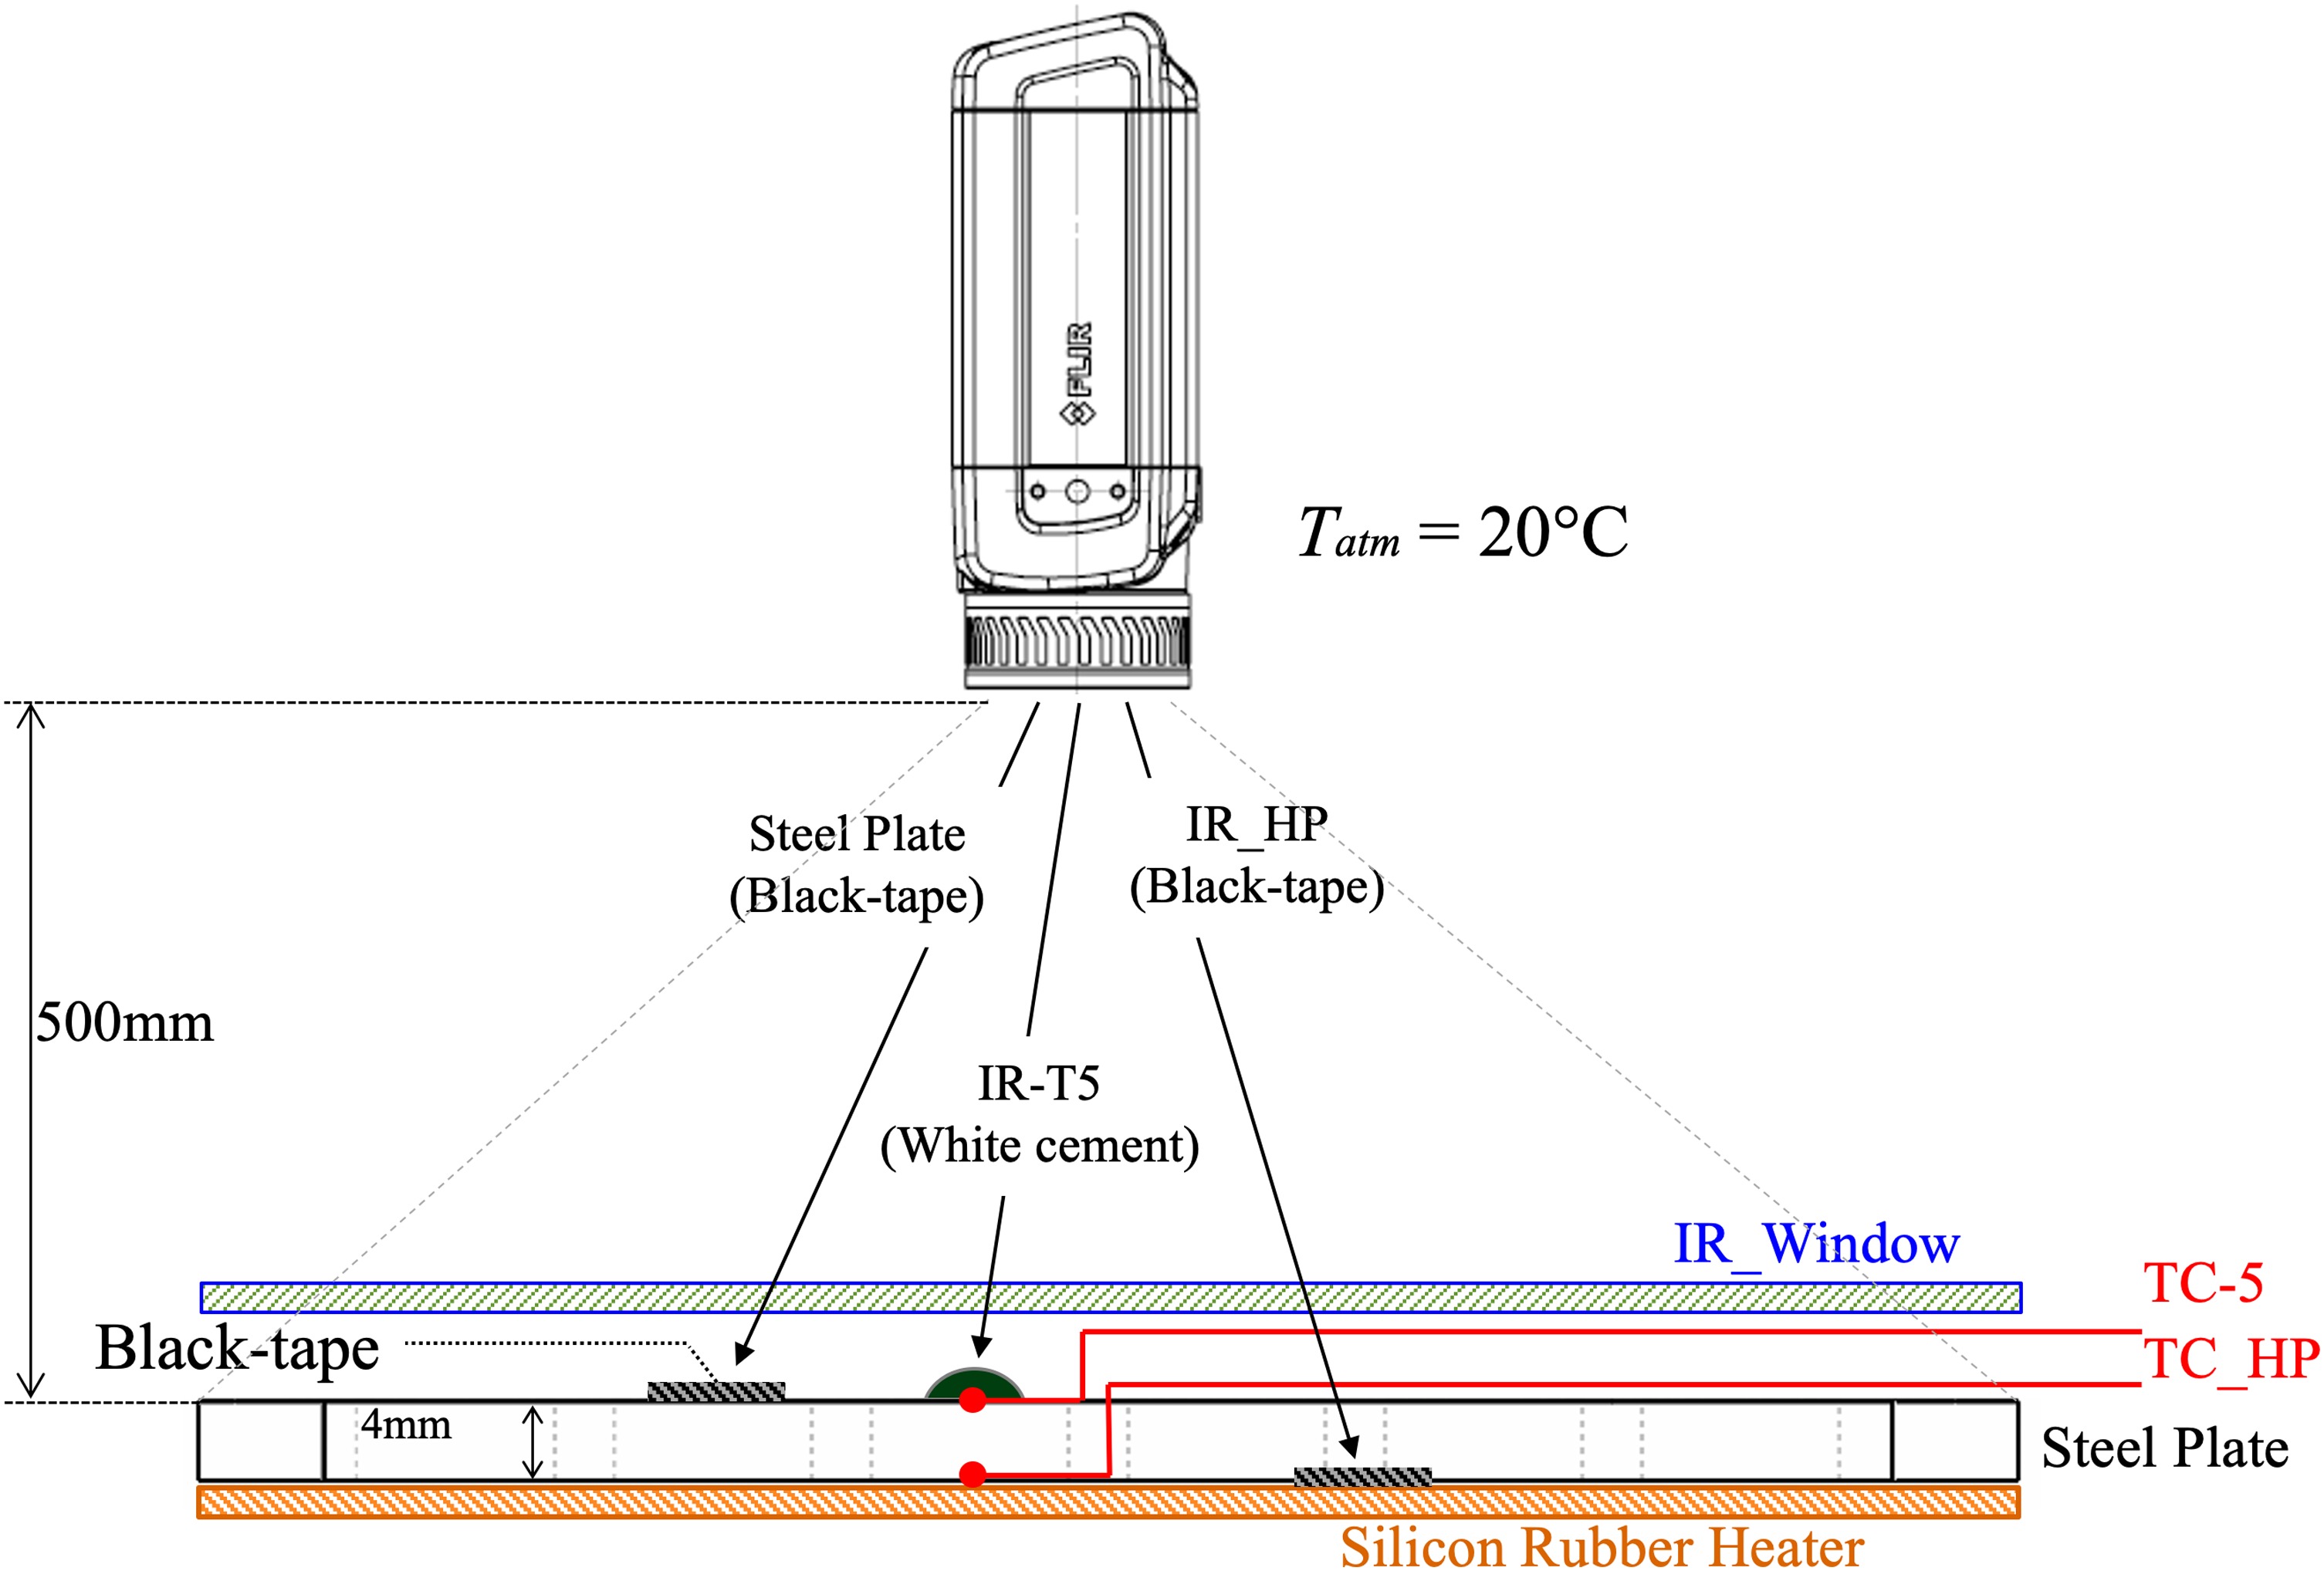
To accurately determine temperatures from the IR images, the IR camera was first calibrated. Figure 3 shows a schematic for calibrating the IR camera, following a procedure reported in the literature (Hoffman and Diggers, 2015). A thermocouple was installed between a silicon rubber heater from Electro-flex Heat and a steel plate that is directly attached to the silicon rubber heater. The calibrating reference point is a section of black vinyl electrical tape (3 M Scotch Super 88) on the silicon rubber heater, with a reported tape emissivity of 0.95 ± 0.05 (Hoffman and Diggers, 2015). Radiation heat losses to the ambient environment were ignored. It should be noted that the camera setup relative to the test section closely resembled the one used in the combustion tests, including the use of the IR optical window and the distance between camera and the test section.
Figure 3.
Schematic of the setup for calibrating the IR camera for temperature measurements. HP, BT, SP, TC and IR stand for heating plate, electrical vinyl black tape, thermocouple and infrared camera, respectively.
Samples of Pyrogel HPS, including samples from combustion tests listed in Table 1 and a reference sample of untested aerogel blanket sample, were analysed using a Nikon SMZ1000 optical stereo microscope and a Secondary Electron (SE) scanning mode of a Philips XL30 SFEG high resolution scanning electron microscope (SEM). The samples were sectioned and coated with a thin layer of gold to improve the conductivity to allow SEM examination. A gold coating of approximately 9 nm of thickness was applied with an Edwards S150B sputter coater. Due to the porous and discontinuous structure of the silica aerogels, the layer of gold was not always effective at preventing charging of the specimen by the electron beam. To counteract this, a combination of greater spot size and quicker scanning rate was adopted. Selected samples were examined along the flame facing side, this side exhibited the greatest degradation.
Results and discussion
Calibration results of IR camera
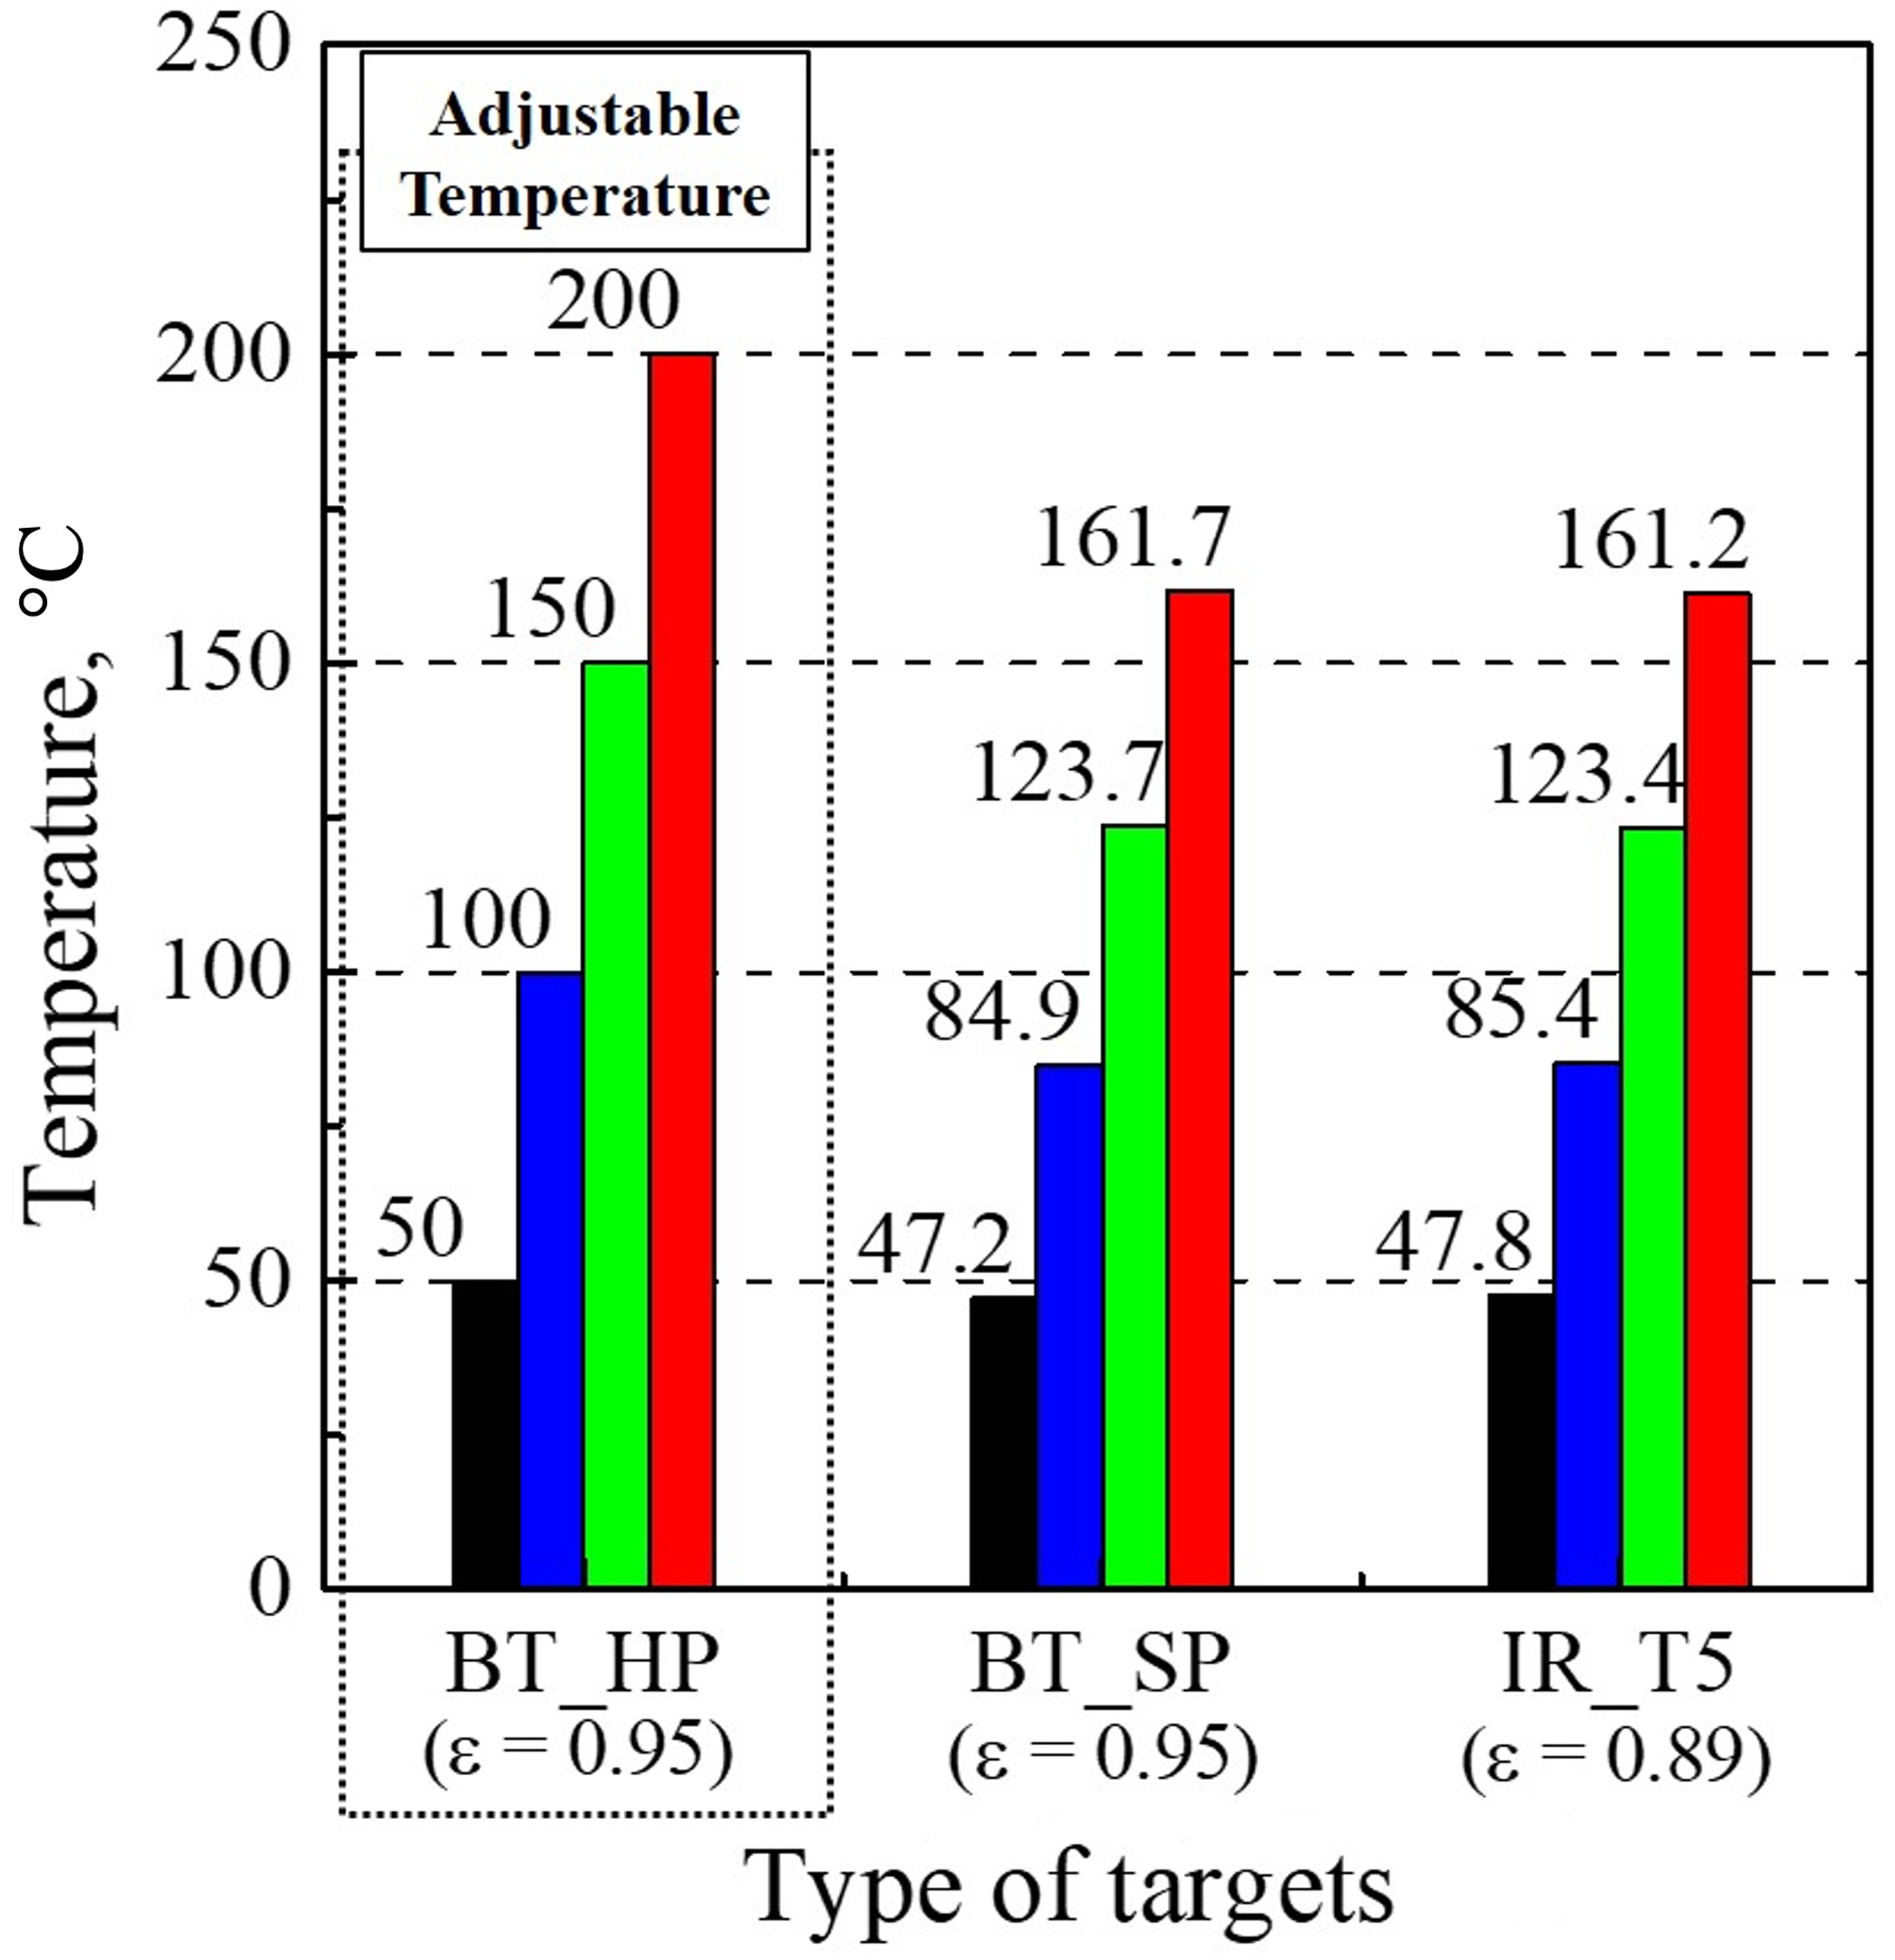
Figure 4 presents temperatures calculated from known or inferred surface emissivity for three surface areas in the calibration step, with four colour codes representing four different settings of the heating plate. Specifically, the red bars stand for the heating plate setting at 200°C, whereas green, blue and black bars are for 150, 100, and 50°C setting points respectively. Three surfaces summarized in Figure 4 are identified as black electrical vinyl tape on the silicon heating plate (BT_HP), black electrical vinyl tape on the heated steel plate (BT_SP), and thermocouple #5 covered by electrotemp cement (IR_T5), as illustrated schematically in Figure 3. The emissivity of the black electrical vinyl tape is confirmed to be 0.95 as reported in the literature (Hoffman and Diggers, 2015) by matching the IR imaging temperature on the vinyl electric tape (BT_HP) to the heating plate temperature read from a TC (TC_HP), as the first group in Figure 4. With the emissivity confirmed for black vinyl electrical tape, the steel plate temperature can be determined for all four heating plate settings (BT_SP as the second group in Figure 4). Finally, with the steel plate temperature determined from BT_SP, the emissivity of the electrotemp cement covering TC_5 is evaluated to be 0.89 to best-match IR_T5 to BT_SP, as illustrated by the third group in Figure 4.
Figure 4.
Comparisons of temperatures on three calibration surfaces as indicated in Figure 3. Four color bars represent four different settings of the heating plate: the red bars stand for 200°C heating plate, whereas green, blue and black bars are for 150, 100, and 50°C setting points respectively.
Performance of silica aerogels as thermal insulation for combustor liner
Each combustion test took a typical duration of 55 min after the onset of combustion and natural gas, combustion air and cooling air flows reached target levels. For three combustion tests performed with transpiration cooling, Figure 5 shows temperature profiles inferred from time-sequenced IR images from all 11 locations coated with high-temperature cement as illustrated in Figure 1c. Within the test duration thermal equilibrium was adequately established between the combustion products and the steel base plate insulated silicon aerogel blanket, which was in turn protected by transpiration cooling air. Two distinct stages of temperature rises can be identified before the steady state was reached: (1) approximately 15 min from the light up, the bulk of the combustor quickly established thermal equilibrium with combustion products as indicated by the rapid temperature rise from the onset, and (2) the silica aerogel blanket slowly degraded from the contact with high-temperature combustion products until the material degradation was contained by transpiration cooling air. Material degradation aspect will be discussed in detail later in this article.
Figure 5.
Temperature profiles inferred from time-sequenced IR images at 11 designated areas coated with high-temperature cement. Each subplot corresponds to a test condition as listed in Table 1.
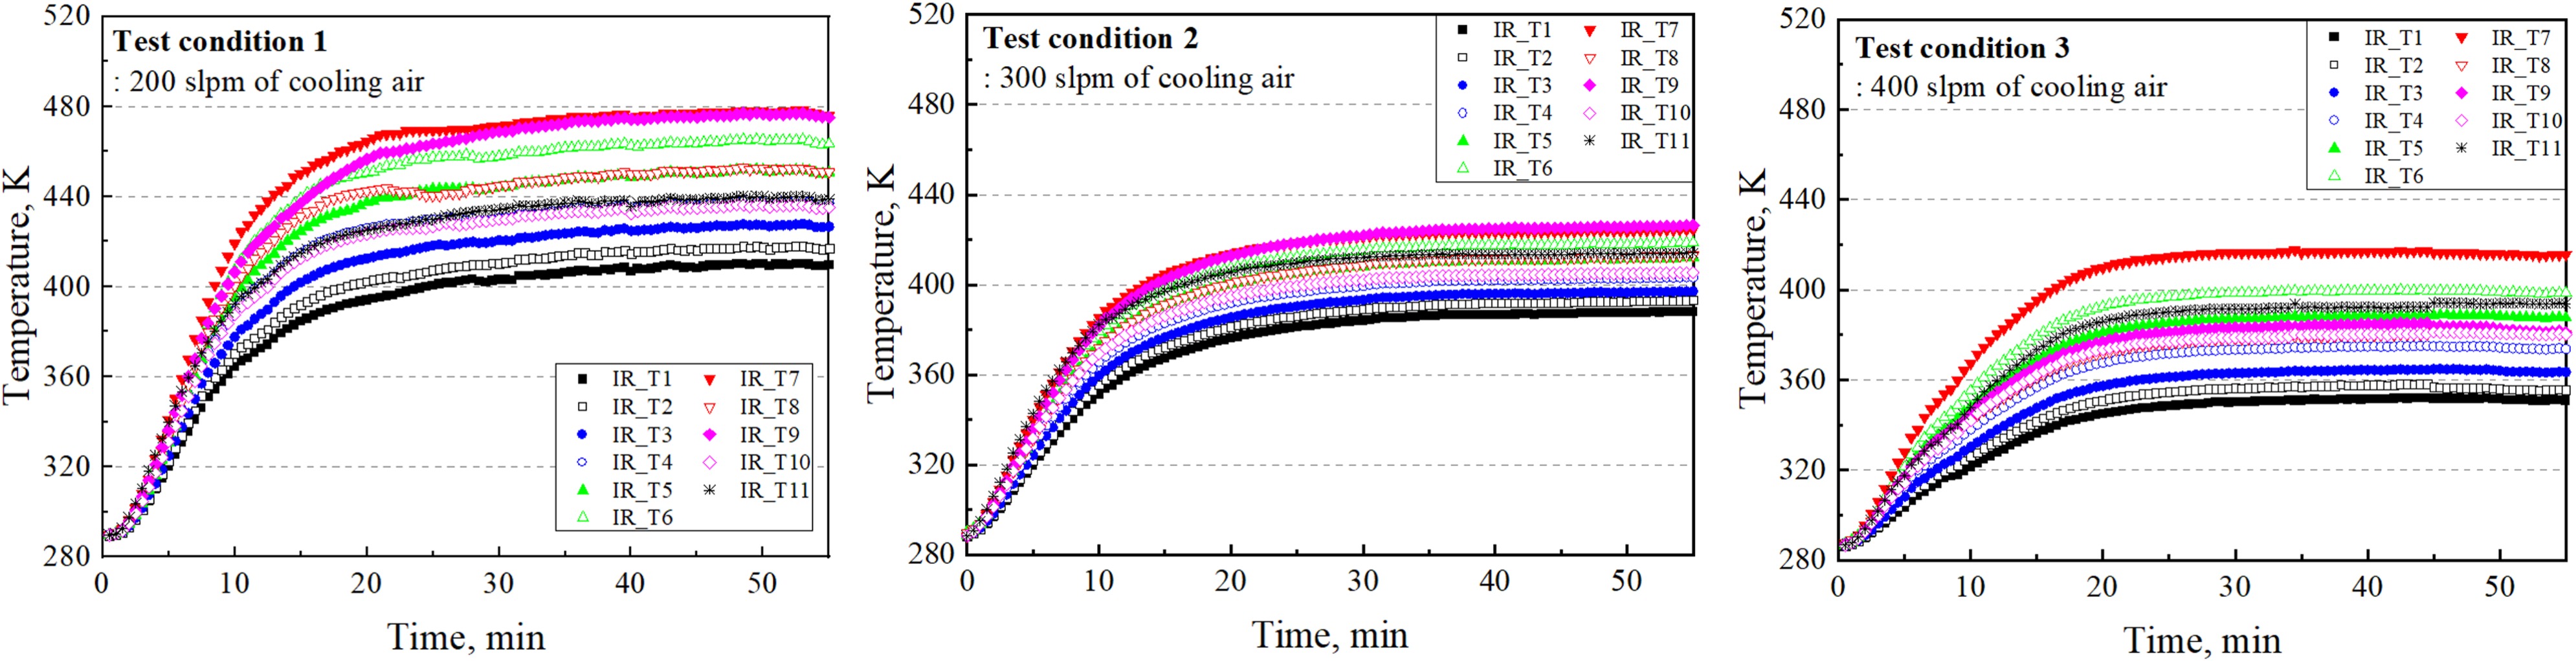
Specifically, the thermal equilibrium was achieved at t = 52 min for test condition 1 (200 slpm of cooling air); temperature fluctuations beyond this point were negligible. Similarly, the steady state for test condition 2 was achieved at t = 51 min. Temperature differences among 11 high-temperature cement coated areas are less than 25 K at steady state for test condition 2, suggesting an optimal distribution of cooling air when 300 slpm of transpiration cooling air was applied. The largest amount of cooling air was used for test condition 3 at 400 slpm, where the minimum and maximum temperatures recorded at 11 designated areas at the thermal equilibrium were 348 K and 433 K respectively. Moreover, the steady state was achieved at t = 29 min for test condition 3.
It became apparent from this proof-of-concept study that aerogel blanket has great potential to provide very effective thermal insulation for environments that are similar to those of gas turbine combustors. In this study, a layer of 1 cm silica aerogel blanket can effectively reduce the adiabatic flame temperature in the combustor by 1,540–1,610 K at the back side of the metal liner with only 200 slpm of transpiration cooling for the aerogel blanket. Small amounts of transpiration cooling air contained the material degradation in silica aerogel blankets as evidenced by the realization of temperature plateaus, where the porous structure of aerogel blankets made effective transpiration cooling feasible. With the protection of transpiration cooling air on the surface of aerogel blanket, the material can survive the combustion products despite the fact that the combustion products are at much higher temperatures than what the material limits of silica aerogel blankets.
It worth noting that a temperature plateau was not reached for a combustion test without transpiration cooling air at a duration as long as 70 min, suggesting the continuing deterioration of the silica aerogel blanket. Combustion temperatures that are typical to gas turbine combustors are beyond the material limits of the silica aerogel blanket, resulting in inevitable material degradation in the silica aerogel blankets, which will be discussed in details in material analysis section later in this study. Nevertheless, once aerogel blankets of proper temperature ratings become available, using aerogel blanket for thermal insulation will be a viable option for thermally insulating metal combustion liners.
Figure 6 shows temperature distributions of the steel base plate as captured by the IR camera at the end of each combustion test duration. To evaluate the performance of silica aerogel blankets in insulating heat, a direct comparison of location specific temperatures at the end of each test duration was performed, with or without transpiration cooling air as shown in Figure 7. Similar to Figure 6, at the end of the test durations, all combustion tests with transpiration cooling reached thermal equilibrium temperatures. A trend that is consistent for all combustion tests is that temperature monotonically increases as the height increases along the center line for two contributing factors: (1) combustion mixtures release chemical energy in flames as the flow moving upwards, and (2) cooling air enters the cooling air passage from the bottom of the chamber as discussed in Figure 1. For example, IR-T7 consistently recorded highest temperature along the center-line. In addition, temperature readings at the middle height show that edges of the test section received less effective cooling despite the fact that the heat transfer to the silica aerogel blanket is less intensive due to corner recirculation zones without direct impingement of combustion products.
Figure 6.
Temperature distributions as recorded by the IR camera at the end of duration of each combustion test when the thermal equilibriums were achieved.
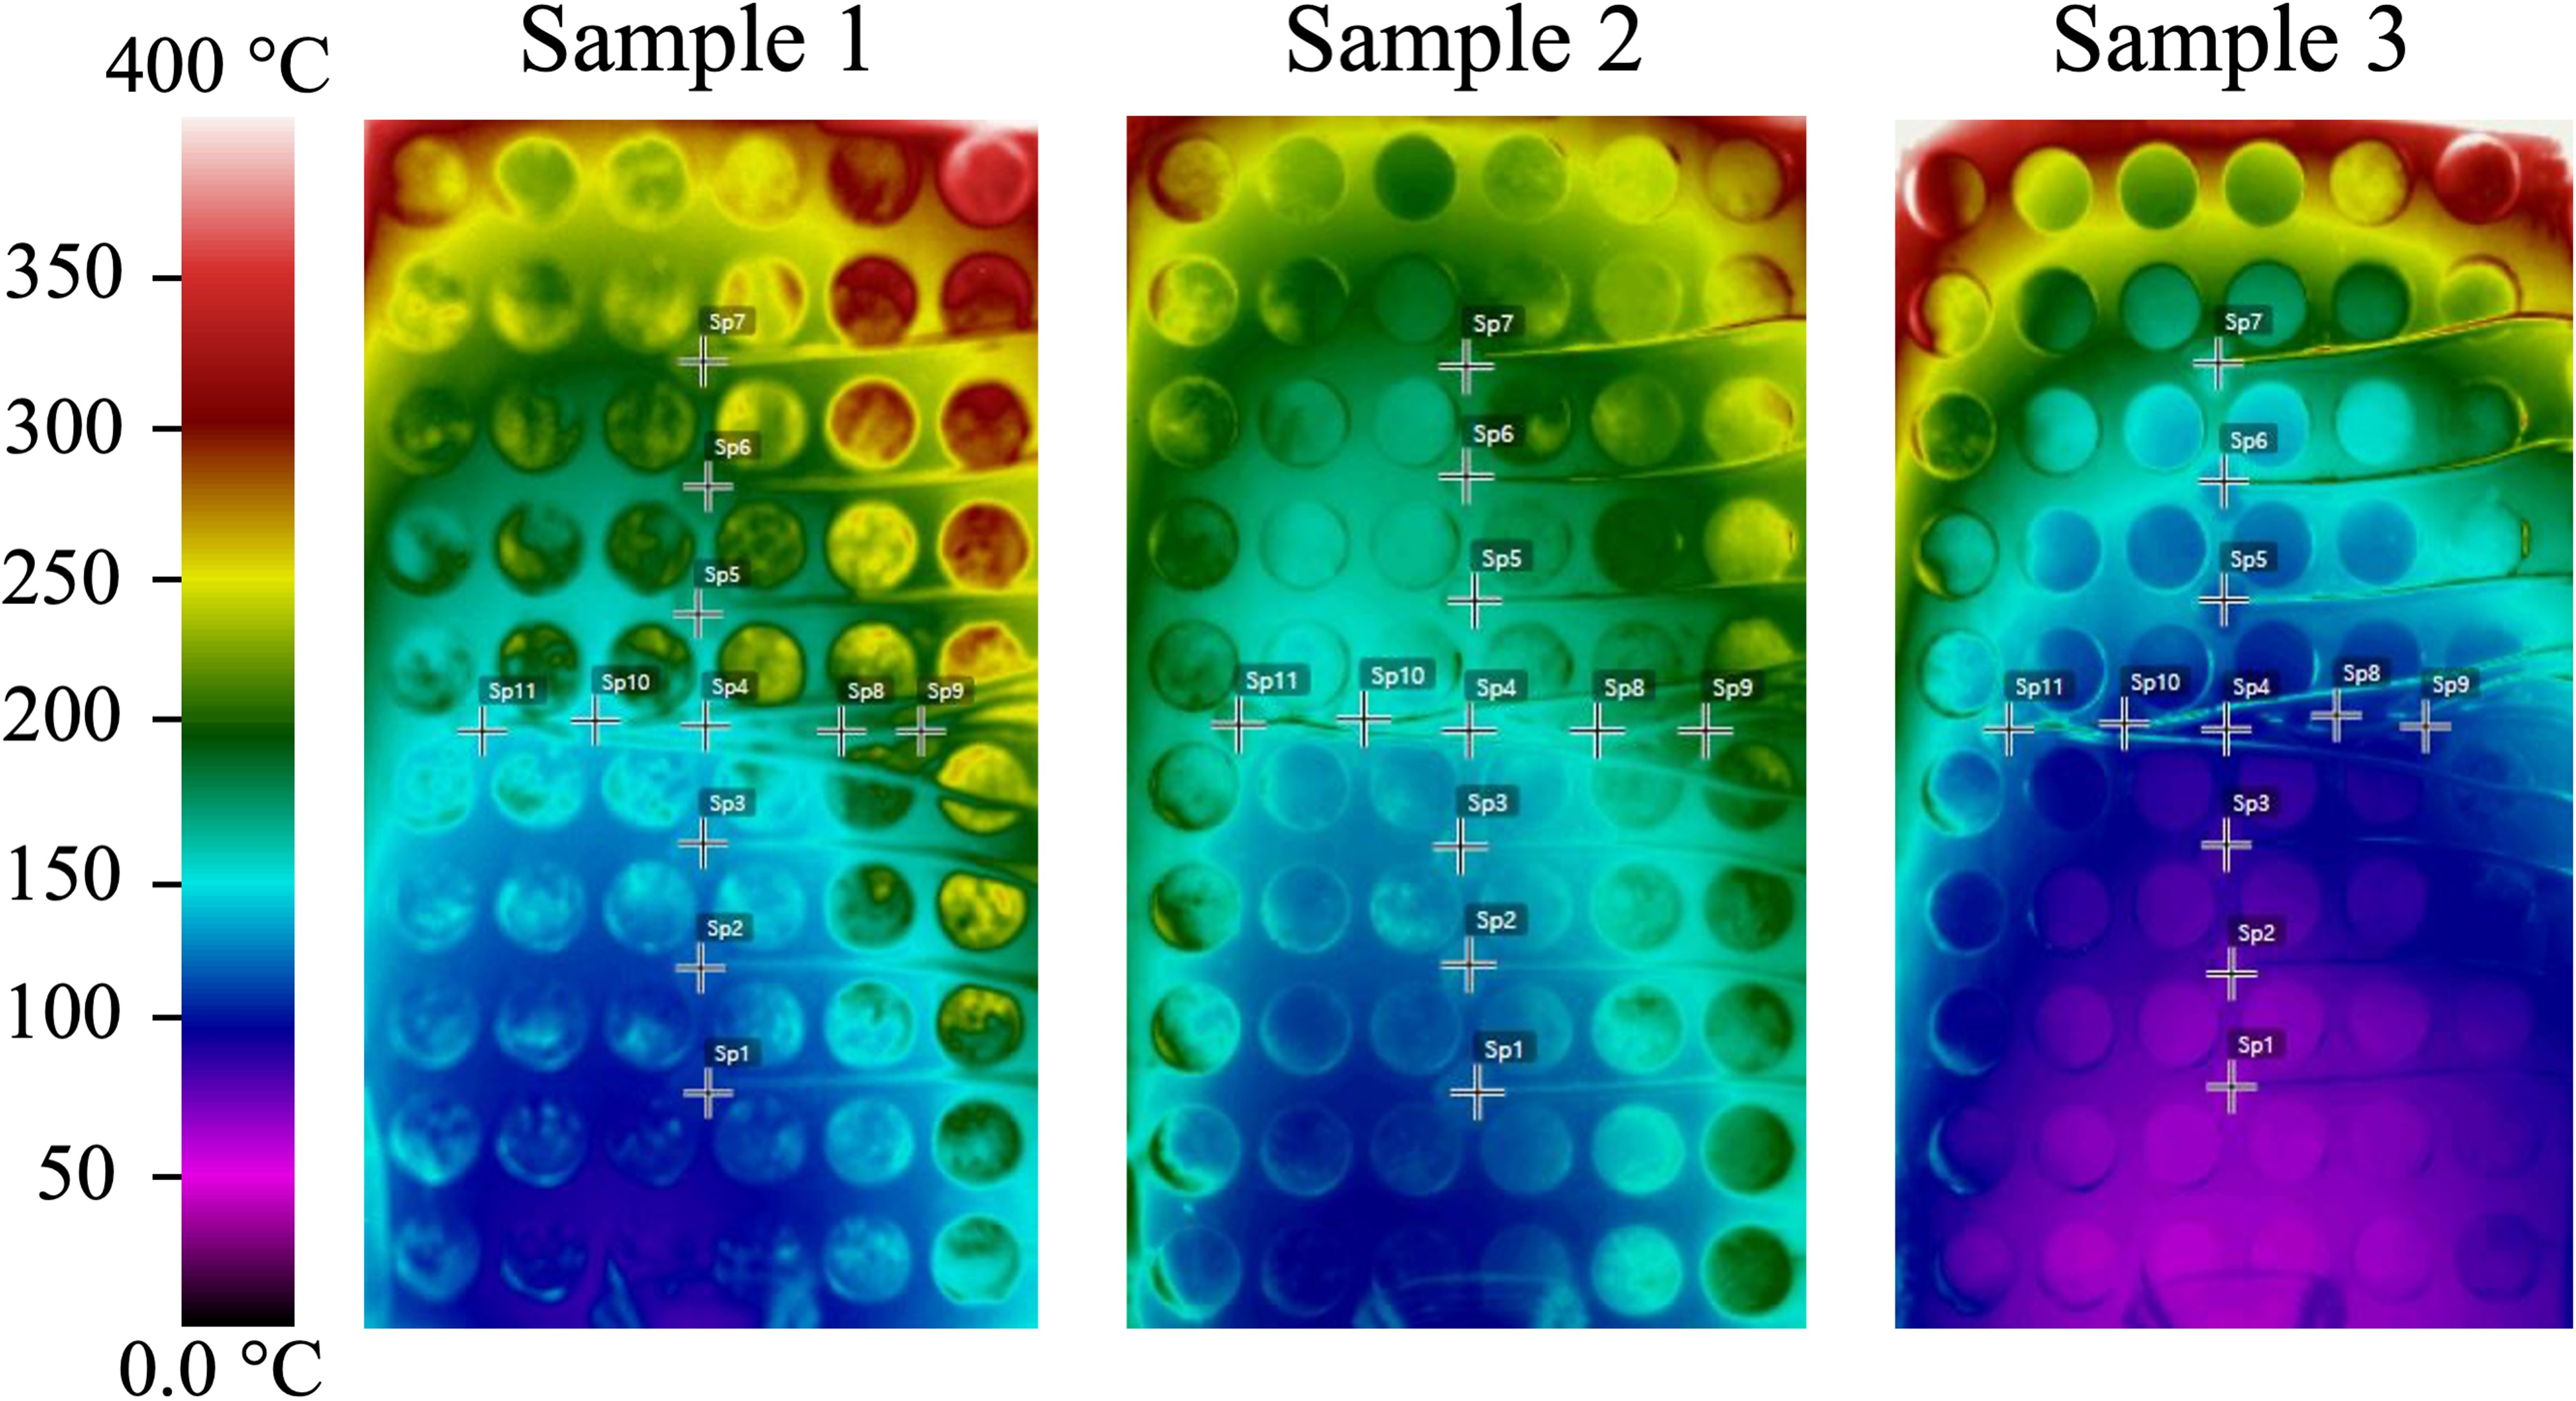
Figure 7.
Comparisons of temperature readings at thermal equilibriums when the amount of cooling air was varied. The discrete temperature determinations were made at locations where high-temperature ceramic cement of calibrated emissivity was applied. Panel (a) shows the temperature distributions along the vertical center line and (b) along the horizontal center line.
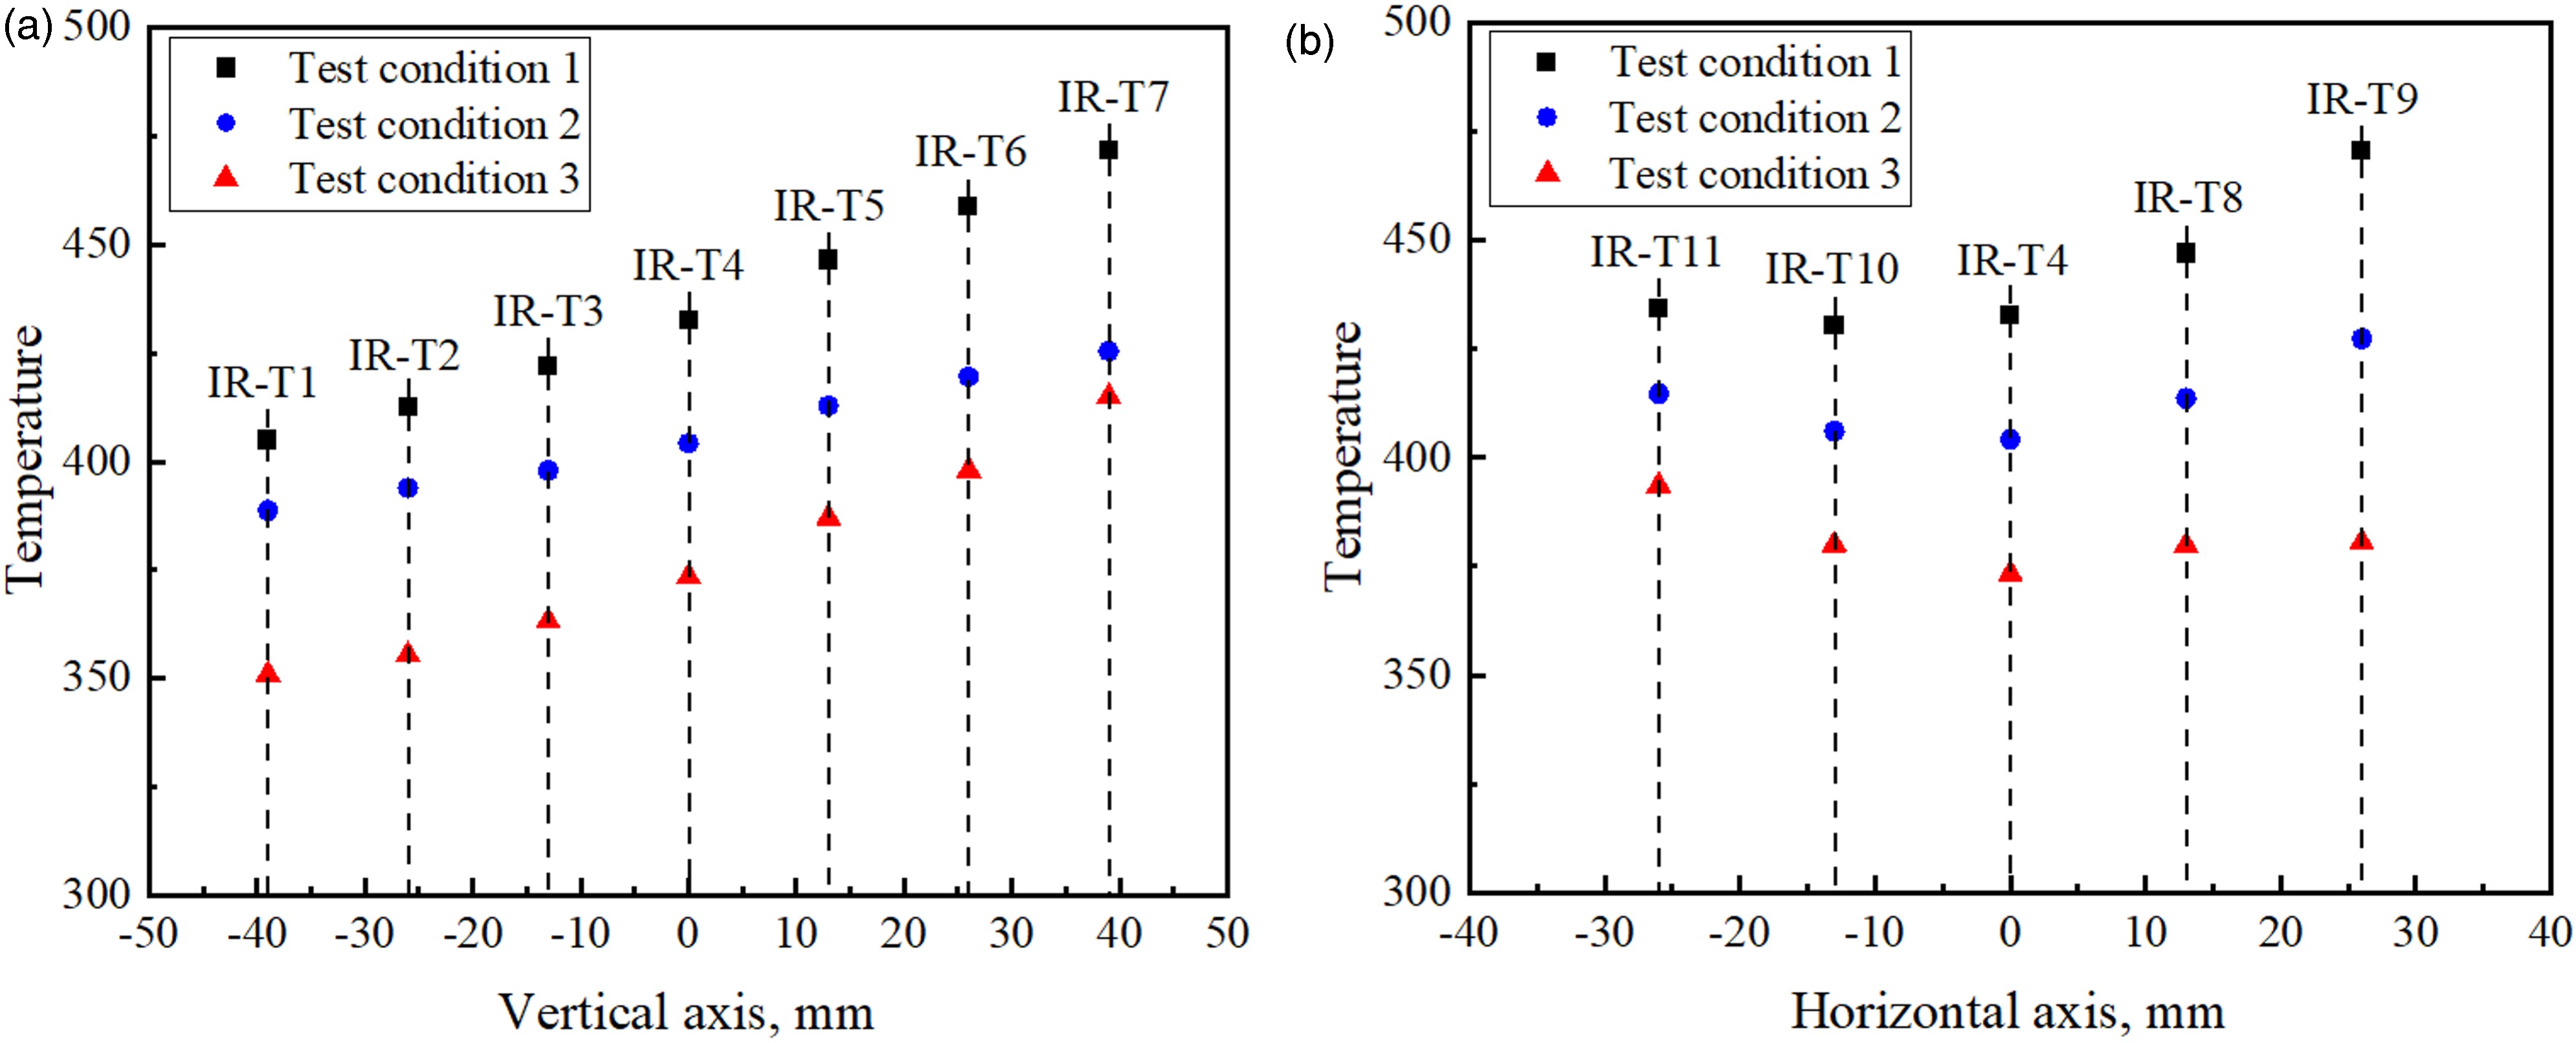
One interesting observation is that the temperature reductions along the center line are not uniform, as revealed by Figure 7a. The odd behaviour can be explained by the lack of reflection symmetry when the swirling flames impinging on the flat aerogel blanket surface. When the cooling air flow rate was increased from 200 slpm to 300 slpm, the interaction between main combustion mixtures with cooling air altered the temperature distribution with the asymmetry in temperature distribution reduced, as evidenced by a comparison between Figures 6a and b. However, as the cooling air flow rate was further increased to 400 slpm, an asymmetry to the opposite side was developed as can be seen in Figure 6c. For temperature determinations along the centreline of the test section, asymmetric temperature distributions of opposite directions coincidentally resulted in similar temperature trends when data sets of test conditions 1 and 3 are compared in Figure 7a. The changing symmetry of the temperature distributions when the amount of cooling air was varied can be clearly seen in Figure 7b.
Table 3 lists the minimum and maximum temperatures recorded at 11 designated locations for all three combustion tests. Considering that the differences in gas temperatures after mixing combustion products with cooling air are 134 K and 211 K between tests 1/2 and 2/3 respectively, the temperature differences among the tests at the steel baseplate were greatly reduced. In particular, the reduction in maximum temperature by increasing cooling air flow rate from 300 slpm to 400 slpm was only 12.5 K with a 211 K reduction in bulk gas temperature in the combustor, indicating that over cooling was achieved with 400 slpm of cooling air.
Table 3.
Minimum and maximum temperature of each test condition.
| Test condition # | Minimum temperature, K | Maximum temperature, K |
|---|---|---|
| 1 | 404.9 (IR-T1) | 471.6 (IR-T7) |
| 2 | 388.7 (IR-T1) | 427.4 (IR-T9) |
| 3 | 350.8 (IR-T1) | 414.9 (IR-T7) |
It should be pointed out that the amount of cooling air used in this study per unit surface area is comparable to that of the state-of-the-art effusion cooling. At a total cooling air flow rate of 200 slpm for the entire aerogel blanket, the specific cooling air flow rate per unit area is 32 slpm/cm2, corresponding to a unity Blow Ratio (BR) for effusion cooling as described in a prior transpiration cooling study (Yildiz et al., 2019). Although an accurate determination of pressure drops across aerogel blankets was not feasible as the pressure differences were small comparing to pressure fluctuations, it is certain that pressure drops across the aerogel blanket were much less than the typical pressure drop of 3–5% across effusion cooling holes.
Transpiration cooling over the surface of porous medium is a complicated multi-step process, which includes cooling film formation over the surface of the porous material, heat exchange between combustion gas and porous materials with (partial) cooling film protection, heat conduction along the ligaments, and heat exchange between transpiration coolants and the ligaments of porous materials. A comprehensive study of heat transfer phenomenon is beyond the scope of this proof-of-concept study, however, previous work from this group includes studies on the cooling film effectiveness of transpiration cooling (Yildiz et al., 2019; Hinse et al., 2020) and a numerical simulation of transpiration cooling for a well-defined problem (Hinse et al., 2020). With encouraging results from this proof-of-concept study, plans for future studies include quantitative determinations of thermal load on flame side on aerogel blankets and temperature gradient inside the aerogel blankets. Feasibilities of numerical simulations including combustion and cooling chamber geometries is currently being planned and evaluated.
Material analysis
Figure 8 shows the untested silica aerogel, a fairly flexible pink coloured solid with visible fibre content. As shown in Figure 9, the morphology of the aerogel prior to testing consists of a granular type structure interspersed with fibres. This aligns well with the product description on the data sheet which identifies the composition of the aerogel as shown in Table 4. Two features of note is the multi-modal grain size composition ranging from grains of roughly 1 µm of diameter which adhere to the glass fibres to grains in the 10–30 µm of range and finally the larger crystalline structures. These features can be noted in Figure 9c with the smallest grains indicated by the green arrow, medium size grains indicated by the blue arrow, and the more cohesive crystalline structures indicated by a red arrow in Figure 9b. Several sol-gel methods of producing aerogels take advantage of a multi-modal grain size precursor to reduce sintering and increase the void content (Schmucker and Schneider, 2005) . The more continuous structures are the silica aerogel phase identified as synthetic amorphous silica and methylsilylated silica in Table 4.
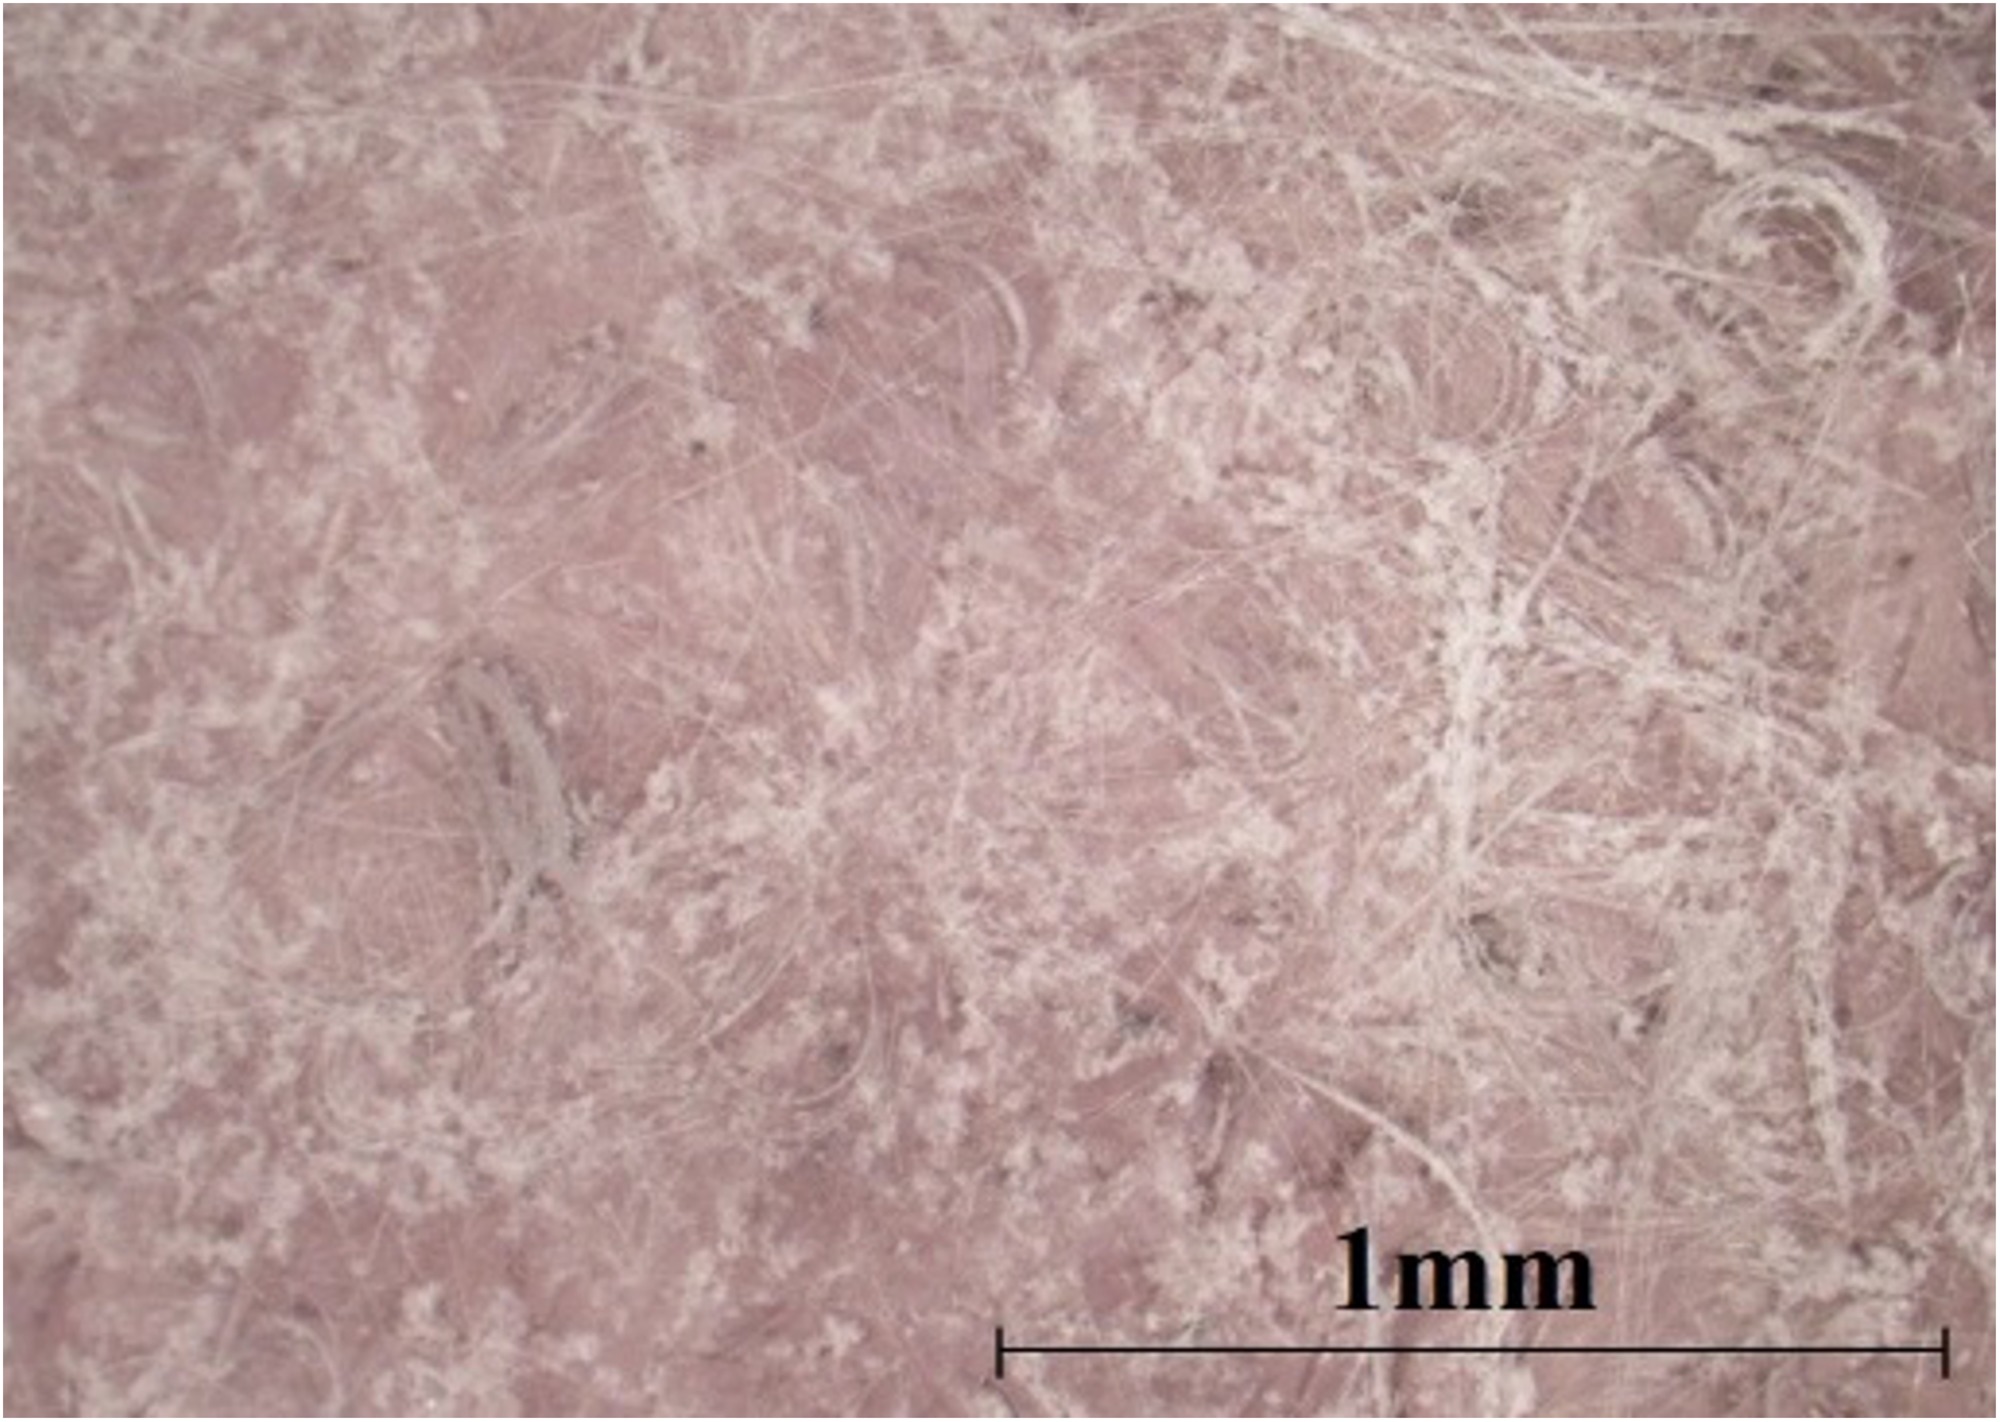

Table 4.
Composition of Pyrogel HPS.
| Component | Composition, % |
|---|---|
| Continuous Filament Glass Fibres | 40–60 |
| Synthetic Amorphous Silica | 20–30 |
| Methylsilylated Silica | 10–20 |
| Silicon Carbide | 10–20 |
| Titanium Dioxide | 1–5 |
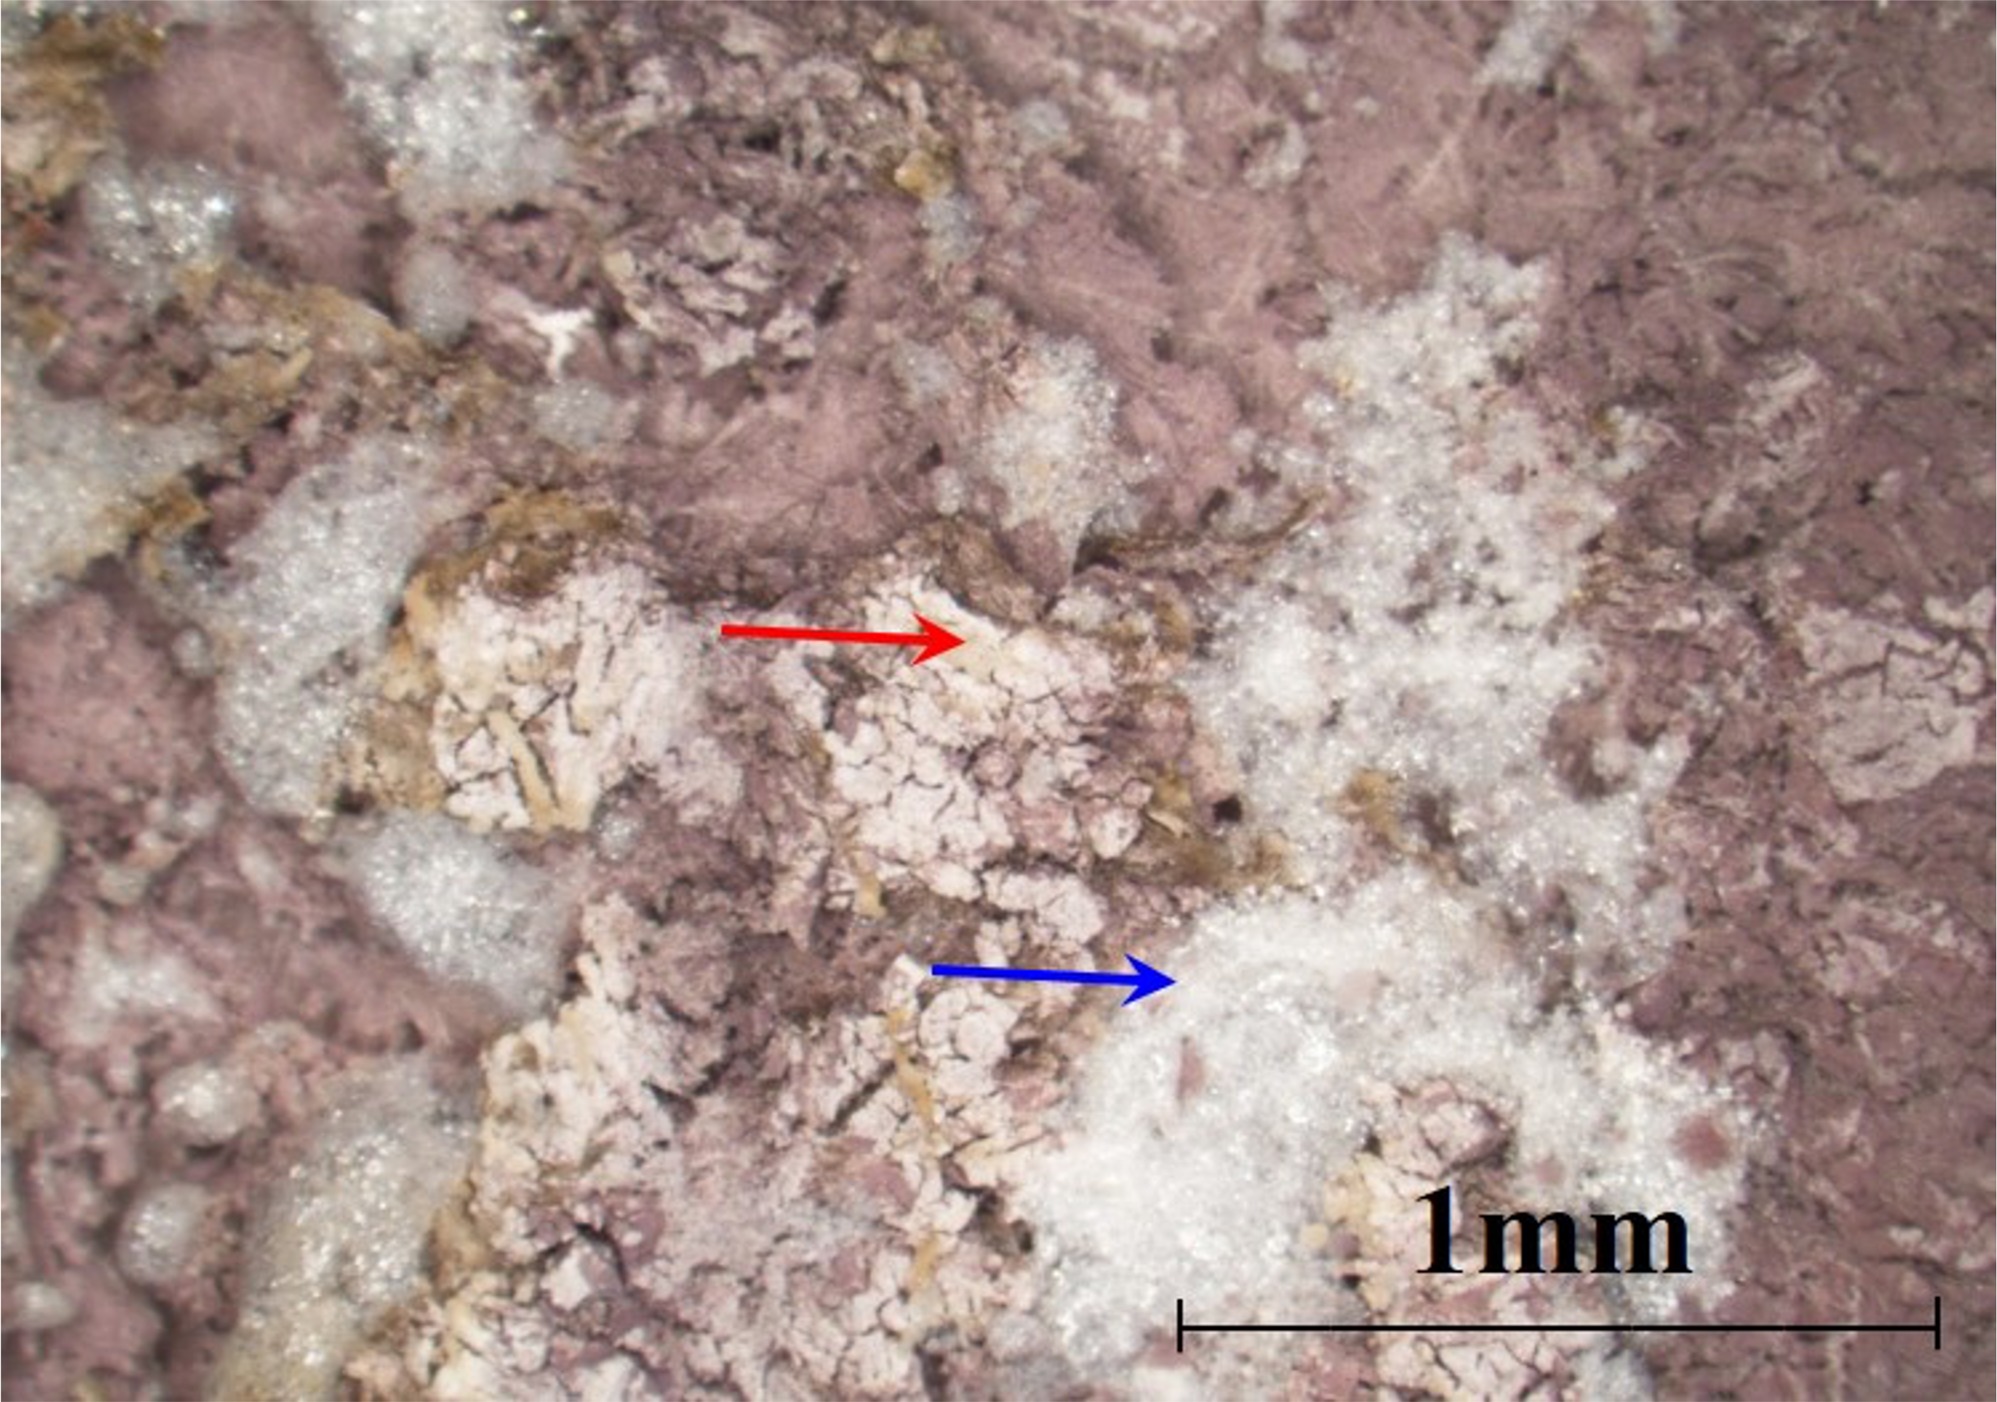
There were two primary forms of deterioration detected which are highlighted in Figure 10. The image is taken of the cooling side of sample 1 since this sample displayed all three types of degradation. The two visible forms of degradation products were a solid structure highlighted with the red arrow and a bubble like the structure identified with the blue arrow. The solid degradation product typically has a whiter appearance; however, it can be seen that there are components of this product with an orange to brown tint.
Figure 10.
Stereoscope image of flame facing side of sample from test condition 1 showing the degradation products following combustion testing. The red arrow indicates one solid degradation product, and the blue arrow indicates the bubble morphology degradation product.
Six SEM images are presented in Figure 11A highlighting the different forms of degradation observed in the sample 1. The surface morphology examined in sample 1 indicated similar degradation to other test conditions. In Figure 11A (a) and (d), damaged glass fibres are apparent, and a particle bubble structure can be observed forming on the left-hand side of the crystalline structure in Figure 11A (b). In addition, a bubble structure is very clearly observed in Figure 11A (c). Figure 11A (e) and (f) show a similar crystalline structure to other samples.
Figure 11.
SEM images of the cooling surface of an aerogel sample subject to (A) test condition 1, (B) 2, and (C) 3. (A) SEM images with (a) 150× magnification showing damaged fibers and a bubble morphology, (b) 150× magnification showing a crystalline degradation with an area of bubble morphology, (c) 150× magnification showing the image of a largely intact bubble morphology, (d) 200× magnification showing primarily crystalline morphology with damaged fibers, and (e)–(f) 800× and 1500× magnification showing a crystalline morphology. (B) SEM images with (a)–(b) 150× and 200× magnification showing a crystalline degradation with an area of “bird's nest” morphology highlighted, (c) 200× magnification showing an area of fiber degradation, (d) 200× magnification showing a crystalline morphology, (e) 200× magnification showing a larger area of “bird's nest” morphology, (f) 800× magnification showing an area of bubble morphology. (C) SEM images with (a) 150× magnification showing a largely unaffected area, (b)–(e) 200× and 800× magnification showing a crystalline morphology, and (f) 800× magnification showing a particle bubble morphology. (continued).
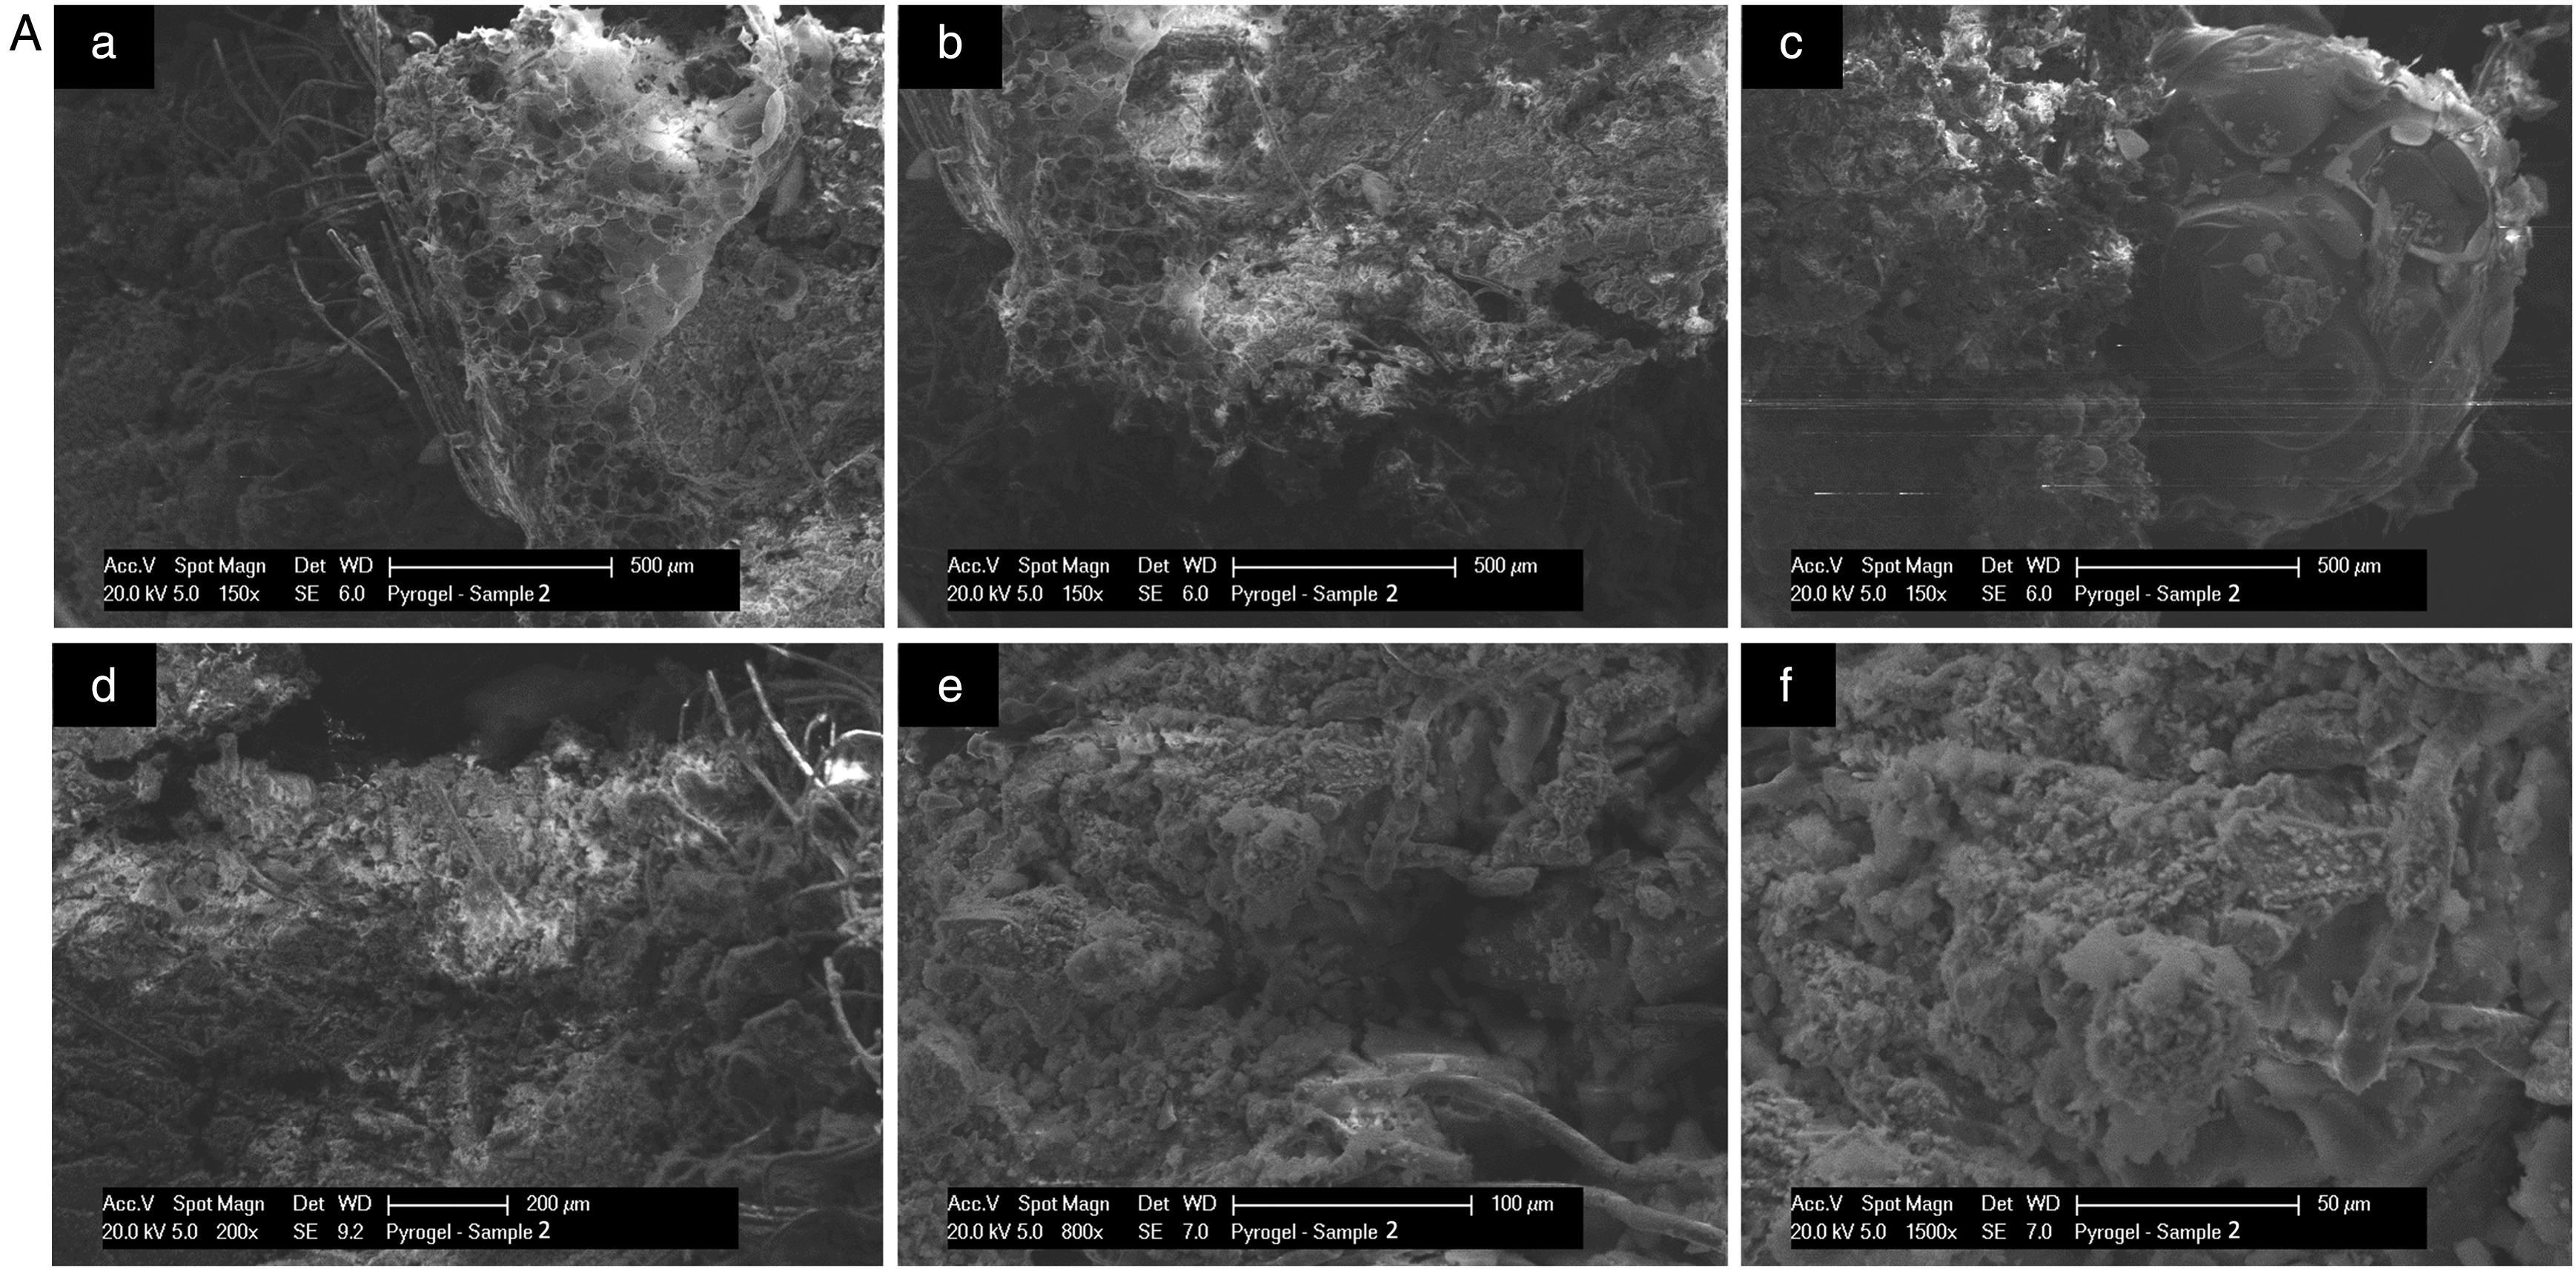

The sample 2 has areas of crystalline degradation indicated by the rough crystalline surface. This is observed clearly in Figure 11B (a), (b) and (d). One feature of test sample 2 which was not clearly observed in other samples is a “bird’s nest” morphology and is highlighted in Figure 11B (a), (b) and (e). It is possible that the “bird’s nest” structure is of a similar composition to the bubble morphology observed in the sample 2. Figure 11B (c) and (e) show glass fibres which have suffered damage during the test. Similar to the test condition 3, the fibres have lost the smaller particles which adhered to them and exhibit a reduced and kinked structure.
As shown in Figure 11C, the SEM images for sample 3 show the different structures of degradation observed in this sample. Figure 11C (a) shows that there are areas within the tested sample which exhibit a structure very similar to that seen in the baseline sample indicating little degradation pattern as seen in Figure 11C (b). This degradation is characterized by the loss of fibre content and the roughening of the surface. The spherical structures highlighted in image (d) may indicate the occurrence of sintering. In addition, the bubble morphology was observed in sample 3.
Based upon the examination of the four tested samples, it is hypothesized that degradation occurs through three primary mechanisms; the loss of the glass fibre content, the sintering of the silica aerogel structure, and the partial melting of the silica aerogel structure. Continuous filament glass fibres, which compose 40–60% of the structure, are typically 67.5%–85% SiO2, 9.5%–20% Al2O3, 5–15.5% MgO, 0.5%–5% TiOx (0 ≤ x ≤ 2), and 0%–5% ZrO2, and have an upper limit of 1,533 K (TenEyck et al., 1995). The SEM examination clearly shows that the limit was exceed in all four test conditions based upon the observed damaged fibres. This excess can be assumed that the “bird’s nest” and bubble structures, observed in the microstructure, is the results of the molten glass being shaped by the cooling air passing through the silica aerogel structure. Confirmation of this assumption would require a chemical analysis of the bubble structure which was not performed in this work. Silica aerogels have been shown to sinter through a viscous sintering mechanism which is controlled by the viscosity of the silica at the sintering temperature, pore size, and pore size distribution (Scherer et al., 1998; Cai et al., 2020). The melting temperature of silica is known to be 1983 K, based on the flame temperature (Tf) over the cooling air mixture temperature (Tm), reported in Table 1, for silica should fall within the range of 0.73 to 1.02; well within the range for sintering to occur. Further evidence of sintering includes the increased stiffness of the degraded surfaces as compared to the baseline sample and the consolidation of the granular structure seen between the baseline SEM images and the sample SEM images. The SEM images of the tested samples exhibit a greater surface roughness than seen in the baseline sample, which the results are assumed due to the melting of the silica aerogel structure. For the sample 1, 2, and 3, the results represent the molten glass from the fibres reduced the melting temperature of the silica component leading to localized melting of the silica aerogel.
Despite the material degradations discussed in this section, it is expected that the effectiveness of transpiration cooling is insignificantly impacted. This anticipation is supported by steady temperature profiles for the entire duration of combustion tests once the initial temperature rises are established, as shown in Figure 5. Prior experimental and numerical studies (Yildiz et al., 2019; Hinse et al., 2020) indicate that the cooling film effectiveness is insensitive to pore sizes of porous materials as long as the porosity and permeability of these porous media are comparable, which is anticipated to be the case for aerogel blankets of this study.
Conclusions
A natural gas fired swirling-flame combustor was used to test the feasibility of using aerogel blankets to provide thermal insulation to metal combustor liners. A mechanism for attaching aerogel blankets to combustor liner was proposed and verified. In this work, silica aerogel blankets were used in combustion tests. In addition, various amount of transpiration cooling air was applied to silica aerogel blankets to take advantage of the porous structure of material by forming a protective cooling film covering the aerogel blanket surface. The cooling film from transpiration cooling air helped the silica aerogel blanket to contain material degradation much beyond the temperature rating of the material. For extended combustion tests with durations as long as 70 min, silica aerogel blankets were directly exposed to combustion products at adiabatic flame temperatures over 2,000 K. This proof-of-concept study showed great promise in using aerogel blankets for insulting metal liner from hot combustion products. The steel base plate on the back side of the aerogel blanket was able to achieve steady state within the duration of the combustion tests, indicating only limited material degradations occurred to aerogel blankets when exposed to high-temperature combustion products. At steady state, the silicon aerogel blanket was recorded for taking a temperature difference as high as 1,580 K when the transpiration cooling air was used.
The degradation of aerogel blankets was studied by comparing samples before and after combustion using SEM. Based upon the examination of the tested samples, it is hypothesized that degradation occurs through three primary mechanisms; the loss of the glass fiber content, the sintering of the silica aerogel structure, and the partial melting of the silica aerogel structure. The SEM examination indicated that the upper temperature limit was exceed for continuous filament glass fibers, which compose 40–60% of the structure of the silica aerogel blanket. Silica aerogels have been shown to sinter through a viscous sintering mechanism which is controlled by the viscosity of the silica at the sintering temperature, pore size, and pore size distribution. The analysis also suggests that the molten glass from the fibers reduced the melting temperature of the silica component leading to localized melting of the silica aerogel. A recommendation for improving the durability of the aerogel would be to replace the glass fiber content with a more resilient ceramic fiber such as an alumina based fiber. As referred by (Avincola et al., 2015) and seen in our results, it is recommended that a non-silica aerogel be utilized in application where high temperature steam may be encountered due to the volatilization of silica. In addition, future work will include a longer duration isothermal test to examine the long-term durability of the samples and the extent and effect of sintering which may occur in the aerogel.
Nomenclature
IR
Infrared Camera
HP
Silicon Rubber heater
BT
Black Tape
SE
Secondary Electron
SEM
Scanning Electron Microscope
SP
Steel plate
Tf
Flame Temperature, K
Tlimit
Limit Temperature of Material, K
Tm
Temperature near Exhaust Duct, K
k
Thermal Conductivity, W/m·K
l
Thickness, mm
ε
Emissivity
τ
Transmission of an optic window
φ
Equivalence ratio
φp
Porosity
ρ
Density, kg/m3