
Introduction
A centrifugal compressor is mostly used in a wide range of applications due to a high pressure ratio and small size. Centrifugal compressors with a vaneless diffuser are often employed due to their wider stability range, compared to those with a vaned diffuser. However, the operating range is limited by the onset of rotating stall and surge. Prior to the onset of the surge, the rotating stall was generally occurred. Therefore, to enhance the operating range and suppress the surge onset, one should must focus on understanding the rotating stall generation mechanism.
Numerous researchers have reported rotating stall behavior in centrifugal compressors with vaneless diffuser. The tornado-type separation vortex caused by full blade leading-edge separation was observed under the flow field of a developed rotating condition (Iwakiri et al., 2009). Zhang et al. investigated the volute influence on stall inception onset and development. Under the volute influence, the spillage vortices at a leading edge of impeller blades were developed by a static pressure peak near the tongue (Zhang et al., 2019). Therefore, the centrifugal compressor impeller stall was strongly related to a suction side separation and tip-leakage vortex. Additionally, many reports discuss a diffuser stall behavior in a vaneless diffuser. Senoo et al. were the first to investigate the relationship between reverse flow and the initiation of a vaneless diffuser rotating stall in a centrifugal blower. They proposed initiation criteria for a vaneless diffuser rotating stall (Senoo et al., 1977; Senoo and Kinoshita, 1978). Ohuchida et al. suggested both a boundary layer separation pattern and a stall propagation mechanism in a vaneless diffuser by PIV experiments (Ohuchida et al., 2013). They indicated that a rotating reverse flow disturbance in the diffuser was related to developing of a rotating stall cell, blocking interior diffuser flow at near-surge. However, the detailed diffuser stall generation mechanism in a vaneless diffuser was not completely understood.
Previous publications revealed the mechanism of rotating stall in the centrifugal compressor with vaned diffuser (Fujisawa and Ohta, 2017; Fujisawa et al., 2019a,b). The current study is focused on the generation mechanism of a diffuser stall in vaneless diffuser. Both experimental and numerical analysis were conducted on stall inception of centrifugal compressor with vaneless diffuser. The unsteady velocity was measured in circumferential and meridional direction within vaneless diffuser. Furthermore, Detached Eddy Simulation (DES) analysis over the entire compressor region, including the volute, was performed to reveal more detailed diffuser stall cell behavior.
Experimental apparatus and procedure
The tested centrifugal compressor schematic view for this study is shown in Figure 1. The test rig at Waseda University was used for a shipboard turbocharger, consisting of an impeller, vaneless diffuser, and volute. The impeller is equipped with seven full blades and seven splitter blades. The geometry details, as well as key parameters, of the tested compressor are summarized in Table 1. The impeller is an open-type impeller with a tip clearance that is 1.0% of the impeller blade width at B1 = 105.6 mm. The impeller rotational speed was set to 6,000 min−1.
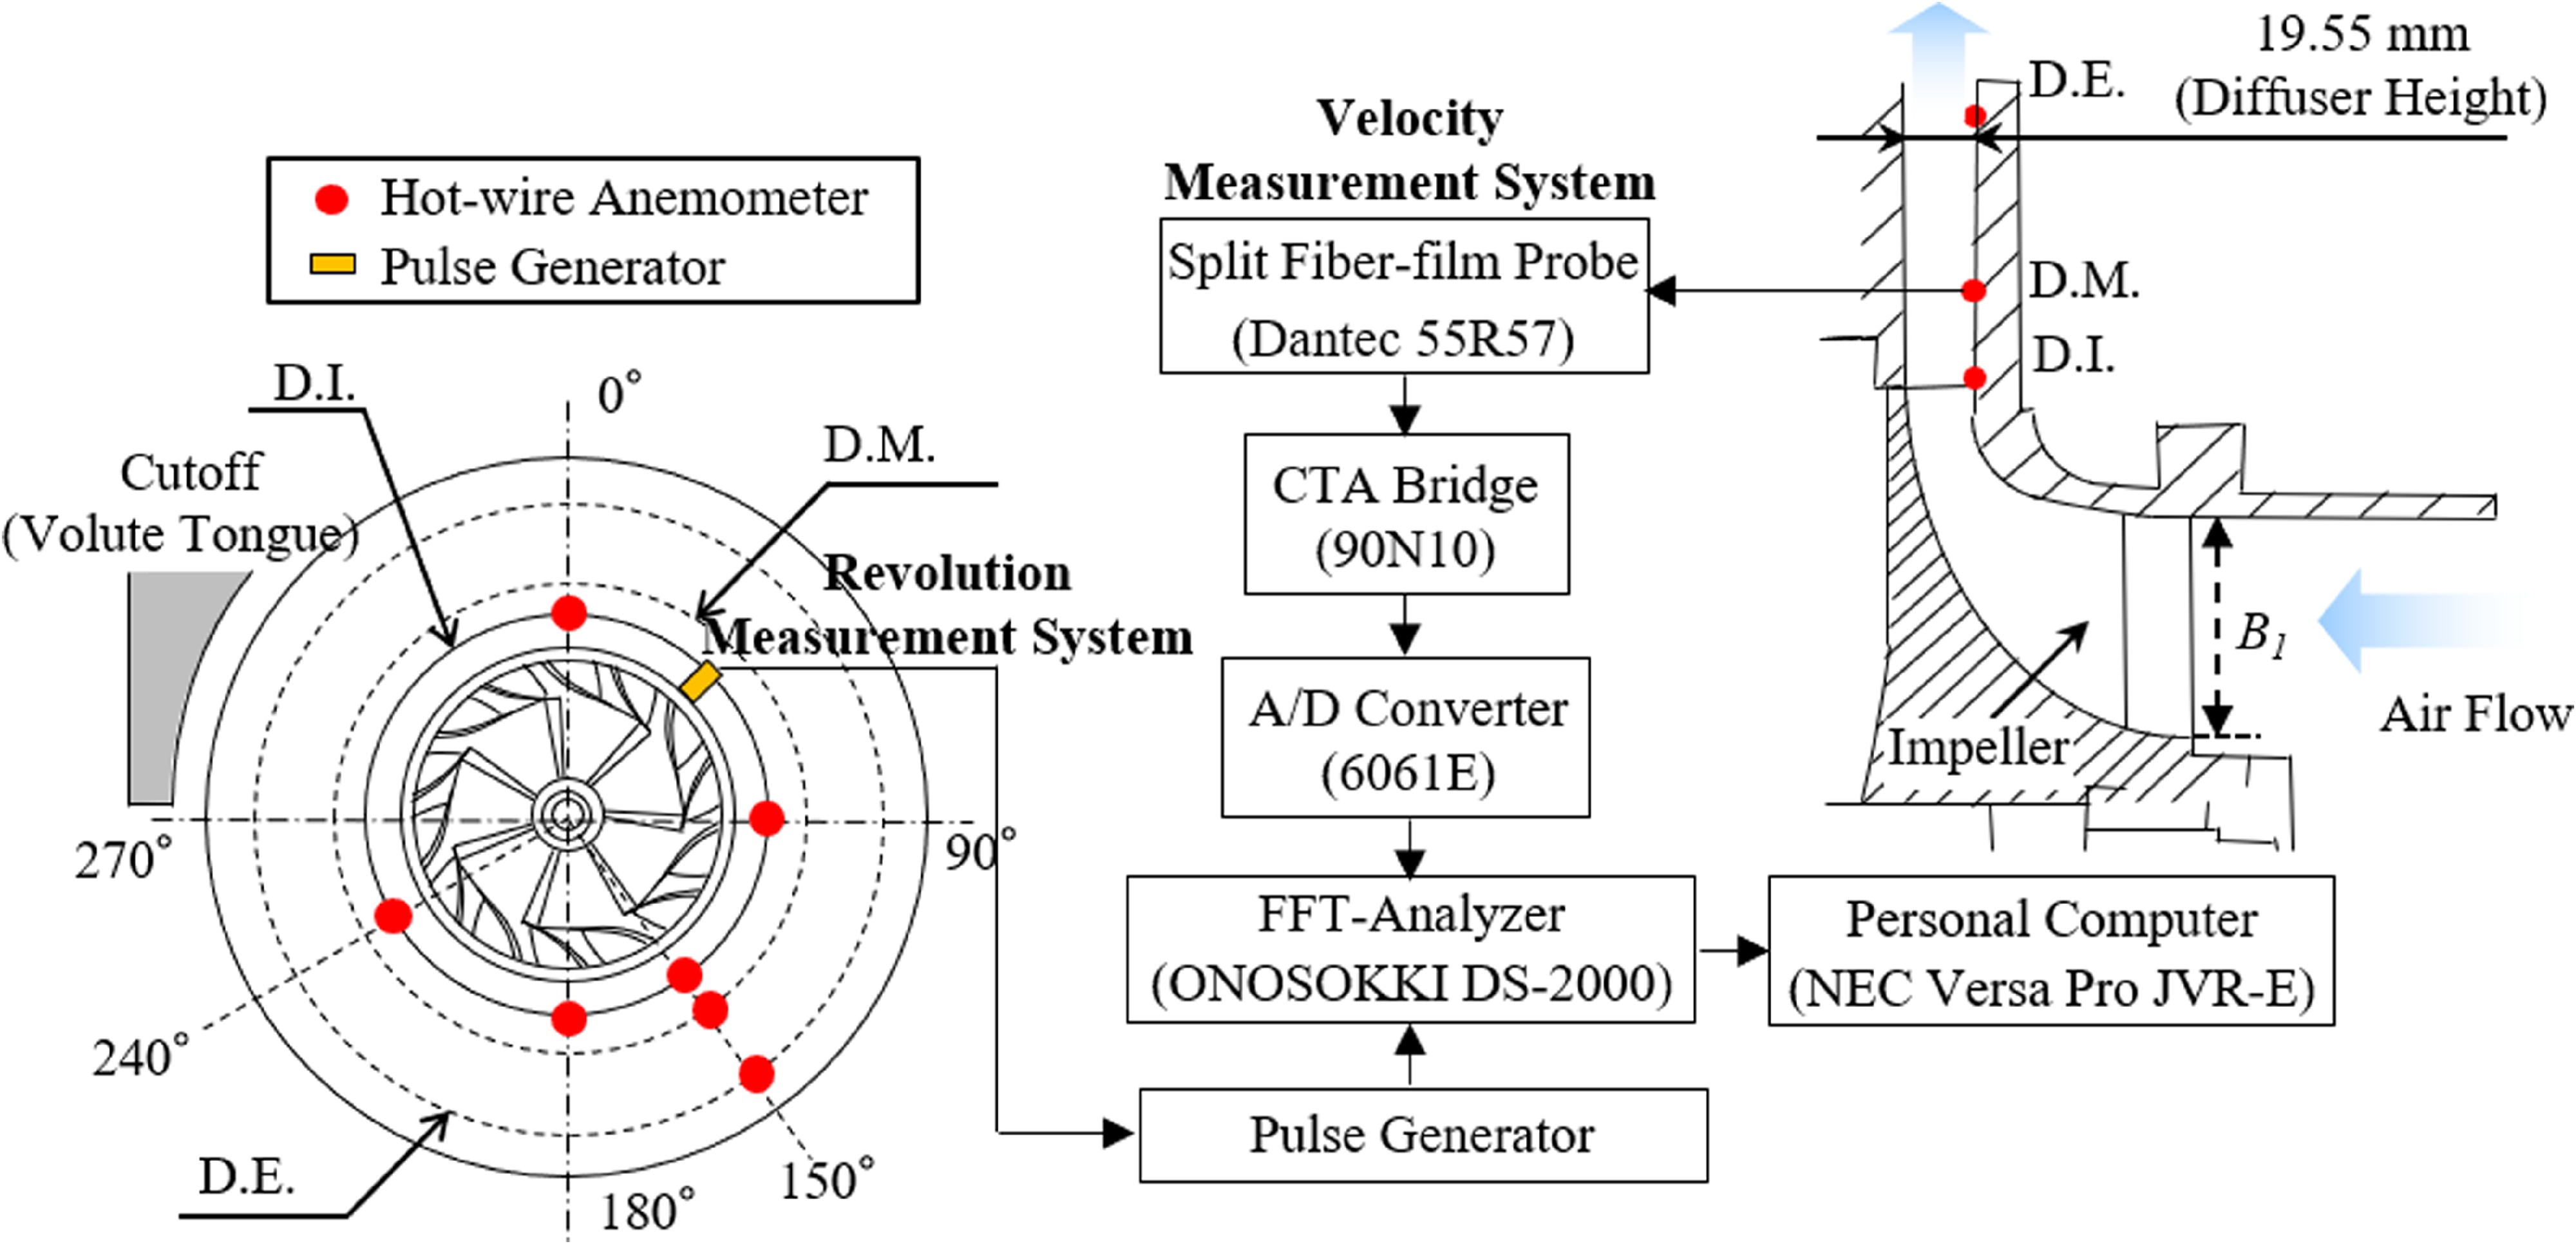
Table 1.
Dimensions of tested compressor.
The steady pressure was measured at the compressor exit by a differential pressure transducer (Yamatake JTD920A). The orifice flow meter was set at the outlet duct to measure the steady mass flow rate. Velocity fluctuations, which defined as the difference between the time averaged value and the peak one, were measured on the test rig using a hot-wire anemometer (DANTEC, 55R57). The circumferential measurement points were placed at five positions (0°, 90°, 150°, 180° and 240°), respectively as shown in Figure 1. The meridional velocity measurement points were at the diffuser inlet (D.I.), diffuser midsection (D.M.), and diffuser exit (D.E.). The hot-wire probes traversed in the spanwise direction in 5% increments of the diffuser width. The probe body is a 2.3 mm diameter, which is about 10% of the diffuser passage width. Although this probe size slightly influenced on the flow blockage, the scale of stall behavior would be greatly larger compared with the velocity fluctuation induced by the probe effect.
CFD methodology
A detached eddy simulation (DES) code was developed for investigating the internal flow. The Computational Fluid Dynamics (CFD) code was constructed to solve the three-dimensional compressible Navier-Stokes equations. The convective flux was evaluated using the flux difference splitting (FDS) method and extended to the third-order MUSCL interpolation. The viscous flux was evaluated as a second-order central difference. The Matrix Free Gauss-Seidel (MFGS) implicit algorithm was employed for time integration. The shear stress transport (SST) k-ω turbulence model was used in this code and applied to DES. This model depends on the local turbulent length scale and grid spacing size. The dissipation term in the k-equation of the SST k-ω turbulence model is modified as follows:
where l is the turbulent length scale, Δ is the local grid spacing, and the model’s constant coefficient CDES was set to the recommended value by the report (Strelets, 2001). The several studies reported that DES analysis is more suitable than URANS for detailed flow field investigations near stall in both axial and centrifugal compressor (Im et al., 2012; Yamada et al., 2017). Our In-house code was successfully validated for unsteady flow fields of various turbomachinery flows (Fujisawa et al., 2019b; Zhang et al., 2020).
The computational domains applied in the numerical simulations are illustrated in Figure 2. The grid system included 14 impeller passages, vaneless diffuser, and a volute. The impeller (including clearance region) and vaneless diffuser systems had 32.0 and 11.0 million cells, respectively. The volute region had 22.0 million cells. In total, the computational grid had 65.0 million cells. The wall cell width was 0.1 µm, corresponding to a y+ parameter, equal to approximately one along all solid surfaces. At the inflow boundary, the total pressure and temperature were fixed, while mass flow rates were fixed at the outflow boundary. Across a sliding boundary separating the moving impeller and stationary diffuser frames, the most recent data on one side were interpolated to obtain opposite side data by using an unsteady simulation sliding mesh. Nonslip and adiabatic conditions were adopted for the wall conditions. The main CFD setup was summarized in Table 2.
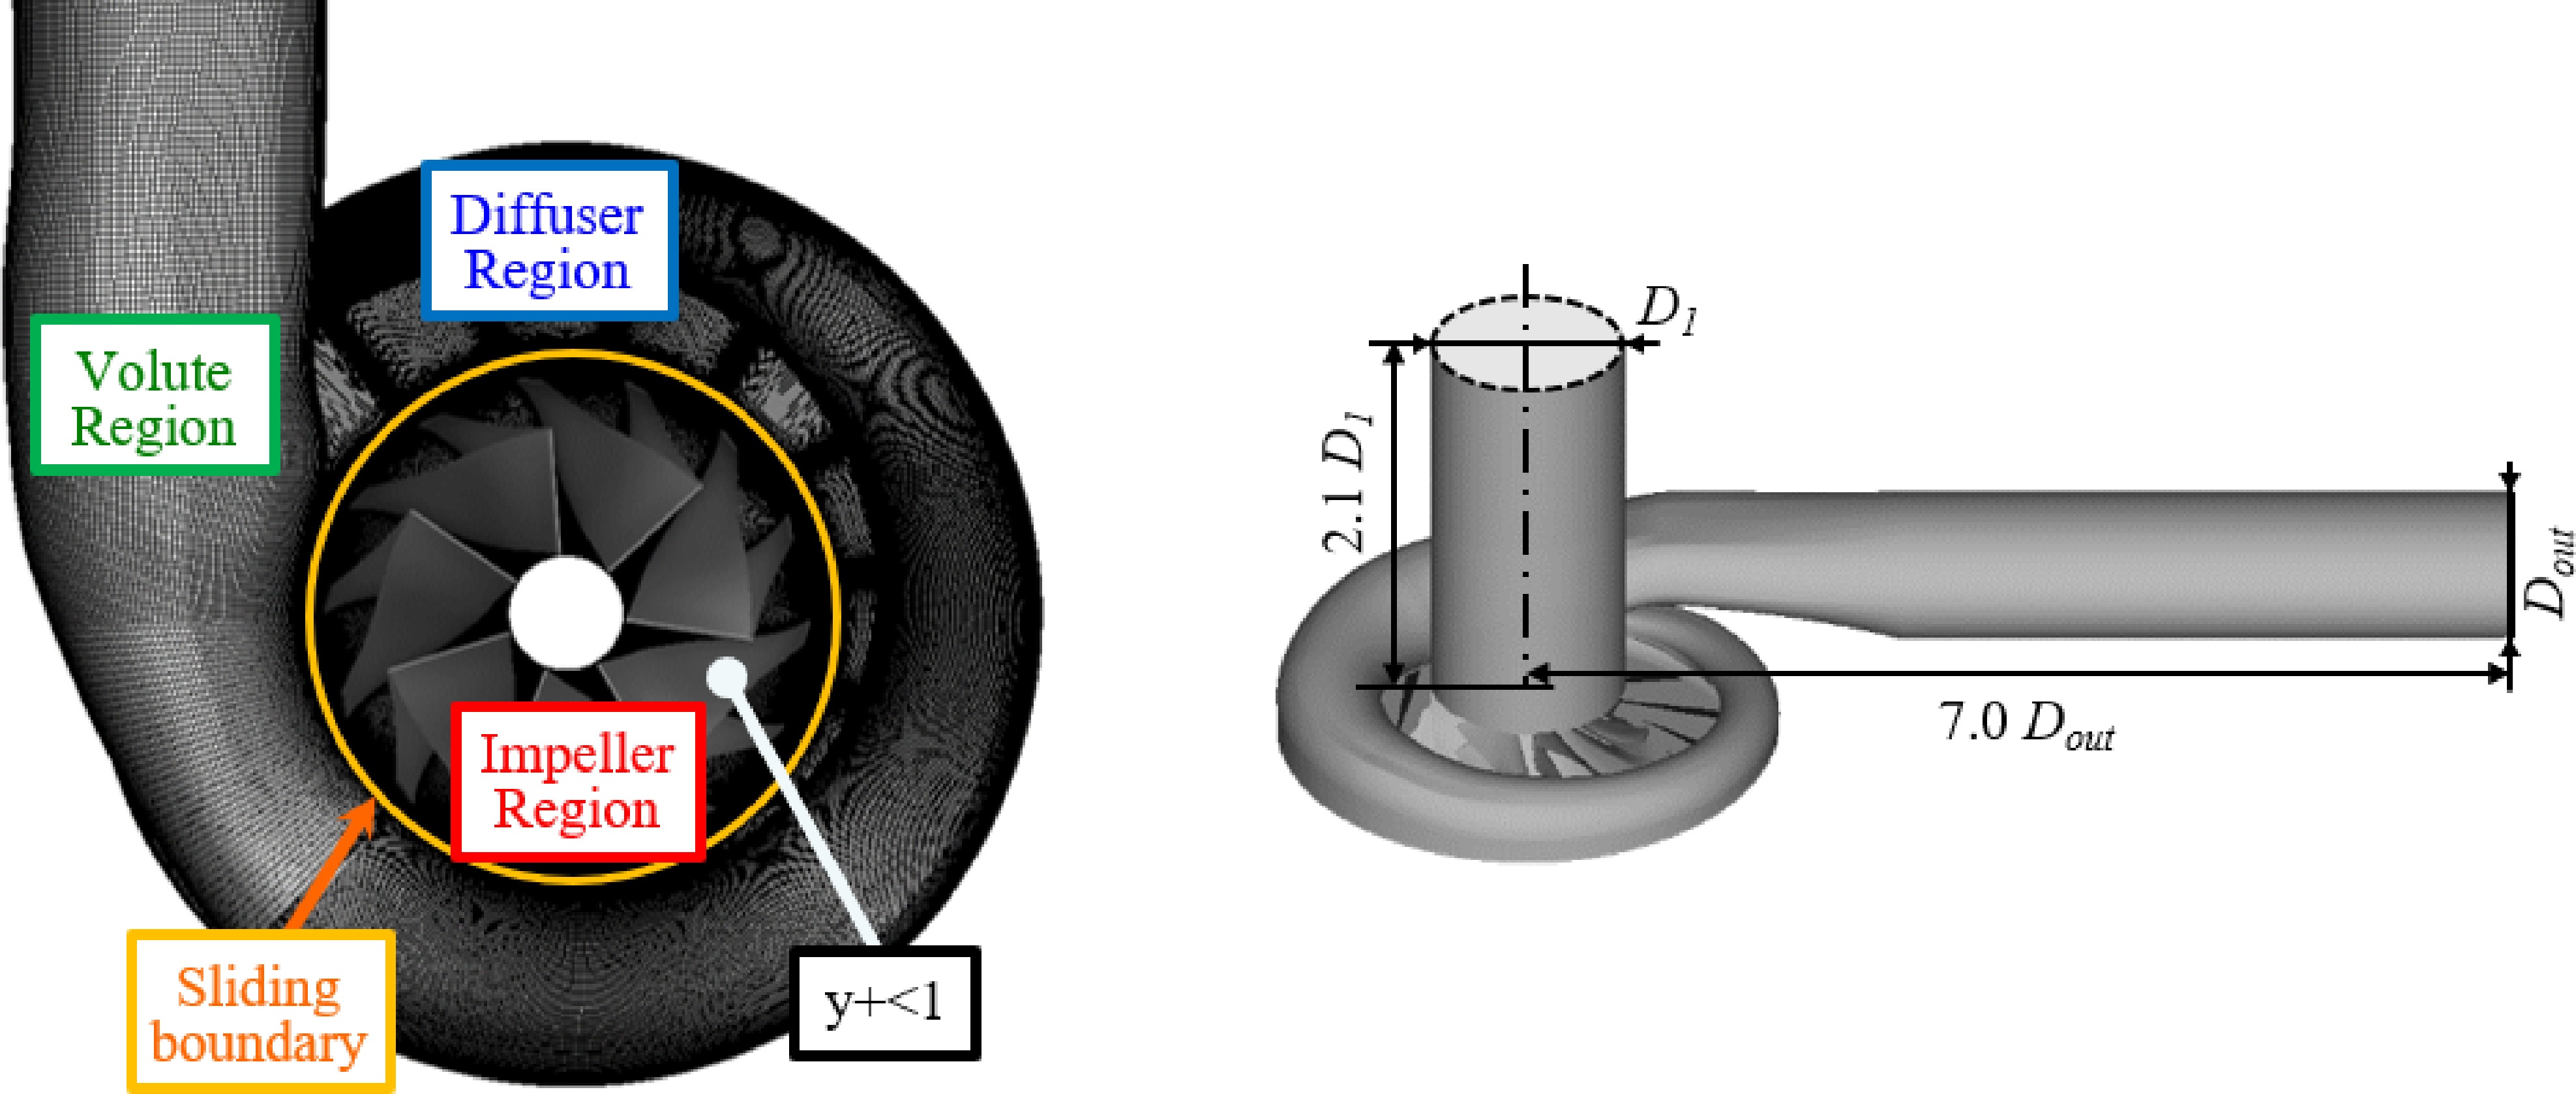
Table 2.
Computational setup.
Compressor performance and stall characteristics
The experimental and numerical compressor performance results are shown in Figure 3. The numerical total pressure-rise characteristics were obtained from the time-averaged results of unsteady DES analysis and steady RANS analyses. The flow and total pressure-rise coefficients are defined as follows:
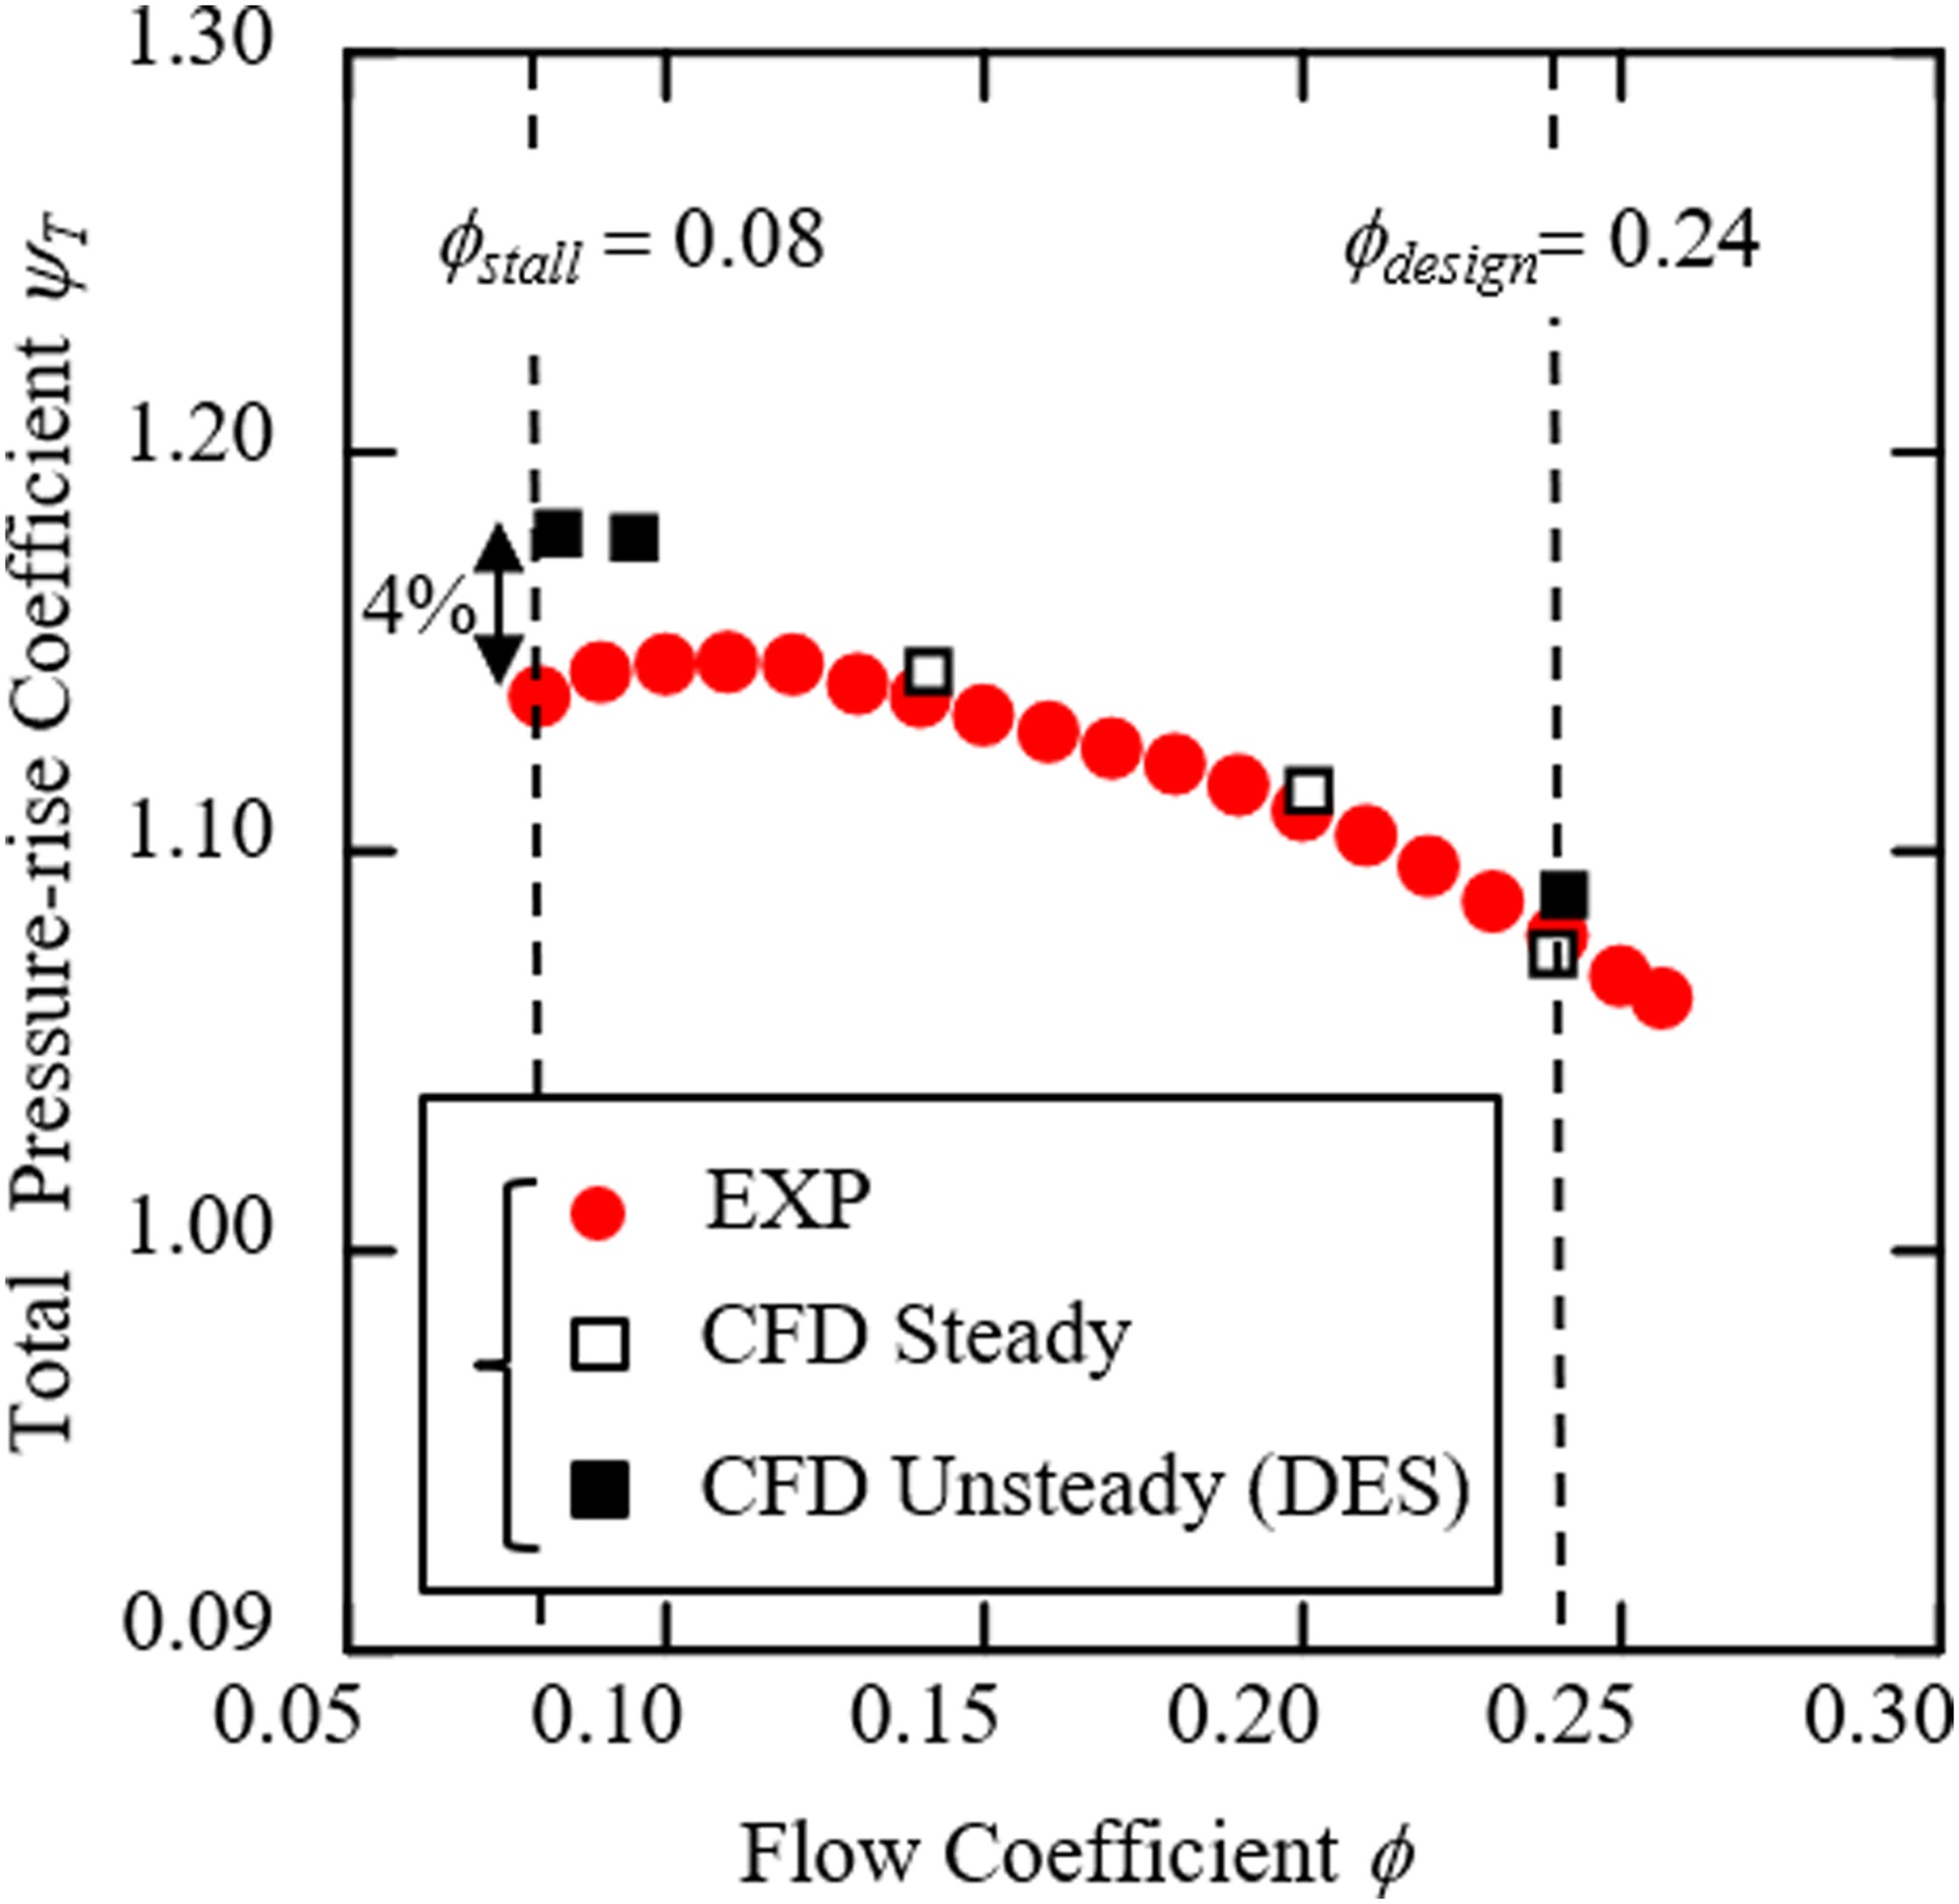
The unsteady simulations were conducted at the operational design point (ϕ = 0.24), and two off-design points (ϕ = 0.10 and 0.08). The steady simulations were conducted at three operational points from ϕ = 0.24 to ϕ = 0.14. The steady RANS analysis results were in good agreement with measured results. The unsteady CFD results were overestimated particularly at the off-design points as compared with the test results. The mixing loss especially within scroll passages was assumed to be underpredicted at near stall point, but the main factor of overprediction of pressure rise coefficient still was not confirmed. However, the relative error between experimental and unsteady CFD results at off design points was within 5%, as shown in Figure 3. Therefore, it was no problem to investigate the characteristics of a diffuser stall because the relative error was small.
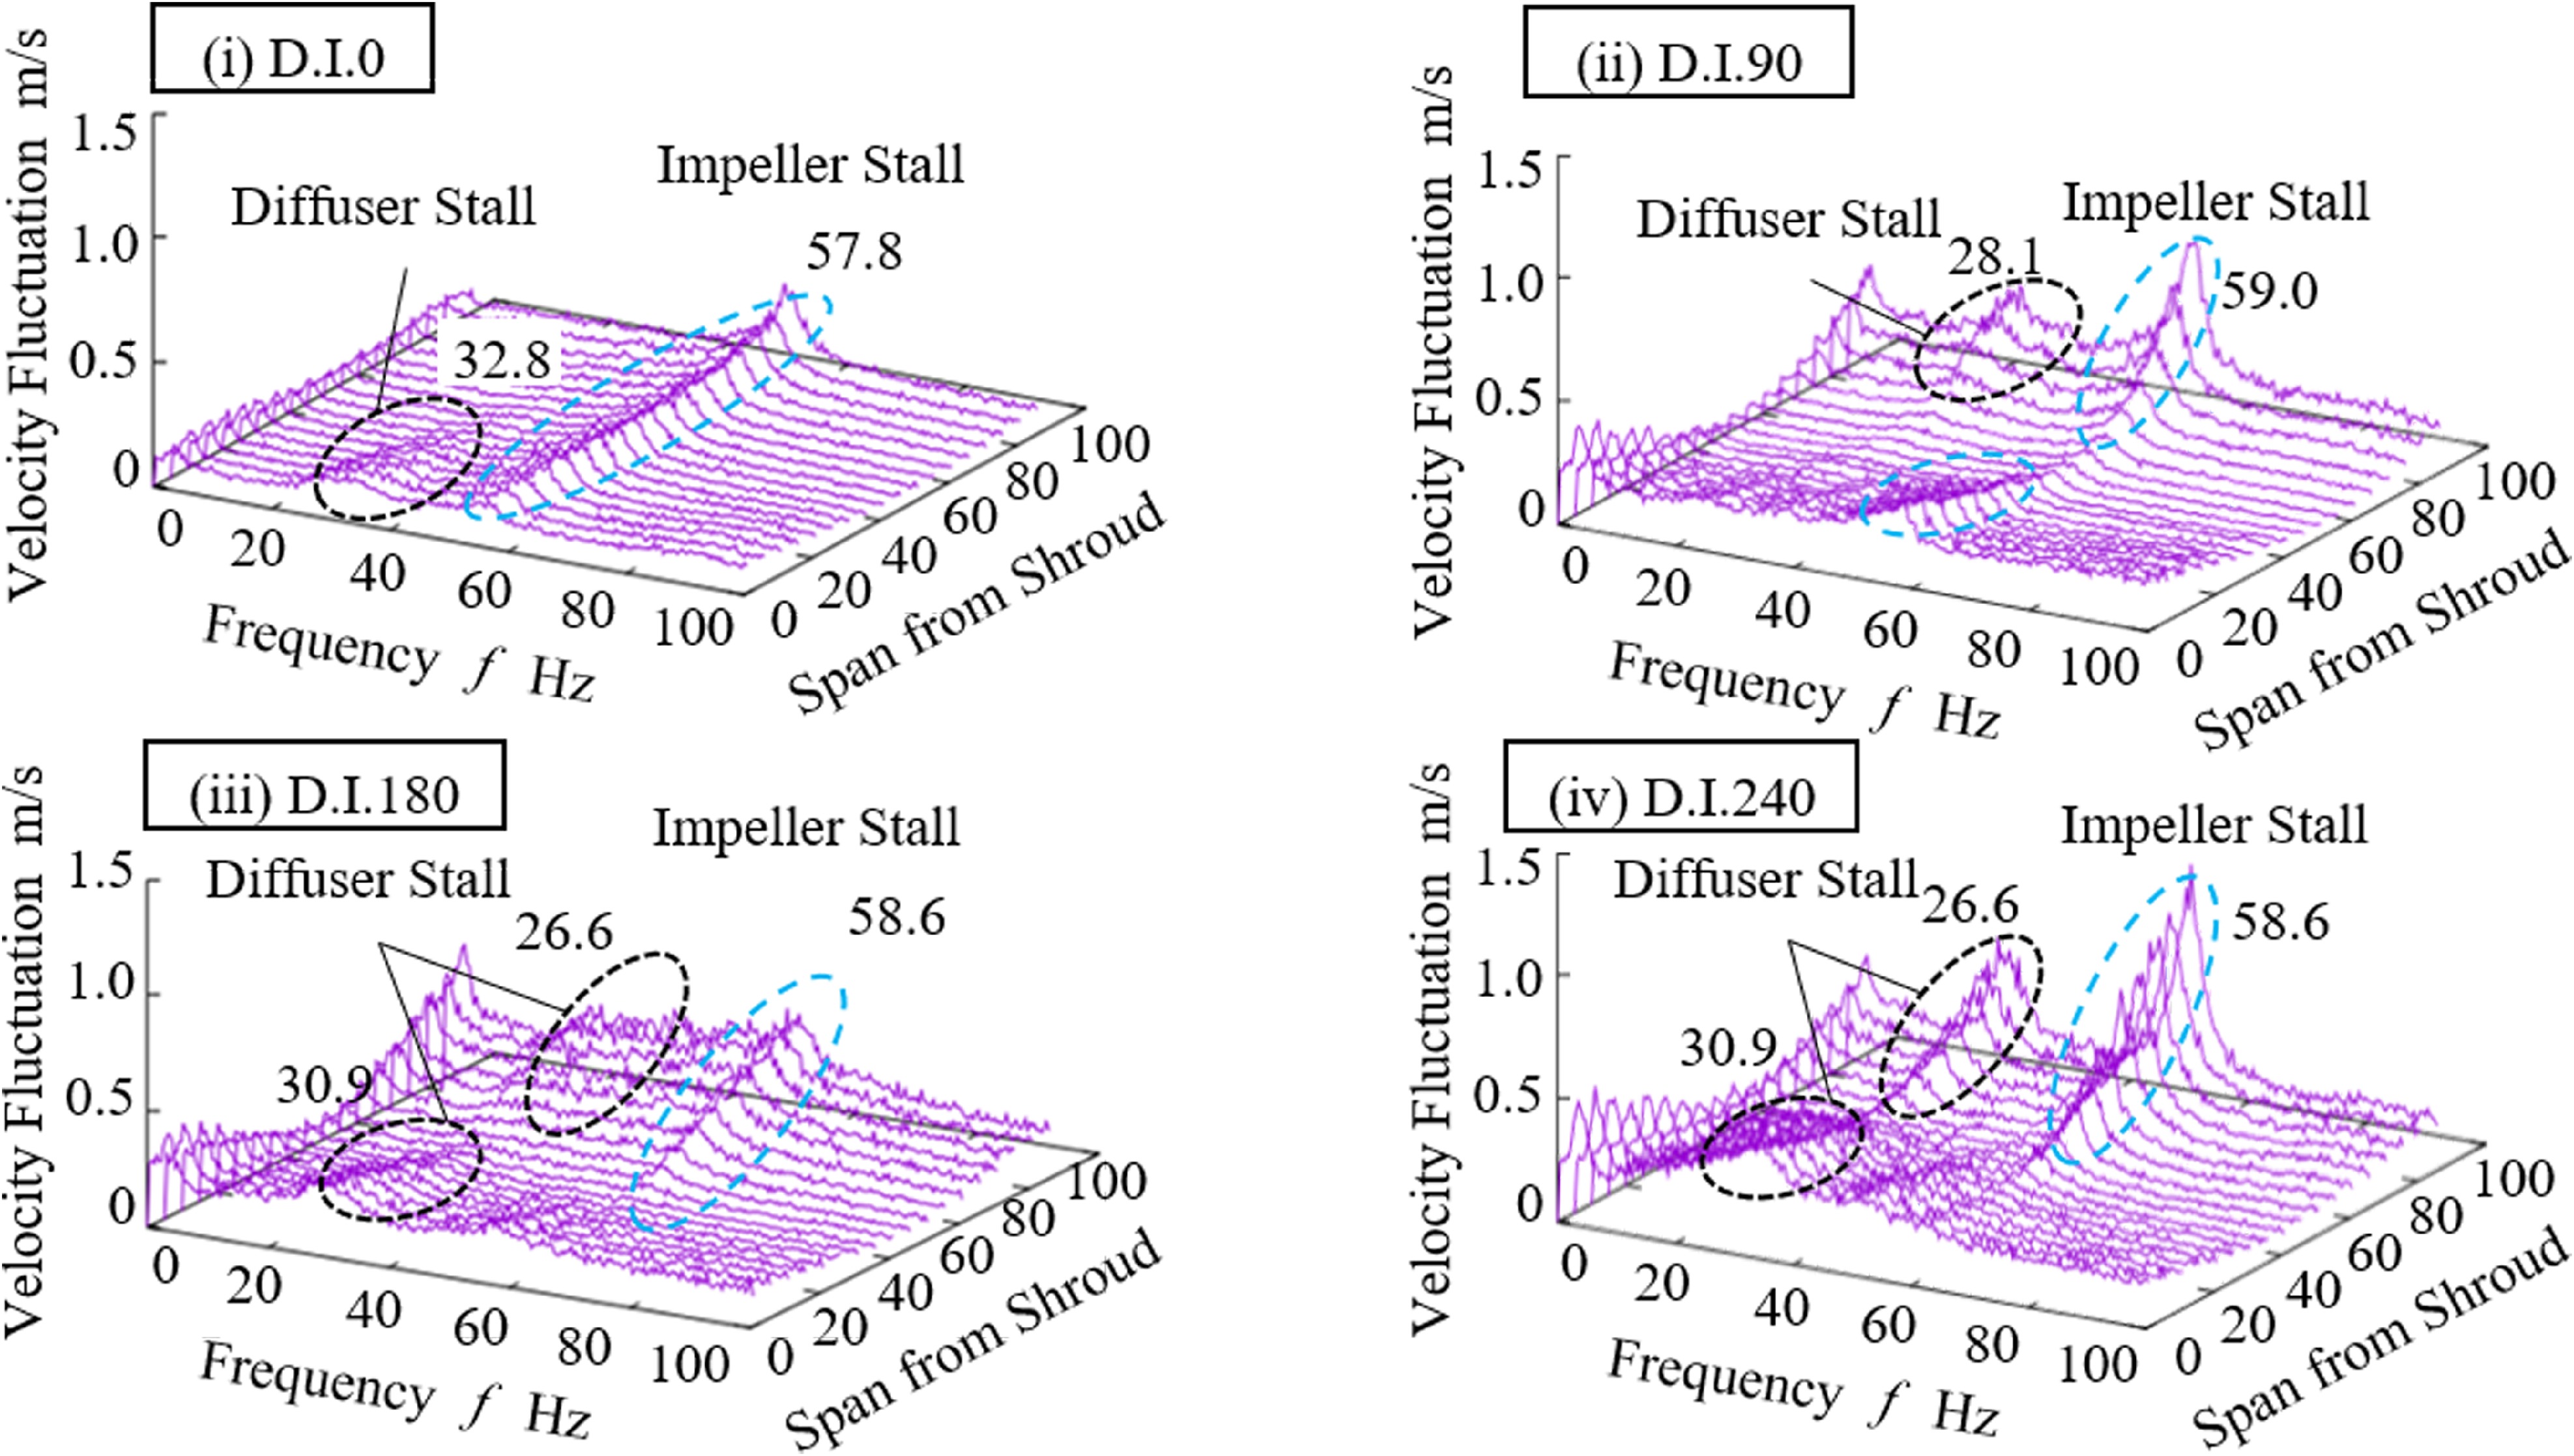
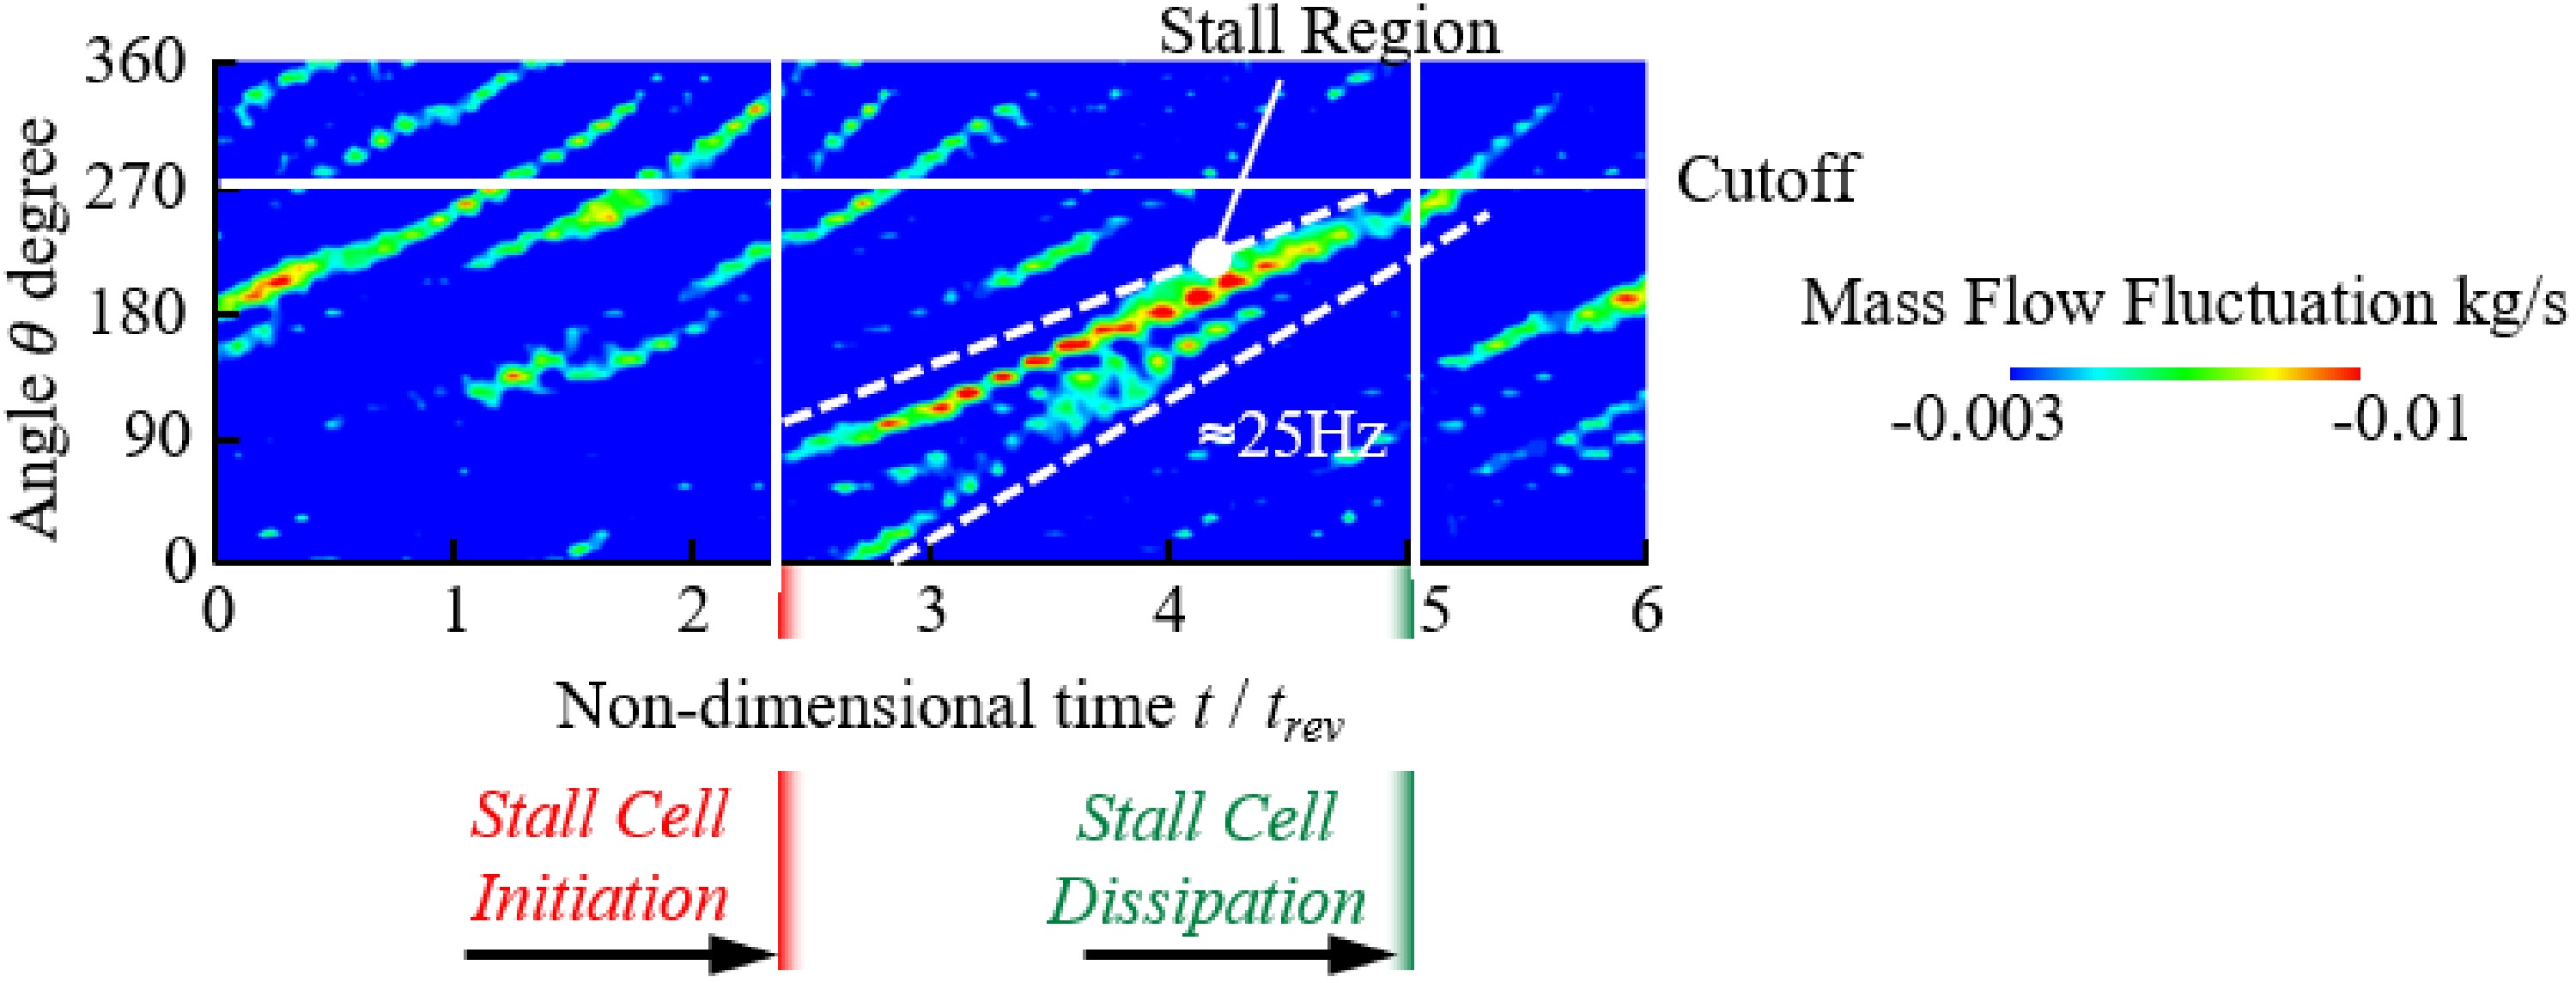
To investigate the unsteady rotating stall characteristics, the radial velocity fluctuation of impeller discharge flow was measured with a split-film anemometer at ϕ = 0.08. The radial velocity was measured at D.I.0, 90, 180 and 240, which were indicated in Figure 1. The fast Fourier transformation (FFT) spatial distribution results at each measurement point in the spanwise direction are shown in Figure 4. The vertical axis represents the radial velocity fluctuation magnitude. From Figure 4, two types of velocity fluctuations were observed. One occurred at around 58 Hz and the other occurred at around 25–30 Hz. Based on previous report (Fujisawa et al., 2016), the unsteady phenomena at around 58 Hz were caused by a rotating stall within the impeller passages. On the other hand, the lower frequency fluctuation at around 25–30 Hz, was equivalent to 25–30% of the impeller rotating speed, and was caused by a rotating stall within the vaneless diffuser. Particularly, focusing on the diffuser stall, its characteristics varied depending on the circumferential position. From Figure 4(i), the small velocity fluctuation magnitudes caused by diffuser stall were observed near the shroud wall at D.I.0. Whereas, from Figure 4(ii), the large velocity fluctuation magnitude around 28 Hz was observed near the hub wall at D.I.90. Furthermore, Figure 4(iii) and (iv) show that the largest velocity fluctuation magnitude caused by the diffuser stall was observed near both shroud and hub walls at D.I.180 and 240, located near the cutoff. The mass flow fluctuations at the diffuser exit obtained from CFD analysis are shown in Figure 5. The red colored line indicated low mass flow regions and this rotational speed was about 25% of the impeller rotation speed. Therefore, the red colored low mass flow regions was assumed to be caused by the rotating diffuser stall, which rotated at 25% of the impeller rotation speed. This low mass flow region appeared at 90° and disappeared after passing the cutoff. Both experiment and CFD analysis indicated that the diffuser rotating stall initiated at 90° and developed further as the diffuser stall cell approached the cutoff. After passing the cutoff, the diffuser rotating stall was attenuated. The detailed unsteady diffuser stall behavior is discussed later.
Generation mechanism of diffuser stall
To investigate the detailed unsteady diffuser stall behavior, an unsteady DES analysis was conducted. First, to understand the flow field, Figure 6 shows the distributions of radial velocity fluctuation within the diffuser passage obtained by CFD analysis. The radial velocity fluctuation was defined as follows:
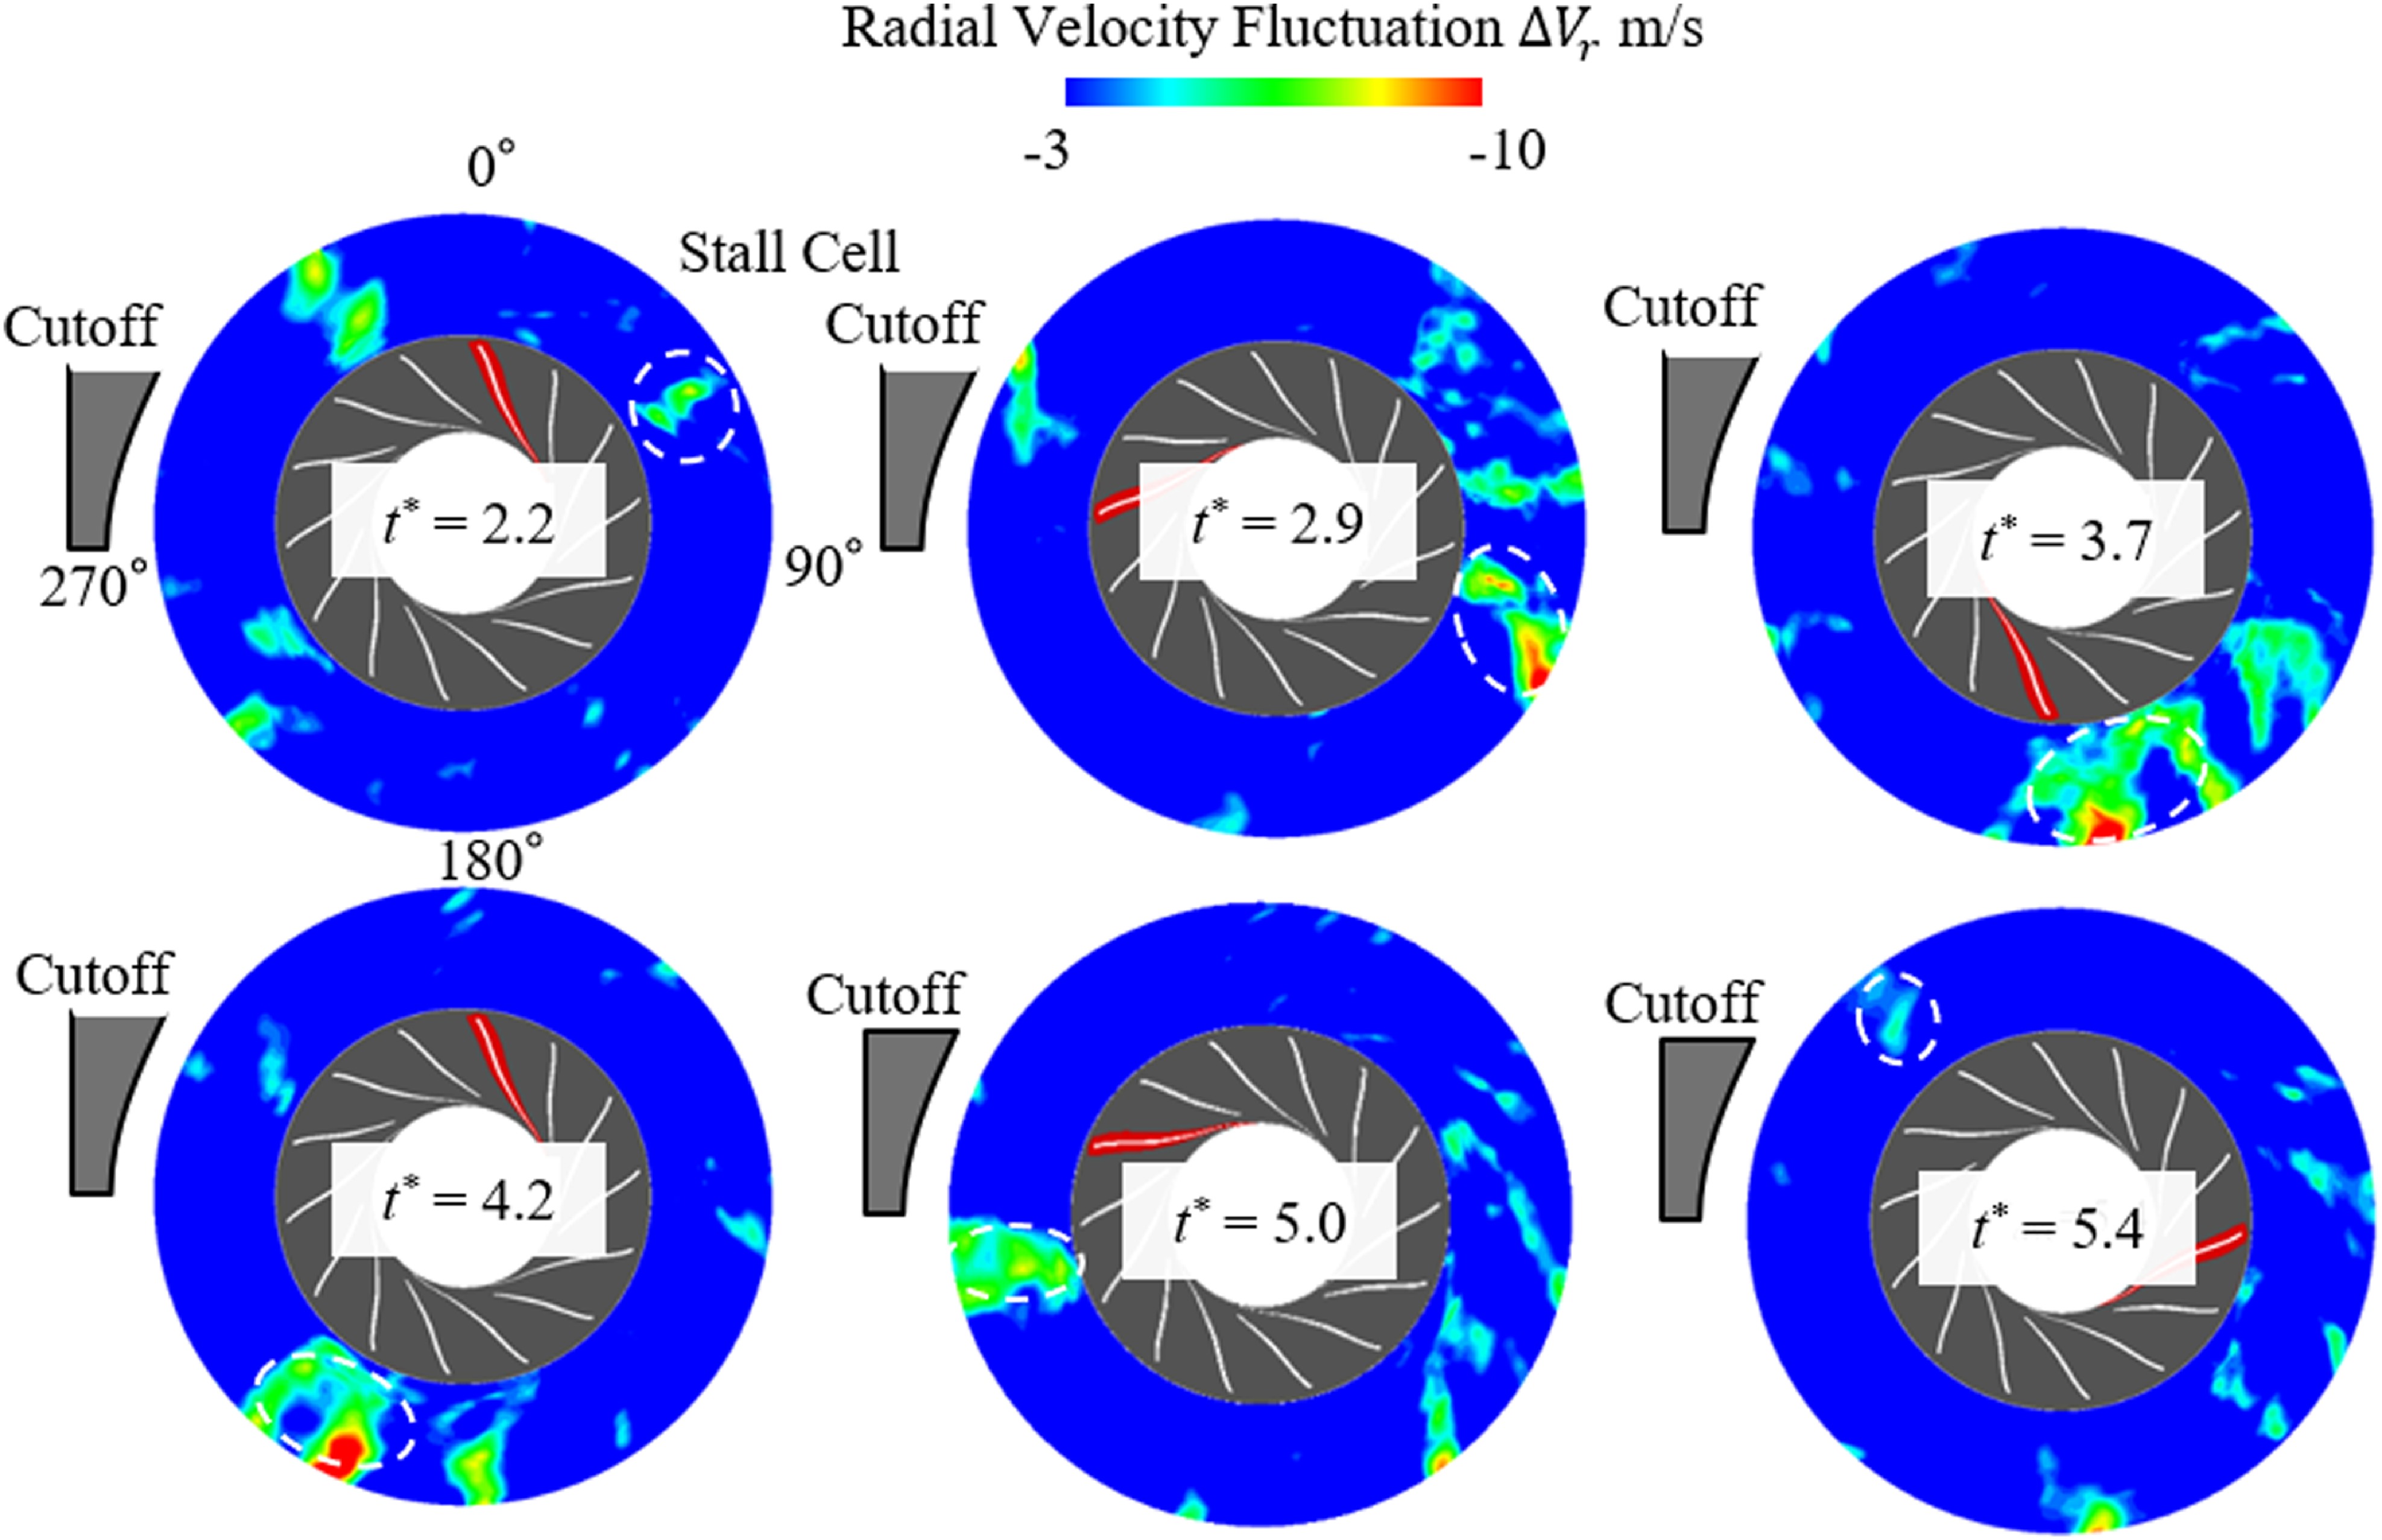
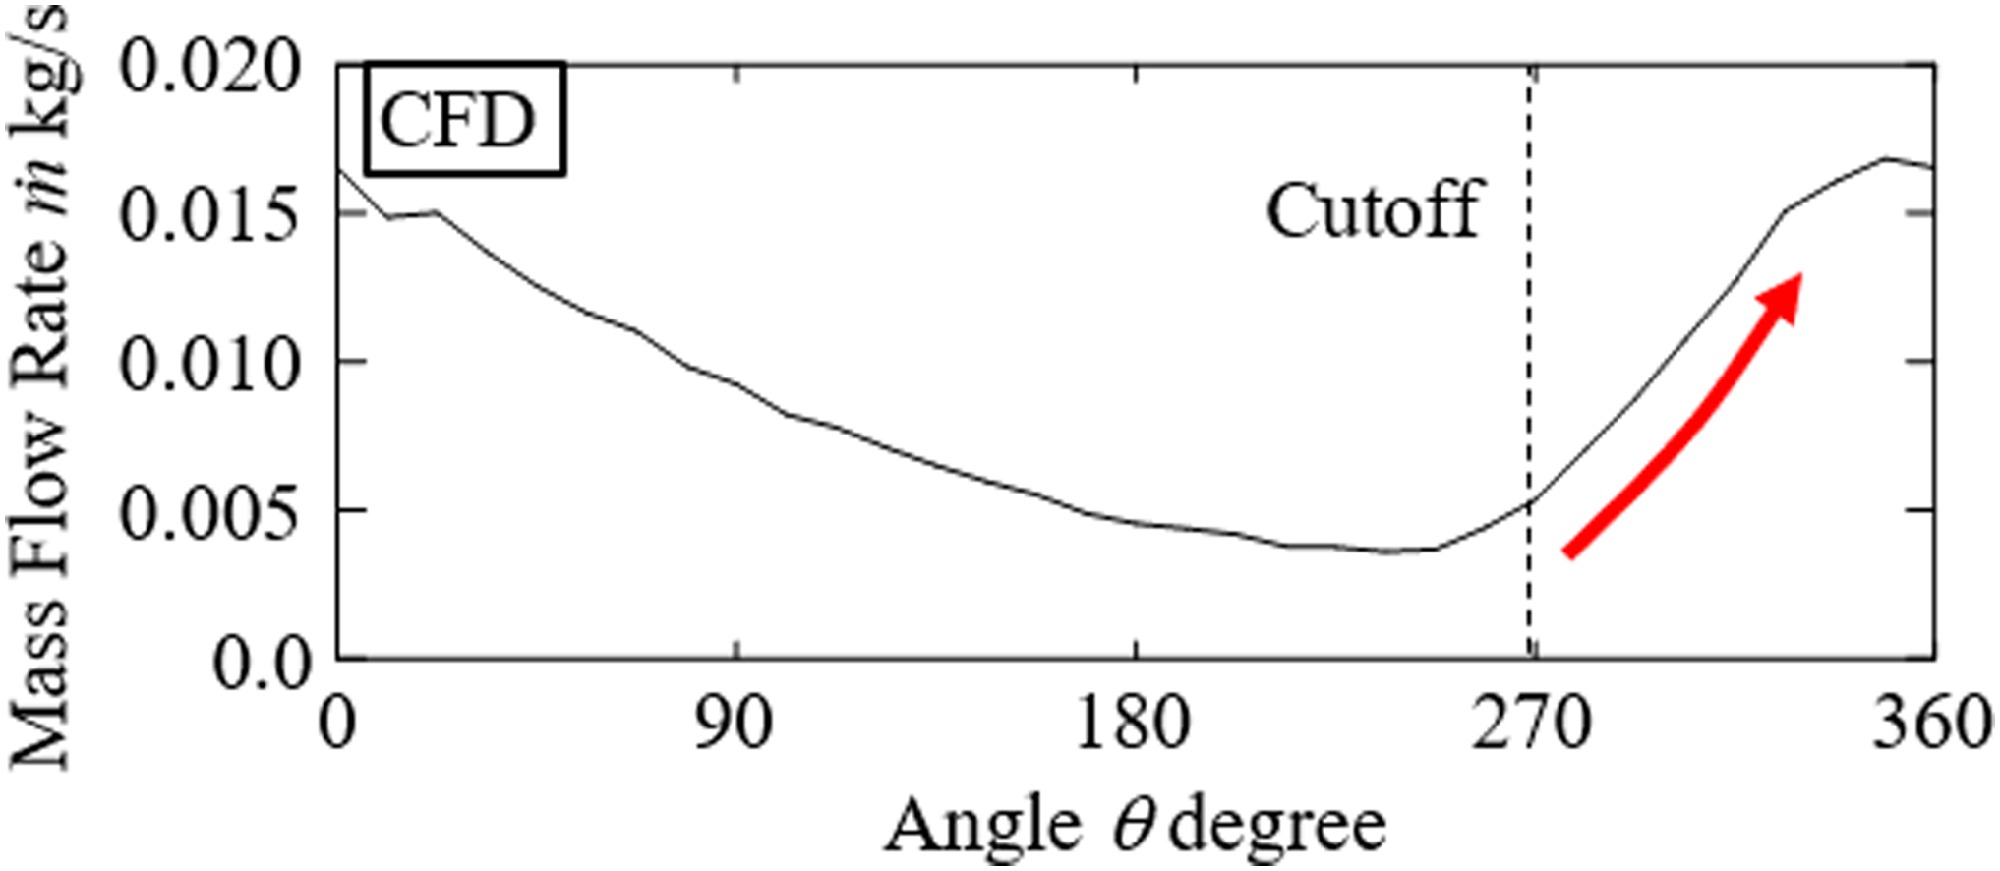
Vr_ave indicates the time-averaged radial velocity. The red color indicates the large magnitudes of radial velocity fluctuations. The region indicated by the white dashed circle is the diffuser stall cell that induced the largest mass flow fluctuations in Figure 5. Furthermore, the time-averaged mass flow rate of impeller discharge flow obtained from CFD analysis at ϕ = 0.08 is shown in Figure 7. The impeller exit plane mass flow rate was calculated on sections obtained by dividing the diffuser inlet into 32 circumferential sections. At t* = 2.2, the region with the large velocity fluctuations, as shown in Figure 6, was first generated at around 45°, where a strong circumferential adverse pressure gradient is observed, as depicted in Figure 8. Then, the large fluctuations region was formed at the diffuser exit area by the accumulation of several small backflow regions at t* = 2.9. After that, the diffuser stall cell expanded both radially and circumferentially as it approached the cutoff at t* = 3.7 and 4.2. Finally, the stall cell size reduced after passing the cutoff at t* = 5.4 due to increased impeller discharge mass flow rate at near the cutoff, as shown in Figure 7.
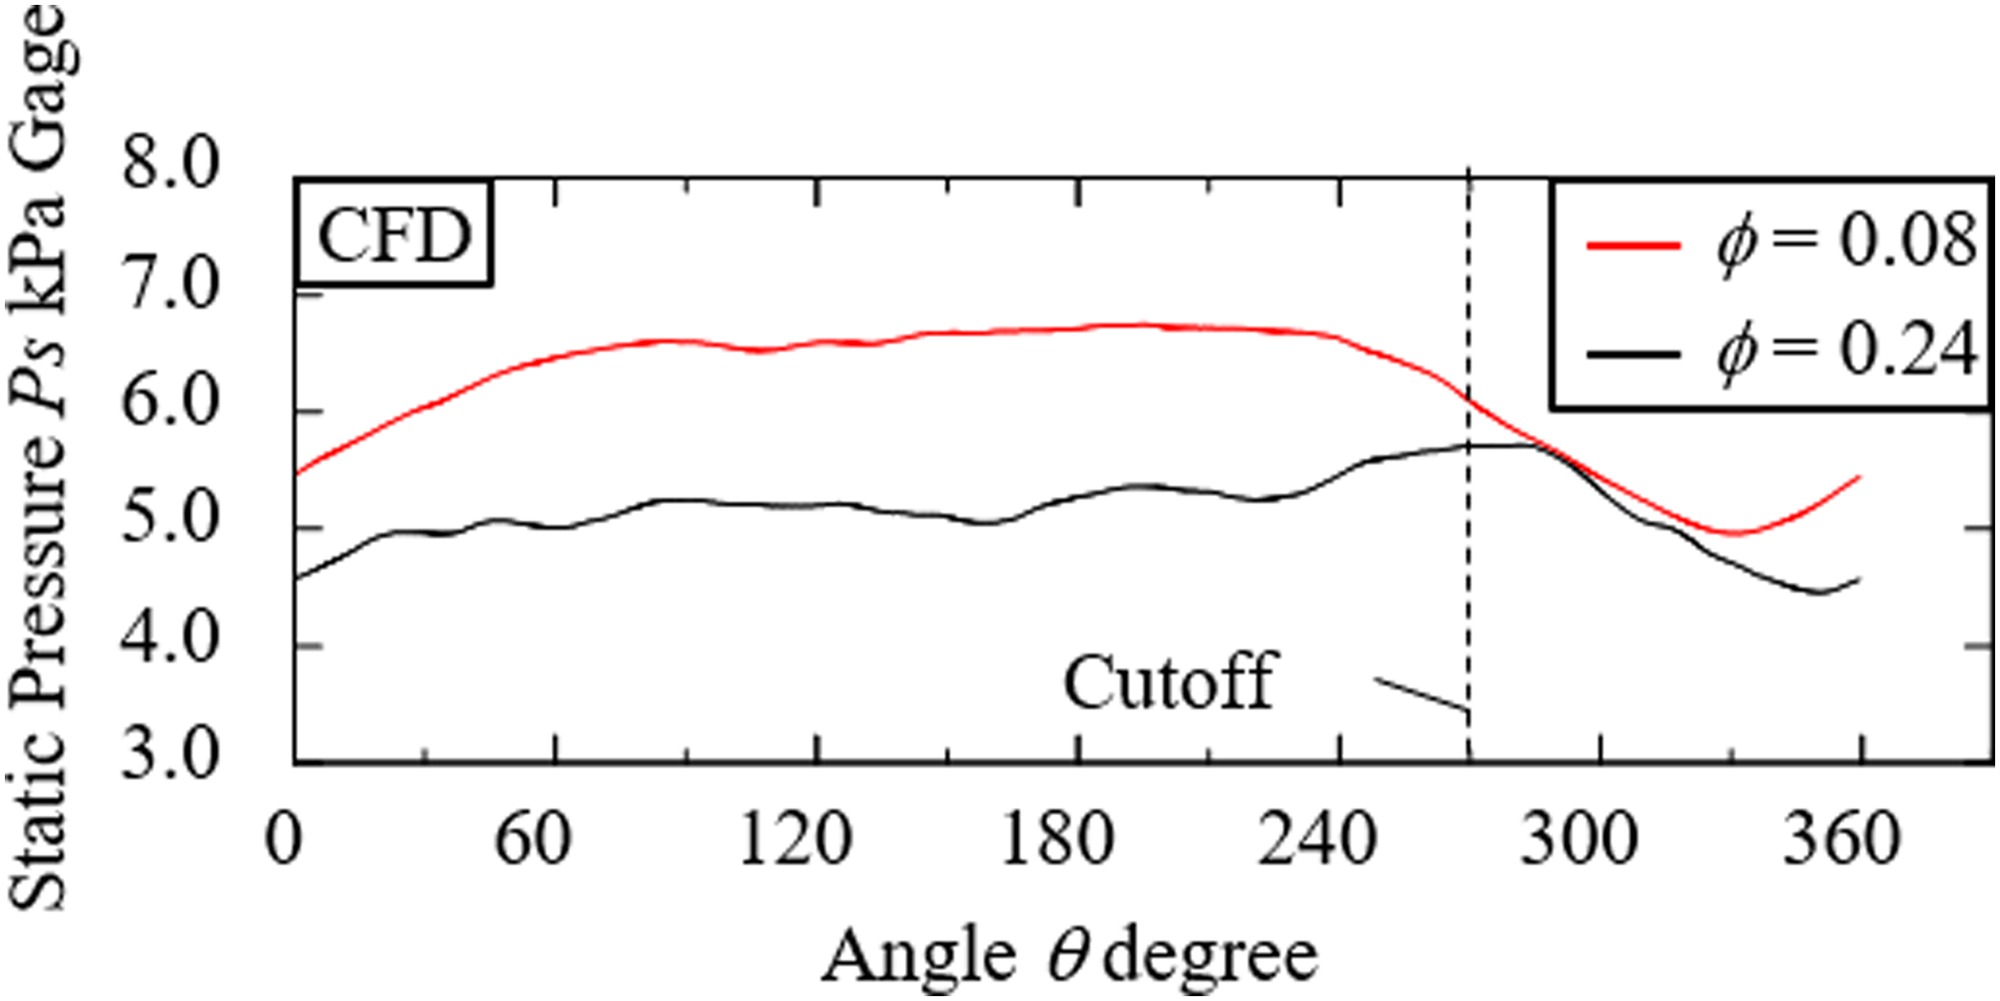
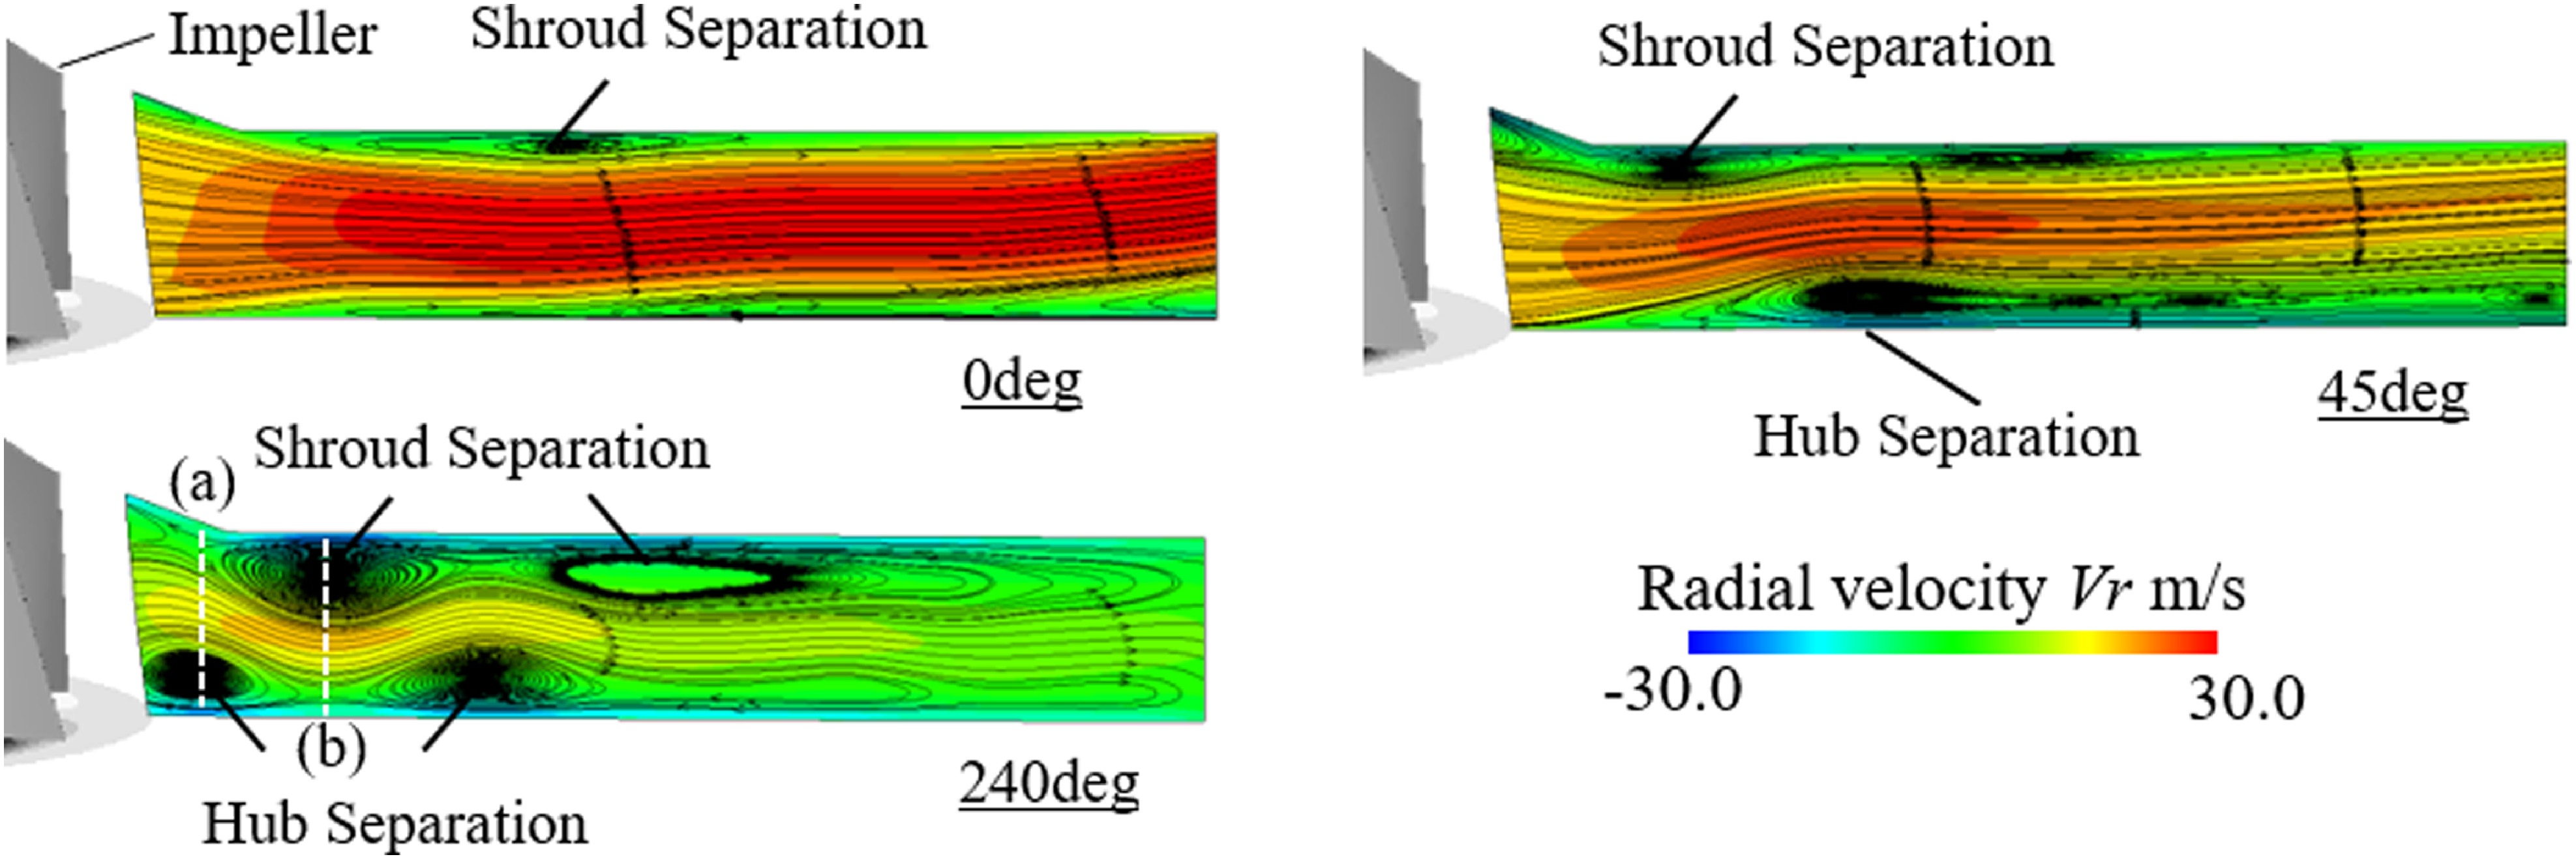
The circumferential static pressure distributions at ϕ = 0.24 and ϕ = 0.08 obtained from the CFD analysis are shown in Figure 8. The static pressure was measured at shroud wall D.M. From this figure, at around 300°, the static pressure at off-design point ϕ = 0.08 was the same level as that at design point ϕ = 0.24. However, from 0° to the cutoff, the static pressure at ϕ = 0.08 was higher than that of ϕ = 0.24. The magnitude of circumferential adverse pressure gradient was strong near 0° for ϕ = 0.08. Therefore, the diffuser stall was initiated at around 45°. Furthermore, the time-averaged meridional distribution of radial velocity and streamlines at 0°, 45°, and 240° are shown in Figure 9. The boundary layer separation occurred at hub and shroud wall by turns at 240deg, with numerous papers reporting the same phenomena (Van den Braembussche, 2019). From this paper, the spanwise pressure gradient induced the flow concentration on the side with the highest pressure. In addition, the spanwise pressure gradient inversion was generated once separation occurred, and this pressure gradient change continued until flow reversal took place on the other side. Therefore, the separations generated at both hub and shroud by turns. First, the flow concentrated on the shroud side where the total pressure was highest and boundary layer separation occurred on the hub side at 240deg (point (a)), as shown in Figure 9. At point (b), the pressure gradient inversion occurred and the flow concentrated on the hub side. Therefore, the next boundary layer separation occurred at the opposite wall. Particularly, at 45deg, the separation region was observed near the diffuser inlet shroud wall. Accordingly, the hub side boundary layer separations at around 45°, triggering the diffuser stall cell generation, were caused by the shroud side separation region at the diffuser inlet and a large circumferential adverse pressure gradient. Figure 10 shows the time-averaged limiting streamlines on hub wall obtained by measurement and CFD analysis. In the experiment, the limiting streamlines were visualized by using an oil film method. The limiting hub wall streamlines were bent at around 45° where a small backflow region generated.

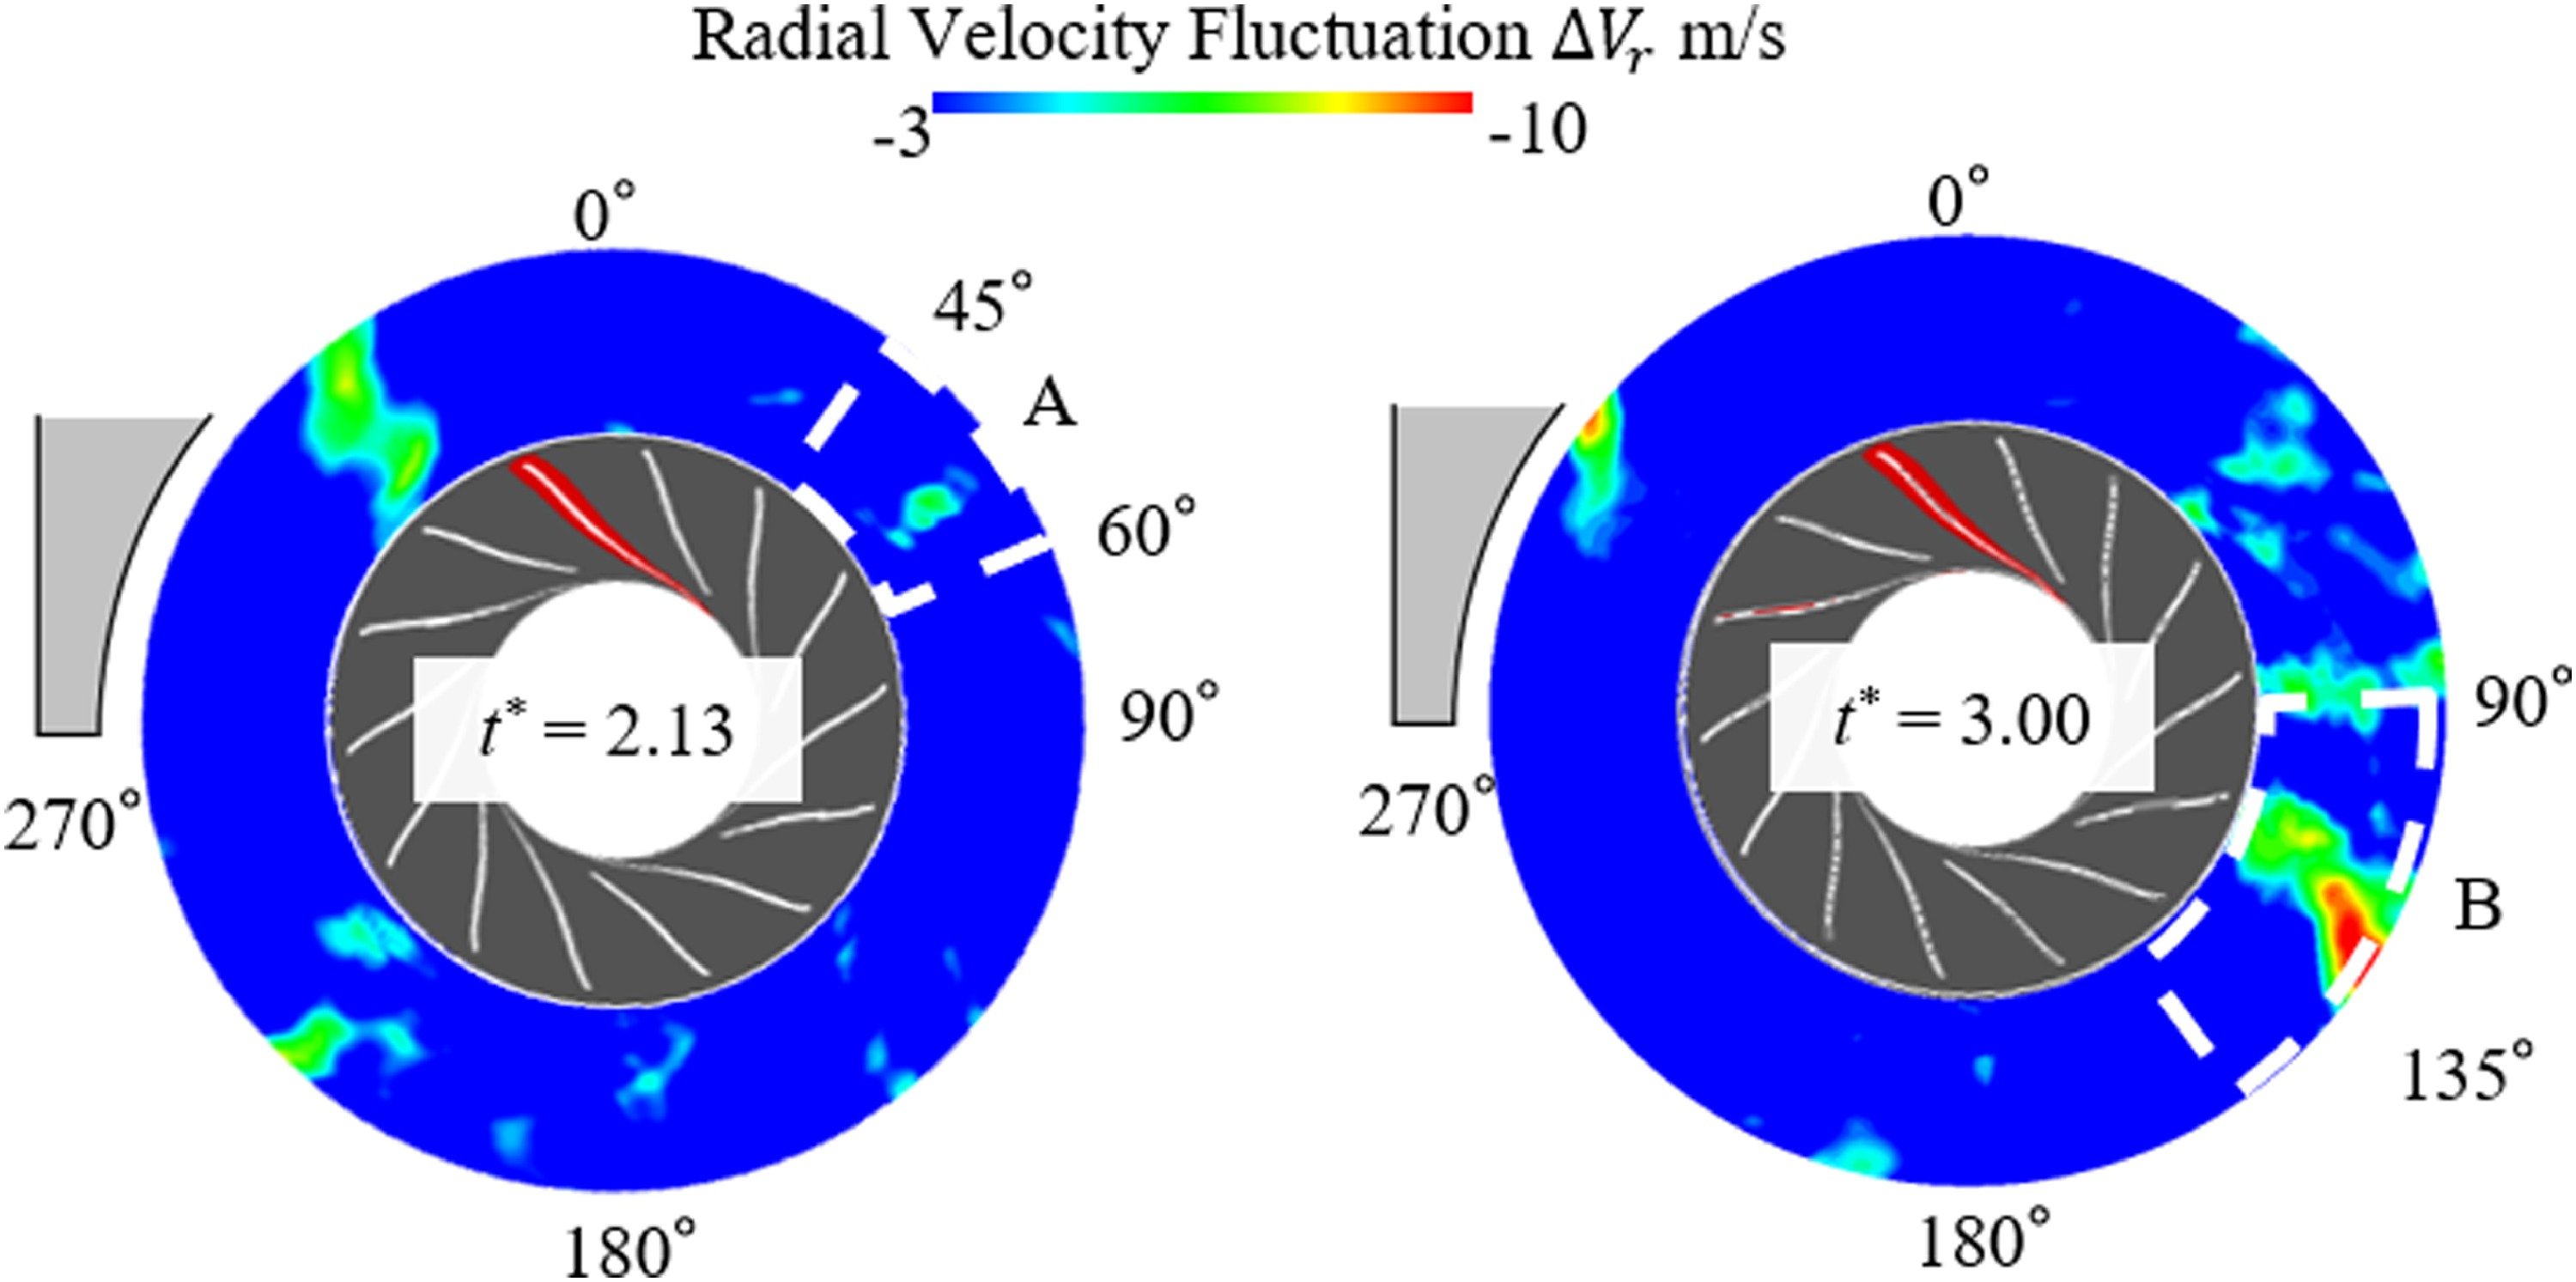
For improved understanding of the diffuser stall cell generation mechanism, the unsteady flow field was visualized. The instantaneous flow field at two different times are shown in Figure 11. The distributions of radial velocity fluctuation within the diffuser passage at each time are shown. The developing behavior of diffuser stall cell was investigated from Figures 12 and 13. Figures 12(i) and 13(i) show the meridional radial velocity distribution around the region A and B at t* = 2.13 and 3.00. Figures 12(ii) and 13(ii) show the iso-surface of Vr = −10 m/s colored by the distance from the hub wall. From Figure 12, the hub wall boundary layer separation initiated at around 45°. Then, this hub wall separation induced the next shroud wall separation because of a spanwise pressure gradient, as shown in Figure 13. The boundary layer separations on the shroud wall developed, as it can be seen by the low velocity region at diffuser exit. The hub side Backflow Region I was the impeller wake. From numerical results, the impeller wake mainly expanded on the hub side from 90° to the cutoff. The shroud side Backflow Region II consisted of the boundary layer separations. The region indicated by the black circle was the low velocity region. Backflow Region I rotated faster than Backflow Region II, as shown in Figure 13a and b. Therefore, Region I caught up with Region II and induced the boundary layer separation enlargement on the shroud wall (Region II). Furthermore, the shroud wall boundary layer separations (Region II) induced the next hub wall boundary layer separations (Region III) because of a spanwise pressure gradient. The low velocity region within vaneless diffuser developed due to the boundary layer separations occurring on the shroud and hub wall by turns. Finally, the low velocity region formed the entire diffuser passage span blockage.


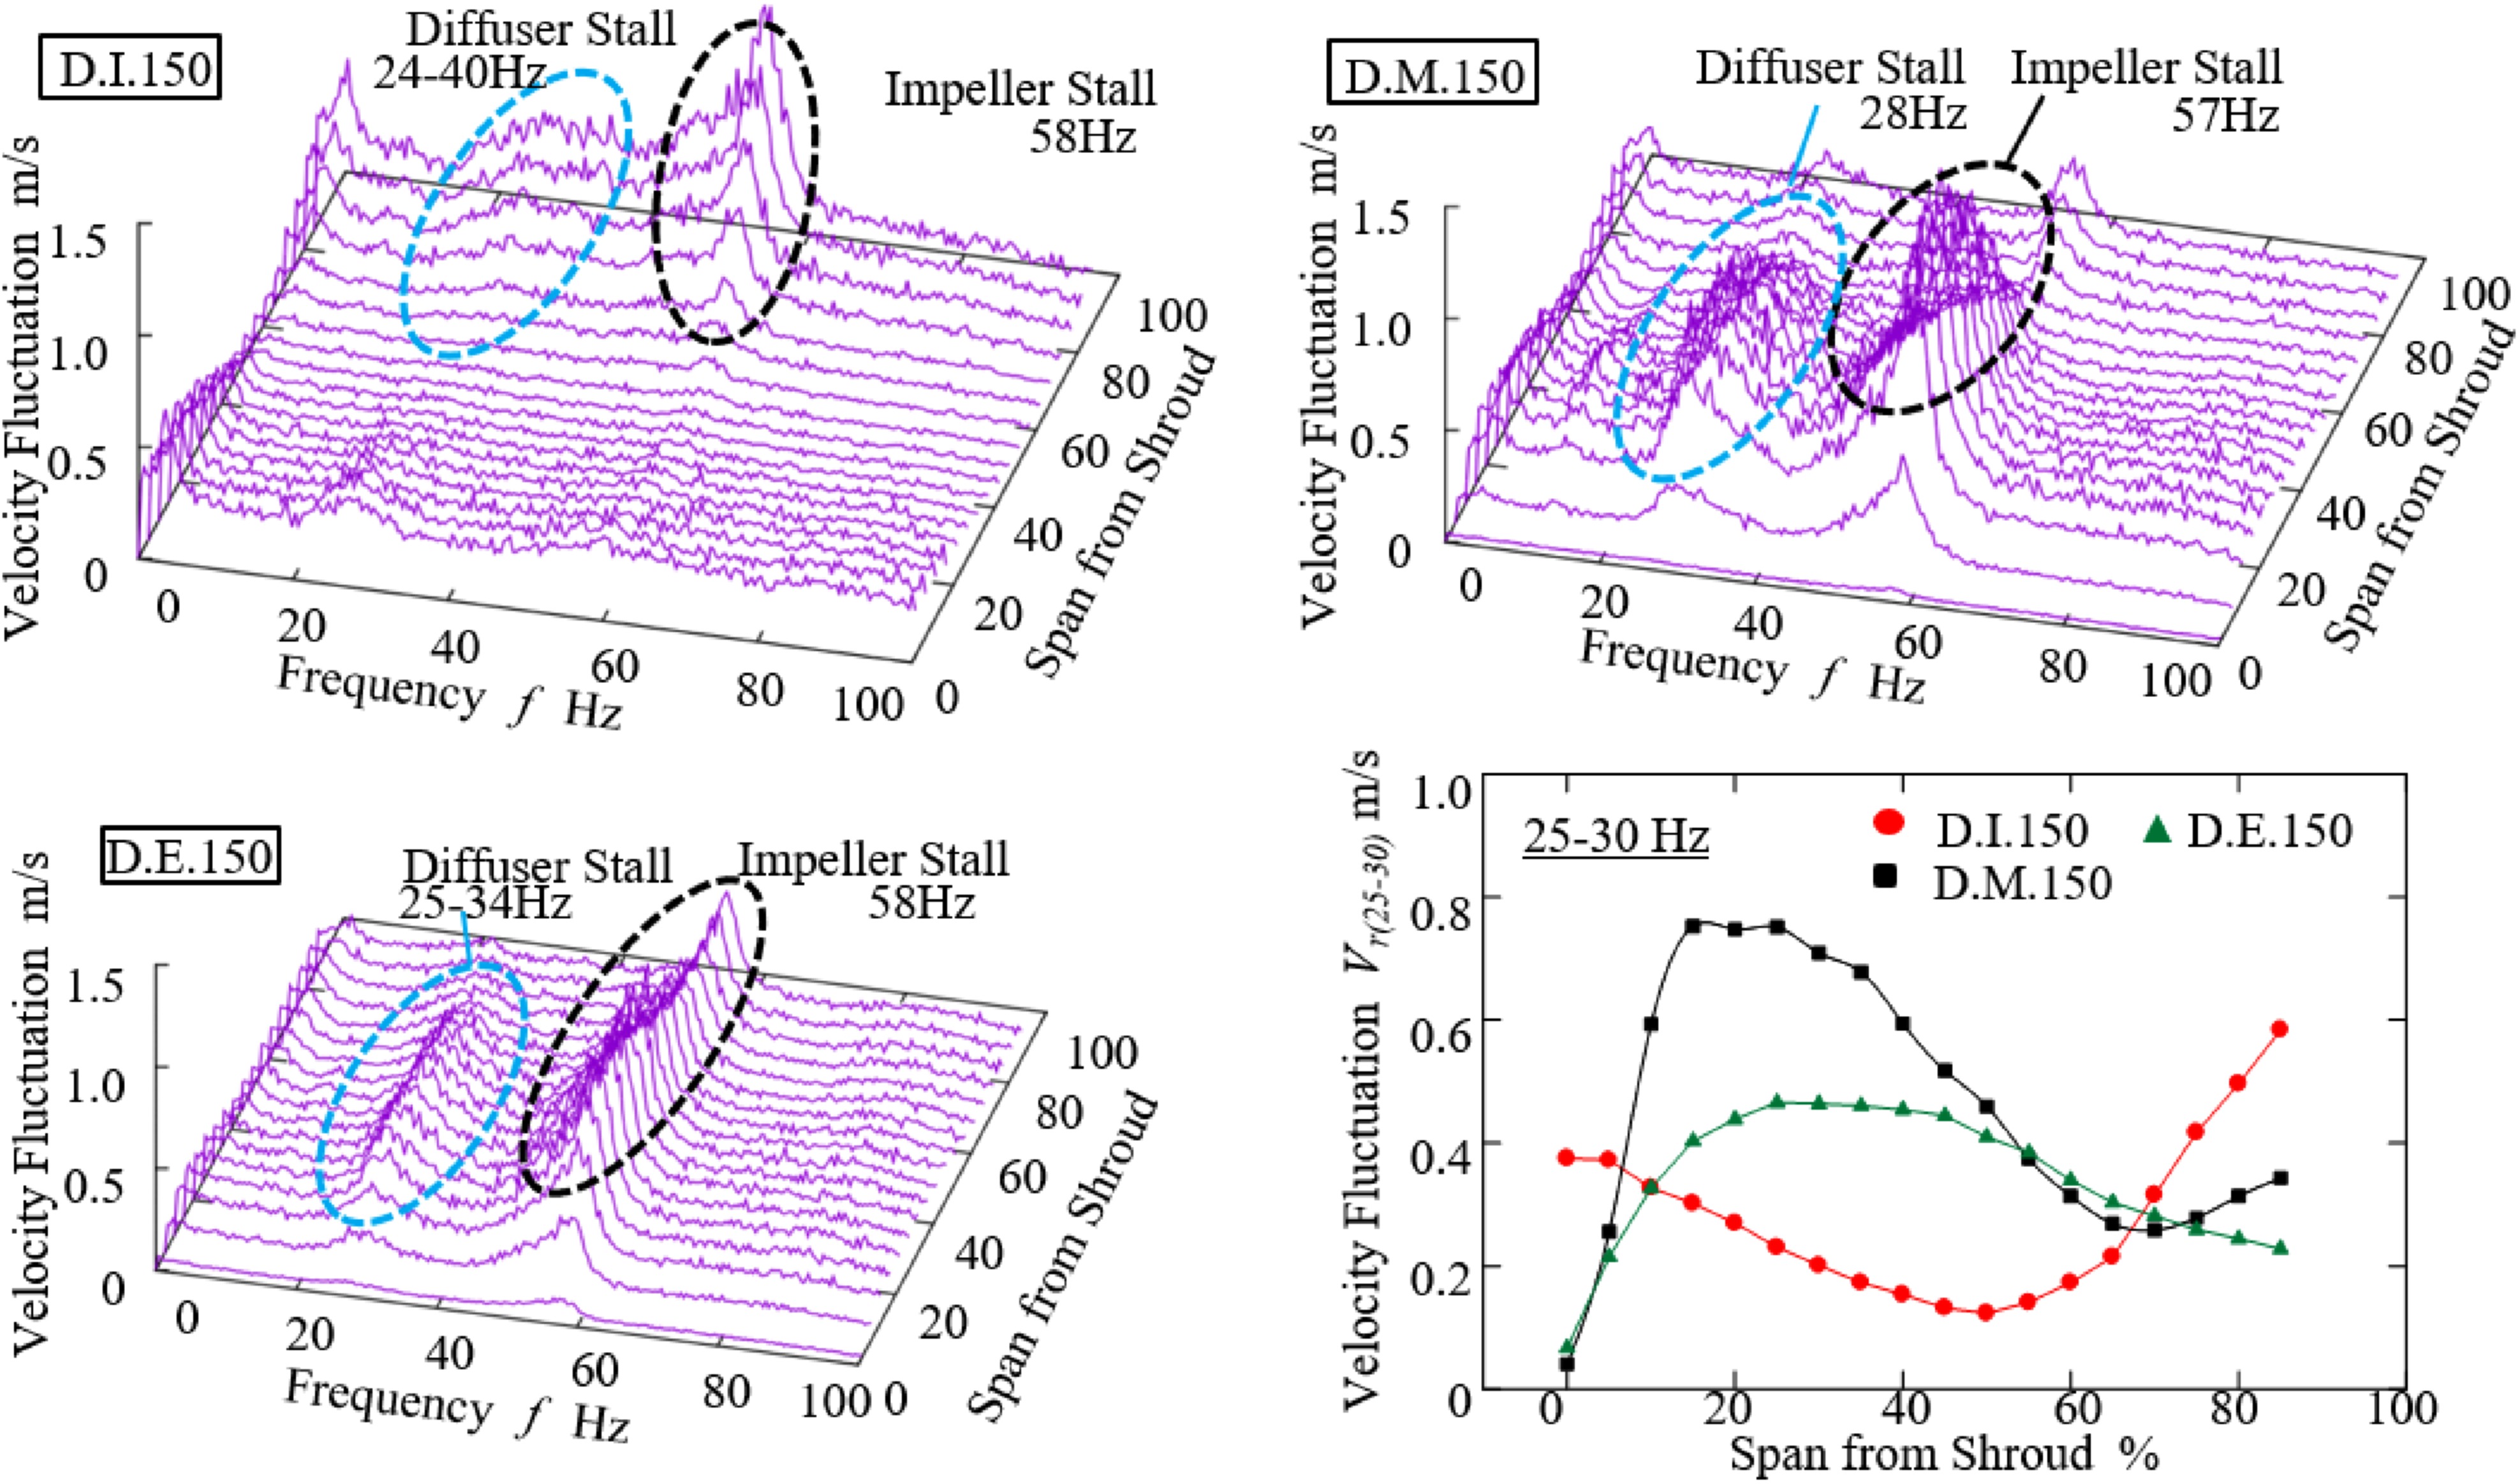
In order to validate the numerical results, the radial velocity fluctuation of impeller discharge flow was measured at the meridional direction (D.I.150, D.M.150 and D.E.150), as shown in Figure 14. The diffuser stall fluctuations were observed near hub side at D.I.150. On the other hand, the region with large magnitudes of the diffuser stall was shifted to the shroud side at D.M.150 and D.E.150. It is because the diffuser stall was consisted of the boundary layer separations occurring on the shroud and hub wall by turns. Therefore, the boundary layer separations occurring on the shroud and hub wall were considered as the key factors contributing to the diffuser stall generation by both experimental and CFD results. In our future work, the general generation mechanism of the boundary layer separations, which occurred at the hub and then the shroud end wall, will be revealed by several CFD investigations.
Conclusions
The generation mechanism of a diffuser rotating stall in a centrifugal compressor with a vaneless diffuser was investigated by experiments and CFD analysis. The results can be summarized as follows:
In the test compressor, fluctuations occurred at around 25–30 Hz, were caused by diffuser stall at off design point ϕ = 0.08. The fluctuation magnitude varied depending on circumferential position with the largest fluctuations observed near the cutoff.
The diffuser stall behavior varied depending on circumferential position. First, the boundary layer separations initiated on the hub wall at around 45° where a large circumferential adverse pressure gradient magnitude was observed. Next, the hub side separations induced the next shroud wall boundary layer separations. The shroud side boundary layer separations developed and induced a low velocity region located at the diffuser stall cell center.
The diffuser stall cell developed further as it approached the cutoff. The boundary layer separations developed on both shroud and hub walls by turns due to the impeller wake interaction that developed on the hub side. The boundary layer separations occurring on the shroud and hub wall were considered as the key factors contributing to the diffuser stall generation by both experimental and CFD results.
Nomenclature
B
diffuser passage height (m)
D
diameter (m)
G
mass flow rate (kg/s)
N
rotational speed (min−1)
Q
volume flow rate (m3/s)
Vr
radial velocity (m/s)
p
static pressure (Pa)
pt
total pressure (Pa)
t
time (s)
trev
one impeller revolution time (s)
t*
non-dimensional time (=t/trev)
Z
number of impeller blades
ρ
air density (kg/m3)
ϕ
flow coefficient
ψt
total pressure rise coefficient
1
impeller inlet
2
impeller outlet
3
diffuser inlet
4
diffuser outlet