
Introduction
Gas turbine is widely used in aviation, power generation, and maritime applications. With the pursuit of high-performance gas turbines, the combustor exit temperature has been continuously increased in recent years, vastly beyond the melt allowable temperature limit (Hada et al., 2012; Naik, 2017). Meanwhile, the regulations aimed at controlling NOx and other pollutant emission have become more and more stringent. More air is required for combustion to meet low-emissions regulations, and thus the air available for combustion tube cooling is decreasing (Lefebvre and Ballal, 2010). Furthermore, as the working temperature of the combustion chamber rises, so does the expected lifetime of the hot components. For these reasons, the demand on effective cooling structures has become critical.
Due to its superior performance, double-wall cooling is gaining popularity. The cooling process of the double wall cooling system is as follows: an array of cooling air jets first passes through the perforated baffle and impinge the cold side of the effusion plate; then, the coolant flow into the effusion hole to form forced convection heat transfer within the hole; and finally flows out and creates a uniform and protective film on the hot-side wall of the effusion plate. The following are some benefits of the double-wall cooling technique: (1) The average heat transfer coefficient on the cold side of the effusion plate is 6–10 times higher than the ones achieved with effusion cooling alone (Cho and Rhee, 2001), taking full advantage of the high heat transfer coefficient of impingement cooling to cool local hot regions. (2) The suction of the attached surface layer at the entrance of the evacuated hole enhances the heat transfer, increasing the target surface heat transfer coefficient by 45–55% in comparison to impingement cooling only (Cho and Goldstein, 1996).
Numerous investigations have been conducted on the double-wall cooling structure, including the effects of double-wall aerodynamic parameters, geometrical structural alterations, and so on. (Liu et al., 2018; Xie et al., 2019) investigated the analogy principle of overall cooling effectiveness for double-wall cooling structures using numerical and experimental methods. They found that matching the mainstream Reynold number, blowing ratio, and temperature ratio was effective for matching the overall cooling effectiveness. However, matching mainstream side Reynold number, Biot number, and momentum flux ratio provided acceptable matching performance in overall cooling effectiveness when temperature ratio was mismatched. Rogers et al. (2017) investigated the effect of blowing ratio on effusion/impingement cooling efficiency under cross-flow conditions and found that the cooling efficiency increased along the streamwise direction, and the disturbance increased due to the formation of a horseshoe vortex at the position leaving the film orifice, resulting in an increase in the heat transfer coefficient. Ligrani et al. (2018) found that when the effusion coolant was supplied by an array of impingement cooling jets, the cooling effectiveness was higher than with a cross-flow channel supply system. Huelsmann and Thole (2021) studied the influence of the position of the impingement hole relative to the effusion hole on the convective heat transfer performance within the effusion hole. The results showed a strong sensitivity to the circumferential and radial arrangement of the impingement jet. The degree of heat transfer enhancement caused by different positions ranges from 10 to 30%. In contrast, the jet-to-effusion distance had little effect. Bai et al. (2023) experimentally investigated the effects of gap distance, impingement hole diameter, and effusion hole arrangement on cooling efficiency. They found that the increase in gap distance weakened the strength of the impingement jet and thus reduced the overall cooling performance. The smaller the impingement hole diameter, the weaker the cooling film was, resulting in a lower overall cooling performance at the same blowing ratio. Murray et al. (2017, 2018) evaluated the aerothermal and thermomechanical performance of double wall cooling geometries using both numerical and experimental methods. The findings revealed that reducing the pedestal diameter and increasing their edge-to-edge spacing improved cooling performance while mechanical performance got worse. Moreover, increasing impingement/film hole diameter and passage height were beneficial to reduce the thermal gradients across the two walls, however, assuming constant pressure drop conditions, required more coolant volume which in itself could be a possible detriment to efficiency.
Most previous experimental studies were conducted in the non-reactive state, and the majority of them were consistent with the actual combustion chamber operating conditions by controlling the similarity parameters (Reynolds number, Temperature ratio, Blowing ratio, Biot number, etc.); the main flow was rectified to obtain a uniform incoming temperature; and the boundary conditions of the experiments were more precise. Because the mainstream air temperature of such trials was lower, and the influence of radiation at lower temperatures was not apparent, more desired cooling results are frequently obtained (Behrendt and Hassa, 2008). In the operational environment of a real combustion engine, however, the temperature and flow fields in the combustion chamber fluctuated with the flame morphology, affecting the temperature distribution on the wall (Ji et al., 2018; Ahmed et al., 2022). Furthermore, because the incoming flow temperature was higher in the reactive state than that in non-reactive state, the effect of radiation was enhanced. Thus, an experimental investigation of the characteristics of double-wall cooling in the reactive state is required.
The influence of the blowing ratio and coolant temperature on double wall cooling in the reaction state is investigated in this work, and the temperature distribution on the hot side of the wall is recorded using an infrared camera and thermocouples, with its cooling efficiency and temperature uniformity trends evaluated.
Methodology
Experimental configurations
The schematic of the experimental system is shown in Figure 1. Experiment system is mainly composed of a 24-nozzles array combustor, fuel supply system, air supply system, double-wall experimental section, and temperature measurement system. Methane was used in the experiment, which was supplied from a high-pressure cylinder and controlled by a mass flow meter. The air was divided into the main flow and the coolant. The primary flow air was mixed with methane in the combustor, as depicted in the study by Liu et al. (2022). The coolant flowed into the test region, which was composed of three same double wall cooling plates and an infrared window. The temperature of cooling air was measured by a thermal resistance mounted at the inlet of the air plenum (Figure 2a). Details of the test plate were introduced in Table 1. Multiple thermocouples were laid on the film plate to measure the wall temperature (Figure 2b). A S-type thermocouple was installed at the leading edge of the test section to measure the gas temperature.
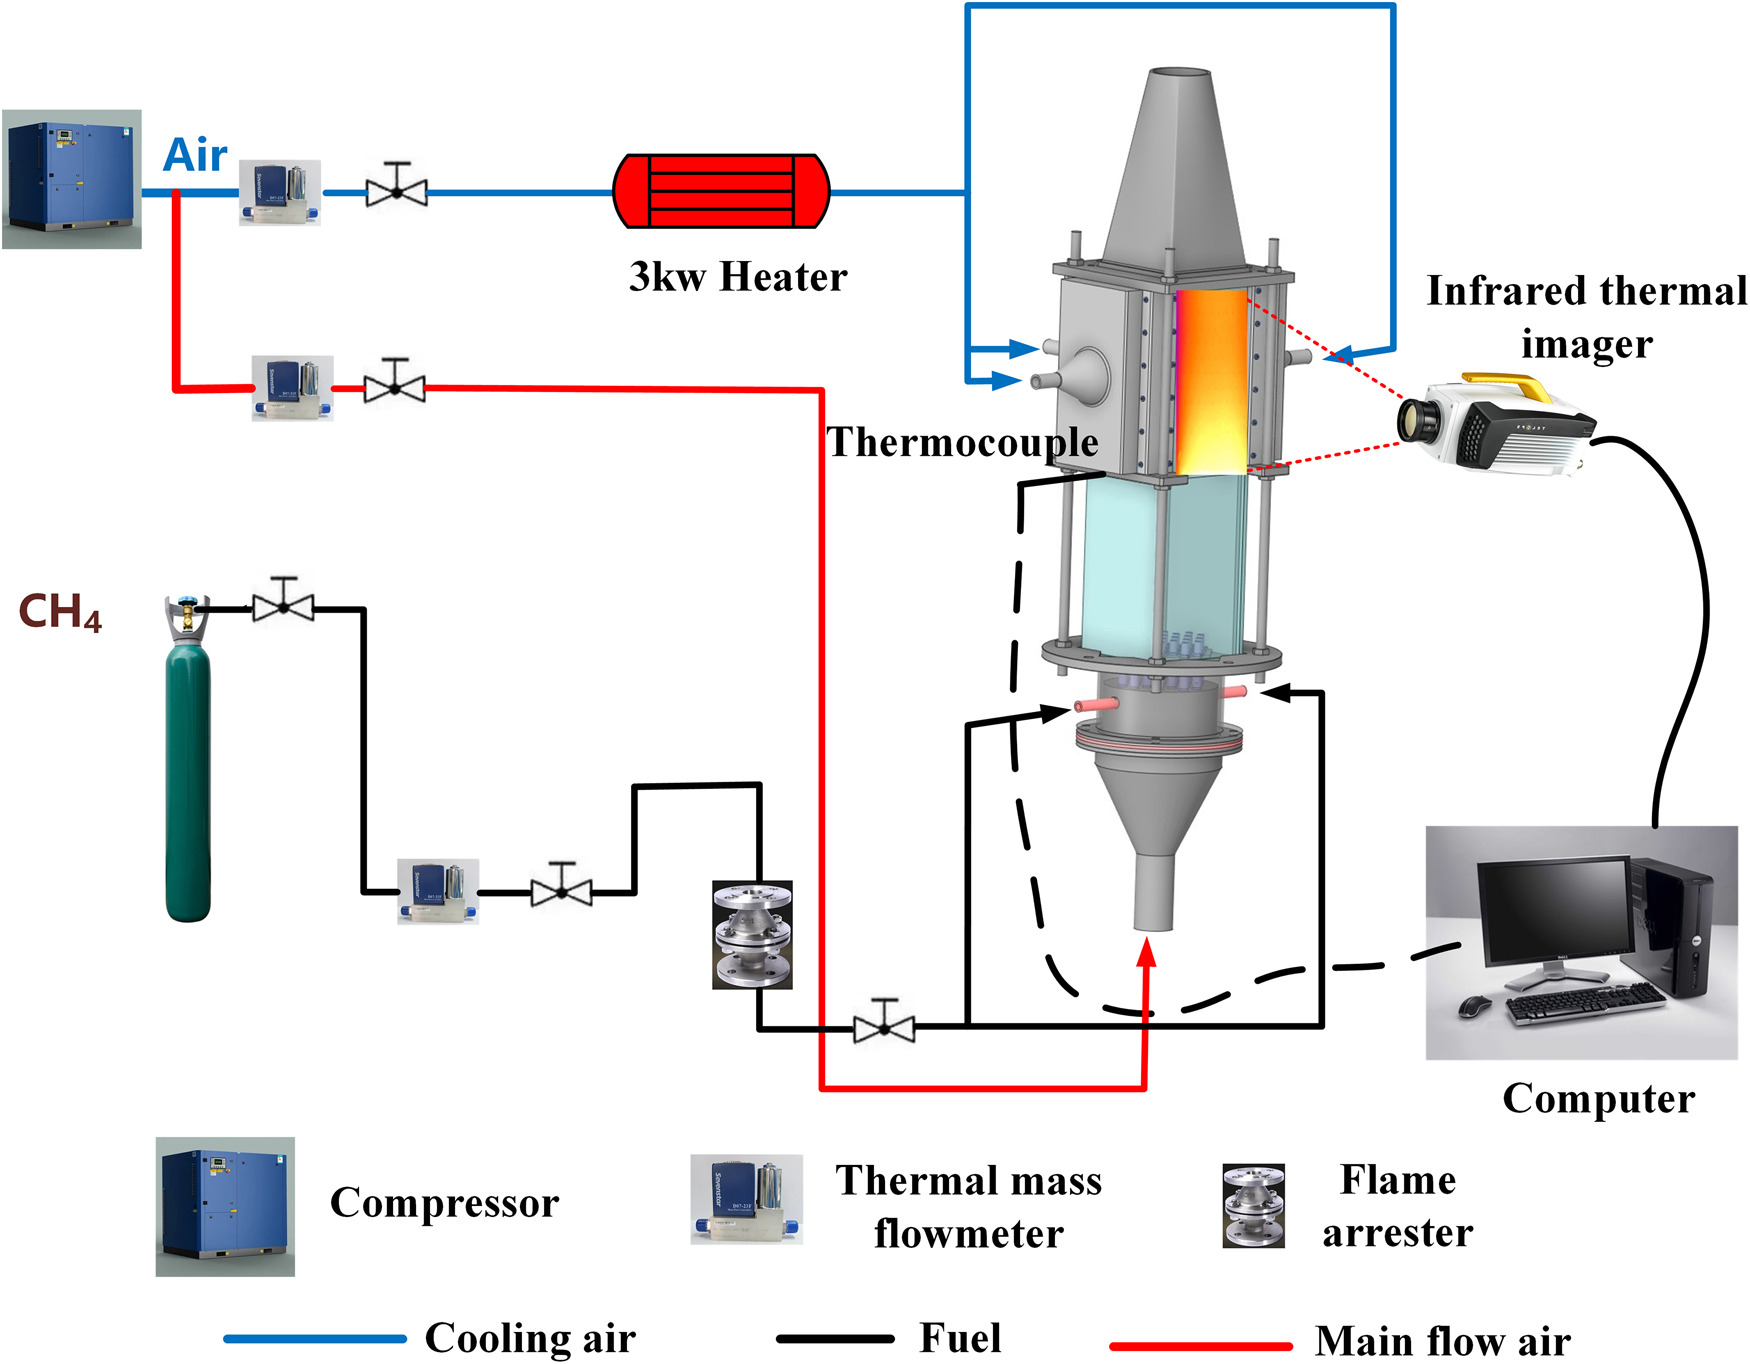

Table 1.
Details of the double-wall structure.
IR measurement and calibration
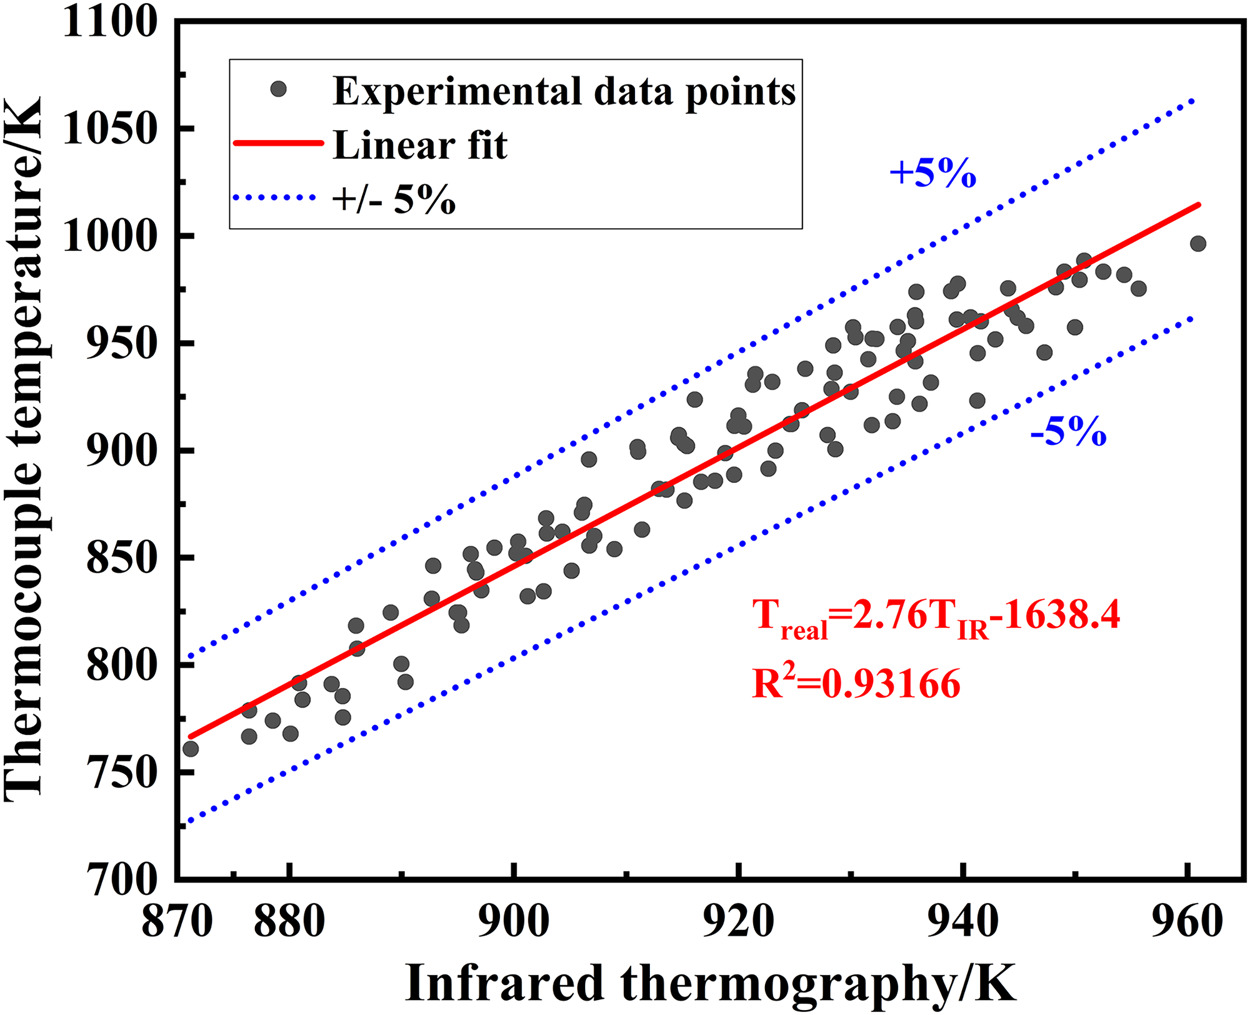
Infrared thermography was adopted to conduct surface temperature steady-state measurements on the hot side of test plates by the Telops FAST M200 infrared camera equipped with a pre-calibrated filter. The temperature measurement range was 206–1,708°C, and the accuracy was 1%. The spatial resolutions were 640*512. A critical step that must be taken seriously is calibration, which determines the credibility of the temperature data. In this experiment, IR camera and calibration thermocouples at specifically selected locations recorded the temperature simultaneously once a steady state was reached. By comparing the temperature measured by IR camera and thermocouples, a calibration curve was fitted for the entire estimated temperature range. Figure 3 shows the calibration curve for IR measurements, and it can be found that the curve fitting is linear and has a relative error not exceeding ±5%. A thin layer of high emissivity black paint was applied to the test plate to make it diffusely reflected, so it could be regarded as a gray body to handle the emissivity.
Surface temperature on the hot side is used to estimate the cooling effectiveness, which characterizes the synthetic cooling ability of the Impingement/effusion cooling. The cooling effectiveness is defined as:
Tw is the test plate wall temperature after correction, and Tc is the cooling air temperature before entering plenums. Tg is the flue gas temperature measured by type S thermocouple. The flue gas temperature measured by the thermocouple is corrected using the Kaskan method (1957). The corrected flue gas temperature is defined as Equation 2.
where Tg and Tb are corrected flue gas temperature and measured temperature, respectively.
Operation conditions
Pure methane was used in the experiment. The primary airflow and the coolant were supplied at atmospheric pressure. The flame temperature, Tf, was the calculated equilibrium temperature by Chemkin software based on air temperature and equivalence ratio, Φ. In this experiment, the flame temperature was set at 1,800 and 1,900 K respectively. The bulk velocity, u, was calculated from the combustor mass flow rate, flame temperature, flue gas density and cross-sectional area. The bulk speed of the hot gas flow was set to about 8 m/s. Blowing ratio is an important parameter for Impingement/effusion cooling systems defined by:
where
Results and discussion
Wall temperature distribution
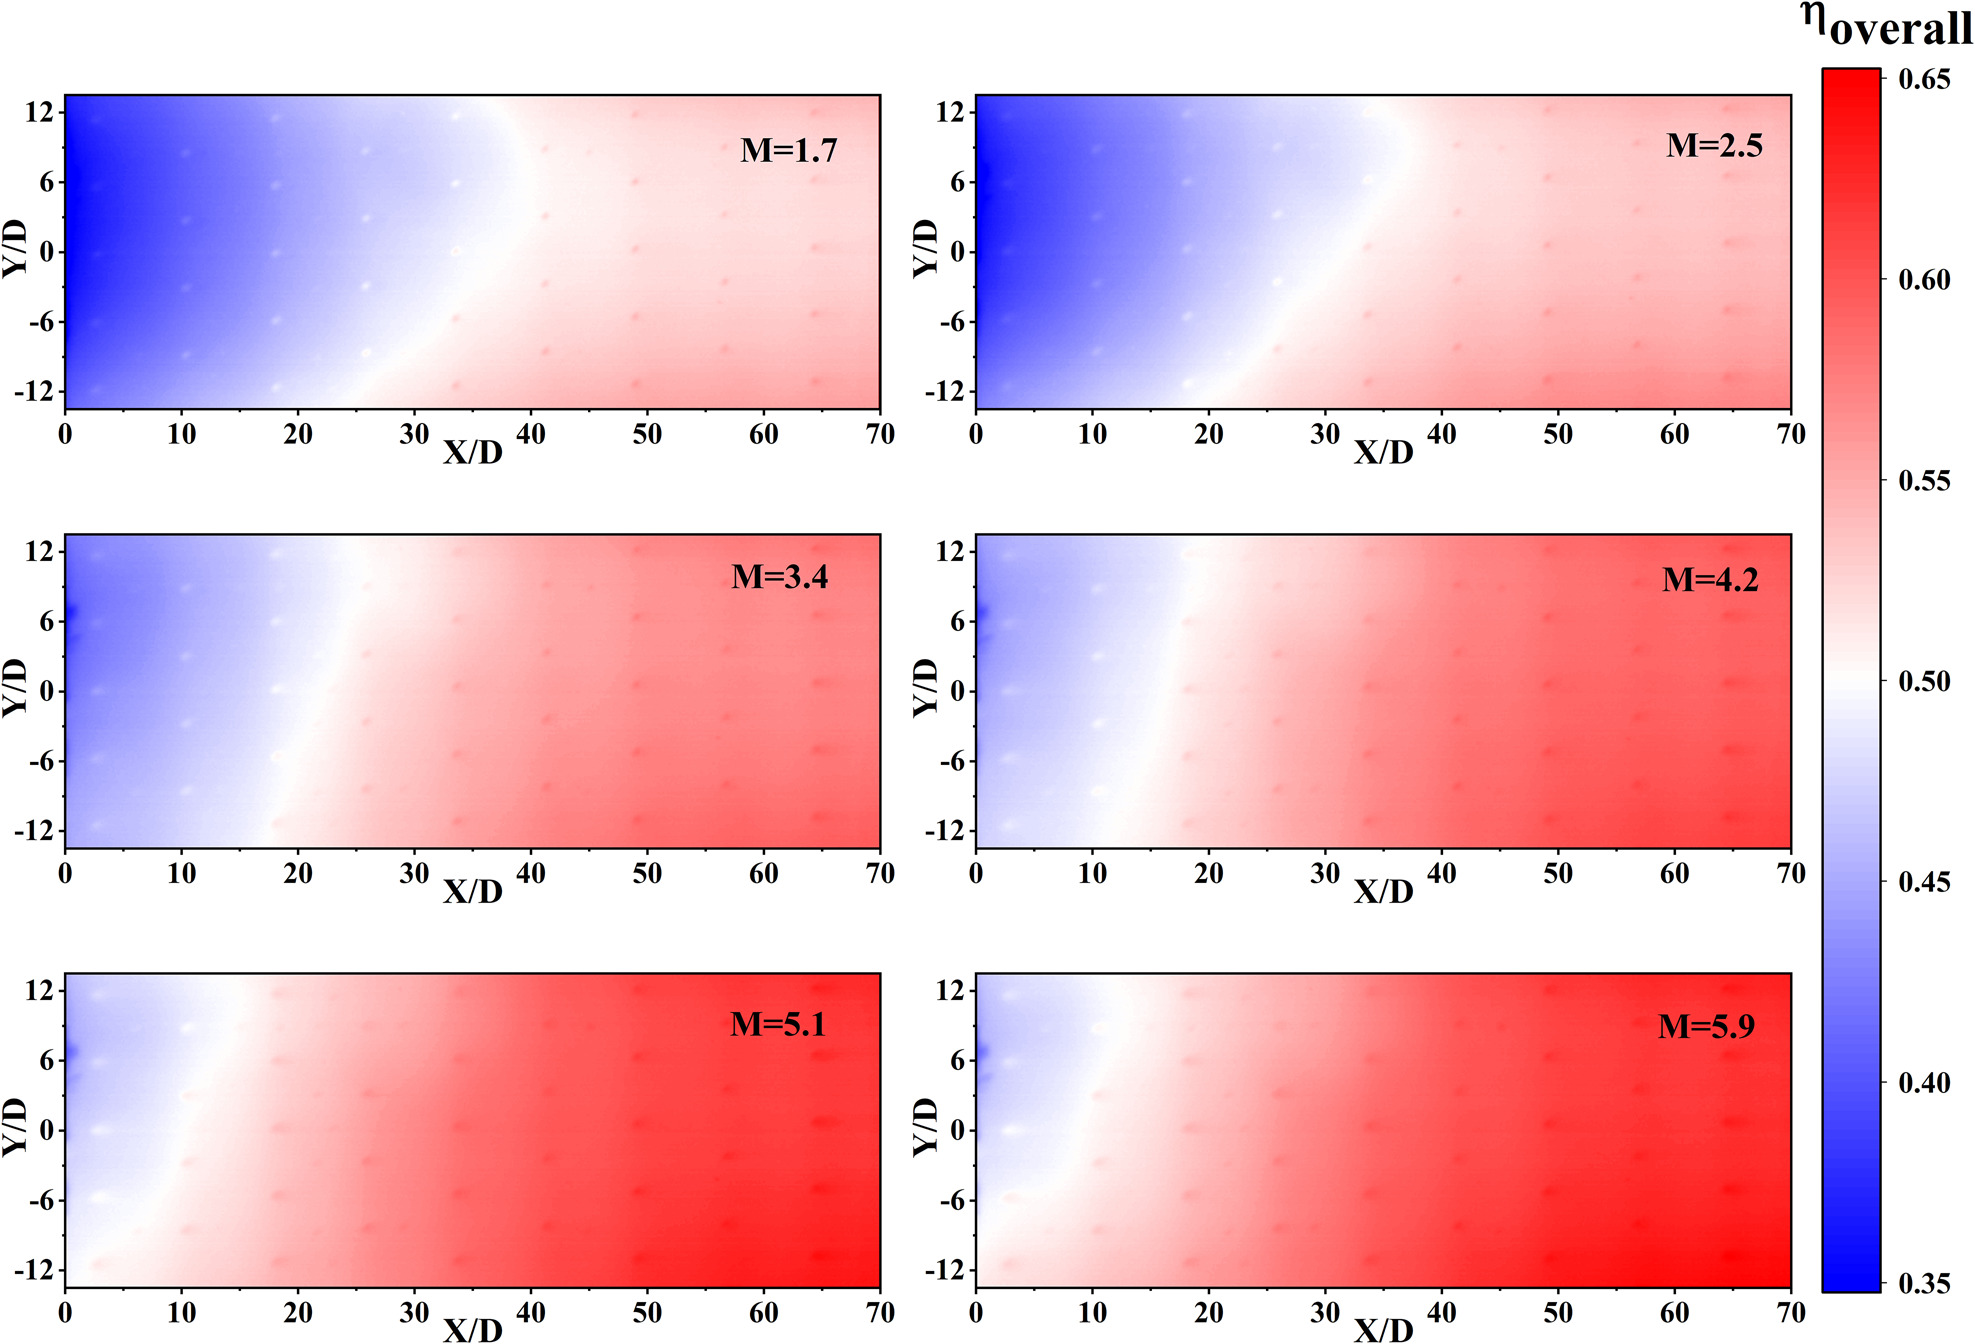
Figure 4 depicts the distribution of wall temperature at various blowing ratios. The picture demonstrates that for blowing ratios ranging from 1.7 to 5.9, the wall temperature does not exceed 1,150 K. The highest temperatures are concentrated in the X/D < 1.5 region, where there is no cooling air covering. The temperature on the Y > 0 side is higher than that on the Y < 0 side, which is caused by the asymmetrical temperature distribution of the Upstream flue gas in the reaction state. Figure 5 shows the distribution of cooling efficiency on the test plate corresponding to Figure 4. As shown in the picture, the cooling efficiency increases gradually along the flow direction. The region of low cooling efficiency is concentrated upstream of the test plate; when the blowing ratio increases, the area of this region shrinks significantly.

The standard deviation of temperature at measuring sites in the cooling unit was computed by Equation 4 to evaluate the homogeneity of temperature dispersion on the wall surface of the effusion plate.
where i is the flow direction pixel point, j is the lateral direction pixel point, and
Figure 6 shows the variation of temperature inhomogeneity along the flow direction for various blowing ratios, together with the placements of the effusion holes. Temperature inhomogeneity decreases along the streamwise direction in general. The inhomogeneity increases slightly between the third and fifth rows of effusion holes, most likely due to the effect of the thermocouples inserted in this location on the flow field. Meanwhile, the inhomogeneity of the wall temperature increases near the effusion holes. At the leading edge of the plate (X/D = 0), the higher the blowing ratio, the larger the inhomogeneity of the wall temperature. The inhomogeneity of wall temperature reduces rapidly along the airflow direction before the first row of holes and then slows down afterward. The inhomogeneity decreases faster as the blowing ratio increases.

Laterally averaged cooling effectiveness
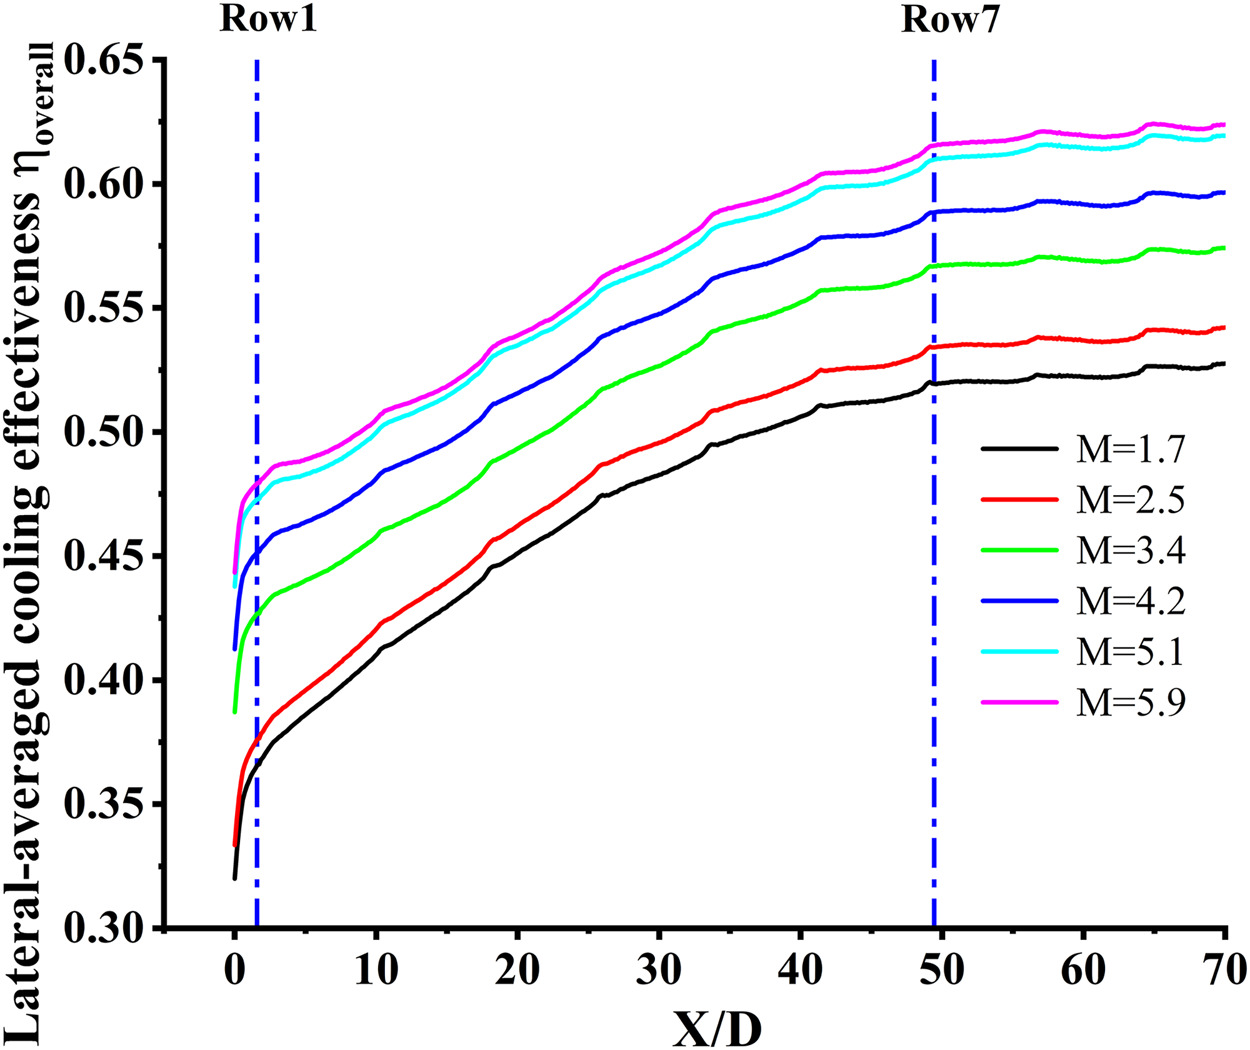
Figure 7 illustrates lateral-averaged cooling effectiveness varies along the flow direction for varied blowing ratios. It is evident that laterally averaged cooling efficiency sharply increases along the direction of flow in the region before the first rows (0 < X/D < 1.5), and that this rise is correlated with an increase in the blowing ratio. This is because increasing the blowing ratio improves convective heat transfer inside the hole and on the cold side wall of the film plate. The lateral average cooling efficiency grows apparently along the flow direction in the 1.5 < X/D < 50, while the trend of improvement gradually slows down. After X/D > 50, no significant changes in cooling effectiveness. The cooling efficiency is approaching a steady state, and a fully developed stable film exists.
Area-averaged overall cooling effectiveness
Figure 8 depicts the area-average cooling efficiency at various blowing ratios, with the area-average cooling efficiency increasing most when the blowing ratio is increased from 2.5 to 3.4. After M > 3.4, when the blowing ratio grows, the area averaged cooling efficiency increases, the growth rate slows down. The average cooling efficiency of the surface rose by 0.92% when the blowing ratio was increased from 5.1 to 5.9, at this time, increasing the blowing ratio for the double-wall cooling efficiency is essentially no aid, but increased the consumption of cold air.

Effect of temperature ratio
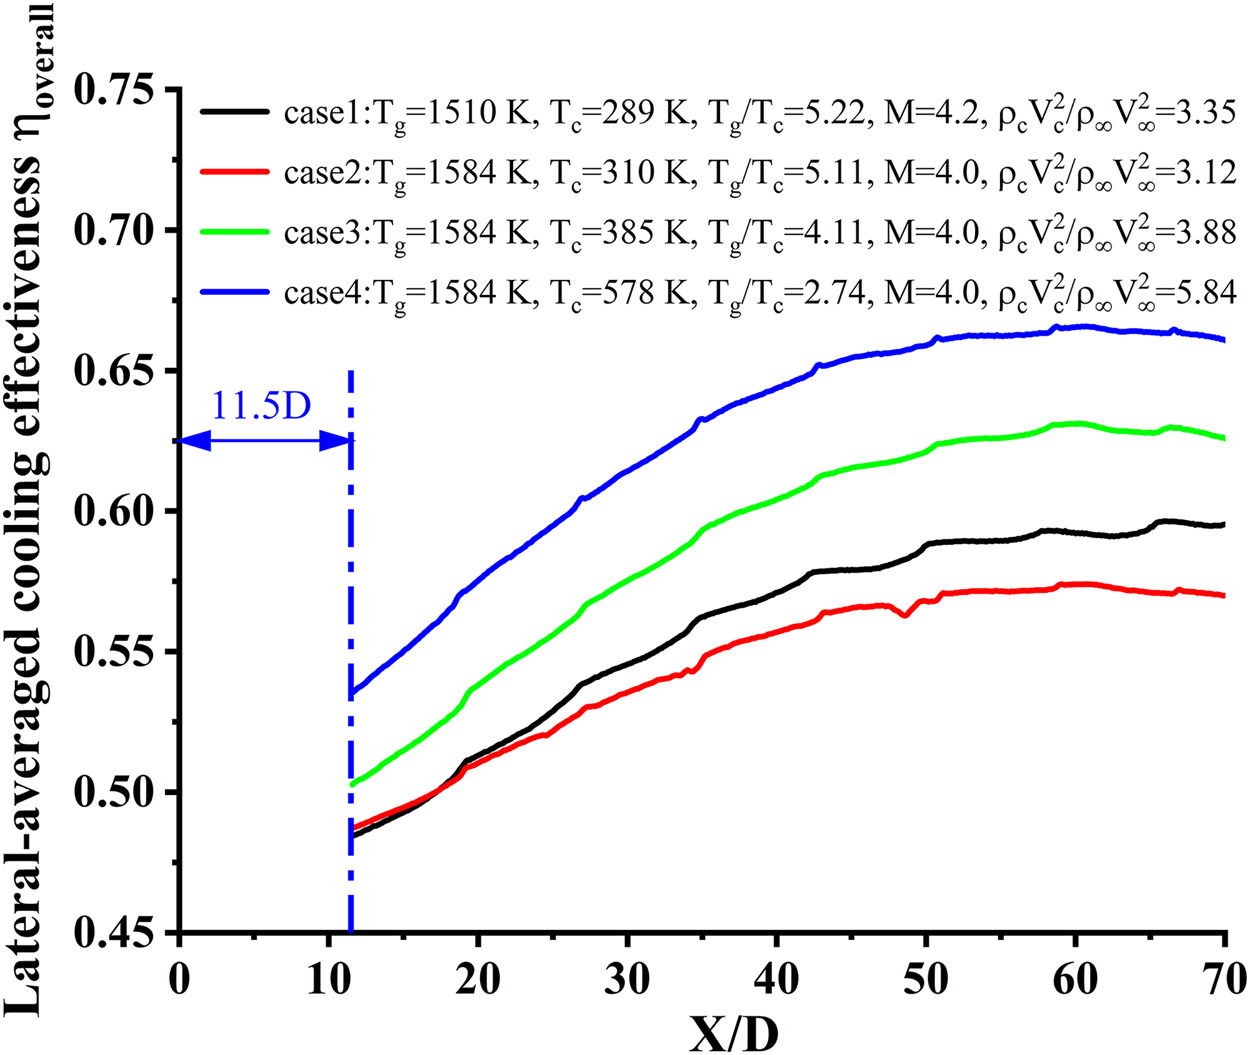
By varying the coolant temperature, the effect of temperature ratio on cooling effectiveness is investigated, as depicted in Figure 9. In our experimental setup, the adiabatic flame temperature is set to 1,900 K, and the measured flue gas temperature Tg is 1,584 K. The coolant temperatures are varied as follows: 310, 385, and 578 K. Meanwhile, a blowing ratio of 4 is maintained throughout these experiments to ensure that the temperature at the leading edge of the test plate (X/D = 0) remains within its material tolerance limit, and the results are compared to those obtained from an experiment conducted with a blowing ratio of 4.2. Since the temperature distribution at the leading edge of the test plate may be affected by the flame morphology, our comparison focuses on a region ranging from 11.5 to 70 D. Cases 1 and 2 exhibit similar temperature ratios and blowing ratios according to Figure 9, and case 2 has a higher cooling effectiveness than case 1. The main contributing factor could be that when the mainflow flue gas temperature Tg rises, so does the temperature difference between the mainflow and the wall, leading in radiant heat flux between the main flow and the tesplate enhancement and subsequently decreasing cooling efficiency. Cases 2, 3, and 4 maintain the main flow temperature constant while increasing the cooling air temperature and decreasing the corresponding temperature ratio. It can be observed that the double wall cooling effectiveness rises as the temperature ratio falls. The studies of Post and Acharya (2010) provide some insights for this phenomena. They examined the effect of density ratio and blowing ratio on film cooling efficiency, where the density ratio was changed via alteration of the temperature ratio. Their findings indicate that at a blowing ratio of one, density ratio rises while cooling effectiveness declines due to decreased velocity and momentum ratios. When the momentum ratios are sufficiently low, the coolant that flows out of the hole may be dispersed by strong freestream turbulence, leading to reduced film coverage and subsequently diminished cooling efficiency. In our experiment, decreasing temperature ratios under constant blowing ratios result in increased velocity and momentum ratios that facilitate more effective film formation for wall protection and enhance cooling effectiveness.
Conclusions
In order to provide data support for the subsequent double-wall cooling structure design, the experimental study of the double-wall cooling characteristics at reactive conditions is presented in this work. The following findings were obtained by examining the effects of blowing ratio and temperature ratio on double wall cooling characteristics.
With increasing blowing ratio, temperature inequality in the region prior to the first row of holes becomes more pronounced. However, After passing through the first rows of effusion holes, wall temperature gradually becomes uniform along the flow direction. Moreover, as blowing ratio rises, non-uniformity in wall temperature decreases at a faster rate.
The cooling efficiency increases along the airflow direction, while the growth rate decreases. After X/D > 50, cooling efficiency essentially remains unchanged.
Double wall cooling effectiveness improves with inreasing blowing ratio; however, this effect becomes less significant in blowing ratios higher than 5.1.
Cooling effectiveness of the double wall increases as temperature ratio decreases. In this experiment, while keeping the blowing ratio constant, decreasing temperature ratio leads to increased velocity ratio and momentum ratio, which facilitate effective film formation for enhanced wall protection and subsequently improve cooling effectiveness.
Nomenclature
cooling effectiveness
area-averaged overall cooling effectiveness
streamwise position
temperature inhomogeneity
streamwise pixel point
lateral pixel point
cooling air temperature (K)
wall temperature (K)
measured gas flue temperature (K)
corrected gas flue temperature (K)
blowing ratio
mass flow rate of gas (kg/s)
mass flow rate of coolant (kg/s)
density (kg/m3)
density of flue gas (kg/m3)
density of coolant (kg/m3)
area of the cross-sectional (m2)
area of effusion holes (m2)
jet velocity (m/s)
flue gas velocity (m/s)
characteristic length of the thermocouple (m)
thermal conductivity (W/(m·K))
global equivalence ratio (−)
dynamic viscosity of flue gas (Pa·s)
emissivity of thermocouple (−)
radiation constant of black body (W/(m2·K4))