
Introduction
Reductions in civil aircraft fan pressure ratios increase propulsive efficiency, but place low flight-speed fan operating points at lower flow coefficients relative to the cruise or top-of-climb conditions. This reduces the stability margin at take-off and climb, leading to a greater demand for accuracy of fan stability predictions during fan design. Full-annulus Unsteady Reynolds-averaged Navier Stokes (URANS) calculations by Kim et al. (2019) accurately predicted the operating point, inception mechanism, and developed stall cell characteristics for two low pressure ratio, transonic fans. The work also resolved the contrasting flow physics and their link to the fans’ designs. The method's accuracy, however, is yet to be assessed under distorted inflow, which is most severe at low flight-speed conditions. The severity of distortion experienced will grow at angle-of-attack as engine intakes become shorter to reduce weight and drag.
To improve understanding of fan stall in distorted flow, the work presented calculates the behaviour of a low pressure ratio fan, named Fan A, with a well-defined, rig distortion profile. The distortion is a time-averaged axisymmetric total pressure deficit at the casing, and employed to provide a significant and well-defined radial variation, rather than to recreate a flight condition. The numerical method is assessed, and the calculated flow field near and during stall is used to study the effect of tip-flow distortion on the fan's behaviour, and the rotor unsteady flow field during stall cell development.
The findings presented can be summarised as follows:
The model with distortion closely reproduces the inlet total pressure profile and time-averaged fan stage performance across the 100% rotor speed characteristic.
Stall calculations predict a drop in stall margin of 67% of that observed rig operation. Predicted stall cell speed drops from 87% to 67% of shaft speed with distortion, compared to 82% to 58% in the experiment.
For clean and distorted inflow, the stall inception mechanism is a growth in the separation behind the passage shock. With distortion, a lower stalling flow coefficient at the tip results in blockage further upstream in the passage. This extends the stall cell to cover around 80% more of the annulus.
The rotating upstream pressure field of the stall cell introduces an unsteady variation in total pressure drop across the distortion plate, which would not be captured by substituting the plate with an equivalent prescribed radial inlet profile.
Fan and compressor stall with distorted inflow
Fans in civil aircraft engines are low hub-to-tip ratio axial compressors, which operate as a single stage of rotor and one or two down-stream stators. As well as a lower total pressure ratio, low pressure ratio fans are distinguished by reduced rotor inlet relative Mach numbers, typically below 1.4 at the tip and with subsonic relative inflow towards the hub. Analysis of single-stage, low hub-to-tip ratio subsonic compressors (Pullan et al., 2015; Hewkin-Smith et al., 2019) and transonic compressors (Hah et al., 2006; Kim et al., 2019) observe spike-type stall inception, or the absence of significant low-frequency disturbance preceding stall. Hewkin-Smith et al. (2019) attributed the sudden drop in pressure rise from local sectors of the rotor row to either spillage of tip leakage flow ahead of the leading edge, or separation from the suction surface within the rotor passage. Both mechanisms allow sharp increases in flow blockage in blade passages, and initiate stall cells at the rotor tip, which move between passages against the direction of rotor rotation. Decreasing the negative axial momentum flux in the leakage flow increased stable operating range until stall initiated through the passage separation mechanism.
Kim et al. (2019) observed a similar distinction in inception mechanism for two low speed fan designs. Supersonic flow at the tip produced suction surface boundary layer separation downstream of the shock, contrasting the corner separation in the subsonic cases.
Stall in transonic fans subjected to inlet flow distortion was studied by Sandercock and Sanger (1974) applying three different radial inlet profiles upstream of a single rotating blade row. They found the largest fall in stall margin for the most severe tip-low distortion. Limiting blade loading near the tip, measured by Lieblein's diffusion factor, was noted to predict the stall point, but with significant scatter across distortion patterns. Scarce subsequent data has been produced to compare stall for transonic fans under different radial distortion patterns.
Test case and measurements
Fan A is a scale fan stage fitted with downstream bypass and core stators. Relevant design point parameters for the stage are given in Table 1. Aerodynamic measurements referenced in this work were taken at AneCom AeroTest, Germany.
Table 1.
Fan A rig design point parameters.
| Rotor total pressure ratio | 1.46 |
| Rotor inlet tip relative Mach number | 1.15 |
| Rotor tip Reynolds number | 3.3 × 10⁶ |
| Rotor hub-to-tip ratio | 0.32 |
Mass flow rate measurements for the studied configurations with clean and distorted inflow were made by calibration of intake casing static pressure readings to measured mass flow rates with fan-face instrumentation. Fan-face rakes were removed before data acquisition. Core mass flow rates were measured with a Venturi flowmeter in the core duct downstream.
Rotor outlet total pressure and temperature measurements were taken with Kiel probes at 8 circumferential and 13 radial positions on bypass stator leading edges, and 7 circumferential and 7 radial positions of the core stator leading edges (labelled plane 3 in Figure 1). Total pressure rakes with 11 radial positions, clustered at the casing, measured the inlet distortion at Figure 1's plane in.

6 Kulite probes separated circumferentially by 60°, and placed 7.8% rotor tip radius upstream of the rotor tip leading edge measured the unsteady casing static pressure, which was sampled at 48 kHz, or around 22 samples per blade passing.
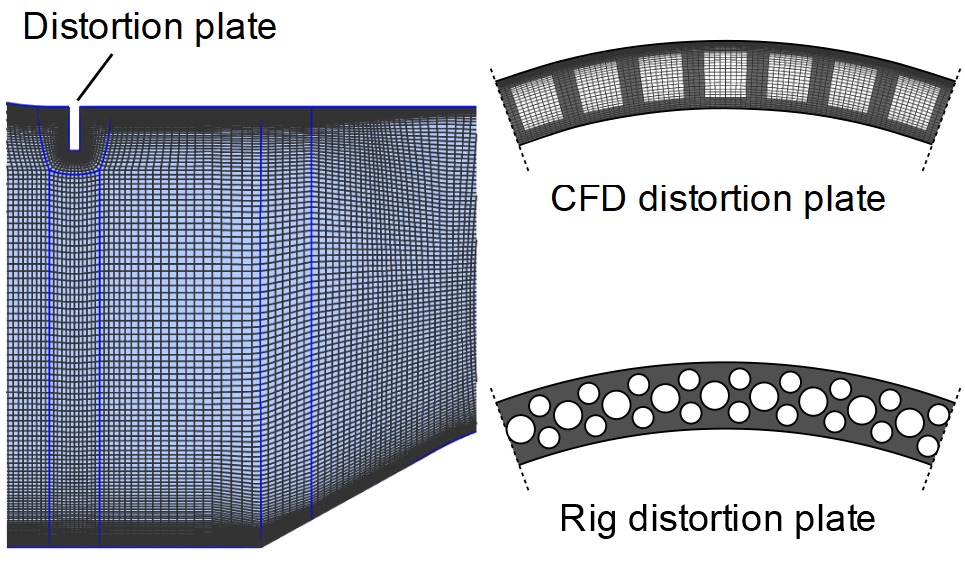
The radial inlet distortion pattern was generated by a perforated plate positioned 1 rotor tip radius upstream of the rotor leading edge. Its radial extent from the casing was 10% tip radius. Circular holes in a repeating circumferential pattern of 2 small-1 large (see Figure 2) produced an open area of 46% of total plate frontal area.
Computational method
Computations were performed in Turbostream (Brandvik and Pullan, 2011), which is a RANS solver using the finite volume method on structured, multi-block grids. Turbulence was modelled by a Spalart-Allmaras model (Allmaras et al., 2012) with a helicity correction (Lee et al., 2018). Boundary layers were treated as turbulent universally, and laminar sublayer wall functions used to calculate surface shear.
Figure 1 shows the meridional view of the domain for calculations which included inlet distortion. The inlet boundary condition, at the plane labelled ref, admitted axial flow with uniform total temperature and total pressure. Dashed lines mark the mixing or sliding interfaces for steady and unsteady calculations, respectively. Choked, uniform static pressure outlet boundary conditions in the core and bypass duct set the total mass flow rate and bypass ratio of the fan stage. The constant speed characteristic was generated by closing the bypass nozzle from the fan-stage choking mass flow rate, while keeping the core nozzle area constant. Rotor tip clearance was uniform and set to the average value observed at the studied rotational speed for the rig operating without the distortion plate.
Meshes were produced in Numeca Autogrid5™ (NUMECA International, 2019). A single rotor passage contained 3.2 million grid nodes, and the full annulus grid had 150 million nodes. This represents a mesh density around 1.2 times higher than that used by Kim et al. (2019), due to 50% more nodes radially across the tip gap, and around 30% more nodes normal to the blade surface in the rotor o-mesh.
Stall conditions were initiated from a bypass nozzle area 1% of the pre-converging bypass duct area,
Distortion plate
To represent the inlet distortion produced by the rig's perforated plate, and ensuring that the total pressure drop scaled accurately with operating point mass flow rate, the plate was modelled approximately in the computational domain. The circumferential pattern of two sizes of circular holes in the plate was simplified to form approximately rectangular, repeating grid-aligned connected patches of equivalent open frontal area. Rig and CFD distortion plate patterns are compared in Figure 2.
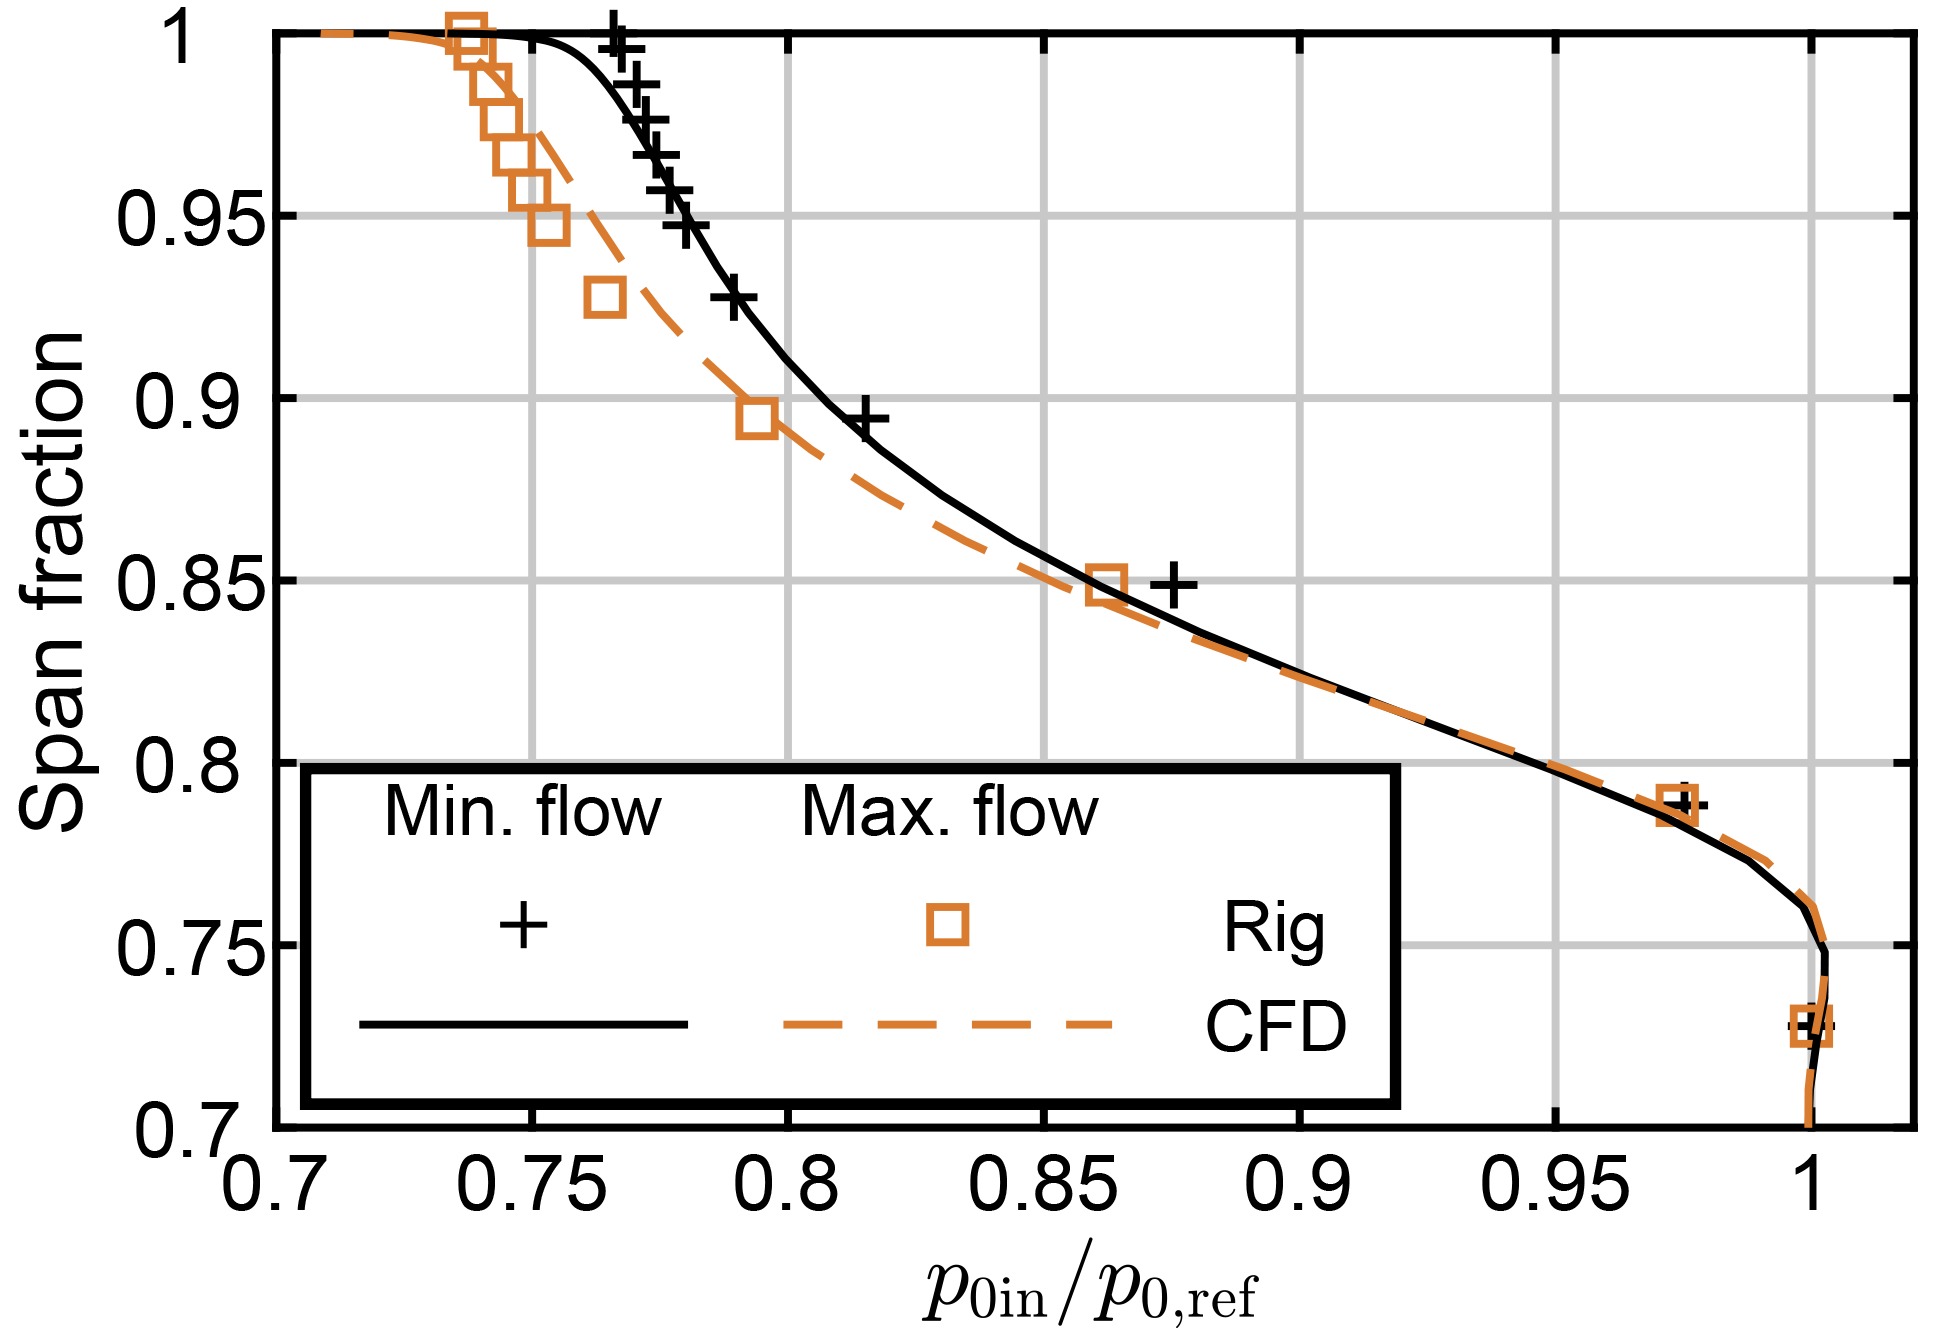
The resulting inlet total pressure profiles are presented for steady calculations against rig measurements at equal inlet Mach numbers in Figure 3. A close match was achieved from maximum to minimum mass flow rate, without adjusting the inlet boundary condition. The maximum fractional total pressure drop produced of around 0.23 is similar to that of the most severe tip radial distortion measured by Sandercock and Sanger (1974). There was no measure of tip inlet turbulence available from rig tests, but the computational plate estimated the extra mixing in the tip flow.
Single-passage calculation validation
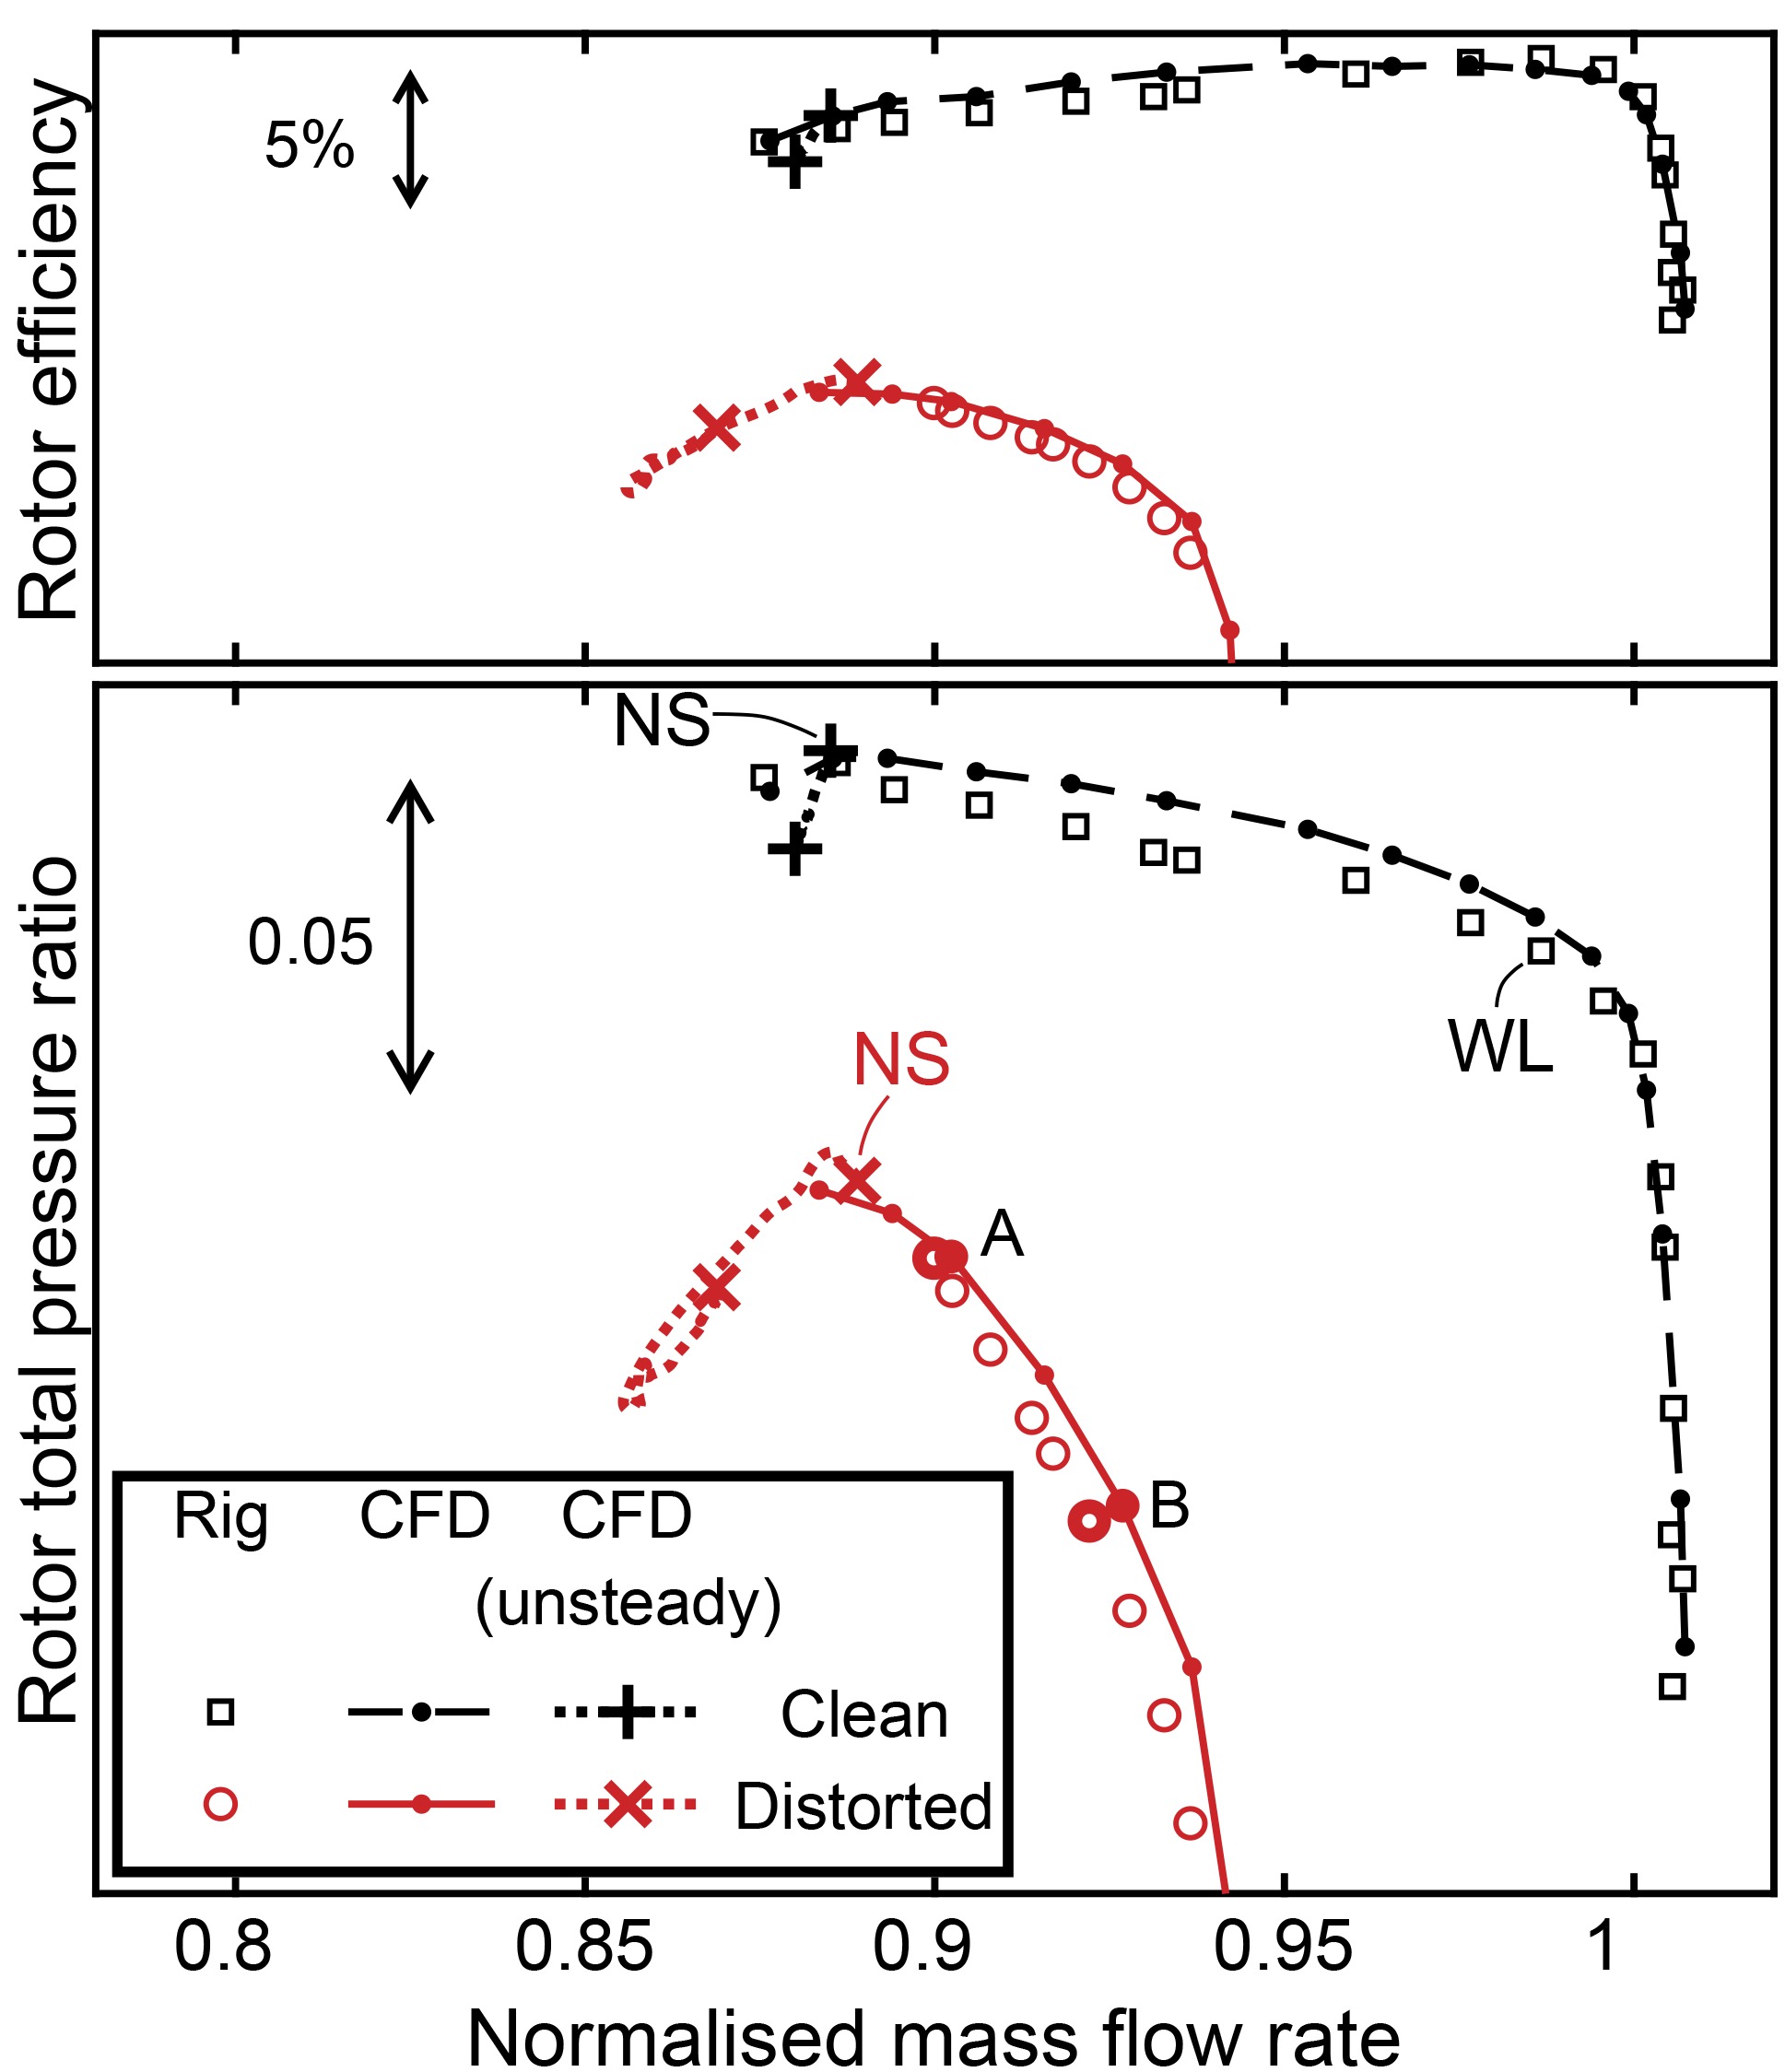
Steady, single-passage calculations form 100% design rotor speed characteristics for clean and distorted inflow, plotted in Figure 4. The rotor outlet total pressures and total temperatures were extracted from circumferentially mass-average flow field upstream of the mixing planes at equal passage area fractions as the experimental probes and averaged consistently with rig values. The averaged outlet total pressure is normalised by the ambient total pressure,
Figure 4.
Total pressure ratio and isentropic efficiency characteristics at 100% rotor speed with clean and distorted inflow.
Rotor outlet radial circumferentially mass-averaged total pressure and total temperature profiles are plotted against the relevant rig measurements with distorted inflow in Figure 5. Following the good match with clean inflow presented by Kim et al. (2019), the single-passage calculations accurately capture the radial distribution of work input and loss.
Figure 5.
Radial profiles of total pressure and total temperature at rotor outlet plane 3 for points A and B with distorted inflow (labelled in Figure 4).
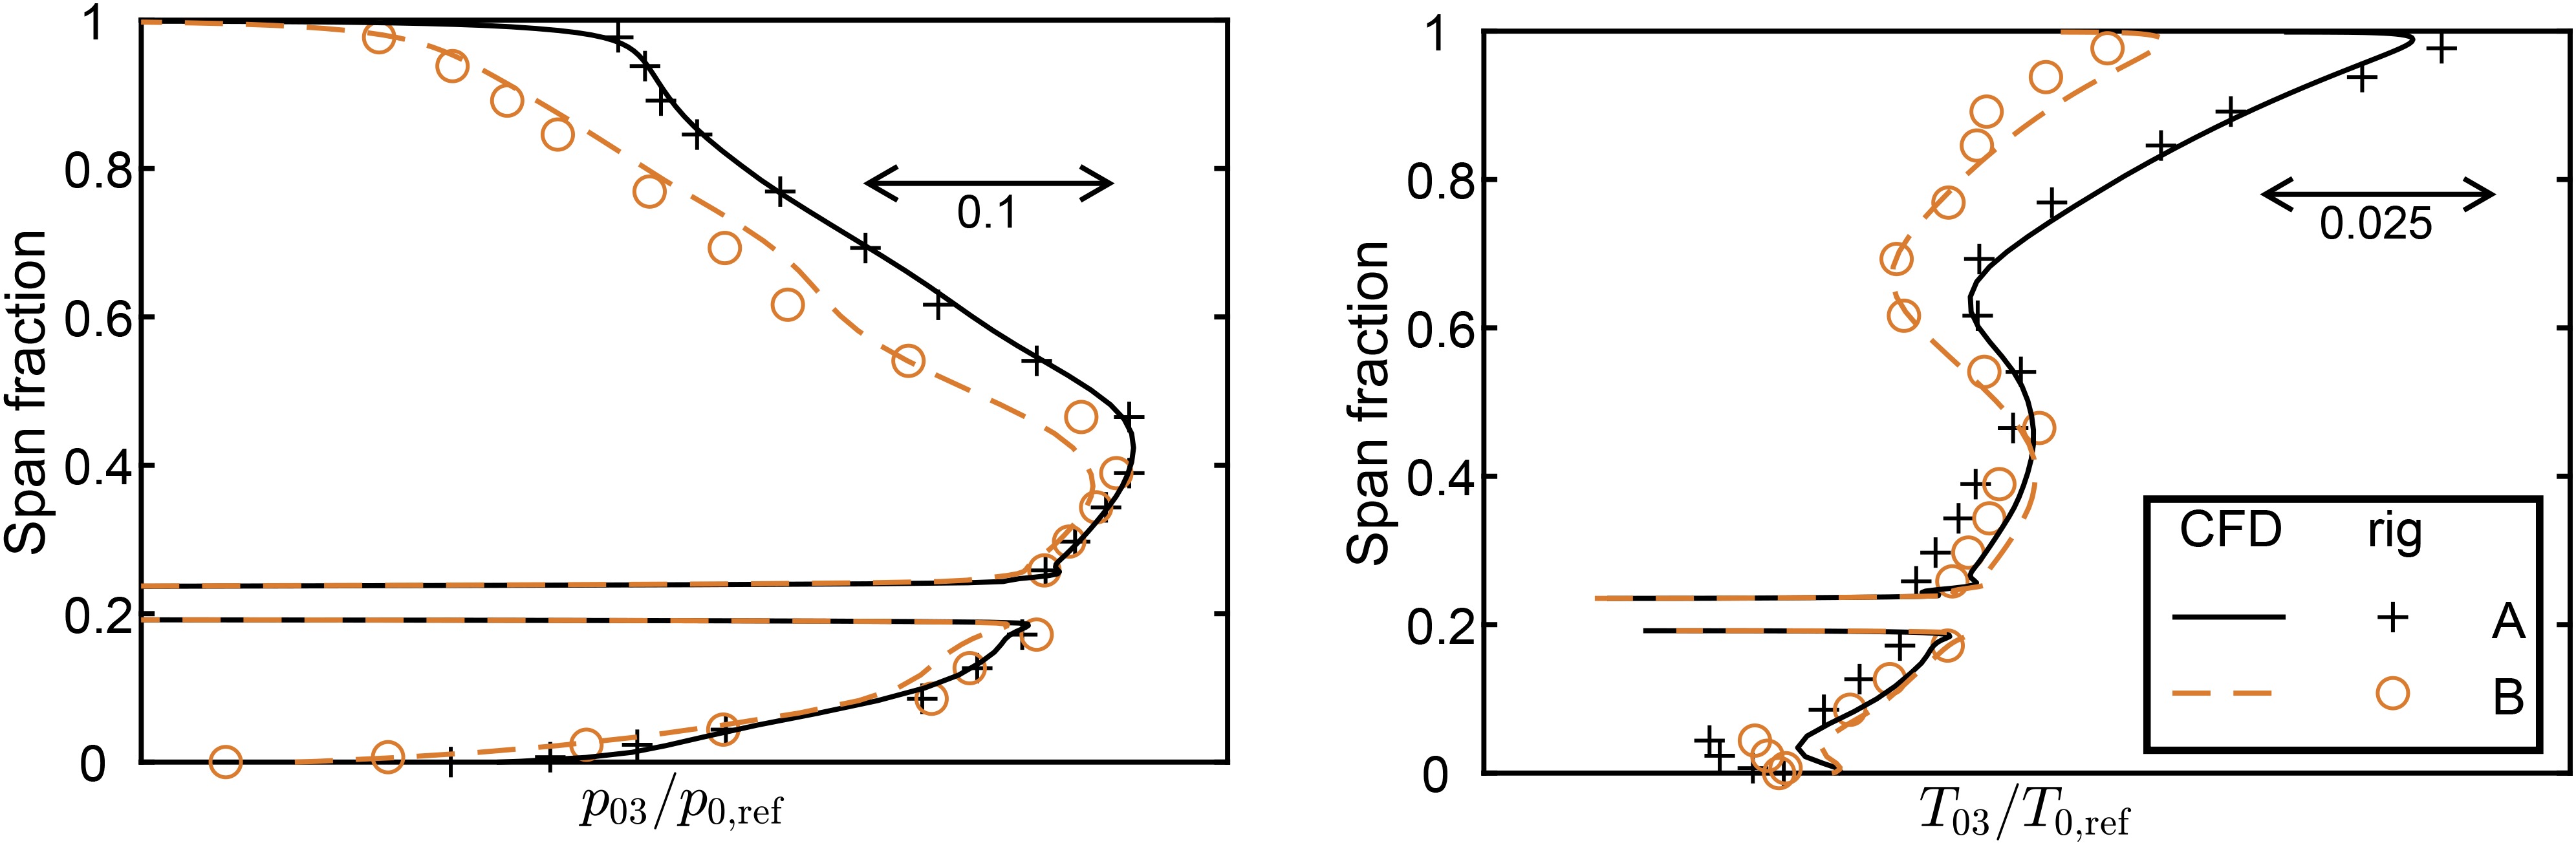
Compared with operation in clean flow, pressure rise is limited by reduced loading outside of the distortion region, where a raised flow coefficient causes choked flow near mid span. Low pressure rise at the tip derives from loss in the distortion plate, and despite increased work input in the distortion region.
Stall prediction
The accuracy of the stall prediction from the unsteady, full-annulus calculations can be assessed through comparison to two rig measurements: the position of the last stable operating point, and the time-varying casing static pressure.
The first comparison is described as a stall margin, or a measure of flow range below a nominal design operating condition. To quantify this stall margin, M, a change of 1D isentropic nozzle area ratio is given as
where the subscript
Table 2 lists the stall margin from rig measurements and calculations for operating in uniform, and distorted inflow. The reference design operating condition is on the rig take-off working line with uniform inflow 100% rotor speed line (labelled WL, Figure 4). The pressure ratios used were rotor outlet, area-averaged values, as plotted in Figure 4. With clean inflow, there is an error of 0.6% of estimated nozzle area, and 2.3% for distorted inflow. The predicted decrease in stall margin is 67% of that observed experimentally.
Table 2.
Stall margin and cell rotational speed for rig and CFD calculations with clean and distorted inflow.
| Clean inflow | Distorted inflow | |||
|---|---|---|---|---|
| Rig | CFD | Rig | CFD | |
| Stall margin, | 0.134 | 0.128 | 0.0446 | 0.0679 |
| Stall cell speed/ | 0.82 | 0.87 | 0.58 | 0.67 |
The second comparison is made through rotor-upstream casing static pressure traces, plotted in Figure 6 for clean inflow and Figure 7 with distortion. Instances in time at which later figures plot the flow field are marked by dashed lines on the CFD traces. The result of Kim et al. (2019) qualitatively matches the effect of the developing stall cell, and predicts a faster stall cell once fully developed. Traces were low pass filtered by an 8th order Butterworth filter at 80% of the blade passing frequency to remove the once-per-rev signal. This highlights the disturbance of the misstaggered blade in the CFD trace, which starts to grow and slow in rotational velocity to form the developed stall cell.
Figure 6.
Rotor-upstream low pass filtered casing static pressure traces during stall inception with clean inflow.
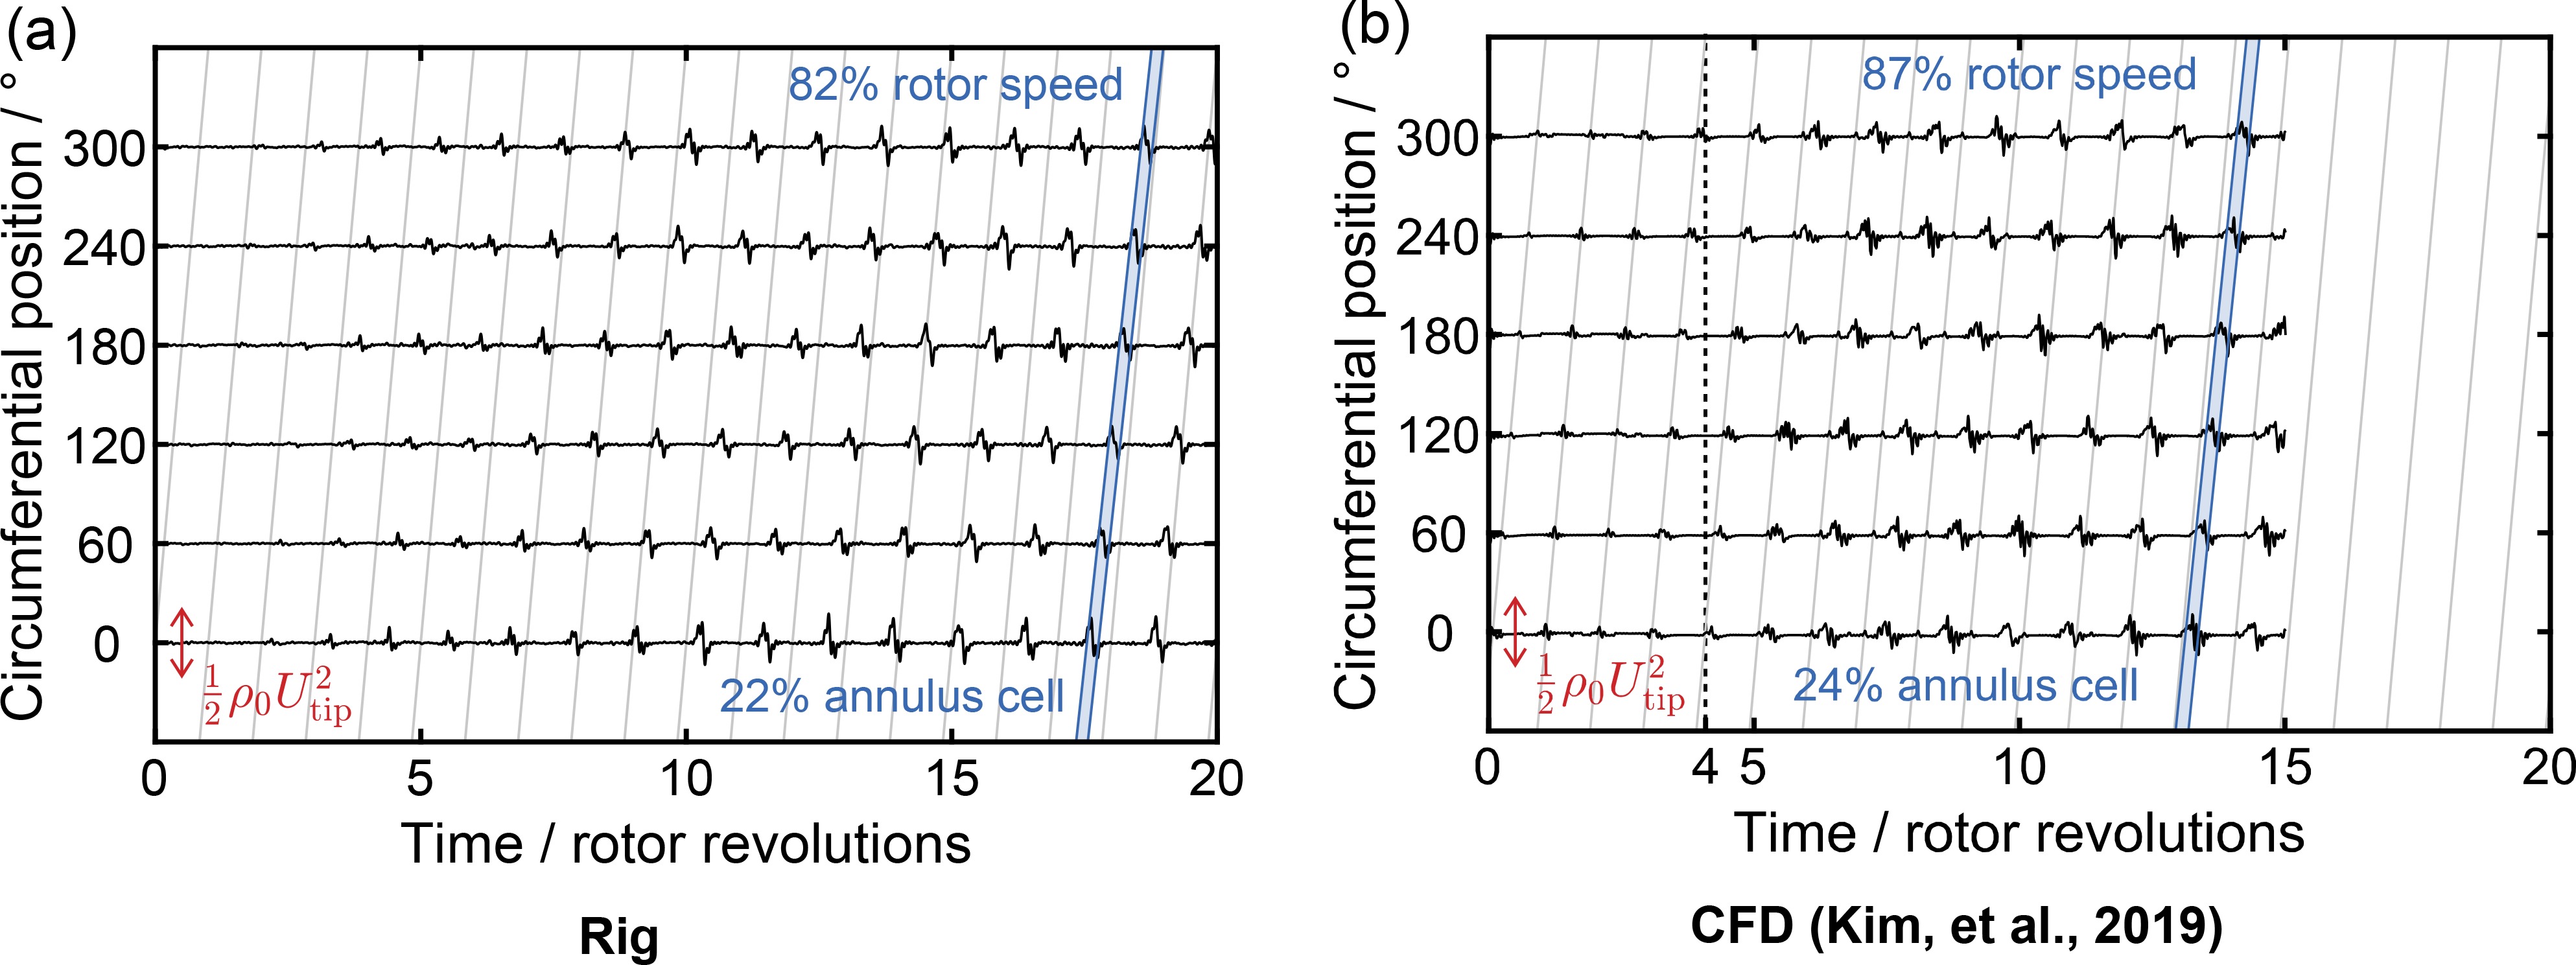
Figure 7.
Rotor-upstream low pass filtered casing static pressure traces during stall inception with distorted inflow.

Rig measurements with distorted inflow show larger and slower stall cells. Stall cell rotational frequency was extracted from the Fourier transform of casing pressure traces over 20 revolutions of periodic stall behaviour. CFD predictions in Figure 7b observe a similar trend, with the cell speed reducing from 87% of shaft speed to 67%, compared to 82% to 58% in the rig. Stall cell circumferential extents are approximate. The edges of the stall cells were estimated from the contour of zero axial velocity at the Kulite position for the CFD solution. The rig edges were then drawn by matching the shape of the pressure trace of Figure 7a to that from the CFD.
Calculations accurately capture the steady flow performance and stall parameters. The distorted inlet flow is appropriate across the conditions modelled. Though the fall in stability margin is underpredicted by around 30%, this is considered acceptable given that this drop is small overall. Unsteady flow features towards stall can be studied with confidence, including interactions with the upstream distortion plate.
Distortion effect near stall
Despite a similar mass flow rate at stall for clean and distorted inflow, performance across the rotor span displays clear contrasts. Figure 8 plots the normalised flow coefficient against rotor inlet radius, with the profile for distorted inflow exhibiting a sharp drop in the region subject to the total pressure deficit. At stall, tip sections within the distortion operate below their clean-inflow stalling flow coefficient, but sections below 75% span operate at higher-than-design flow. Stage outlet total pressure at stall is limited both by loss through the distortion plate and by reduced loading below the distorted region. Figure 9 plots the suction surface pressure distributions, which demonstrate the aft shock position in distorted flow below 70% span.

Figure 9.
Suction surface limiting streamlines at the near stall point, overlaying contours C p
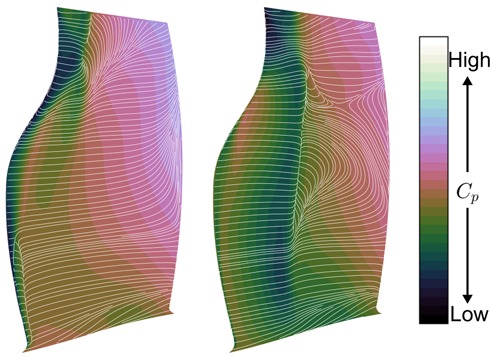
The tip sections tolerate lower flow, and higher flow-angle incidence due primarily to the concurrent reduction in relative inlet Mach number. This falls from close to the design value of 1.15 with clean inflow to 1.0 with distortion. Lower shock strength extends separation-free operation to lower flow coefficients – seen in the attached flow near stall in Figure 9. Augmented turbulent viscosity downstream of the distortion plate increases free-stream mixing, and will also tend to suppress separations near the tip, though this effect has yet to be quantified in the current work.
Stall inception and development
Kim et al. (2019) demonstrated that spike-type stall initiated from the growth in blockage caused by the separation downstream of the shock on the rotor suction surface. The same form of passage-width disturbance is observed with distorted inflow, meaning that the inception mechanism with and without distortion is similar. Figure 10 plots contours of radial vorticity at 99.5% rotor span, also drawing the shock position for the tip sections. The corresponding times on the casing pressure traces (Figures 6 and 7) are noted in rotor revolutions. The misstaggered blade effects a local increase in incidence, and positions its shock further upstream. Though separations behind the shock exist in every passage at this condition, the earlier shock produces significantly greater passage blockage, which in turn reduces flow to the following passage.
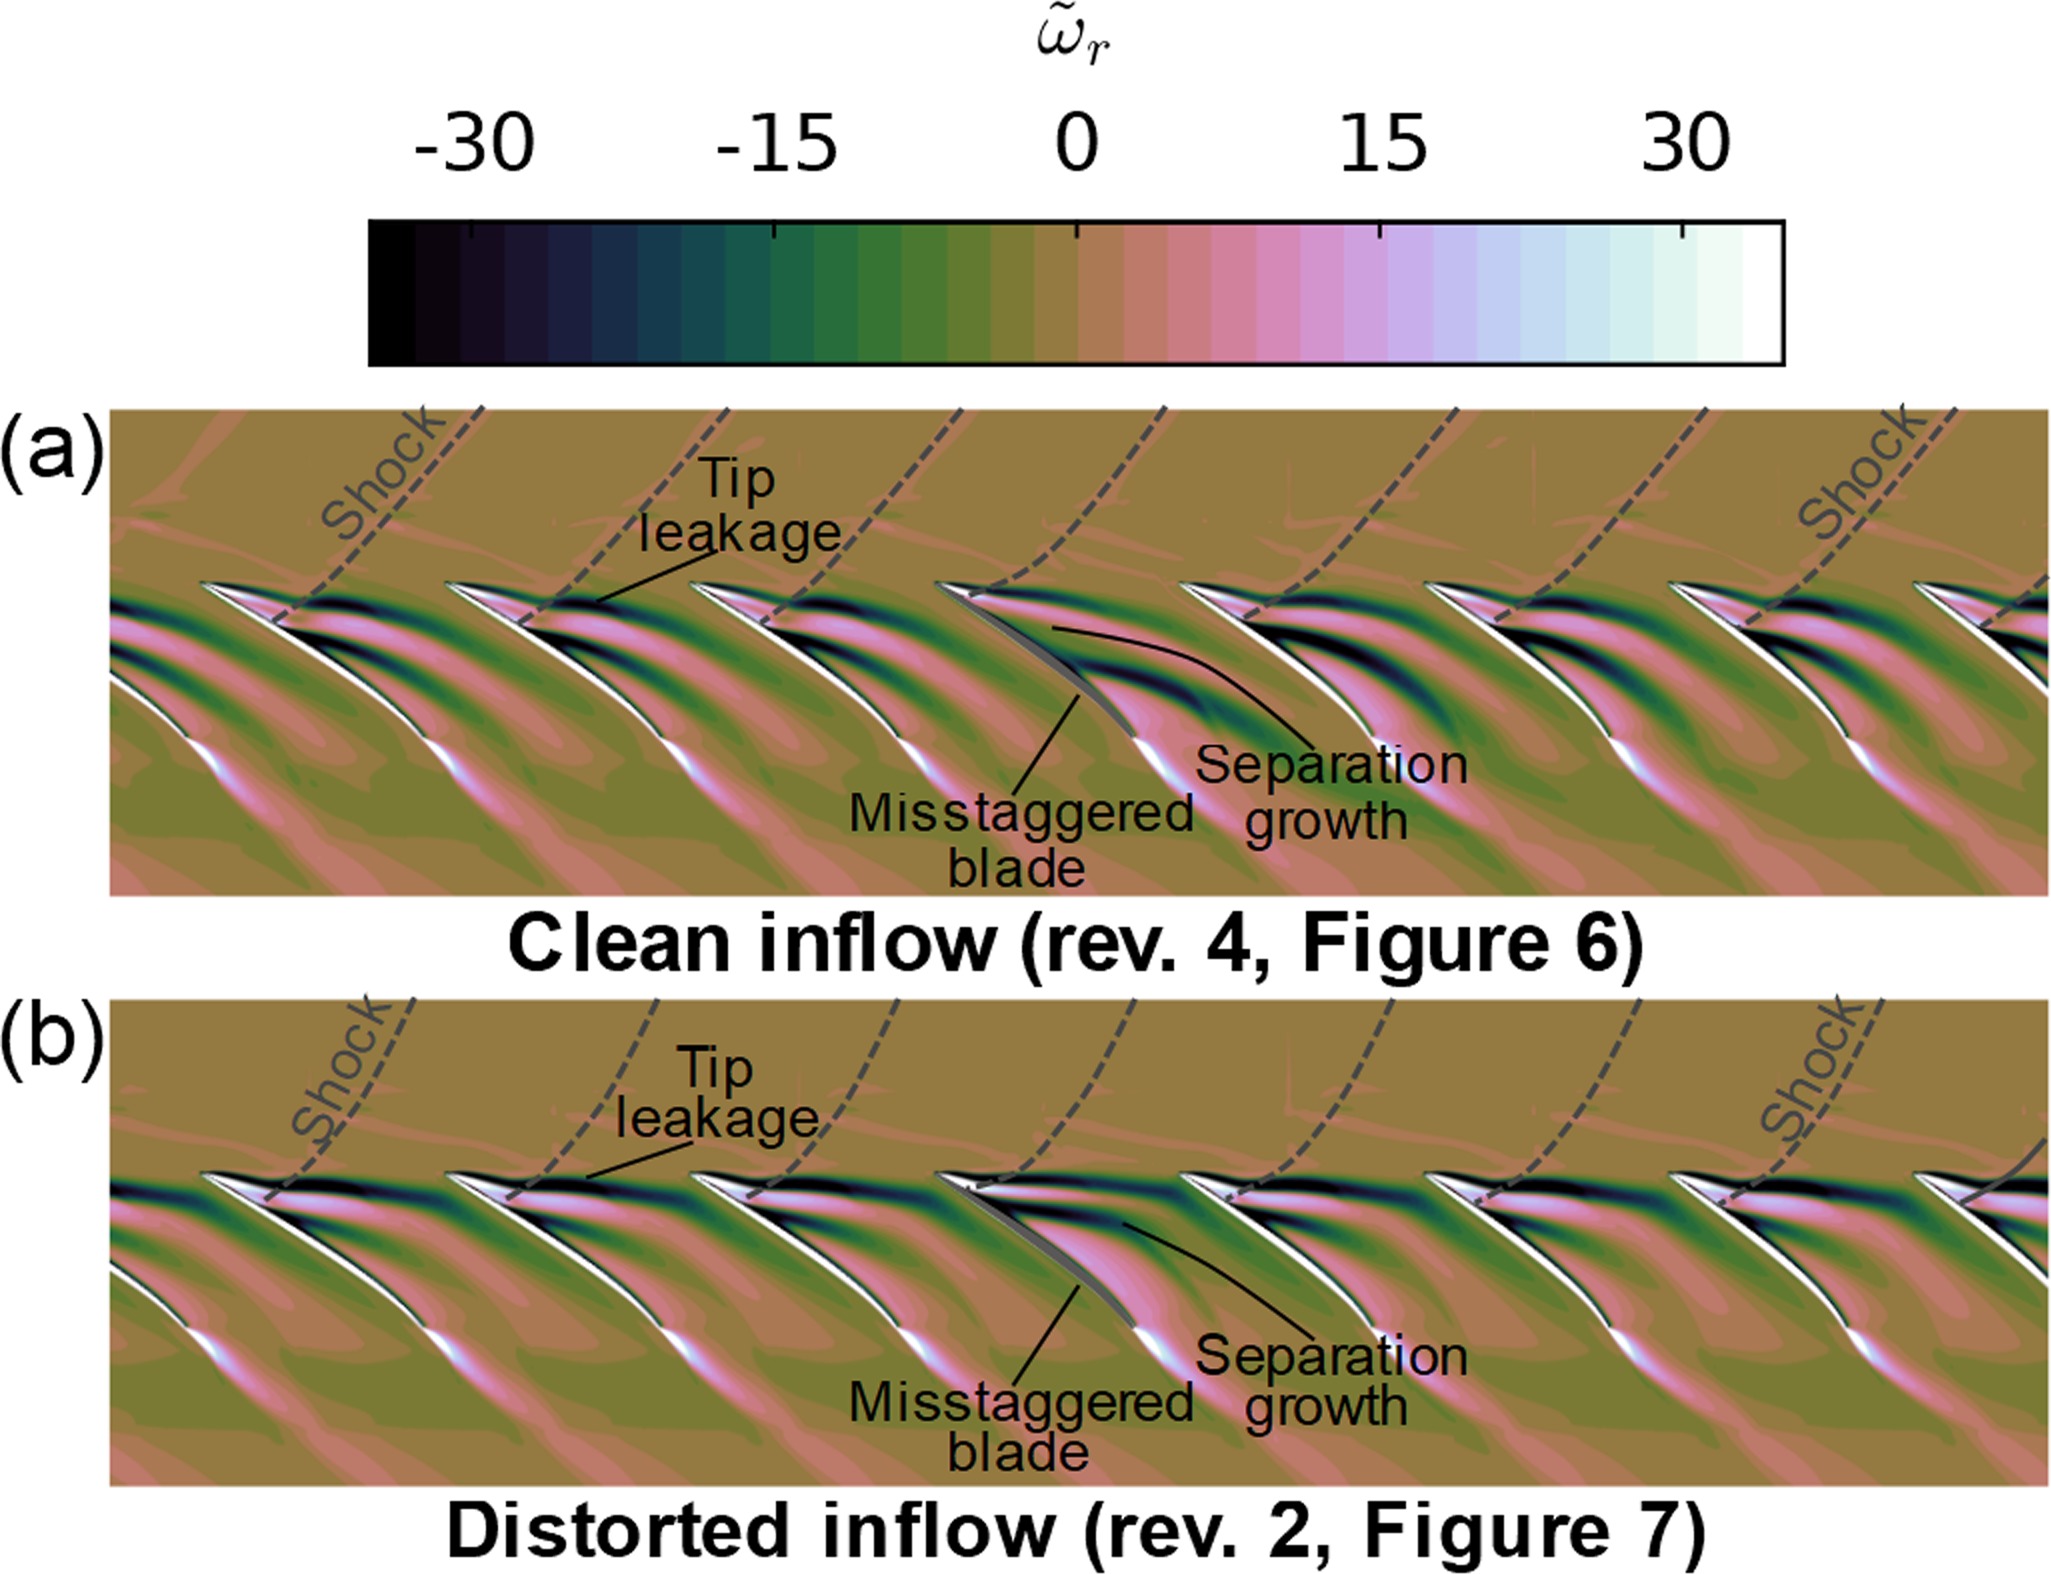
The main contrasts with distorted inflow derive from the reduced tip flow coefficient at stall. The trajectory of the labelled tip leakage flow is further towards the tangential direction, and to spilling ahead of the neighbouring rotor blade leading edge. This suggests that Fan A is particularly insensitive to stall inception through tip flow spillage, where fan designs which display that failure mechanism would see a greater reduction in stable operating range under a similar distortion pattern.
Figure 10 also highlights the more forward shock position with distorted inflow. Blockage from the separation on the misstaggered blade's suction surface is further upstream in the passage, and grows nearly tangentially across the blade passage. This occurs through the reduced tip relative Mach number and flow coefficient, and is illustrated in Figure 11. The pre-shock Mach number for both cases exceeds 1.4, but the shock with distorted inflow occurs at 20% along the section camber line, compared to 30% without distortion.

With the stall cell propagating due to blockage forming closer to the rotor leading edge with distorted inflow, its circumferential extent is around 80% larger.
Stall cell upstream effect
Predicting stall with distortion effects upstream requires accurate representation of the non-uniform inlet conditions and their interaction with downstream components. Modelling the distortion plate within the domain includes any unsteady effect in calculations. To assess the importance of this interaction, Figure 12 charts the total pressure upstream of the fan averaged across 20° sectors in the distortion stream tube. This region is outlined by a total pressure contour equal to a drop of 5% of the maximum total pressure drop at plane 1 (Figure 1). Before stall occurs, the total pressure is circumferentially uniform at planes 1 and 2. Though plane 1 observes a variation due to the developed stall cell, its magnitude peaks at around a tenth of that observed at plane 2, which is 80% closer to the rotor tip leading edge.
Figure 12.
Instantaneous circumferential variation in tip distortion region total pressure upstream of the rotor with distorted inflow. Values of bars are averaged across 20° sectors.
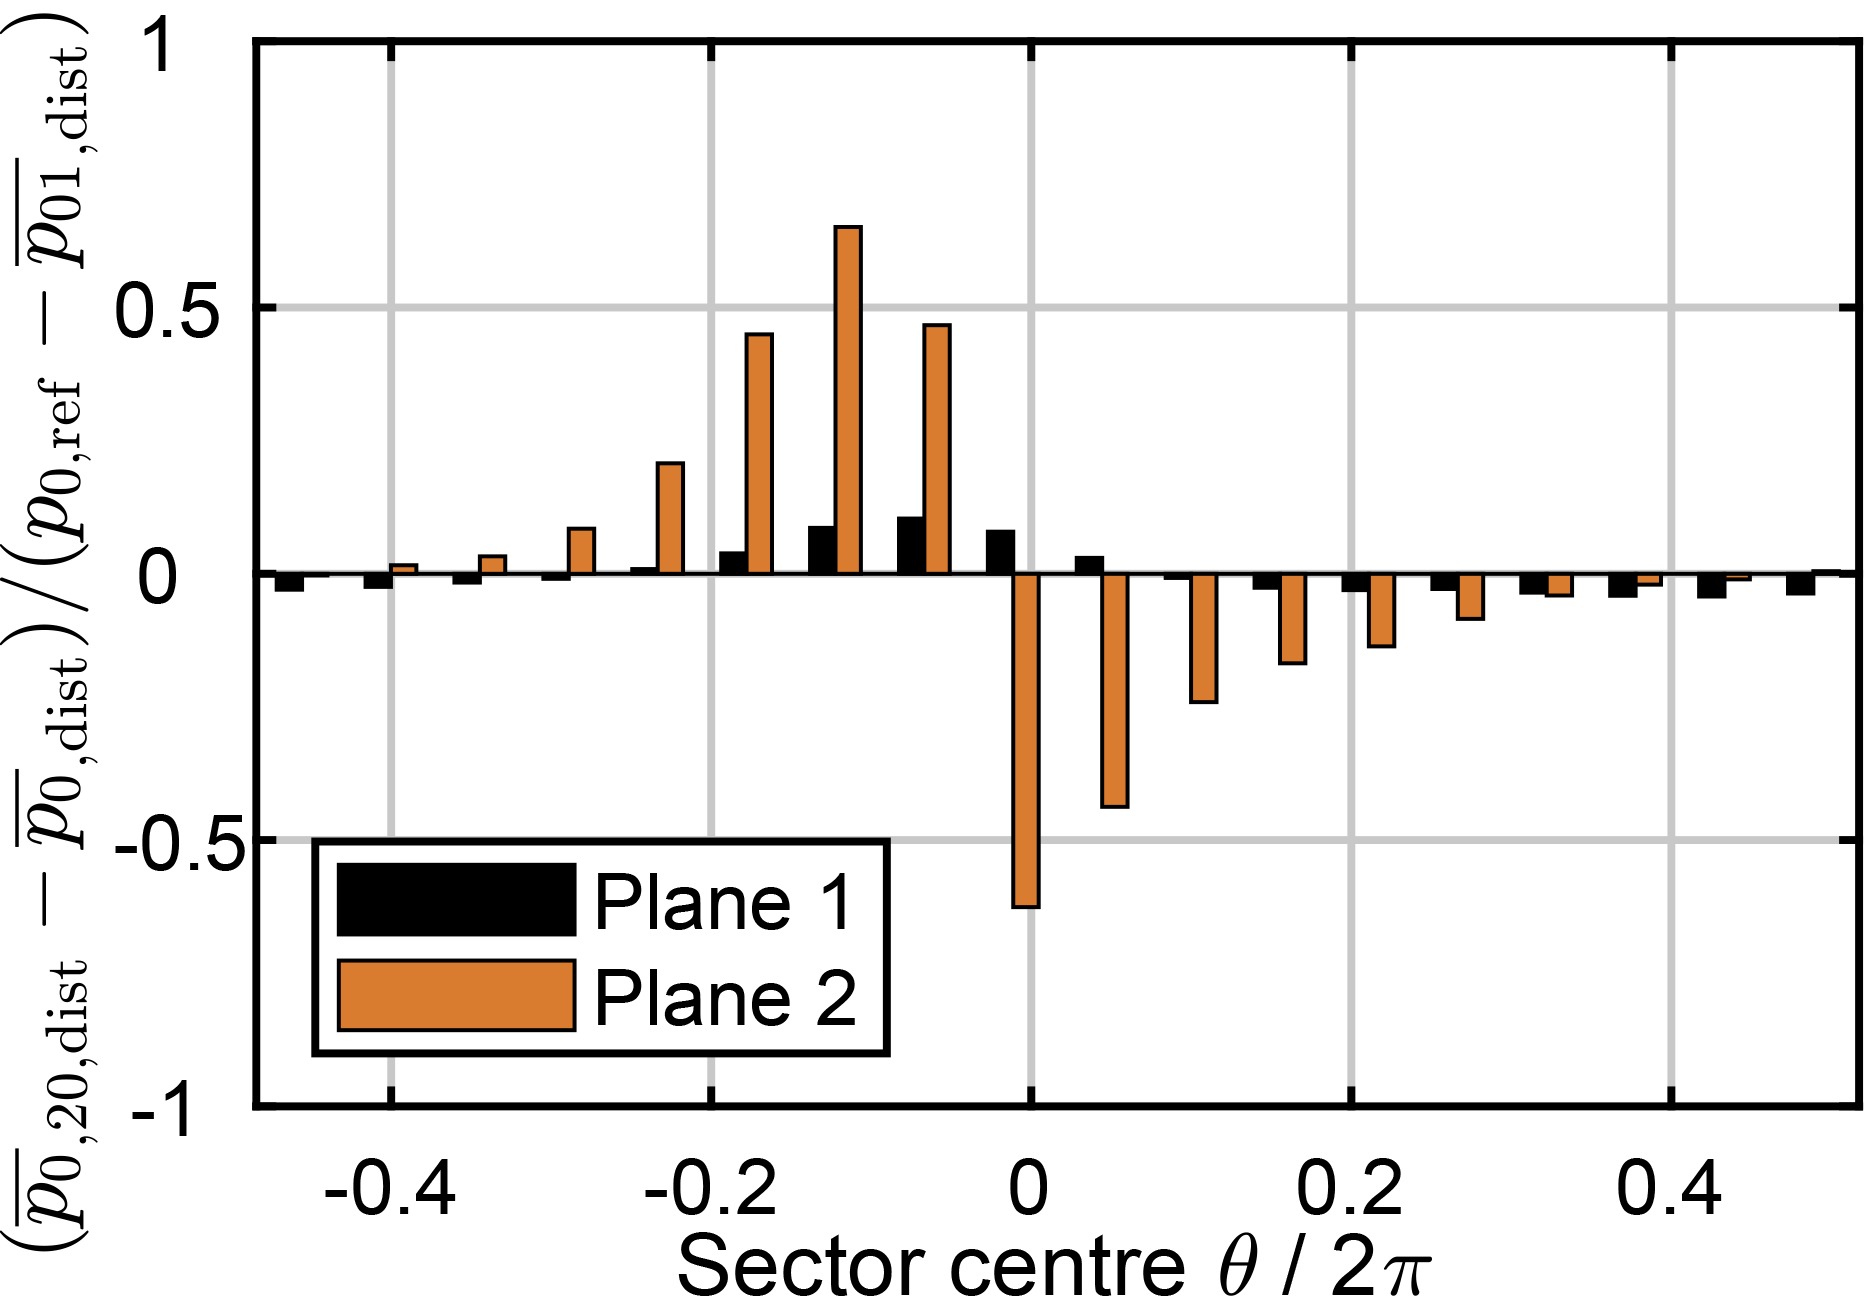
Plane 2's total pressure peak-to-peak variation exceeds the average total pressure drop across the distortion plate, and is primarily caused by unsteady work input. In the stationary frame of reference, the rotating pressure field of the stall cell creates a periodic rise and fall in total enthalpy upstream of the fan, but with no net work transfer to the flow. The axial extent of this effect is significant, scaling with the tip radius, and causes an unsteady back pressure to the distortion plate. The back pressure reduces flow through the plate, locally reducing the total pressure loss by the order of 10%. This is the source of circumferential variation in loss to Plane 1.
Replacing the distortion plate with a prescribed inlet boundary profile would neglect this unsteady effect in the stall process. While the dominant source of upstream total pressure, and enthalpy variation would still be captured in the rotating pressure field of the cell, the fidelity of stall calculations is improved by including the flow field of the distortion plate in the domain.
Conclusions
A computational method for predicting the stall point and behaviour was applied to a low pressure ratio transonic fan with a tip low radial distortion. The distortion was reproduced by modelling a simplified geometry of the rig's perforated plate. Comparison to rig measurements and further analysis produced the following conclusions.
Building on work modelling performance with clean inflow, the RANS model with distortion matched the inlet total pressure profile and time-averaged fan stage performance across the 100% rotor speed characteristic.
Stall calculations predicted a drop in stall margin of 67% of that observed in rig operation. Predicted stall cell speed dropped from 87% to 67% of shaft speed with distortion, compared to 82% to 58% in the experiment.
For Fan A, stall in clean and distorted flow has the same inception mechanism - a growth in the separation behind the passage shock. With distortion, a lower stalling flow coefficient at the tip results in blockage further upstream in the passage. This increases the stall cell's circumferential extent by around 80%. Fan A displays a modest loss of stable operating range because it is resistant to stall inception through tip leakage.
Modelling the distortion generation within the computational domain captures the unsteady interaction of the stall cell and upstream distortion plate. For fan calculations for flows with significant non-axisymmetric features, fidelity is lost if upstream geometry and flow is not modelled.
Further research is required to validate the URANS approach to stall prediction in engine-representative flow conditions. Calculations with precisely reproduceable non-axisymmetric distortions could assess how accurately unsteady effects are captured, and provide confidence for future coupled stall predictions. This method would allow estimates of the stall point of fan stage designs at one flight condition in under a week. Predictions of limits imposed by aeroelastic behaviour are required to produce a full assessment of a fan's stable operating range.
Nomenclature
Roman characters
Area/m.
Pressure coefficient,
Specific heat capacity at constant pressure / J kg−1 K−1.
Surface isentropic Mach number.
Mass flow rate / kg s−1.
Corrected mass flow rate / kg s−1,
N
Number of rotor blades.
Static pressure / Pa.
Total (stagnation) pressure / Pa.
Radial distance from rotor axis / m.
Total (stagnation) temperature / K.
Rotational speed / m s−1.
Flow velocity / m s−1.
Axial coordinate / m.
Greek characters
Ratio of specific heat capacities.
Polytropic efficiency.
Circumferential coordinate.
Stall margin (Equation 1).
Total pressure ratio.
ρ
Density / kg m−3.
Flow coefficient,
Rotor angular velocity / s−1.
Normalised radial vorticity.
Subscripts and superscripts
Total (stagnation) property.
1
Plane 3 property (Figure 1).
Plane 3 property (Figure 1).
Plane 3 property (Figure 1).
Property averaged over 20° sector.
bp
Bypass duct property.
Casing property.
Stall cell property.
Property averaged over the distorted region.
Exit flow property.
Inlet flow property.
Inlet measurement plane property.
Leading edge property.
Reference (domain inlet) plane property.
International standard atmosphere sea level value.
Rotor tip property.
Working line operating point value.
Stall point value.