Introduction
For a liquid rocket engine, turbopumps supply liquid oxidizer and fuel to the combustion chamber at high pressure. Turbopumps rotate at high speeds to reduce the rocket engine weight and achieve high power densities. Such requirement leads to cavitation in turbopumps. Therefore, to inhibit cavitation in the impeller, an axial type inducer is installed upstream of the turbopump. However, the inducer itself can suffer from cavitation. When the inducer cavitation becomes severe, its head coefficient, ψ, is decreased. Critical cavitation number (defined to be the cavitation number at which the head coefficient value decreases to 97 % of the nominal value) is used to signify the head coefficient degradation. Inducer cavitation can also cause hydraulic instabilities- rotating cavitation, asymmetric attached cavitation, and cavitation surge 17. The onset cavitation number is used to quantify the beginning of cavitation instability.
In cryogenic fluids or hot water, the temperature and vapor pressure within the cavitation bubbles are decreased due to the latent heat absorption by the bubbles from the liquid during the vaporization process. This phenomenon is referred to as the “thermal effect.” As the liquid temperature increases, the thermal effect is enhanced, and cavitation bubble growth is suppressed 02. 14 measured cavitation performance for pumps and inducers in liquid hydrogen. The critical cavitation number decreased with increasing liquid temperature or decreasing rotational speed. 11 found that the critical cavitation number and cavitation region length were decreased as the liquid nitrogen temperature was increased. 16 found that the critical cavitation number was reduced at high water temperatures.
07 observed the variations in cavitation region length at the inducer leading edge and the onset of cavitation instabilities with changes in the liquid (refrigerant R-114) temperature and rotational speed. As R-114 temperature increased, the leading edge cavitation region was shortened and rotating cavitation occurred at lower cavitation numbers. In R-114 (in which the thermal effect existed), the cavitation region was lengthened as the rotational speed increased, but the cavitation region length was insensitive to the rotational speed in cold water (in which the thermal effect was negligible).
18 investigated cavitation instabilities at different liquid nitrogen temperatures. They found the followings. First, rotating cavitation occurred at the same length of tip vortex leakage cavitation region regardless of temperature. Second, the onset cavitation numbers of rotating cavitation and asymmetric attached cavitation were decreased as the temperature of liquid nitrogen increased. Finally shaft vibration and rotating cavitation amplitudes were reduced at high liquid temperatures.
Alternatively, to quantify such thermal effects, two parameters have been suggested. 02 suggested a dimensional thermal parameter, Σ (m/s3/2), from the Rayleigh-Plesset equation. Σ represents the amount of vapor pressure depression due to the thermal effect in a fluid ().
For cavitation in fluid machines, 08 derived a non-dimensional thermal parameter, Σ* by nondimensionalizing the Rayleigh-Plesset equation (). For simplicity, they assumed inviscid flow.
In ,
21 independently derived the non-dimensional thermal parameter Σ* in their analysis of an inducer cascade and found that increasing Σ* suppressed the onset of cavitation instabilities. 10 investigated the rotational speed effects using Σ* in liquid nitrogen. The cavitation region length and critical cavitation number both decreased as Σ* increased.
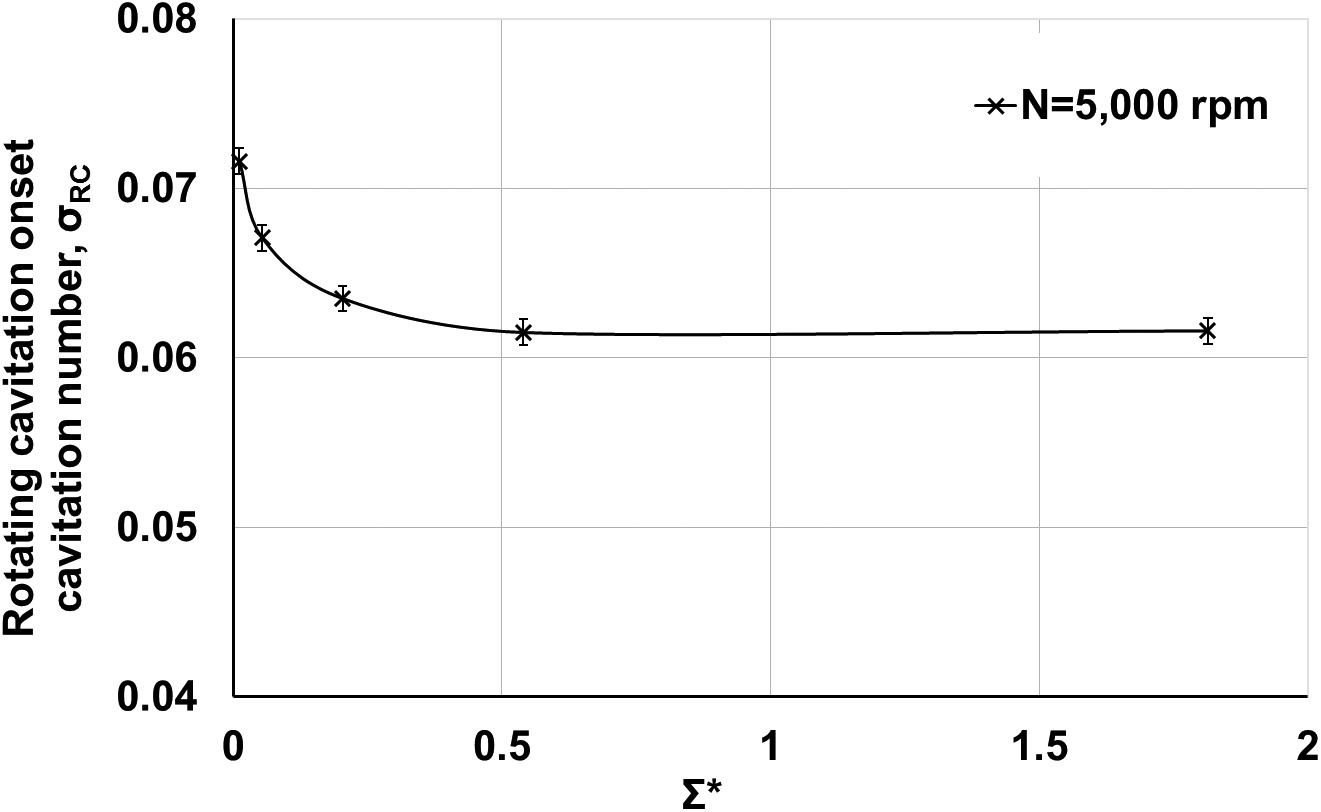
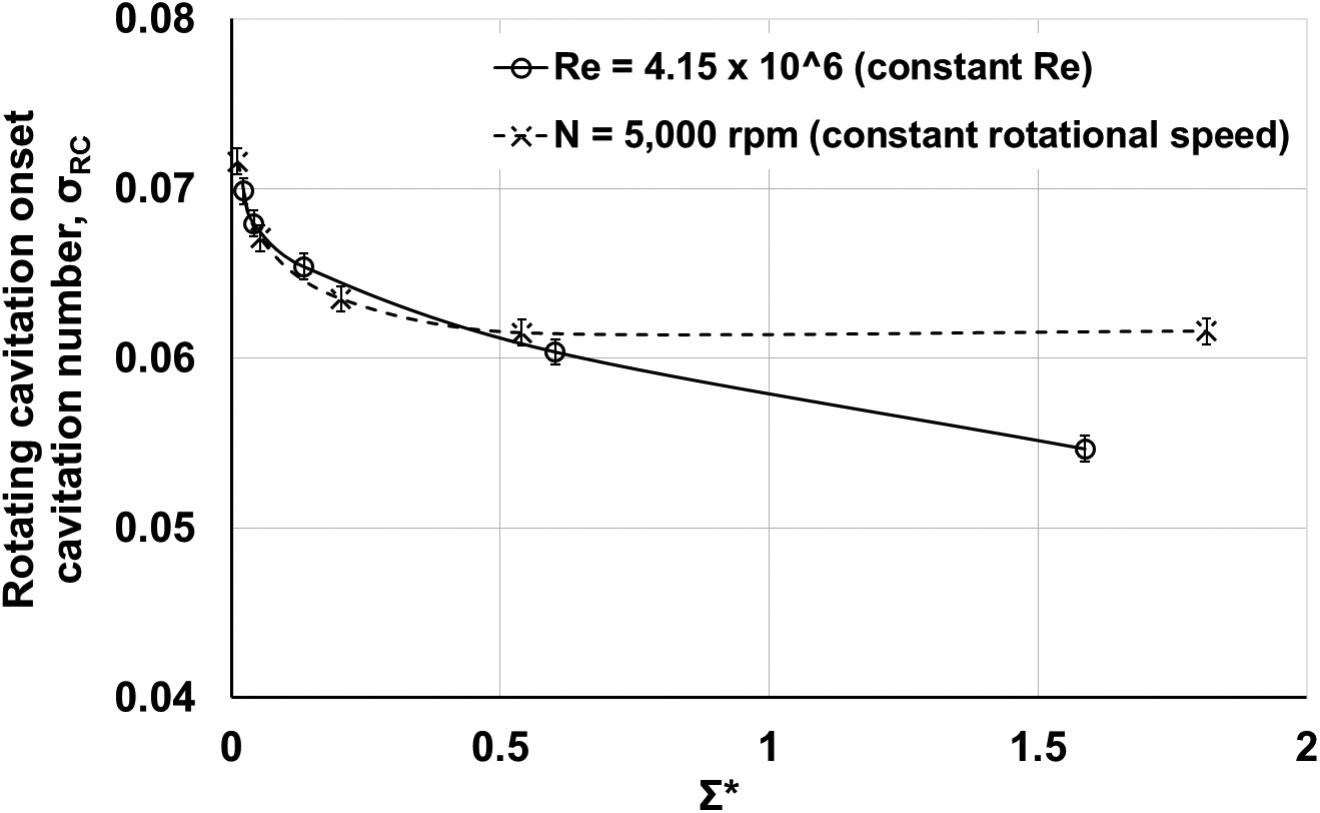
Hot water can be used as a surrogate test fluid for cryogenic oxidizer or propellant when it satisfies the similarity requirement in terms of the non-dimensional thermal parameter. 05 derived their DB parameter, which is a reciprocal of Σ*, and they matched their DB value in water with that of liquid oxygen. In water, they found that decreasing DB completely suppressed rotating cavitation. 12 investigated rotating cavitation onset trends for varying Σ* by changing the water temperature at a given rotational speed. The onset cavitation number decreased as Σ* was increased for Σ* < 0.54. However, for Σ* ≥ 0.54, the onset cavitation number remained constant as Σ* was increased (Figure 1).
Figure 1.
The rotating cavitation onset cavitation number versus the non-dimensional thermal parameter at 5,000 rpm and φ/φ_d = 1.0 12.
Previous researchers investigated the thermal effect on cavitating inducers by varying either the liquid temperature or rotational speed, but they did not consider viscous effects. However, when either the liquid temperature or rotational speed is changed, not only Σ* but also the Reynolds number (Re = 2ρ1rΩ2/μ1) is simultaneously changed. In 12, as Σ* was increased from 0.0116 to 1.80, the Reynolds number ranged from 2.6 × 10⁶ to 6.4 × 10⁶ as well. It indicates that Reynolds number possibly affects the occurrence of rotating cavitation. Yet, the individual effects of Σ* and Re on the cavitation instability onset have not been examined. Therefore, the research objective of this study is to measure and understand the individual effects of Σ* and Re on the onset of cavitation instability in a turbopump inducer.
Non-dimensional parameters
To identify the non-dimensional parameters governing cavitation growth in an inducer, the Rayleigh-Plesset equation for bubble dynamics is presented in 13.
Following 08, time have been normalized by x/U where x is the distance along the streamline followed by the bubble; U is the inducer blade tip rotational speed; and C is the inducer radius. Surface tension (S) and non-condensable gas effects (pG0) are negligible after the initial stage of bubble formation 03. The resulting non-dimensional Rayleigh-Plesset equation is then:
In , Σ* and Re are the two non-dimensional parameters which affect cavitation bubble growth. Increasing liquid temperature increases both Σ* and Re. Increasing inducer blade tip velocity increases Re but decreases Σ*.
Experimental apparatus and instrumentation
Figure 2 shows a schematic of the turbopump inducer water test facility at Seoul National University 12. The test facility has been designed to measure cavitating and non-cavitating inducer/pump performance over a wide range of operating conditions. The closed loop test facility includes a water tank, test section, flow straightener, control valve, and booster pump. A vacuum pump and compressed air supply pipe are connected to the water tank to control pressure. To adjust the water temperature, a 20-kW electrical heater has been employed in the water tank. The filtered water from the tank is circulated in the direction shown in Figure 2. Downstream of the collector, a flow straightener is located upstream of the flow meter for accurate flow rate measurement, and the control valve sets the flow rate. Farther downstream, the booster pump maintains a constant flow rate under cavitating conditions. Elastic couplings have been installed at the exit of the water tank and collector for alignment and vibration control. Rotating parts are composed of the test inducer, shaft, and motor. A 60-kW motor drives the inducer at rotational speeds of up to 10,000 rpm. The rotational speed of the motor is controlled to within ±1 rpm by a variable frequency drive.
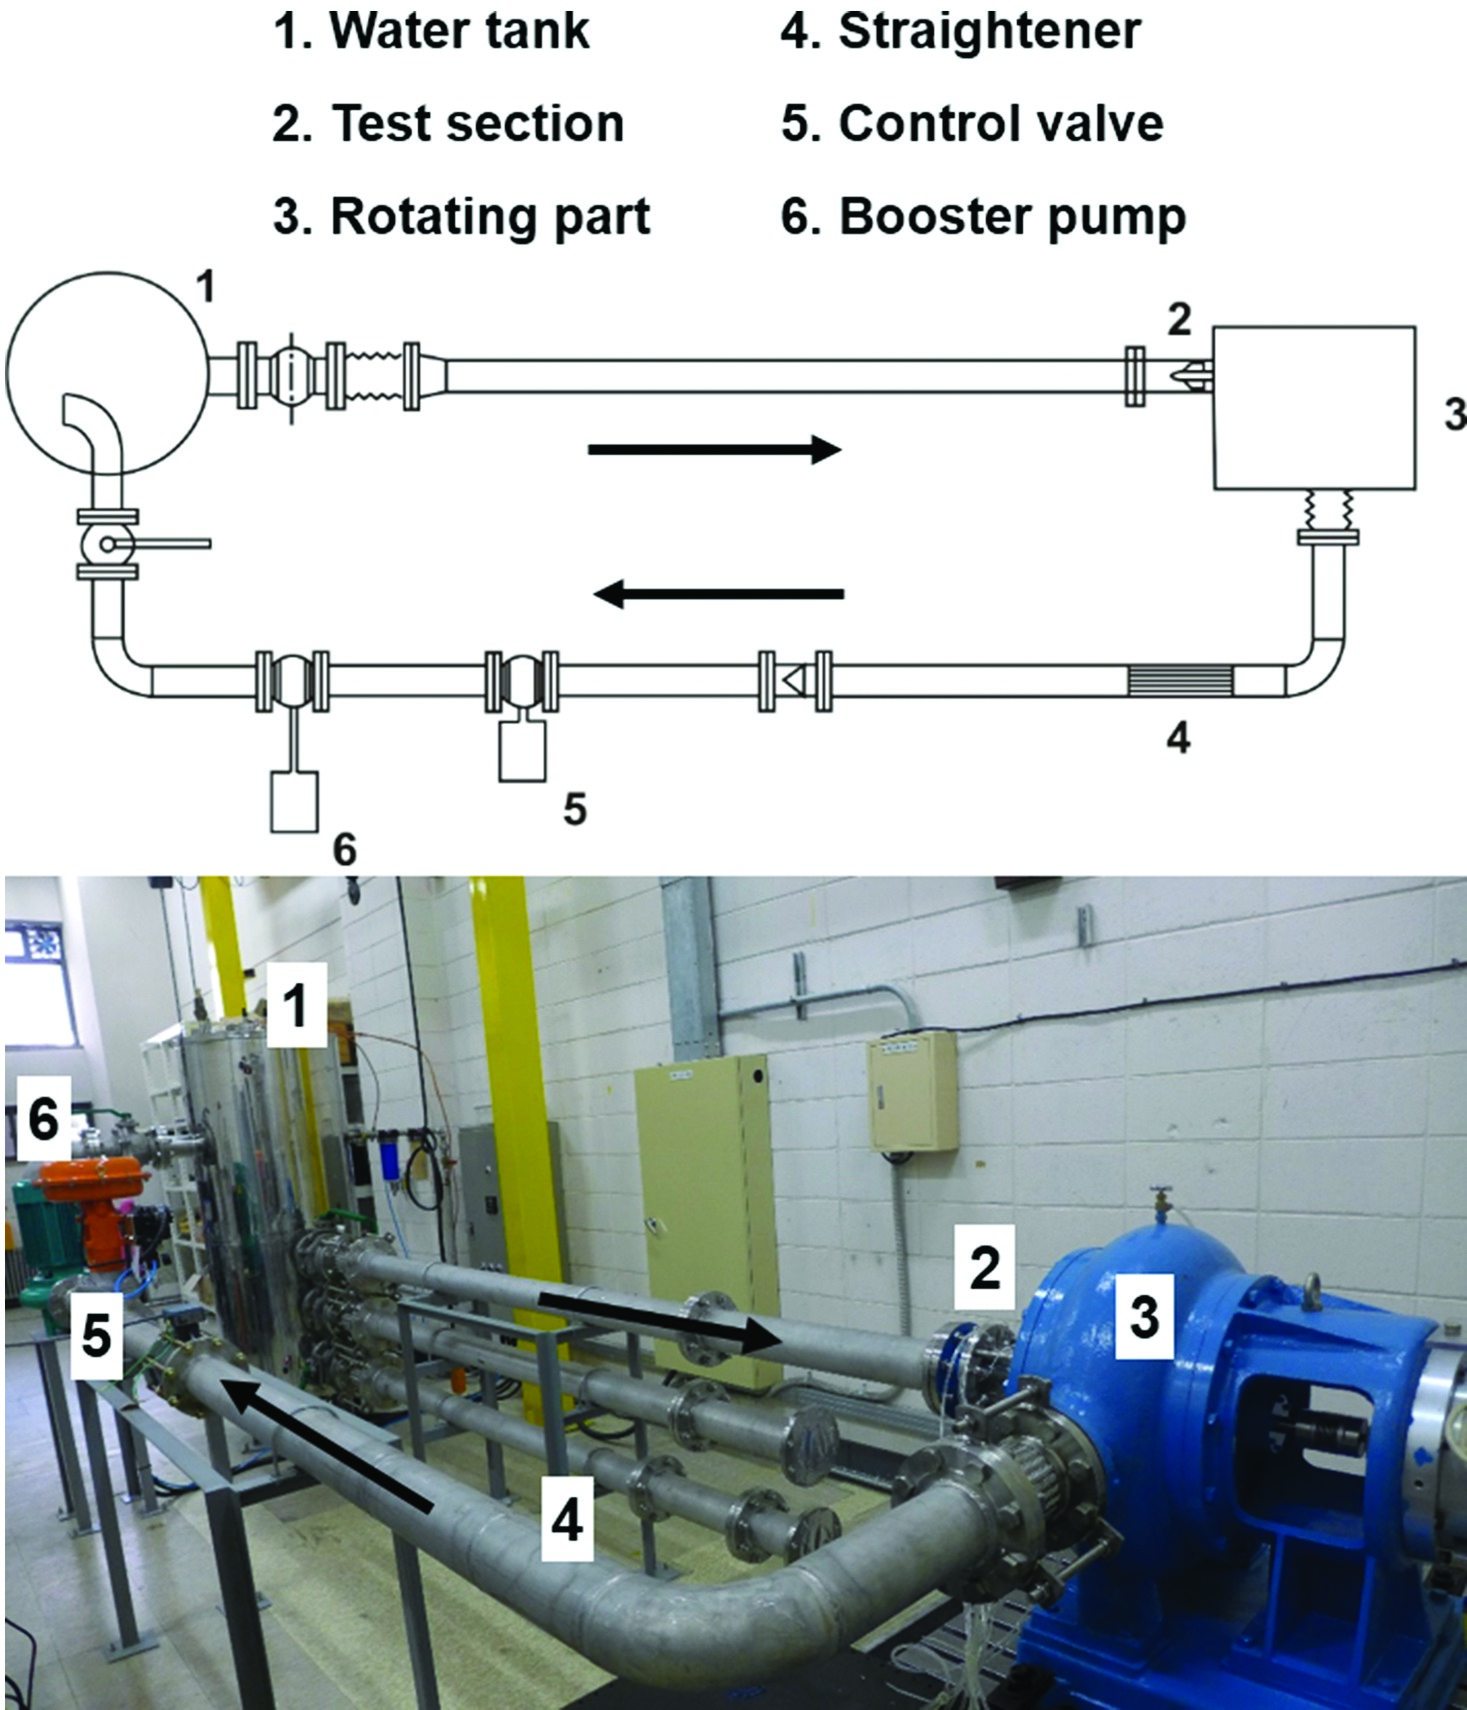
Figure 3 shows the test section instrumentation locations 12. Eight and four static pressure taps at x/D = −1.0 (P1) and 0.75 (P2) have been used to measure the inducer static head coefficient and cavitation number. Eight unsteady pressure transducers with an accuracy of 0.1 % of the full scale value (350 kPa) and 400 kHz frequency response have been installed at x/D = −0.25 to detect cavitation instabilities. Unsteady pressure signals have been sampled at 50 kHz for 1 second. Bulk water temperature has been maintained to within ±0.1 K during the test. The mean flow rate has been measured downstream of the flow straightener using an electro-magnetic flow meter with an accuracy of 0.25% of the full scale value (20 kg/s). The uncertainties of the head coefficient (ψ), flow coefficient (Φ) and cavitation number (σ) with a 95% confidence interval are ±0.00398, ±0.000422, and ±0.000759, respectively. All of the data presented in the paper have been acquired at the design flow rate condition.

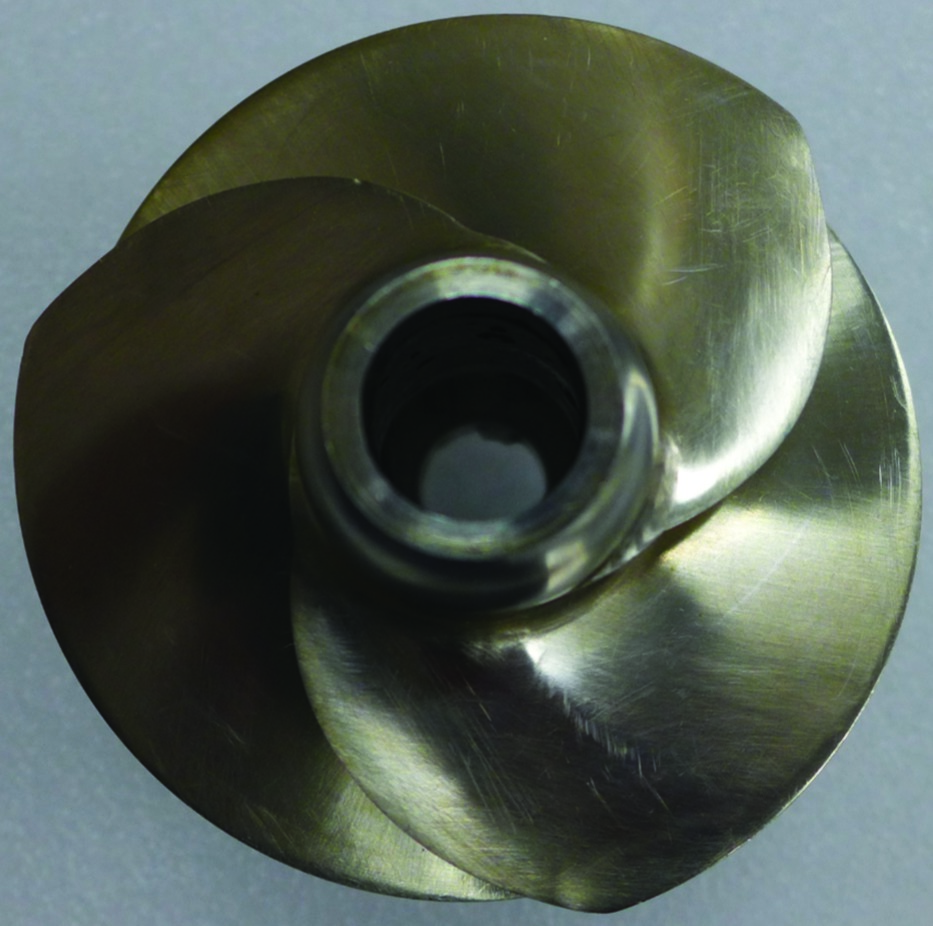
The test inducer (Figure 4) has been designed by the Korea Aerospace Research Institute (KARI), and its specifications are summarized in Table 1. The inducer has a high solidity and moderate blade tip angle at the inlet 04.
Experimental results and discussion
Cavitation instabilities
Fast Fourier Transform analysis and the cross-correlation of signals from two unsteady pressure transducers have been used to determine cavitation instability characteristics. Figure 5 shows the power spectral density plots of the unsteady pressure transducer signals for varying cavitation number 12. Three dominant peaks at f/Ω = 3.0 (σ > 0.072), 1.14 (0.053 < σ < 0.072), and 1.0 (σ < 0.053) are visible. According to 12, the peaks at f/Ω = 3.0, 1.14, and 1.0 correspond to blade passing frequency, rotating cavitation, and asymmetric attached cavitation, respectively.
Figure 5.
The power spectral density of inducer inlet pressure fluctuations (φ/φ_d = 1.0, Σ^* = 0.0116, Re = 2.58 × 10⁶ [T_∞ = 298 K and 5,000 rpm]).
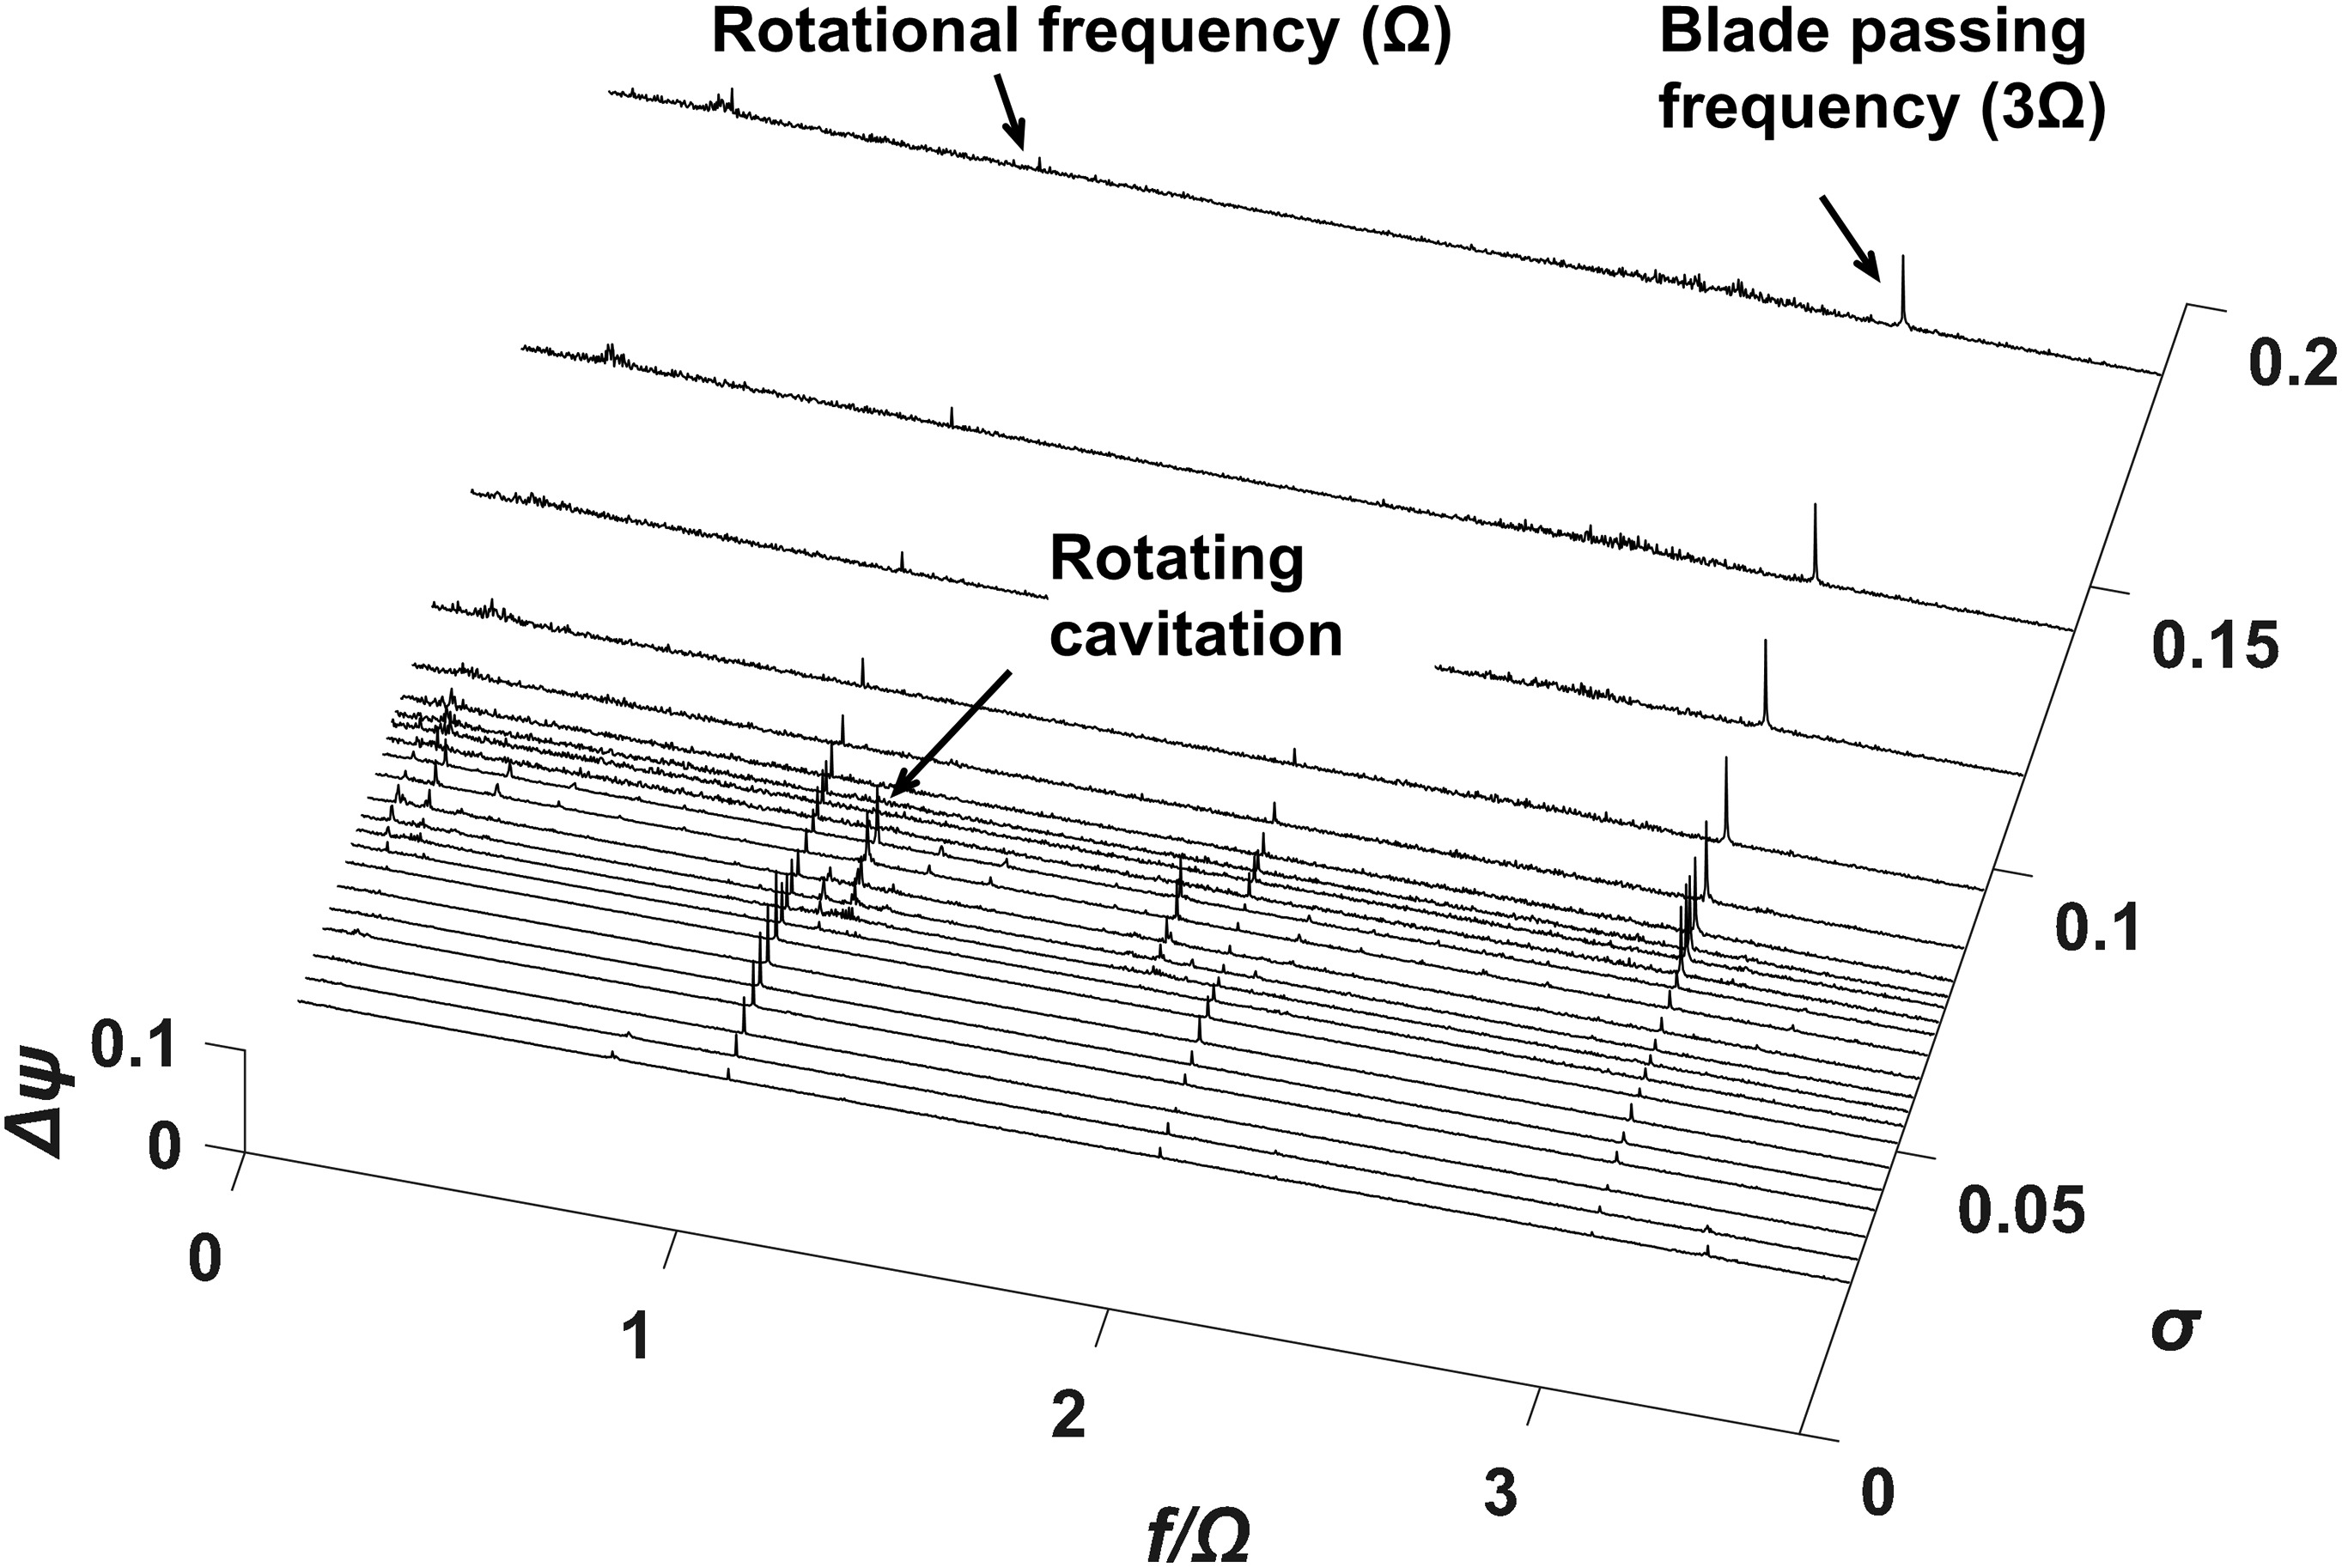
Rotating cavitation results in uneven cavitation regions rotating at a speed faster (super-synchronous) than the inducer rotational speed in the same direction. Thus, the frequency of rotating cavitation is f/Ω = 1.14 in the tested inducer 12. In the present study, the onset cavitation number of rotating cavitation (σRC) is defined to be the cavitation number at which the amplitude of the rotating cavitation frequency increases to five times its steady state amplitude. Repeatability for the onset of rotating cavitation has been confirmed by three separate tests, and σRC is repeatable to within 0.7% at the design flow coefficient.
Non-dimensional thermal parameter effects for constant Reynolds number
To investigate the effects of Σ* for constant Reynolds number, Σ* has been varied from 0.0227 to 1.55 while Re has been held constant at 4.15 × 10⁶. The test conditions are summarized in Table 2. From heat transfer analysis (Vergman and Incropera 2011), the temperature difference between the bulk water and wall varies from 0.04 K (308 K and 6,400 rpm) to 0.09 K (347 K and 3,500 rpm). The analysis procedure is described in the Appendix. The value of Σ* = 1.59 is similar to Σ* = 1.81 of the KARI liquid oxygen (LOX) inducer under the actual operating conditions (87 K and 20,000 rpm).
Table 2.
Test conditions for thermal parameter effects.
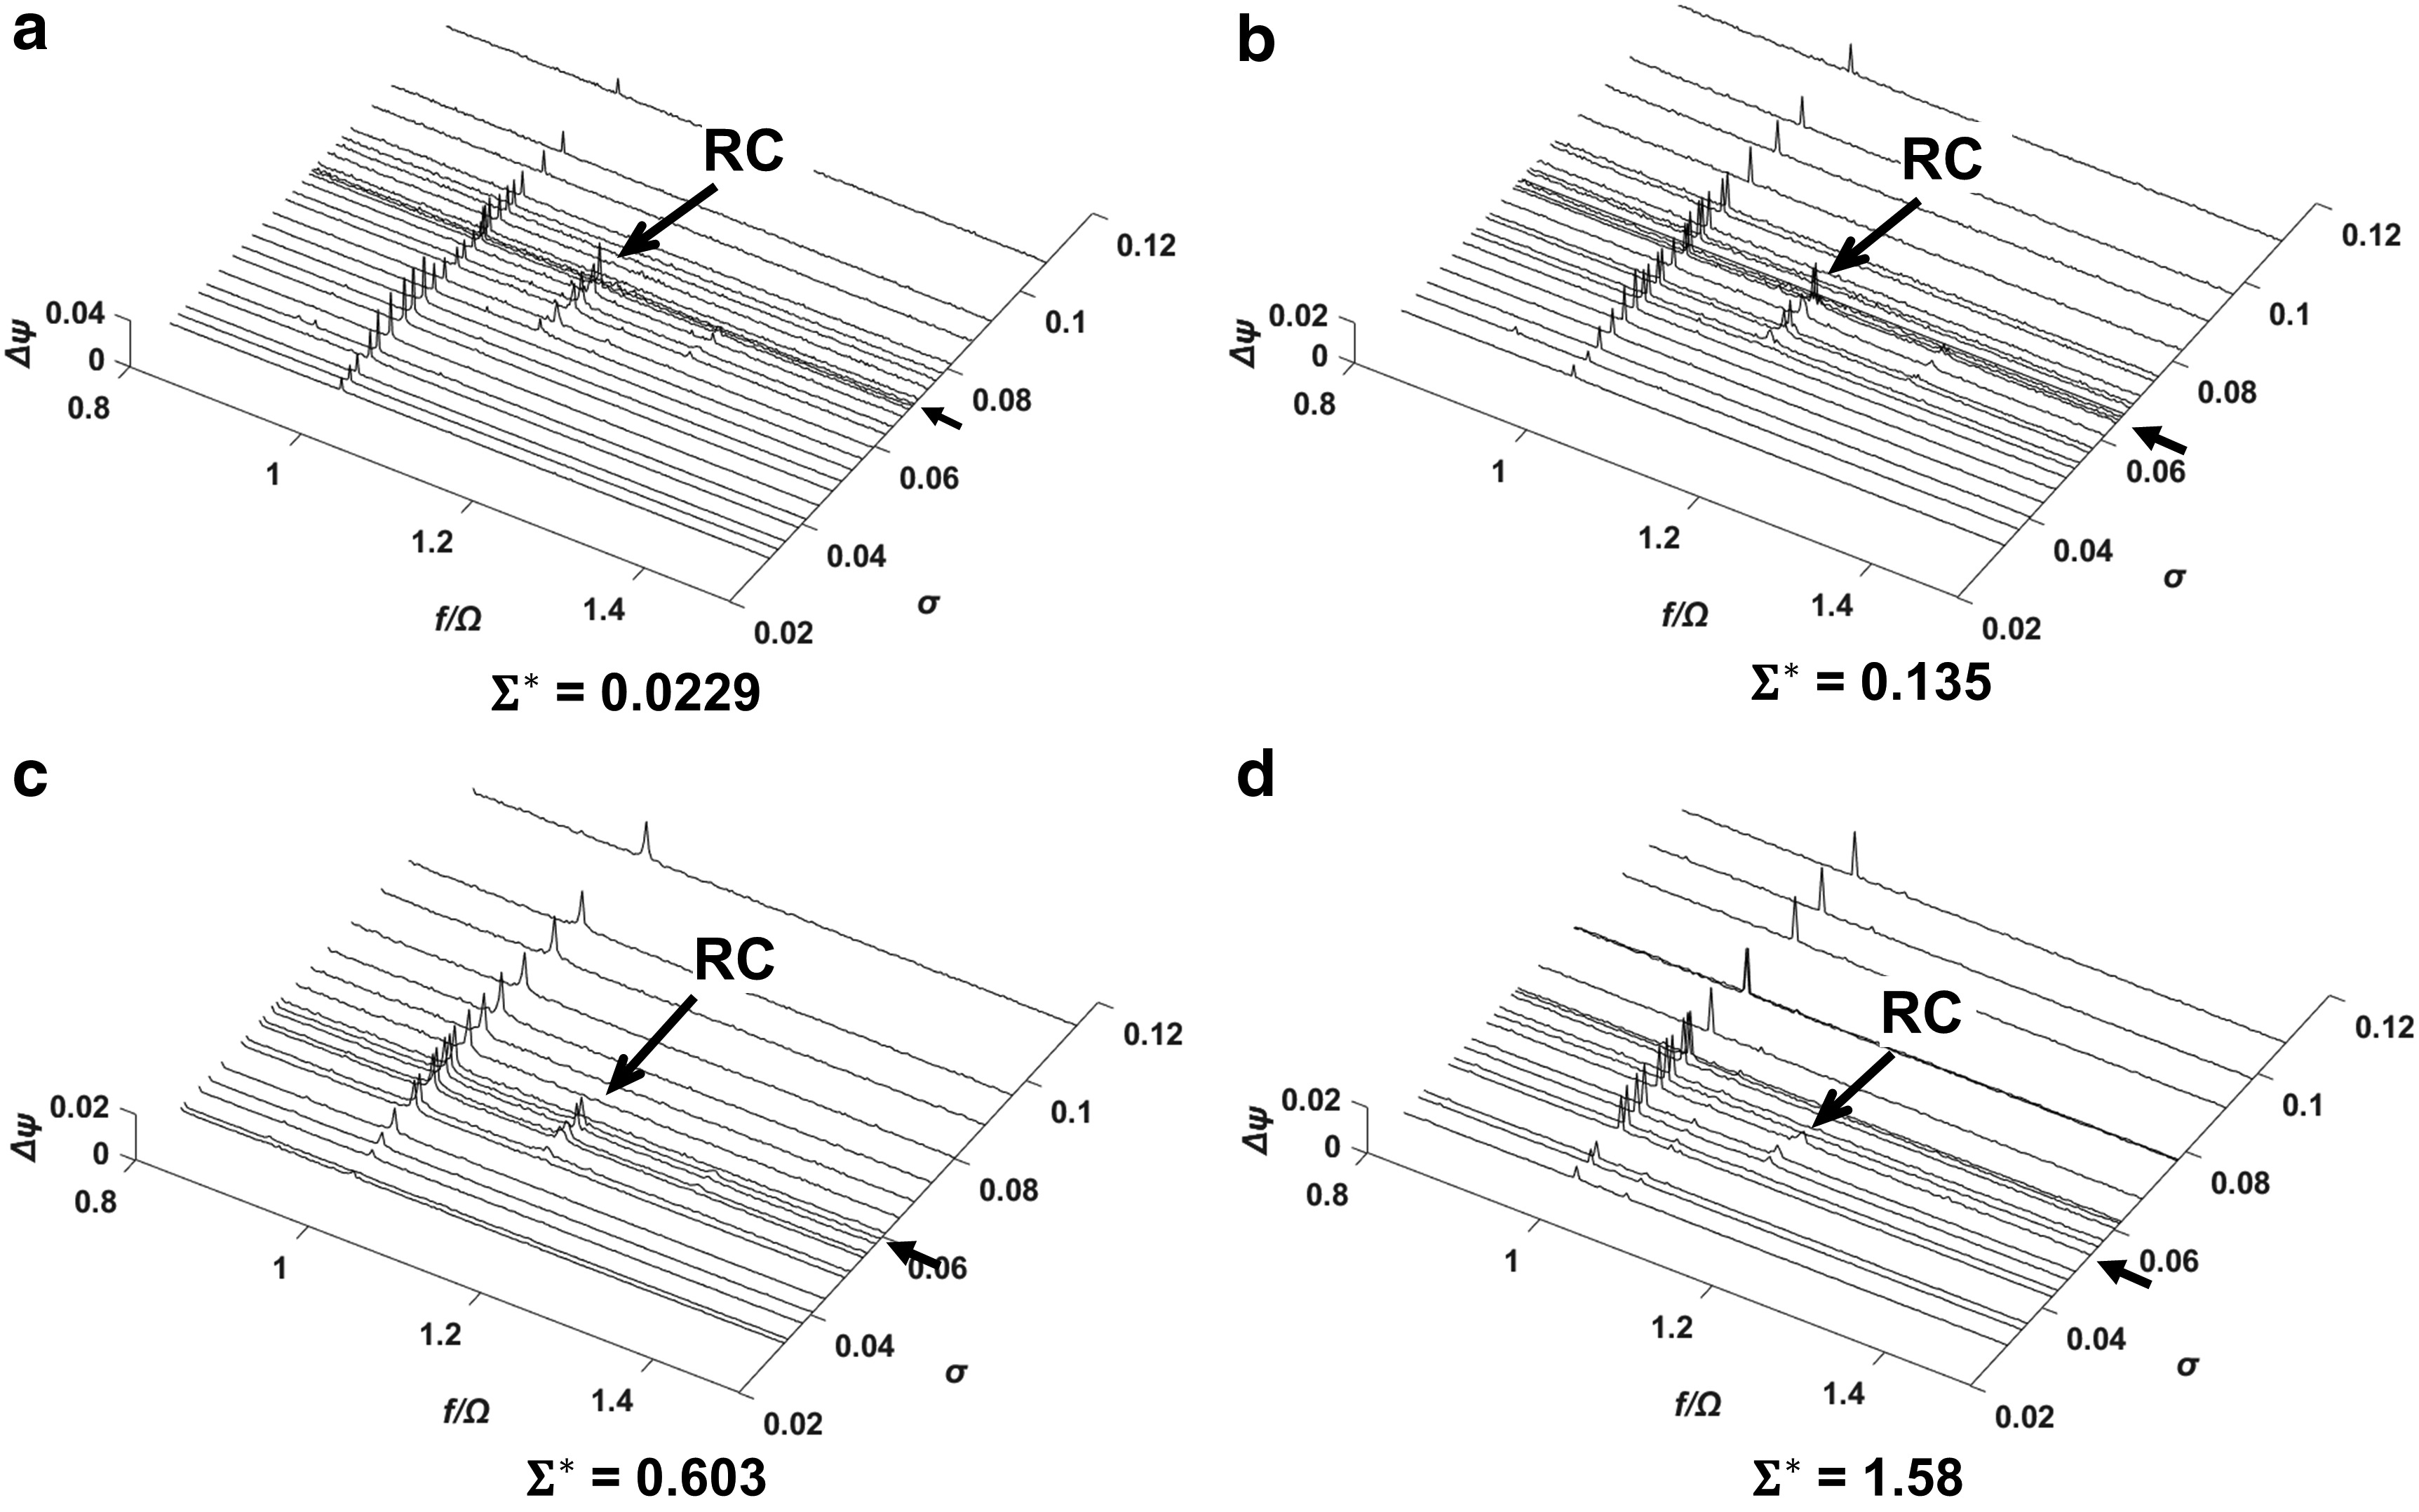
Figure 6 presents the power spectral density plots of the inlet unsteady pressure fluctuations for Σ* ranging from 0.0229 to 1.59 at Re = 4.15 × 10⁶. The arrows indicate the onset of rotating cavitation, σRC. The onset cavitation number and magnitude of the rotating cavitation (RC) at f/Ω = 1.14 are decreased as Σ* increases. Figure 7 shows the σRC plotted versus Σ*. σRC monotonically decreases by 21% as Σ* is increased from 0.0229 to 1.59. High-speed camera flow visualization qualitatively confirms this trend. Figure 8 shows the cavitation region on an inducer blade for Σ* = 0.0229, and Figure 8 shows the same blade for Σ* = 1.59 at σ = 0.081 and Re = 4.15 × 10⁶. The cavitation region for Σ* = 1.59 is visibly smaller than that for Σ* = 0.0229. According to 09, the onset of rotating cavitation depends on the length of the cavitation region. Thus, the visualization data are qualitatively consistent with the unsteady pressure data and confirm that increasing Σ* suppresses the rotating cavitation onset.
Figure 8.
The inducer blade cavitation for Σ^* = 0.0227 (a) and 1.55 (b) (σ = 0.081, φ/φ_d = 1.0, Re = 4.15 × 10⁶).
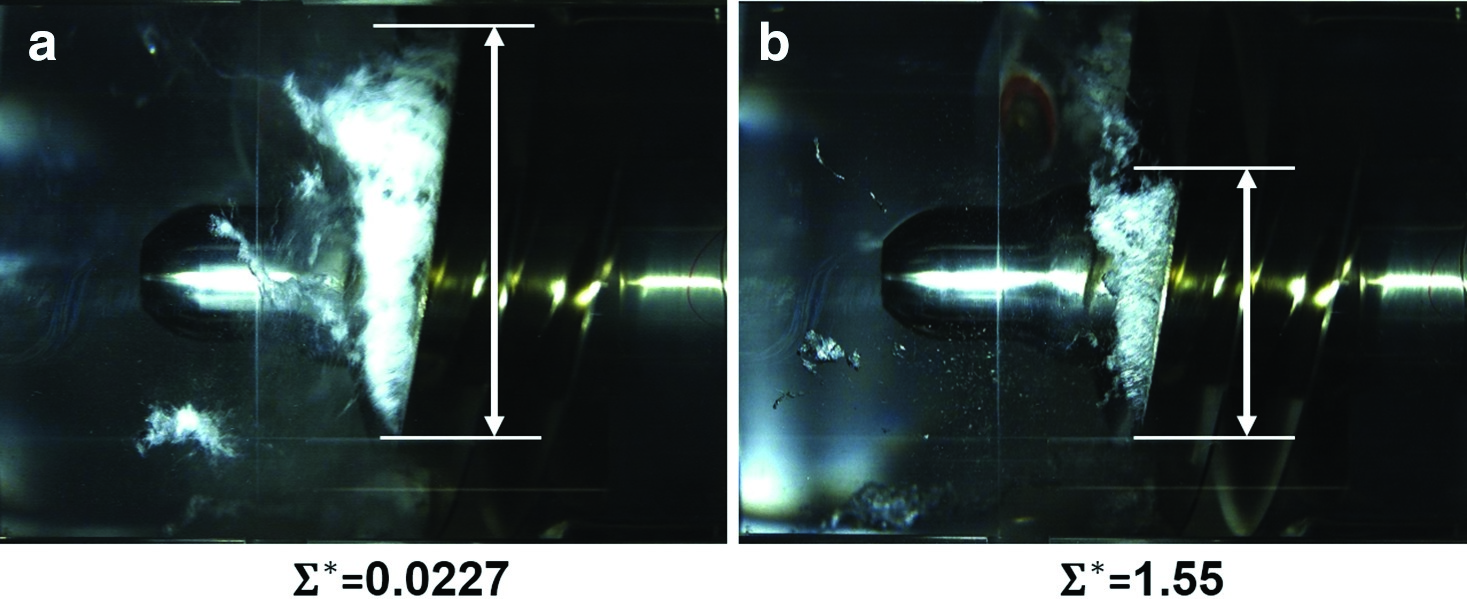
Figure 7.
The rotating cavitation onset cavitation number versus the non-dimensional thermal parameter comparing at Re = 4.15 × 10⁶ and φ/φ_d = 1.0.
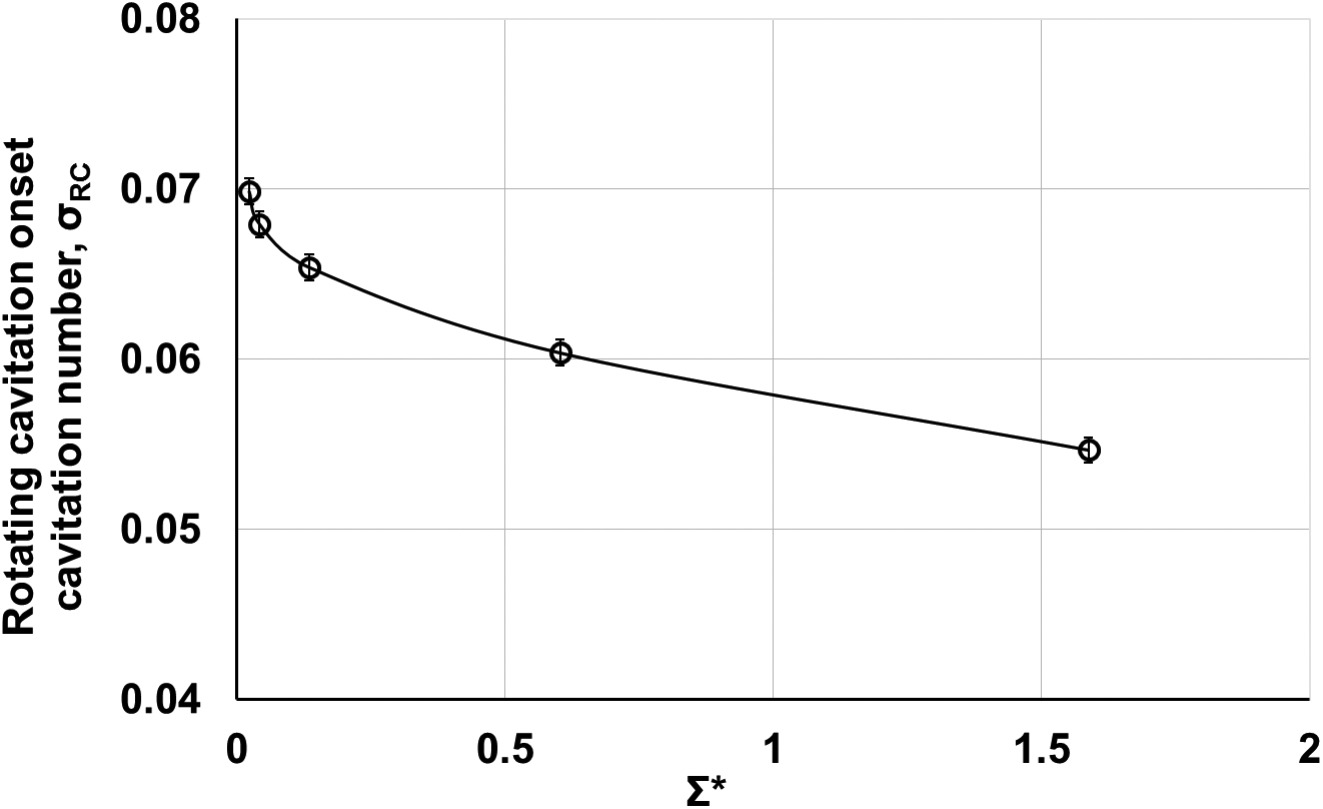
Figure 6.
The power spectral density of unsteady pressure fluctuation at various non-dimensional thermal parameter at Re = 4.15 × 10⁶ and φ/φ_d = 1.0 for Σ^* = 0.0229 (a), 0.135 (b), 0.603 (c), 1.58 (d).
14 defined the minimum cavitation number, σmin, which determines the cavitation bubble growth by considering the thermal effect () as
where pv,min is the minimum vapor pressure within the cavitation bubble. The minimum cavitation number is the s\
um of the cavitation number (σ) and the vapor pressure depression (Δpv) normalized by the dynamic head (
Reynolds number effects for constant non-dimensional thermal parameter
Table 3 lists the test conditions for Re effects. Figure 9 shows the power spectral density plots at Re = 2.30 × 10⁶ (Figure 9) and 3.17 × 10⁶ (Figure 9) for Σ* = 0.0125. Figure 10 shows the corresponding data at Re = 4.81 × 10⁶ (Figure 10) and 6.84 × 10⁶ (Figure 10) for Σ* = 1.26. The arrows indicate σRC. For Σ* = 0.0125, σRC remains constant as Re increases. For Σ* = 1.26, σRC at Re = 6.84 × 10⁶ is higher than that at Re = 4.81 × 10⁶.
Figure 10.
The power spectral density plots of unsteady pressure fluctuations at Σ^* = 1.26 and φ/φ_d = 1.0 for Re = 4.81 × 10⁶ (a) and Re = 6.84 × 10⁶ (b).
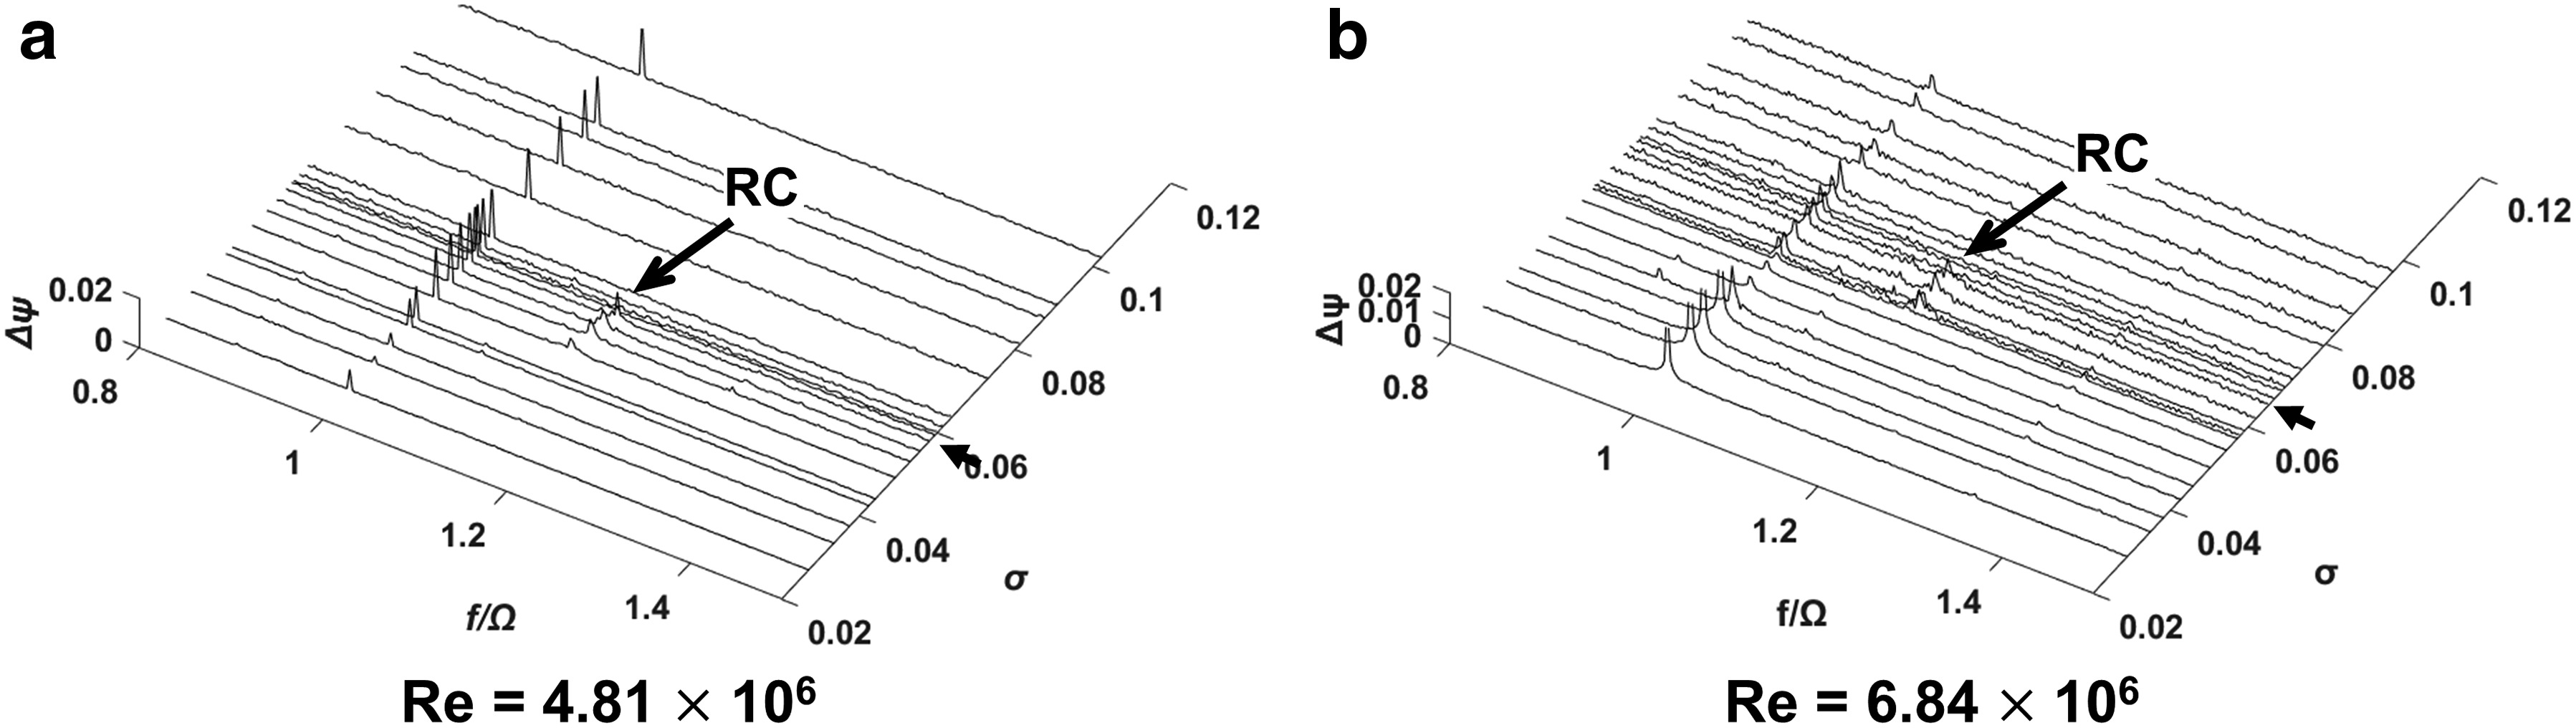
Figure 9.
The power spectral density plots of unsteady pressure fluctuations at Σ^* = 0.0125 and φ/φ_d = 1.0 for Re = 2.30 × 10⁶ (a) and Re = 3.17 × 10⁶ (b).
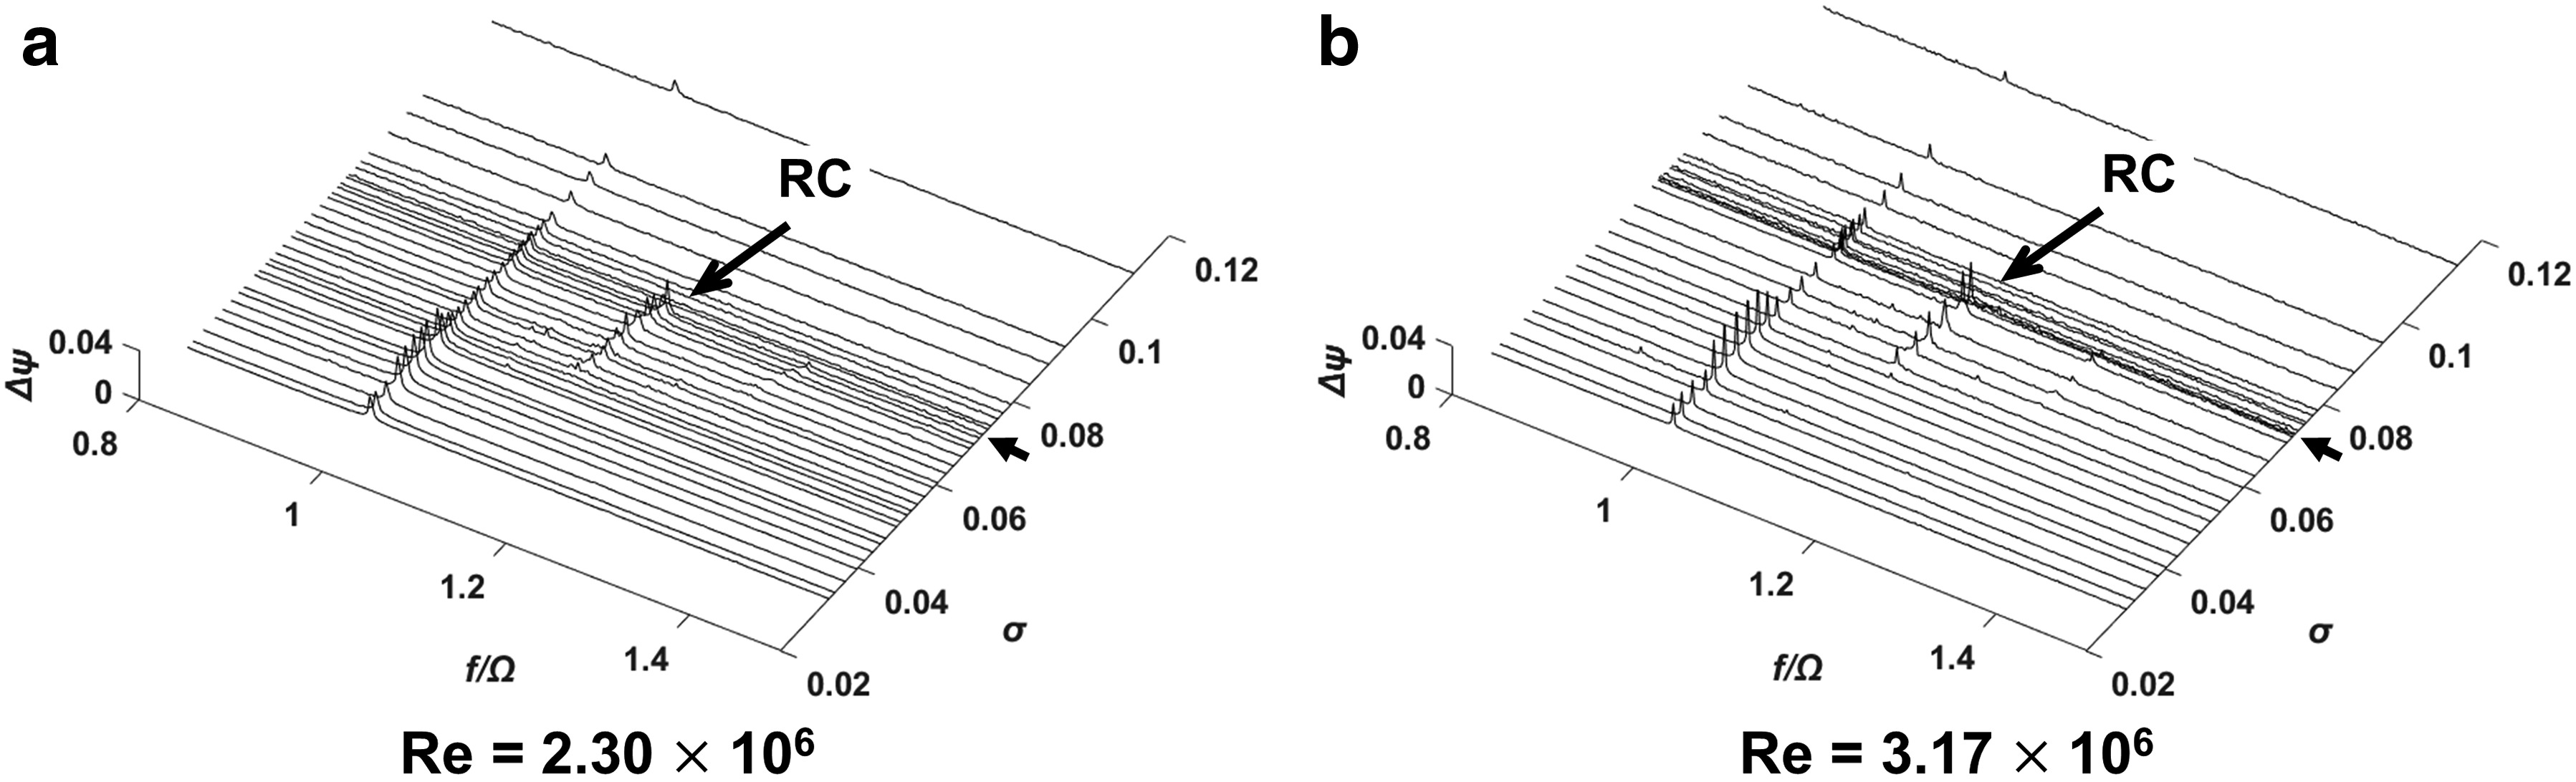
Table 3.
Test conditions for Reynolds number effects.
The dependence of σRC on Re for various values of Σ* is presented in Figure 11. For Σ* = 0.0125, σRC is independent of Re. On the other hand, for Σ* ≥ 0.0537, σRC increases with increasing Re, and such Re effects (e.g.,
Figure 12.
The inducer blade cavitation for Re = 2.30 × 10⁶ (a) and 3.17 × 10⁶ (b) (σ = 0.081, φ/φ_d = 1.0, Σ^* = 0.0125).

Figure 11.
The rotating cavitation onset cavitation number and the critical cavitation number for varying Reynolds numbers and Σ^* at φ/φ_d = 1.0.

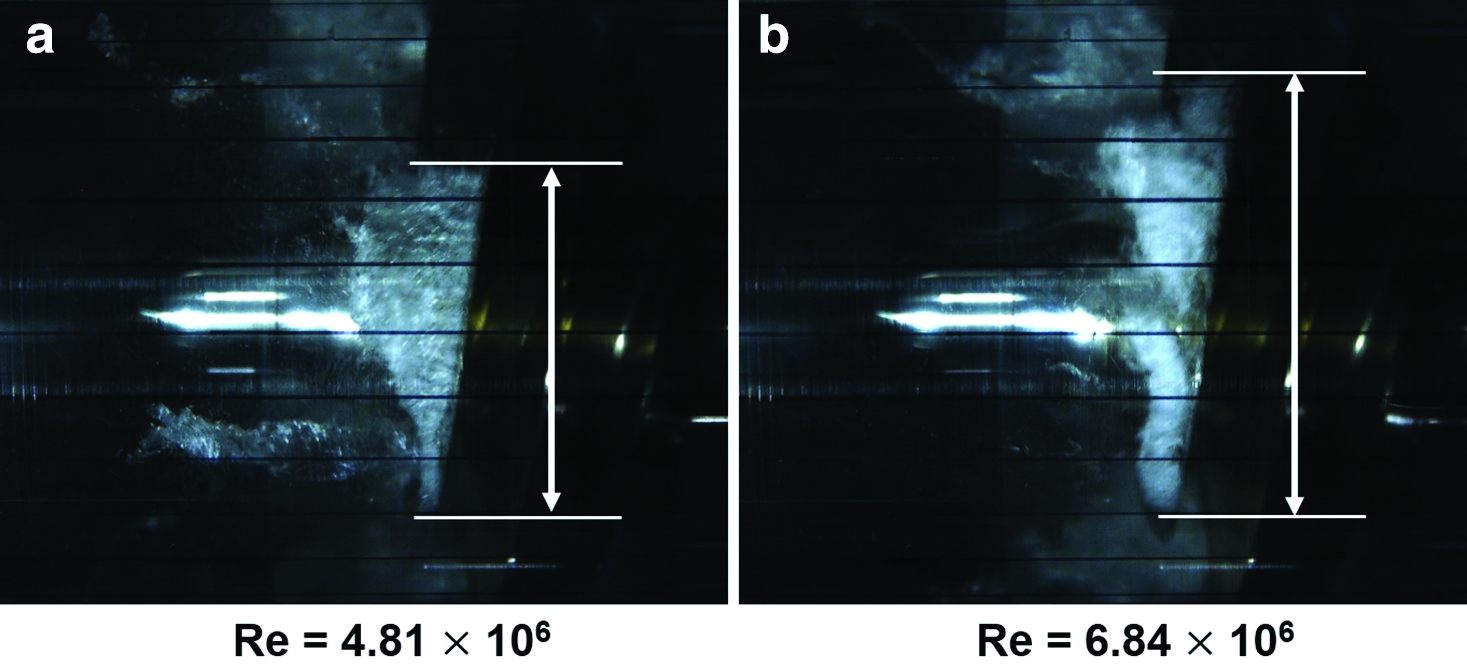
Figure 13 shows the cavitation region on an inducer blade for Σ* = 1.23 at Re = 4.81 × 10⁶ (Figure 13) and 6.84 × 10⁶ (Figure 13). For Σ* = 1.23, the length of the inducer blade cavitation region at Re = 6.84 × 10⁶ is visibly longer than that at Re = 4.81 × 10⁶. Thus, the rotating cavitation onset depends on Re at Σ* = 1.23. 15 performed a numerical analysis of the Re effects on cavitation growth for a hydrofoil. They found that the cavitation region is bigger at a higher Re in liquid oxygen in which the thermal effect is significant. For high Σ* values, where the thermal effect is significant, as Re increases, the dynamic head (
Figure 13.
The inducer blade cavitation for Re = 4.81 × 10⁶ (a) and 6.84 × 10⁶ (b) (σ = 0.089, φ/φ_d = 1.0, Σ^* = 1.23).
Based on the current results, Figure 1 from 12 can be explained as follows. Figure 14 shows the combined plots of Figure 1 and Figure 7. In 12, experiments had been performed by varying Σ* while maintaining a constant rotational speed of 5,000 rpm. Thus, Re increased from 2.6 × 10⁶ to 6.4 × 10⁶ simultaneously as Σ* was increased from 0.0116 to 1.80. In Figure 14, σRC becomes independent of Σ* for Σ* > 0.54 at N = 5,000 rpm. On the other hand, σRC continues to decrease for Σ* > 0.54 at Re = 4.15 × 10⁶. In the N = 5,000 rpm study 12, the cavitation suppression effects due to the increase in Σ* and the cavitation promotion effects due to the increase in Re occurred simultaneously. For Σ* < 0.54, the Re effects were weaker, and, thus, σRC was decreased as Σ* increased. However, as Σ* increased further, the Re effects became stronger, essentially cancelling out the Σ* effects. Thus, σRC became “seemingly” independent of Σ* for 0.54 < Σ* < 1.80 for N = 5,000 rpm. However, when Re is kept constant at 4.15 × 10⁶ in the current study, σRC is decreased as Σ* increases.
Figure 14.
The rotating cavitation onset cavitation number versus the non-dimensional thermal parameter for constant Reynolds number and rotational speed 12 at φ/φ_d = 1.0.
Conclusions
The individual effects of non-dimensional thermal parameter (Σ*) and Reynolds number (Re) on rotating cavitation onset for a turbopump inducer have been measured in water. The new conclusions from this study are:
1. Increasing the non-dimensional thermal parameter (Σ*) at a constant Reynolds number (Re) inhibits rotating cavitation onset.
2. Rotating cavitation onset cavitation number (σRC) increases as the Reynolds number (Re) is increased for Σ* higher than 0.0537. For Σ* lower than 0.0125, the rotating cavitation onset is independent of the Reynolds number (Re).
3. Consideration of non-dimensional thermal parameter (Σ*) alone is insufficient to explain cavitation instability onset. In addition, Reynolds number (Re) has to be considered.
Nomenclature
A
inducer inlet area
c
tip clearance
Cpl
liquid heat capacity
C
characteristic length of inducer
D
inducer diameter
DB
rΩ3/2/Σ
f
frequency (Hz)
L
latent heat of the liquid
N
rotational speed (rpm)
pG0
partial pressure of the non-condensable gas in the bubble
pv
vapor pressure
pv,min
minimum vapor pressure
Δpv
vapor pressure depression
Q
flow rate
r
inducer inlet radius
R
bubble radius
non-dimensional bubble radius
Re
Reynolds number = 2ρ1rΩ2/μ1
S
surface tension
t
time
Tα
liquid temperature
U
tip rotational speed
x
distance
ρ1
liquid density
ρv
vapor density
μ1
liquid viscosity
α1
thermal diffusivity of liquid
σ
cavitation number, =
β
blade tip angle
σRC
rotating cavitation onset cavitation number
Φ
flow coefficient, = Q/ArΩ
Σ
dimensional thermal parameter
Σ*
non-dimensional thermodynamic parameter
ψ
head coefficient, =
ψ0
head coefficient without cavitation
Δψ
unsteady pressure fluctuation coefficient (peak to peak)
Ω
inducer rotational speed, rotational frequency (Hz)
Appendices
Appendix A.
Appendix. Heat transfer analysis of the duct
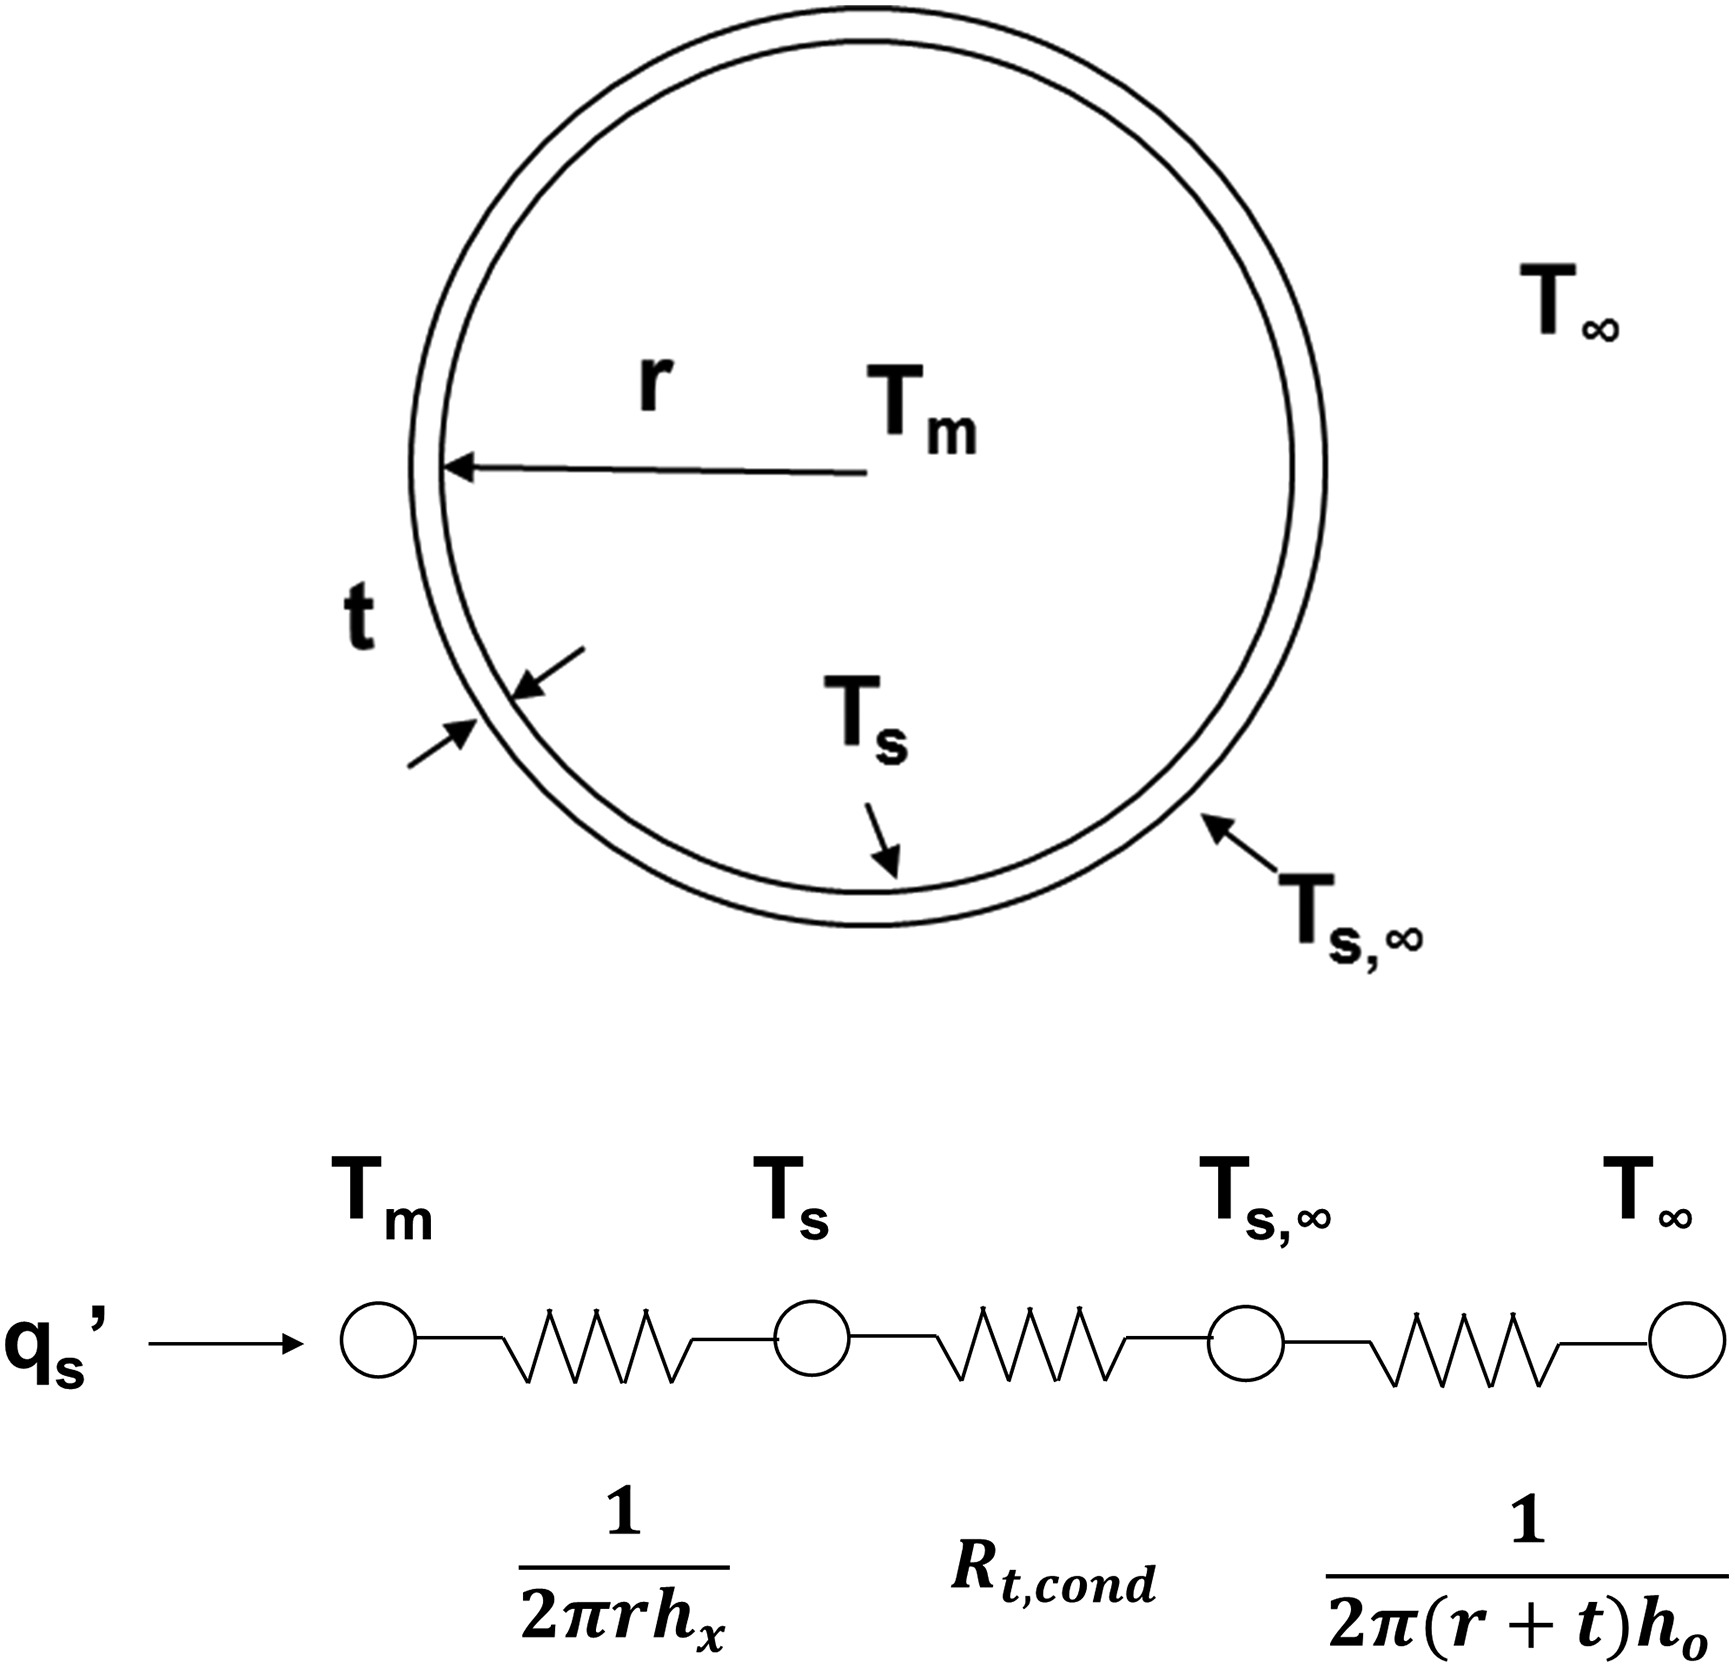
Following 01, an expression for the heat flux at the inducer inlet can be inferred from the resistance network as shown in Figure 15 (hx is the convection heat transfer coefficient between the water flow and the inner surface of the wall; Rt,cond is thermal resistance of cylindrical wall, ho is natural convection heat transfer coefficient between the duct outer surface and the ambient air, 10 W/m2·K). The following assumptions have been made.
1. The flow is steady with constant properties.
2. Viscous dissipation and pressure variations are negligible.
3. Convection coefficient at outer surface of the duct is uniform.
The heat transfer rate for the duct is expressed as
With such assumptions and heat transfer equations, the temperature difference between the bulk flow and flow near the wall ranges from 0.042 K (308 K, 6,400 rpm) to 0.091 K (353 K, 5,400 rpm).