Introduction

Efforts to make aviation environmentally more sustainable mostly focus on fuel burn reduction during flight. While the main engines cause the majority of ground-based emissions, extended operating times of auxiliary power units (APUs) combined with their poor thermal efficiency of around 18% (Stohlgren, 1983; Stohlgren and Werner, 1986) contribute a non-negligible share to overall pollution. The purpose of APUs is to provide secondary power in the form of compressed air to the environmental control system (ECS) or to the main engine starter, and electrical power to other auxiliary systems. Normally, APUs are operated only on the ground. However, in emergency situations, they can also provide a limited amount of power during flight. The availability of ground power often determines whether the APU has to be used for extended times, and some airports impose restrictions on their use. Such restrictions, for example, dictate maximum APU running times in case both electrical power and compressed air can be provided at the parking stand. According to the database of the Boeing Company (2022), 137 out of 651 airports enforce regulations on the use of APUs.

To better quantify the impact of APU-induced emissions, Padhra (2018) conducted a field study tracking the APU usage of 200 Airbus A320 aircraft in service in Europe on short-range routes between 125 airports. Data related to more than 25,000 turnarounds were obtained from the flight data recorders of these aircraft. The analysis of these data specifically addressed APU-induced emissions during aircraft turnaround operations while in the parking position. The study concludes that the use of electric grid power can lead to ground emission reductions of about 50%. Furthermore, time stamps of APU usage after arrival at the stand and before departing from the stand show that only in 6% of the cases the time restrictions imposed by airport regulations are complied with. It is highlighted that especially unforeseen delays in leaving the parking position cause unnecessarily long APU running times.

APU-related emissions can be lowered by increasing the availability of ground power at airports and by improving APU thermal efficiency. The thermal efficiency of gas turbines can be enhanced by increasing the overall pressure ratio (OPR) and turbine inlet temperature (TIT) and/or by further optimizing turbomachinery aerodynamics. However, some of these improvements are difficult to achieve if the power capacity is low. Small-scale effects penalize turbomachinery efficiencies and make turbine blade cooling unfeasible, which, in turn, limits the maximum TIT (Bentele and Laborde, 1972). One way of circumventing these inherent limitations on the thermal efficiency of small gas turbine engines may be the addition of an organic Rankine cycle (ORC) system to convert the thermal energy of the gas turbine exhaust into additional power. However, the knowledge base on the design of such systems and their impact on aircraft emissions is still very limited and inconclusive regarding the concept of waste heat recovery (WHR) onboard of aircraft.

Perullo et al. (2013) were the first to investigate the feasibility of the integration of an ORC WHR system with a CFM56 turbofan engine. They considered a retrofit scenario by adopting an air-cooled subcritical recuperated ORC configuration using R245fa as the working fluid. In their design, the condenser is integrated into the engine air intake lip, while the evaporator is integrated into the walls of the engine core nozzle. The ORC pump and turbogenerator are integrated into the nacelle and engine pylon, respectively. It is envisaged that the ORC turbine is used to power the electrically driven air compressor of the ECS, which requires 200kW of electrical power. Component sizing is not included in the study, while, solely based on the thermodynamic cycle calculations for the engine design point and assuming a mass of the WHR system of 430kg per engine, results lead to estimating that fuel savings of 0.9% are possible for a typical short-range flight.

Zarati et al. (2017) investigated the integration of an ORC WHR system with a 2 MW-class turboprop powering a regional aircraft. A retrofit scenario is studied. An air-cooled subcritical non-recuperated ORC WHR unit using R245fa as the working fluid is modeled and simulated, including the sizing of both plate-fin heat exchangers. The evaporator is located in the exhaust duct of the engine, and the condenser is housed in a separate ram-air duct. The possibility of reducing ram-air duct drag by exploiting the Meredith effect is also considered. It is concluded that the thermal energy transferred from the condensing working fluid to the air generates sufficient thrust to overcome the drag caused by the air intake, duct, and heat exchanger core. On and off-design simulations are carried out, and the system is optimized to provide maximum heat recovery during cruise. No details regarding the optimization procedure are given. Furthermore, it is determined that transferring the ORC turbine power directly to the low-pressure shaft of the engine yields the largest fuel savings. The envisaged combined-cycle engine results in a reduction of mission fuel mass of 1.7% for a 300 NM trip in comparison with the benchmark engine. The exhaust gas temperature of the engine is 750 K, and the ORC turbogenerator provides 100 kW of shaft power. The designed WHR unit has a mass-specific power of 0.33kW/kg. Additionally, based on the assumption of an ORC turbine mass-specific power of 0.5kW/kg, the ORC turbine is identified as the major contribution to ORC system mass (70%) followed by the condenser (20%).

Hughes and Olsen (2022) analyzed the addition of an ORC WHR unit to the internal combustion engine (ICE) of a parallel-hybrid electric drive train for a small general-aviation aircraft. The performance of a fuel-cooled subcritical non-recuperated ORC system is investigated by assuming five different hydrofluroolefins as the working fluid. In contrast to the studies of Perullo et al. (2013) and Zarati et al. (2017), the prime mover is downsized so that the combined-cycle hybrid drive train fulfills the specified power requirement. Three different aircraft with a power requirement of the combined-cycle engine ranging from 100300kW are investigated. Component sizing is not performed, and the impact of added system weight is investigated using a parametric study. Only the on-design performance of the system is analyzed. For three investigated aircraft types, an ORC mass-specific power above 0.8kW/kg leads to a fuel burn reduction of around 13%.

Similar work on the integration of a supercritical CO2 WHR system with turbofan engines of long-range aircraft was performed by De Servi et al. (2017) and Jacob et al. (2017). The large power of the engine, the possible advantage of a very dense working fluid on built volume, and the favorable thermodynamics of a supercritical cycle configuration in the case of WHR are the foundation of the choice of CO2 as the working fluid. Both studies consider recuperated thermodynamic cycles of the WHR system with the heater located right after the low-pressure turbine in the core duct and the cooler in the bypass duct of the turbofan engine. Heat exchanger sizing is also carried out. De Servi et al. (2017) and Jacob et al. (2017) identified suitable WHR system designs by means of parametric studies. Both designs result in a WHR system turbine power output of around 1,000kW. Downsizing of the gas turbines is not considered. The turbofan engines considered by Jacob et al. (2017) and De Servi et al. (2017) have an exhaust gas temperature of 615K and 780K, respectively. The latter value is considerably higher due to the lower assumed technology level and, therefore, a lower thermodynamic efficiency of the turbofan engine. Despite the similar configurations between the two studies, i.e., a high bypass ratio turbofan engine, an air-cooled recuperated WHR system architecture, CO2 as the working fluid, and the same condenser and evaporator placement, the estimation of the component weights is largely different. Therefore, the results regarding fuel mass-saving potential are opposing. Jacob et al. (2017) report a fuel mass reduction of 1.9%, and De Servi et al. (2017) report that the efficiency increase of the combined-cycle engine is insufficient to counter the added system weight.

The results presented in the reviewed literature on ORC WHR systems onboard aircraft suggest that there may be a beneficial effect in terms of fuel consumption reduction. However, the work conducted on this topic does differ in the level of modeling fidelity and considers component sizing and aspects such as airframe integration to a very limited extent. Taking system size and integration into account is of paramount importance if the goal is assessing the feasibility of the concept on aircraft fuel consumption. Furthermore, a detailed analysis of optimal ORC system design variables, especially in combination with the selection of an optimal organic working fluid, is missing from the literature.

In order to provide more detailed information about the feasibility of combined-cycle engines onboard aircraft, a multidisciplinary simulation framework is developed and documented here. This framework, named ARENA (airborne thermal energy harvesting for aircraft), is implemented in Python and includes modules for gas turbine and ORC system performance simulation as well as for the concurrent preliminary design of the ORC turbine and heat exchangers (HEX). The system mass is estimated based on component sizing and empirical correlations. The impact of system mass on fuel consumption for a given flight mission is estimated using the Breguet range equation. An optimizer is used to identify combined-cycle design variables that result in minimum mission fuel mass. As a first demonstrative case, the ARENA framework is used to investigate the possible benefit of employing an ORC WHR unit to recover thermal energy from the APU's exhaust gas of an Airbus A320neo, which is used to provide secondary power on ground only. The overall fuel mass for a 600NM mission is calculated and compared with that of the aircraft employing the conventional APU, namely the Garrett GTCP36-300 APU (Stohlgren and Werner, 1986).

The paper is structured as follows. In Section METHODOLOGY, the methodology to design the CC-APU is presented. Based on this methodology an optimization problem is formulated whereby the objective is the minimization of mission fuel mass. In Section RESULTS, this method is applied to the design of an optimized CC-APU, and the change in fuel consumption with respect to a nominal APU is computed together with other figures of merit. Conclusions are drawn in Section CONCLUSIONS, and recommendations for further research are presented.

Methodology

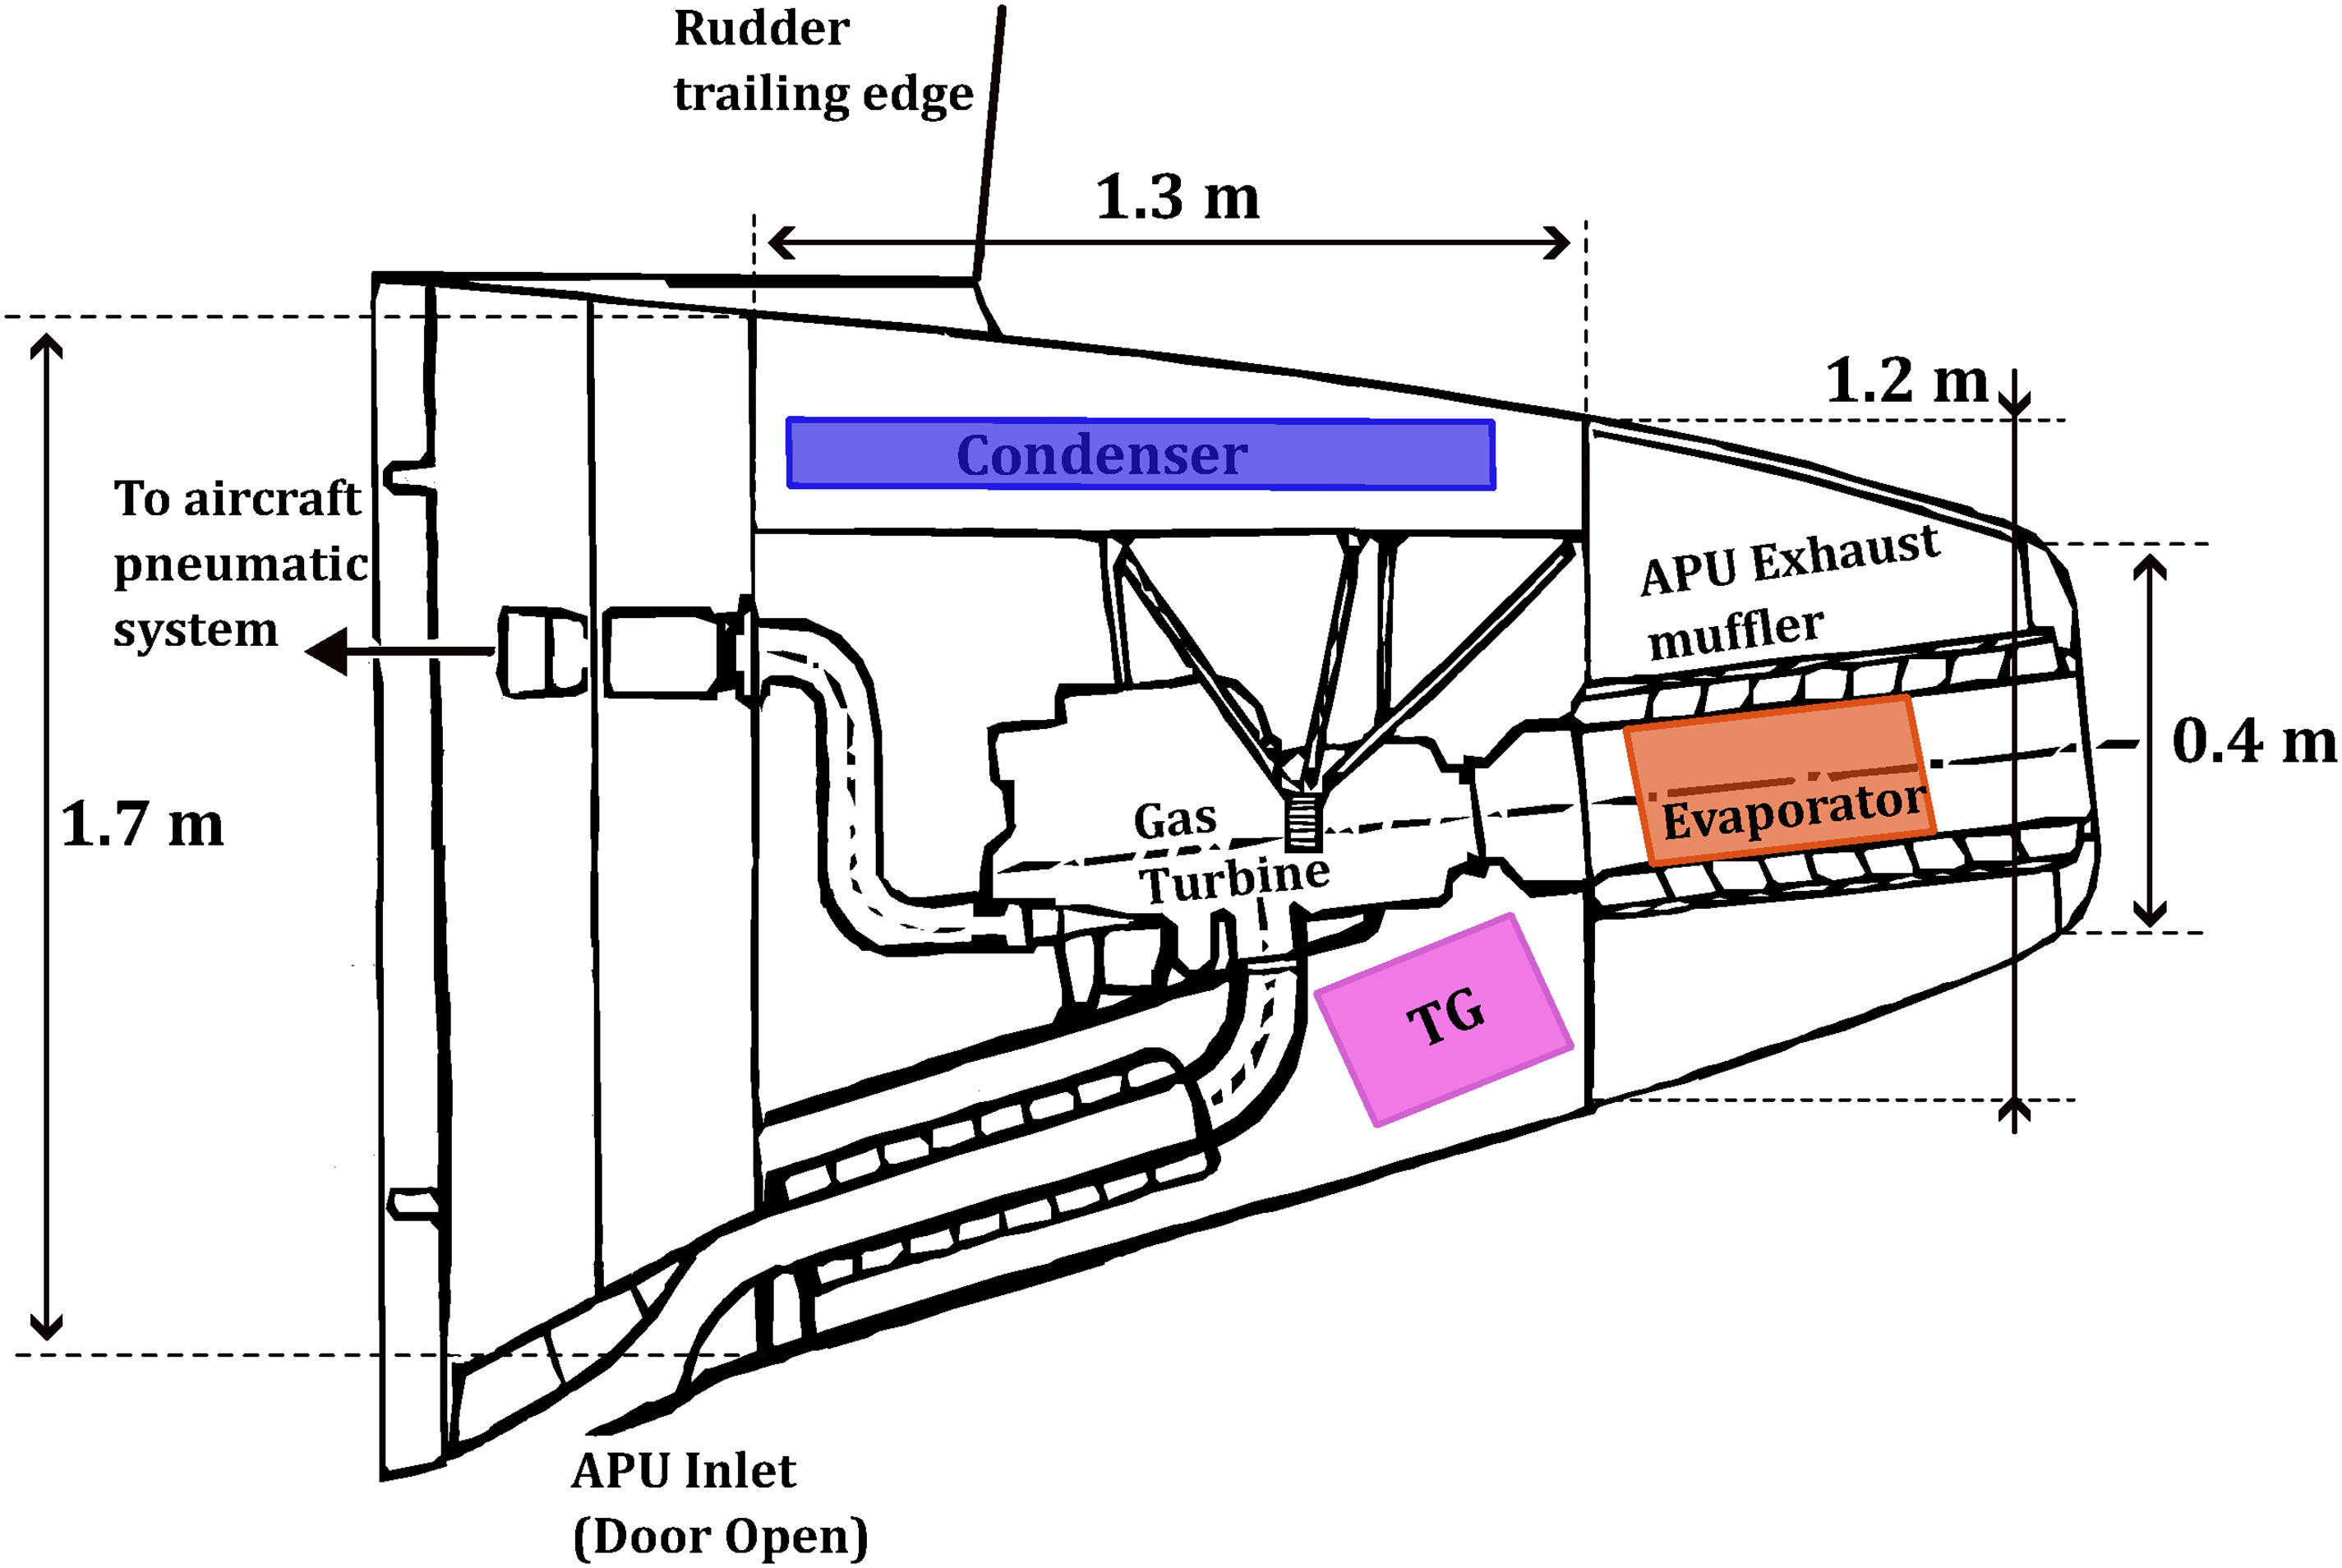
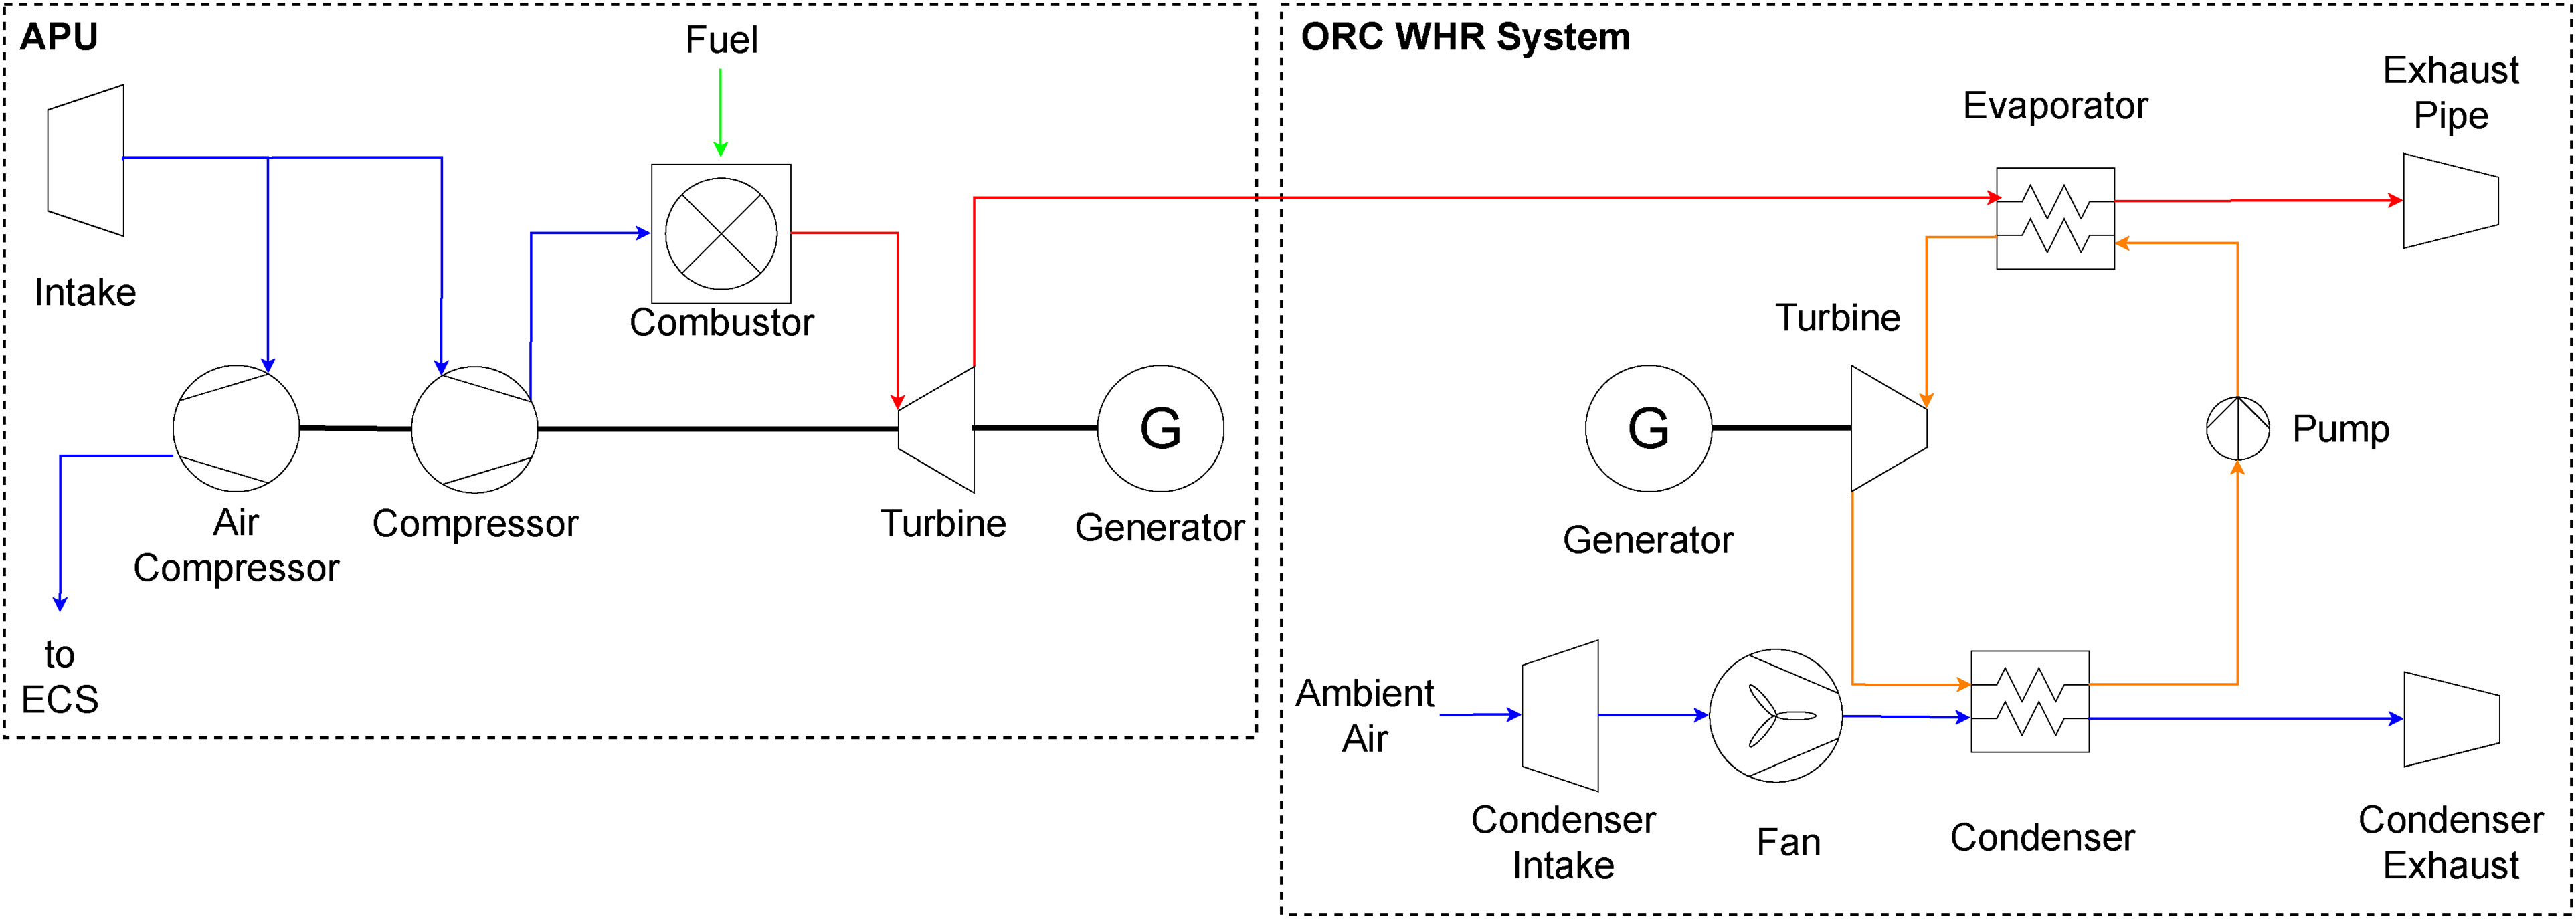
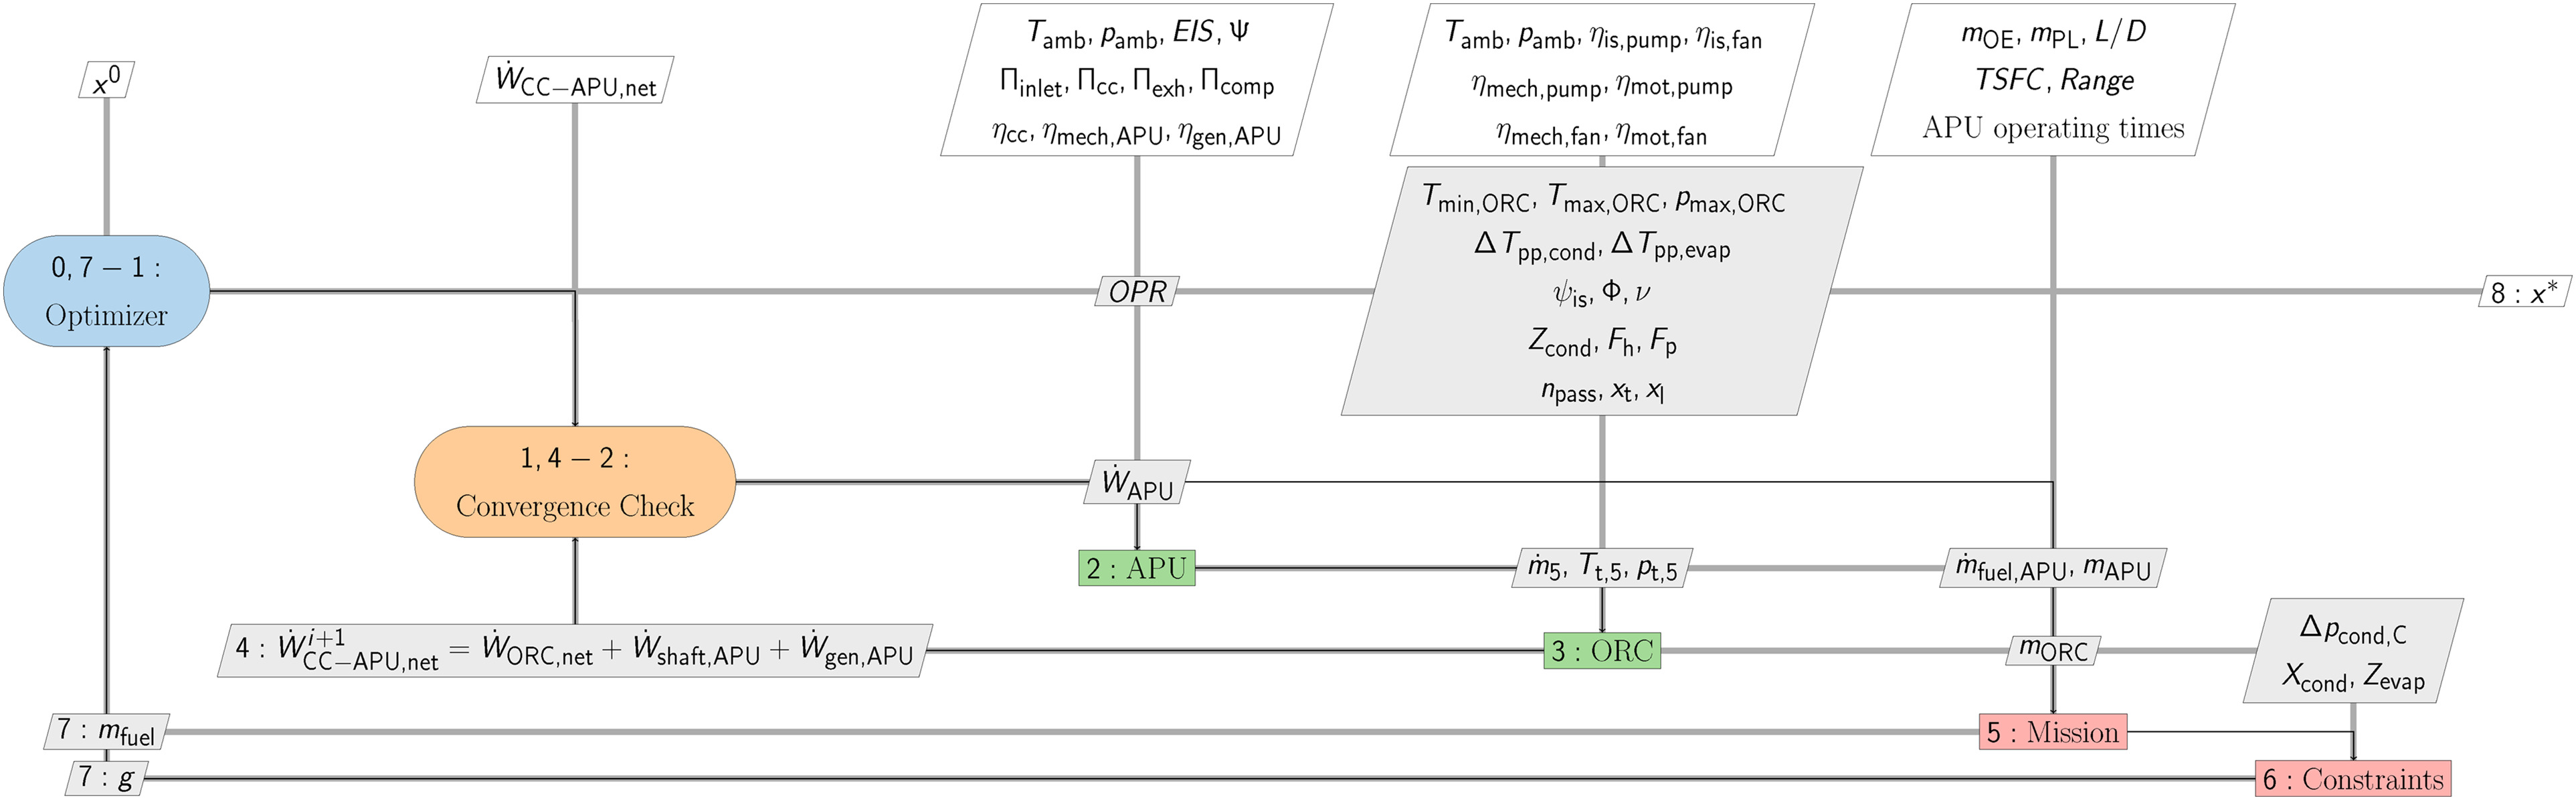
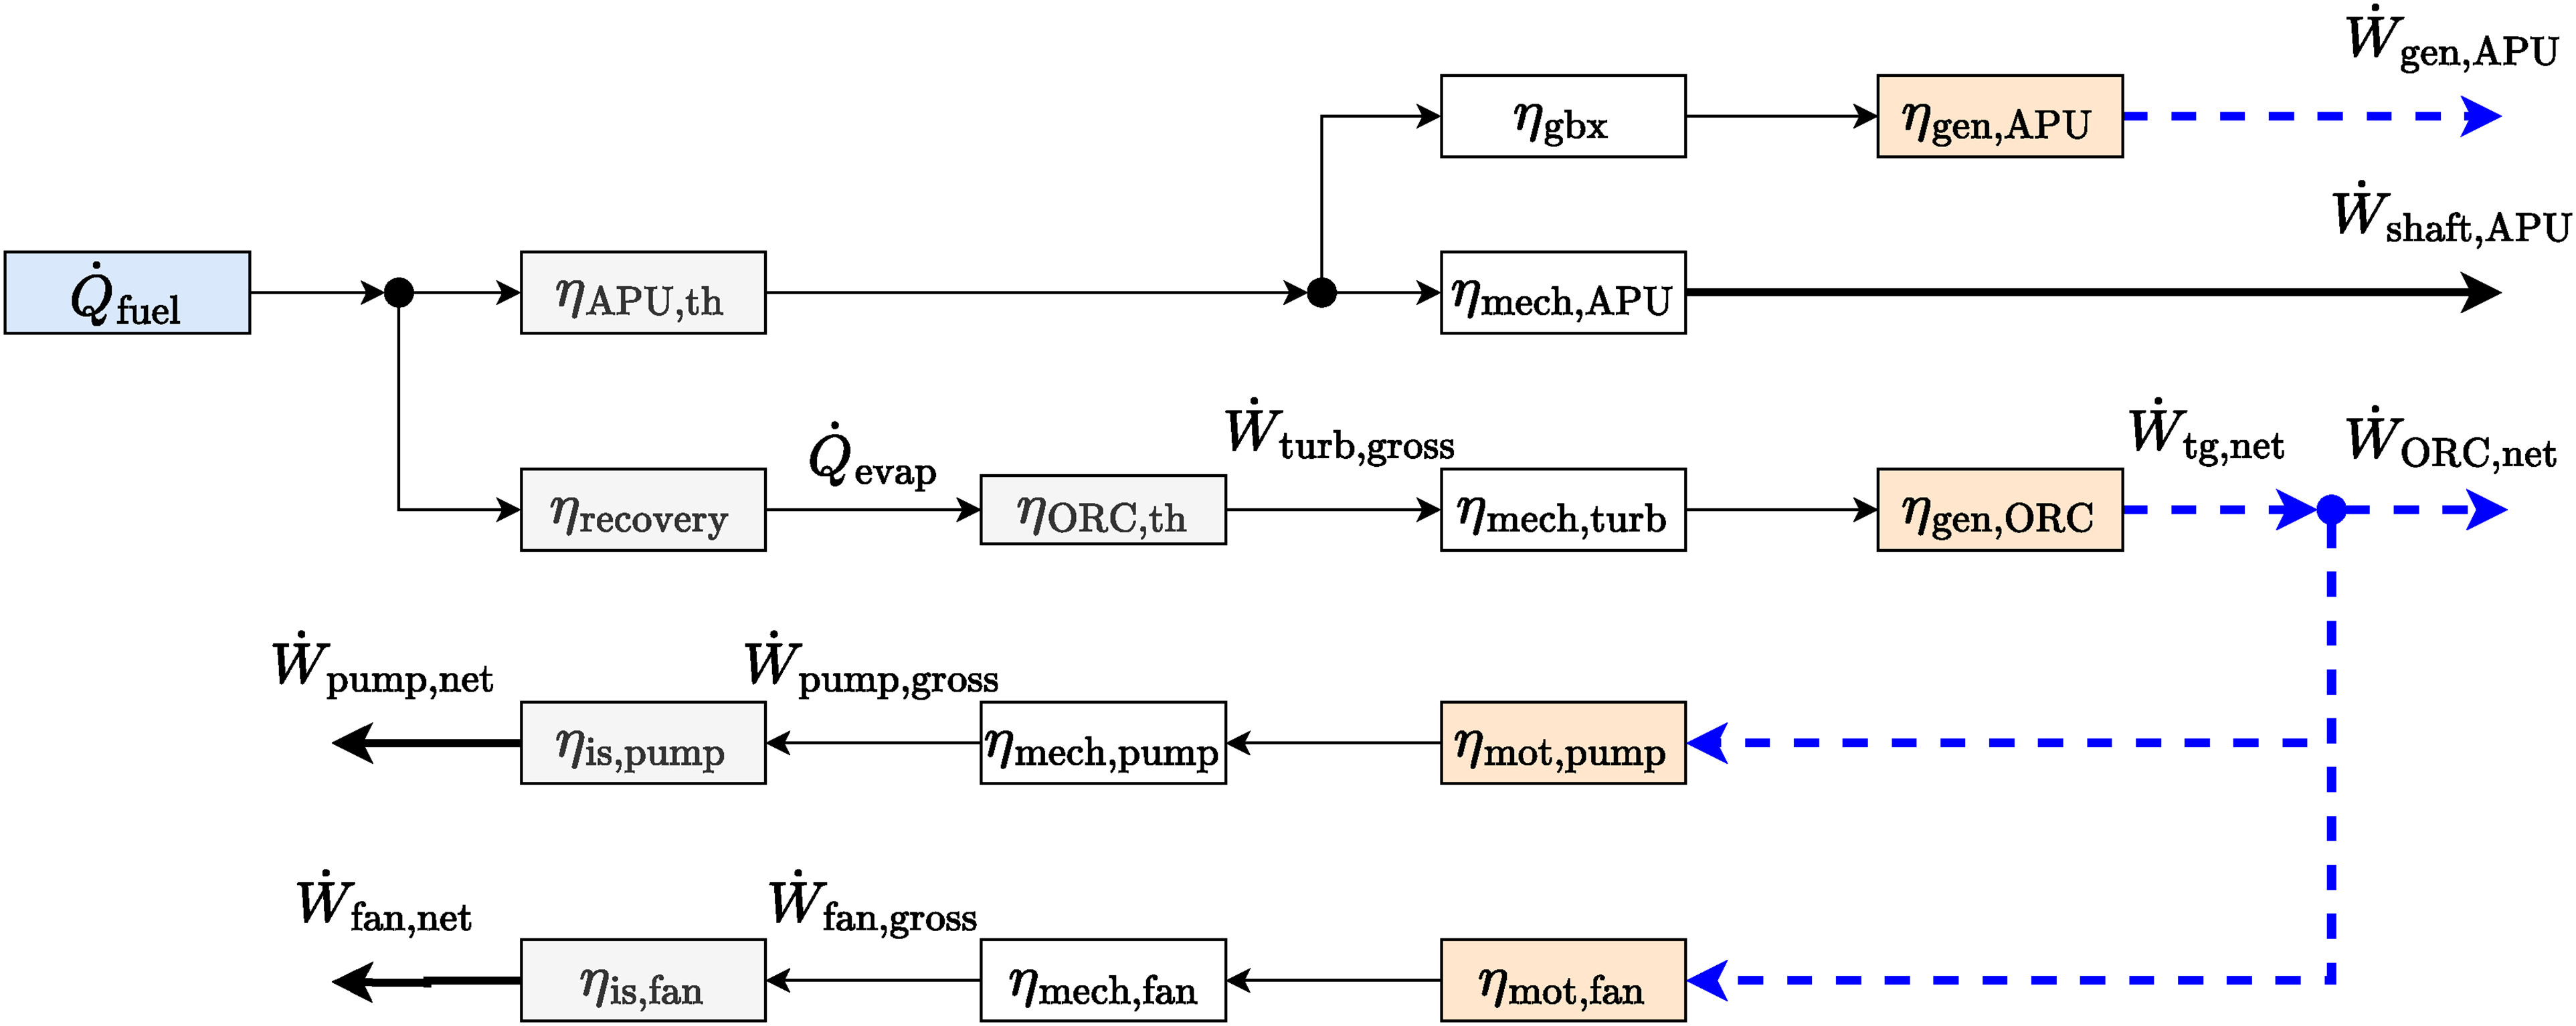
Given the typical operational pattern of APUs, the ARENA framework is used to assess the performance of the system at one operating condition, namely ground operation. The ARENA framework consists of four main modules implementing models to determine (i) the APU on-design performance, (ii) the ORC system on-design performance, (iii) the preliminary design of the ORC turbogenerator and its performance, and (iv) the preliminary design of the heat exchangers (HEX). Figure 1 provides a sketch of the aft of the aircraft housing the APU, indicating major dimensions, and a possible placement of the ORC components. Figures 2 and 3 show the process flow diagram (PFD) and the extended design structure matrix (XDSM) of the CC-APU system model. The XDSM diagram indicates dependencies between the computational components with the thick gray lines, while the thin black lines show the computational flow. The grey boxes represent the interfaces between the various components and report the data that is exchanged. The white boxes at the top row of the diagram indicate, instead, the required user input data.

Figure 1.

Sketch of the APU compartment based on Ref. (Stohlgren and Werner, 1986). The compartment dimensions are as reported in Ref. (Airbus, 2020). The shaded boxes, which are not to scale, indicate possible locations of the condenser, evaporator, and ORC turbogenerator (TG).

https://journal.gpps.global/f/fulltexts/204721/JGPPS-00236-2024-02.01_min.jpg
Figure 2.

Process flow diagram of the CC-APU system configuration.

https://journal.gpps.global/f/fulltexts/204721/JGPPS-00236-2024-02.02_min.jpg
Figure 3.

Extended design structure matrix of the CC-APU system model.

https://journal.gpps.global/f/fulltexts/204721/JGPPS-00236-2024-02.03_min.jpg

Optimization problem

Numerical optimization is used to determine the CC-APU design that minimizes the mission fuel mass (mfuel). Therefore, the constrained single-objective optimization problem that is solved can be written as

(1)
minimizeF(x)=mfuel(x),subjecttoΔpcond,C600Pa,Xcond1.0m,Zevap0.8m,xiLxixiU.

This optimization problem comprises three constraints. The pressure drop between the inlet and the outlet of the cold side of the condenser (Δpcond,C) is constrained to a realistic value, which is set according to common practice. Similarly, the width of the condenser core (Xcond) and the depth of the evaporator core (Zevap) are also constrained to maximum values, which would allow them to fit within the available space. It is assumed that all heat exchangers are placed within the tail cone of the aircraft, which also houses the APU. The values of the maximum dimensions of the heat exchangers are determined by estimating lengths using the drawings of the APU compartment provided by Stohlgren and Werner (1986) and by Airbus (2020) (see Figure 1). The design vector (x) is composed of 15 variables characterizing either the thermodynamic cycle or the components of the CC-APU system, namely the gas turbine, the ORC unit, the ORC turbogenerator, and the heat exchangers. Table 1 lists the design variables (xi) together with their lower bounds (xiL) and upper bounds (xiU). The optimization problem is solved using a genetic algorithm implemented in the Python library pymoo (Blank and Deb, 2020). A population size of ten times the number of design variables is adopted. The convergence criterion is as follows: the relative change between the last and the 5th-to-last generation should be lower than 10−6.

Table 1.

CC-APU: design variables and their bounds.

ModelVariables (xi)Description (Unit)Bounds (xiL/xiU)
APUOPROverall pressure ratio (−)4/10
ORCTmin,ORCMinimum cycle temperature (K)323/423
Tmax,ORCMaximum cycle temperature (K)1.01Tcrit/1.07Tcrit
pmax,ORCMaximum cycle pressure (Pa)1.05pcrit/1.50pcrit
ΔTpp,condCondenser pinch point temperature difference (K)10/50
ΔTpp,evapEvaporator pinch point temperature difference (K)10/50
ORC TurbogeneratorψisIsentropic stage loading (−)0.4/1.3
ϕFlow coefficient (−)0.10/0.40
νHub-to-tip ratio (−)0.40/0.65
ORC HEXZcondCondenser core depth (mm)30/70
FhCondenser fin height (mm)7.0/12.0
FpCondenser fin pitch (mm)1.0/2.0
xtEvaporator non-dimensional transversal pitch (−)1.25/3.00
xlEvaporator non-dimensional longitudinal pitch (−)1.25/3.0
npassEvaporator number of passes (−)8/20

Aircraft and mission settings

The Airbus A320neo has an operating empty mass (mOE) of 43,520kg, a lift-to-drag ratio (L/D) of 17.9, estimated using a method proposed by Torenbeek (1987), and a thrust-specific fuel consumption (TSFC) at cruise of 14.4mg/Ns. The TSFC is calculated for the CFM LEAP-1A engine based on information reported by the Jane’s Information Group (2022). The mOE of the aircraft equipped with the CC-APU is computed considering that the operating empty mass of the reference aircraft includes the dry mass of the conventional APU amounting to 117kg (Stohlgren and Werner, 1986). The analyzed mission is over a range of 600NM, which corresponds to the average distance flown in Europe in the year 2022 (Eurocontrol, 2024), at a cruise Mach number of 0.78 and a payload mass (mPL) of 19,280kg. The mission is split up into a ground phase (parking, taxing) and a flight phase (take-off, climb, cruise, descend, landing). The fuel consumption of the flight phase is estimated using the Breguet range equation for a cruise at constant altitude and Mach number (Torenbeek, 1987). The TSFC at cruise conditions and the fuel fractions for the non-fuel intensive flight phases (take-off, climb, descend, and landing) used for the computation are those reported by Roskam (1997). The product of the fuel fractions is 0.96. The fuel consumption of the ground phase is calculated by multiplying the fuel flow rate of the APU and of the main engine with the corresponding operating times for short-range routes as listed in Table 2. Single-engine taxiing is assumed, with an engine fuel flow rate of 5.8kg/min (Airbus, 2004). During single-engine taxiing, only one main engine is used to provide thrust for taxiing, while the APU provides secondary power. A report of Airbus (2004) highlights the economic benefits of this procedure with respect to fuel burn and maintenance cost if compared to using both the main engines. The summation of the fuel consumption of the ground phase and the flight phase gives the overall mission fuel mass (mfuel).

Table 2.

Average APU operating times based on (1) APU operation after arrival and before departure at parking position, assuming availability of ground power (Padhra, 2018), and (2) average taxi times in the 100 busiest European airports (Eurocontrol, 2019a,b; Eurostat, 2022).

ArrivalDepartureTaxi-inTaxi-outSum
6.1 min17.3 min5.4 min12.0 min40.8 min

Furthermore, it is assumed that the APU covers the full secondary power demand during the ground phase. Based on data provided by Stohlgren and Werner (1986), the secondary power demand under hot-day (ISA + 25) sea-level conditions is approximately 250kW. This includes the power to drive the APU air compressor and the APU generator. In case of the CC-APU, the power demand is supplied by the gas turbine which drives the air compressor (W˙shaft,APU), the electrical generator connected to the gas turbine (W˙gen,APU), and by the electrical generator connected to the ORC turbine (W˙ORC,net). The net power output of the CC-APU (W˙CCAPU,net) is therefore

(2)
W˙CCAPU,net=W˙APU,net+W˙ORC,netwithW˙APU,net=W˙shaft,APU+W˙gen,APU.

The combined-cycle efficiency (ηCCAPU) is thus

(3)
ηCCAPU=W˙CCAPU,netm˙fuel,CCAPULHV,

where m˙fuel,CCAPU is the CC-APU fuel flow rate and LHV the lower heating value of the fuel, which is assumed to be 43MJ/kg.

The performance of the aircraft utilizing the CC-APU system is compared with a reference case where the GTCP36-300 APU (Stohlgren and Werner, 1986) is installed on board the Airbus A320neo. The reference fuel mass (mfuel,ref) obtained for the given mission is 6,815kg and the APU fuel mass for the provision of secondary power on the ground (mfuel,APU) amounts to 78kg. Notice that the Airbus A320neo adopts the Honeywell 131-9 APU (aerospace-technology.com, 2017) and not the GTCP36-300 APU, which often equips the Airbus A320 (Stohlgren and Werner, 1986; Padhra, 2018). However, data presented by Padhra (2018) suggest that the fuel consumption of these gas turbines is similar. As more information is available for the GTCP36-300, this type of gas turbine is considered in this study.

APU model

The APU considered in this work is a single-spool turboshaft engine without a free power turbine. It provides shaft power to a generator and to an air compressor. The PFD of the APU is shown in Figure 2, on the left-hand side. The APU model provides as output the performance of the turboshaft engine at the design point as well as its mass. The thermodynamic cycle calculations are complemented with the computation of a turbine blade cooling model to predict the required cooling air, and with a procedure to estimate the efficiency of the turbomachines, as detailed in the following sections.

Thermodynamic cycle calculation

The thermodynamic properties of the exhaust gas and of the air are modeled using the entropy function as defined by Kurzke and Halliwell (2018, Part D) in combination with polynomials for the specific heat at constant pressure given by Walsh and Fletcher (2004, Ch. 3). The fuel is assumed to be Jet-A. Turbomachinery efficiencies are determined using correlations presented by Samuelsson et al. (2015), which are derived from the method described in (Grieb, 2004, Ch. 5). Based on statistical data, this method provides an estimate of the efficiency of turbomachinery as a function of the entry into service (EIS) date, stage loading, and scale effects based on reduced mass flow rate (m˙red). Furthermore, the method accounts for different turbomachinery types (axial/radial) and distinguishes between the turbomachinery of the low and high-pressure sections of the engine. In general, the efficiency of a combined-cycle engine increases with TIT (Walsh and Fletcher, 2004, Ch. 6). Therefore, the TIT of the CC-APU is set equal to TITmax. The procedure to determine TITmax is presented in Section Maximum Turbine Inlet Temperature. A comparison of the results obtained with the developed gas turbine performance code and with the commercial software GSP (Visser, 2015) shows a maximum discrepancy in the estimated values of air and fuel mass flow rate lower than 0.5%.

Turbine cooling

Due to the small turbine blade size (height <15 mm) resulting from the low power capacity of the turboshaft engine, blade cooling cannot be implemented with the exception of the nozzle guide vanes (NGVs) of the first stage. For the NGVs, convective air cooling is assumed (Ripolles, 2017). The turbine cooling model of Gauntner (1980) is adopted to estimate cooling air demand in the NGVs and turbine efficiency degradation due to cooling. The required coolant mass flow rate of the NGVs is based on the maximum allowable blade bulk metal temperature (T¯b,max). According to Gauntner (1980), T¯b,max of the stator blades can be set to a temperature that is 55K higher than that of the rotor blades.

Maximum turbine inlet temperature

The maximum allowable blade bulk metal temperature (T¯b,max) of the uncooled first stage rotor blades sets a limit to the stator outlet temperature (SOT) and maximum TIT. SOT refers to the absolute gas temperature at the exit of the NGVs. T¯b,max is estimated assuming creep as the dominant failure mechanism of the rotor blades, and it, therefore, depends on material characteristics, blade stress, and desired minimum lifetime for a certain amount of creep strain. For a given material, the relation between these variables can be captured using the Larson-Miller Parameter (LMP). The LMP is a function of blade temperature (Tb) at a given spanwise section of the blade and lifetime (tb,life) in hours for a given amount of creep strain: LMP=Tb[20+log(tb,life)]. Creep strain is determined by the combination of blade stress and temperature. Both vary along the blade span. While the highest stress is experienced at the blade root, the highest blade temperatures are around mid-span. As a result, the location of the highest creep strain is located around a quarter or one-third of the blade span (Sawyer, 1985, Ch. 9). In this work, creep stress is limited to 90% of the creep rupture stress (Sawyer, 1985, Ch. 9), which corresponds to a creep strain of approximately 1% for single-crystal alloys according to Grieb (2004, Ch. 5). First-stage rotor blades experience the highest creep due to high centrifugal stress combined with very high temperatures.

In the following, a procedure to determine T¯b,max for uncooled first stage rotor blades and the resulting SOTmax is presented. SOTmax in combination with the turbine cooling model allows us to determine the value of TITmax. The main assumptions and steps of the procedure are:

  1. The stress acting on the turbine rotor blade is determined. To simplify the blade stress calculation, it is assumed that the blade root represents the most critical section of the blade with respect to creep life, according to Sawyer (1985). Centrifugal blade root stress (σr) for a blade with a linear taper ratio (K ) is calculated according to (Saravanamuttoo et al., 2017, Ch. 8) with

    (4)
    σr=1.75109KρbAN2withK=1+dt3+ν+dt3(1+ν),
    and the mechanical design parameter AN2 is calculated according to (Grieb, 2004, Ch. 5) with
    (5)
    AN2=602Δht,stΨ1π1ν21+ν2.

    Here, ρb is the turbine blade material density, dt is the turbine blade tip-to-hub area ratio, ν is the hub-to-tip ratio of the first stage turbine rotor, Ψ is the turbine stage loading and Δht,st is the total enthalpy drop per stage, which is determined assuming equal work per stage. Gas bending stress is neglected. A safety factor of 1.15 is applied to σr to take account for cyclic loads (i.e., low and high cycle fatigue) (Grieb, 2004, Ch. 5).

  2. The maximum allowable temperature at the blade root
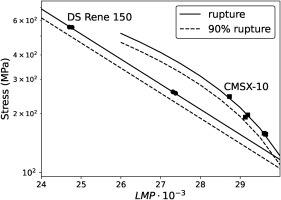
 (Tb,root,max) is determined. Once σr is known, the LMP value can be estimated based on charts derived from experiments for the selected blade material. Figure 4 shows such a chart for the single-crystal alloy CMSX-10 and the directionally solidified (DS) nickel-base alloy Rene 150. In combination with the specified blade lifetime, this results in Tb,root,max from the definition of LMP. In the presented work, a blade lifetime of 15103 hours is applied, which according to Walsh and Fletcher (2004, Ch. 6) equals a typical value for the time between overhaul of civil aircraft engines.

    Figure 4.

    Creep rupture stress and 90% creep rupture stress over LMP for 3rd generation single crystal alloy CMSX-10 and the directionally solidified (DS) nickel-base alloy Rene 150. The markers indicate experimental data points taken from Refs. (DeBoer, 1981; Erickson, 1996). A logarithmic curve fit is applied to the experimental data points of CMSX-10, which compares well with data provided in Ref. (Saravanamuttoo et al., 2017) and an exponential fit to the data of DS Rene 150.

    https://journal.gpps.global/f/fulltexts/204721/JGPPS-00236-2024-02.04_min.jpg
  3. The maximum allowable blade bulk temperature (T¯b,max) is determined. Equation 6 provided by Kurzke and Halliwell (2018, Ch. 4) makes use of the radial temperature distribution factor (RTDF) to relate exhaust gas temperature at the blade root (Tt,rel,root) to the averaged exhaust gas temperature at the rotor inlet plane (T¯t,rel). The subscript “rel” indicates that these temperatures are in the relative reference frame of the rotor blades. T¯t,rel is calculated according to the empirical relation provided by Kurzke and Halliwell (2018, Ch. 4) as

    (6)
    T¯t,rel=Tt,rel,root1RTDF.

    Based on the simplifying assumption of a recovery factor of unity, gas and metal temperatures are equal. Therefore, in Equation 6 T¯t,rel can be substituted with T¯b,max and Tt,rel,root with Tb,root,max. Furthermore, an RTDF of 0.08 (Grieb, 2004, Ch. 5) is applied.

  4. The application of a thermal barrier coating (TBC) to the stator blades allows to increase SOTmax. In this case, a temperature difference across the TBC (ΔTTBC) is added to T¯b,max. Based on data provided by Grieb (2004, Ch. 5) a ΔTTBC of 100K is applied to the stator blades.

  5. The value of T¯t,rel that allows for an uncooled rotor blade is determined. Turbine cooling design is based on a hotspot-temperature (Tt,rel,hotspot). This temperature is defined as

    (7)
    Tt,rel,hotspot=T¯t,rel+RTDF(TITTt,3),
    where the term TITTt,3 indicates the combustor temperature rise. For an uncooled rotor blade and assuming again that gas and metal temperatures are equal, the following relation must hold: Tt,rel,hotspot=T¯b,max. Substituting this relation into Equation 7 and rearranging the equation allows us to identify the value of T¯t,rel that fulfills the requirement of having no rotor blade cooling.

  6. Finally, SOTmax is determined by converting the average temperatures from the relative to the absolute reference frame according to

    (8)
    T¯t,abs=T¯t,rel+ΔTt,abs,st(0.5r1Ψ),
    with a degree of reaction (r) of 0.5 (Grieb, 2004, Ch. 5). In this equation, T¯t,abs and ΔTt,abs,st are the averaged total temperature in the absolute reference frame entering the rotor row and the total temperature change over the turbine stage, respectively. T¯t,abs can be substituted with SOTmax and T¯t,rel results from Equation 7. The following equation gives the final expression to determine SOTmax.
    (9)
    SOTmax=Tb,root,max1RTDFRTDF(TITTt,3)+ΔTt,abs,st(0.5r1Ψ)

    In the case of an uncooled stator, the value of TITmax is directly evaluated by setting it equal to SOTmax. However, in the case of a cooled stator, the procedure above is iterative. First, based on an initial value for TIT and the value obtained for T¯b,max the needed coolant mass fraction is calculated as explained in Section Turbine Cooling. For this purpose, the stator cooling air temperature is taken equal to compressor discharge temperature Tt,3. Second, the value of TITmax is updated based on SOTmax resulting from Equation 9 assuming isentropic mixing of the main exhaust gas stream with stator cooling air. Third, the updated value of TITmax is used to re-evaluate the thermodynamic cycle and SOTmax until convergence of the entire system model is achieved.

The effectiveness of this method in estimating T¯b,max has been verified through a comparison with the computations conducted by Halila et al. (1982) for the turbine of a gas generator test rig. This machine is a two-stage high-pressure turbine characterized by film-cooled rotor blades made of directionally solidified Rene 150 superalloy. The first stage features a Ψ of 1.48 and a ν of 0.88. The value of dt of the rotor blades is not specified, while their life (tb,life) is 250h under hot-day take-off conditions. This data is used as input for steps 1) to 3) of the procedure described above and yields T¯b,max=1,190K for dt=1.0 and T¯b,max=1,200K for dt=0.8. These results are based on a limitation of creep stress to 90% of the rupture stress (see Figure 4) and compare with a T¯b indicated by Halila et al. (1982) of 1,230K for hot-day take-off conditions. The resulting discrepancy is below 4%, which is deemed acceptable for a conceptual design study such as that of the present work.

APU mass

APU mass (mAPU) is estimated, to a first approximation, with an empirical correlation whose sole input is the air mass flow rate at the compressor entry (m˙0). Data available in the database of the Jane’s Information Group (2022) for 12 turboshaft engines in the power range of 300–3,000 kW are used to derive the following relation

(10)
mAPU=21.56m˙0+85

with an R2 value of 0.9. It must be acknowledged that such a correlation based on historical data can only give a rough estimate of the engine mass. This is especially true for combined-cycle applications, where OPR and TIT might vary with respect to conventional turboshaft engine configurations. Furthermore, the turboshaft engines used to produce this correlation do not employ a dedicated air compressor such as APUs usually do. For this reason, air compressor mass is neglected in the presented work. Despite this fact, inserting the mass flow rate of the GTCP36-300 APU (Stohlgren, 1983) into Equation 10 yields a mass that is only 2% off of the actual mass.

APU design assumptions

The APU is sized for hot-day (ISA + 25) sea level static (SLS) conditions. The upper part of Figure 5 depicts the power transmission architecture of the APU, including the provision of shaft power (W˙shaft,APU) to drive the air compressor and electrical power at the exit of the generator (W˙gen,APU). An APU mechanical efficiency (ηmech,APU) and gearbox efficiency (ηgbx) of 99% (Walsh and Fletcher, 2004, Ch. 5) and a generator efficiency (ηgen,APU) of 95% (Schmollgruber et al., 2020) is assumed. APU efficiency based on APU net power output (W˙APU,net) is defined as

Figure 5.

Flow chart of the CC-APU power transmission architecture indicating main components that are incurring losses; black lines indicate mechanical power, dashed lines indicate electrical power.

https://journal.gpps.global/f/fulltexts/204721/JGPPS-00236-2024-02.05_min.jpg
(11)
ηAPU,net=W˙APU,netm˙fuel,APULHV.

In the present work, an axial-radial compressor is employed with a varying number of stages depending on OPR. For an OPR below or equal to 4, a single radial stage is assumed. For OPR above 4, a stage pressure ratio of 3.2 is assumed for the radial component and a stage pressure ratio (Πcomp) of at most 1.5 for each axial stage needed to reach the selected OPR value. The polytropic efficiency of the axial and radial compressors are determined independently based on the method of Grieb (2004, Ch. 5). The turbine is a two-stage axial turbine with a stage loading of Ψ=3.0. The stage loading is defined according to the definition of Grieb (2004) as

(12)
Ψ=2Δht,stUm2,

where Um is the circumferential blade speed at the meridional plane. An EIS of 2035 is assumed for turbomachinery efficiency estimation. The maximum value of OPR is limited by the requirement of a feasible blade height at the exit of the compressor. The upper bound of OPR is determined based on geometrical relations for axial-radial compressors provided by Grieb (2004, Ch. 5), knowledge of the expected air mass flow rate of the gas turbine, and a minimum blade height at the exit of the radial compressor of 5mm, which is similar to the value reported by Ripolles (2017). A relative nozzle pressure ratio of 0.08% is applied, which is defined as:

Πexh=pt,9pambpt,9,

where pt,9 refers to the total pressure at the exit of the exhaust pipe. Note that the value of Πexh is outside the range of typical values applied for turboshaft and turboprop engine design which is 2–10% according to Grieb (2004, Ch. 6). Lowering Πexh results in a larger exhaust pipe diameter and lower exhaust gas velocities for the same mass flow rate. While potentially increasing the cross-sectional area of the engine, this allows a reduction of evaporator hot side pressure loss (Δpevap,H) and, therefore, an improvement of engine performance. An increase of Δpevap,H by 1% results in a reduction of APU efficiency of 0.2%. The single-crystal alloy CMSX-10 (Erickson, 1996) is considered as the turbine blade material. The hub-to-tip ratio (ν) of the first stage turbine rotor is set to 0.825, which represents an averaged value for multi-stage high-pressure turbines (Grieb, 2004, Ch. 5), while the turbine blade tip-to-hub area ratio (dt) is set to 0.8 (Sawyer, 1985, Ch. 9). Values for air intake pressure ratio (Πinlet) of 0.985 and combustor pressure ratio (Πcc) of 0.965 for the GTCP36-300 APU are taken from (Stohlgren and Werner, 1986). Furthermore, a combustion efficiency (ηcc) of 99.5% (Mattingly et al., 2002, Ch. 4) is assumed.

ORC waste heat recovery system model

The simulation of the organic Rankine cycle system is conducted using an in-house tool for on-design point thermodynamic cycle calculations named pycle. This program was verified by comparison with a commercial program for thermodynamic modeling and optimization of energy conversion systems (Van der Stelt et al., 1980). The Helmholtz equation of state implemented in CoolProp (Bell et al., 2014) is used for thermodynamic fluid property modeling of the ORC working fluid, while the ideal gas model (Colonna and van der Stelt, 2019) is used for the APU exhaust gas through the evaporator. For simplicity, a fixed mass-specific composition of the exhaust gases is assumed, containing 74% N2, 15.9% O2, 6.4% CO2, 2.5% H2O, 1.2% Ar. This composition is representative of an engine burning Jet-A/A1 at a fuel-to-air ratio of 0.02. Figure 2, on the right-hand side, shows the PFD of the ORC system, which is of the non-recuperated type. Table 3 gives the ORC thermodynamic cycle specifications and indicates the input derived from other sub-models. The ORC unit is designed for the same environmental conditions as the APU, i.e., SLS ISA + 25. In the present study, the hydrocarbon cyclopentane is considered as the working fluid. Cyclopentane has a critical temperature (Tcrit) of 512K, a critical pressure (pcrit) of 45.1×10⁵Pa and a normal boiling point temperature of 322K (Lemmon et al., 2018). Due to its high thermal stability (Tmax,fluid) of 573K (Astolfi and Macchi, 2016) and high Tcrit, cyclopentane is especially suited for WHR applications of medium power-capacity gas turbines (Krempus et al., 2023). However, it is possible that cyclopentane is not the optimal working fluid for the low power-capacity application studied in this work. Future investigations will focus on the selection of the optimum working fluid for airborne ORC WHR systems. With the upper optimization bound applied to Tmax,ORC (see Table 1), it is ensured that a safety margin is maintained with respect to Tmax,fluid. A supercritical cycle is adopted in this study to maximize thermodynamic efficiency resulting from high Tmax,ORC. No benefits in terms of system weight and HEX performance are expected for subcritical cycles for the following three reasons:

  • Evaporator mass highly depends on tube thickness which in turn is a function of the pressure difference between the cold and hot sides of the tube. The design routine selects a tube thickness close to the minimum value from a manufacturability standpoint for the chosen working fluid, supercritical operating conditions, and HEX materials. Therefore, no significant mass savings are expected for the subcritical cycle.

  • For a subcritical cycle, the majority of evaporator heat duty is exchanged during phase change at a constant temperature. Therefore, the evaporator effectiveness is closed to that of a counterflow heat exchanger. This is also true for any multipass counter-crossflow HEX with a large number of passes (Shah and Sekulic, 2003). Since this is the chosen layout for the evaporator, the benefit of the effectiveness gain due to phase change in a subcritical cycle is diminished.

  • The thermal resistance of the evaporator is dominated by the low heat transfer coefficient that is encountered on the hot gas side. Therefore, no advantage is gained from the increased heat transfer coefficient on the working fluid side during isothermal phase change.

Table 3.

Main parameters and variables of the ORC waste heat recovery unit model.

ParameterInputParameterInputParameterInput
Tmax,ORCDesign variableΔpevap,HHEX modelηis,pump65%
Tmin,ORCDesign variableΔpevap,CHEX modelηis,turbTurbogenerator model
pmax,ORCDesign variableΔTpp,evapDesign variableηis,fan60%
Tamb313.15 KΔpcond,HHEX modelηmot,pump, ηmot,fan98%
m˙evap,HAPU modelΔpcond,CHEX modelηmech,pump, ηmech,fan99%
Tevap,H,inAPU modelΔTpp,condDesign variable

[i] Note: Subscripts H and C indicate heat exchanger hot and cold sides.

The ORC turbine gross power (W˙turb,gross) is converted into electrical power via a dedicated generator (see Figure 5). The turbine mechanical efficiency (ηmech,turb) and ORC generator efficiency (ηgen,ORC) are an output of the ORC turbogenerator preliminary design procedure explained in Section ORC Turbogenerator Preliminary Design. An electrically driven fan provides the necessary air mass flow rate through the condenser during ground operations. The fan power consumption (W˙fan,net) is calculated with

(13)
W˙fan,net=m˙airΔpcond,Cρairηis,fan,

where m˙air is the air mass flow rate, ρair the air density and ηis,fan the fan isentropic efficiency. As depicted in Figure 2 the fan is placed in front of the condenser. Placement of the fan behind the condenser results in higher W˙fan,net due to the reduced air density. Moreover, exposing the fan to a higher air temperature could complicate its design. A ηis,fan of 60% is selected based on experience with similar systems designed for stationary use. Note that Δpcond,C only includes the pressure losses originating from the condenser and does not account for losses induced by the ducting, which are not modeled. Preliminary design of the electrically driven pump is not performed. Based on the pump selection guide provided in (Karrasik et al., 2008, Ch. 1) the expected pump head and volumetric flow rate suggest the use of a positive displacement pump or centrifugal pump. Positive displacement pumps are more suited for fluids with higher viscosity that can also provide lubrication. Due to the low viscosity of the considered working fluid a centrifugal pump is adopted. Research on electrically driven centrifugal pumps for small space launch vehicles conducted by Kwak et al. (2018) suggests a mass-specific power of around 4kW/kg and an isentropic pump efficiency (ηis,pump) of around 65%. The efficiency of the pump and fan motor ηmot,pump and ηmot,fan, respectively, is assumed to be 98% as suggested by Schmollgruber et al. (2020) for an EIS year of 2035. Furthermore, a pump and fan mechanical efficiency ηmech,pump and ηmech,fan, respectively, of 99% is assumed. ORC efficiency based on ORC net power output (W˙ORC,net) is defined as

(14)
ηORC,net=W˙ORC,netQ˙evap,

where Q˙evap is the thermal power recovered by the evaporator. According to Figure 5 W˙ORC,net is defined as

(15)
W˙ORC,net=W˙turb,grossηmech,turbηgen,ORCW˙pump,netηmech,pumpηmot,pumpW˙fan,netηmech,fanηmot,fan.

Furthermore, the recovery factor (χ) describes how much of the available thermal power (Q˙exh,avail) is recovered by the WHR system and it is defined as

(16)
χ=Q˙evapQ˙exh,avail.

Q˙exh,avail is defined as the product of the exhaust gas mass flow rate, the specific capacity, and the temperature difference between the turbine exit and ambient conditions.

The ORC system mass is the sum of pump (mpump), turbogenerator (mtg), condenser (mcond), evaporator (mevap), working fluid (mfluid), fan, and balance-of-plant mass. mtg is the sum of the turbine mass (mturb) and the generator mass (mgen,ORC). The heat exchanger and turbogenerator masses are an outcome of the respective sub-models. The working fluid mass is estimated as the product of 1.2 times the evaporator cold side volume and the density of the working fluid at one atmosphere and 25C. The mass of the fan, including its motor and balance-of-plant, is assumed to contribute 10% to the overall system mass. This value is similar to the assumption made by Zarati et al. (2017). However, as the knowledge base on flying ORC systems is small, a large amount of uncertainty is related to this value.

Heat exchanger preliminary design

The preliminary design of the heat exchangers for the CC-APU is carried out by means of a dedicated in-house software developed in Python named HeXacode, which is integrated with the ARENA framework. The program was verified by comparison with a commercial code for heat exchanger design and rating (GRETh, 2023). The two heat exchangers of the ORC system under consideration are the supercritical evaporator and the condenser. The sizing tools aim at finding the heat transfer area that satisfies the required heat duty given the inlet temperatures, inlet pressures, and mass flow rates of the hot and cold streams. The core material and geometric parameters are also an input to the model. The preliminary design routine then returns the size, mass, and pressure drops on both fluid sides of the heat exchanger. In the following, an overview of each heat exchanger model is presented.

Evaporator

Figure 6 shows the chosen layout and topology for the evaporator, which is a multi-pass bare-tube-bundle HEX placed right after the turbine diffuser in a counter-crossflow arrangement. This configuration, as shown by Sabau et al. (2018) yields smaller exergy losses in a supercritical cycle because of a better thermal match between the heat source and the working fluid. The Nickel-base alloy Hastelloy® X is chosen as the material for the evaporator as suggested by Grieb (2004, Ch.5) based on mechanical considerations. Preliminary system design runs showed that reducing the pressure drop on the hot side of the evaporator yields significant improvements in the overall combined-cycle efficiency. Although in-line tube bundles are usually heavier than their staggered counterpart for a given frontal area, the cycle efficiency improvement that can be achieved with a lower hot side pressure drop outweighs the effect of the increased mass of the HEX. For this reason, the in-line tube arrangement is chosen instead of the staggered one.

Figure 6.

Multi-pass bare-tube-bundle heat exchanger.

https://journal.gpps.global/f/fulltexts/204721/JGPPS-00236-2024-02.06_min.jpg

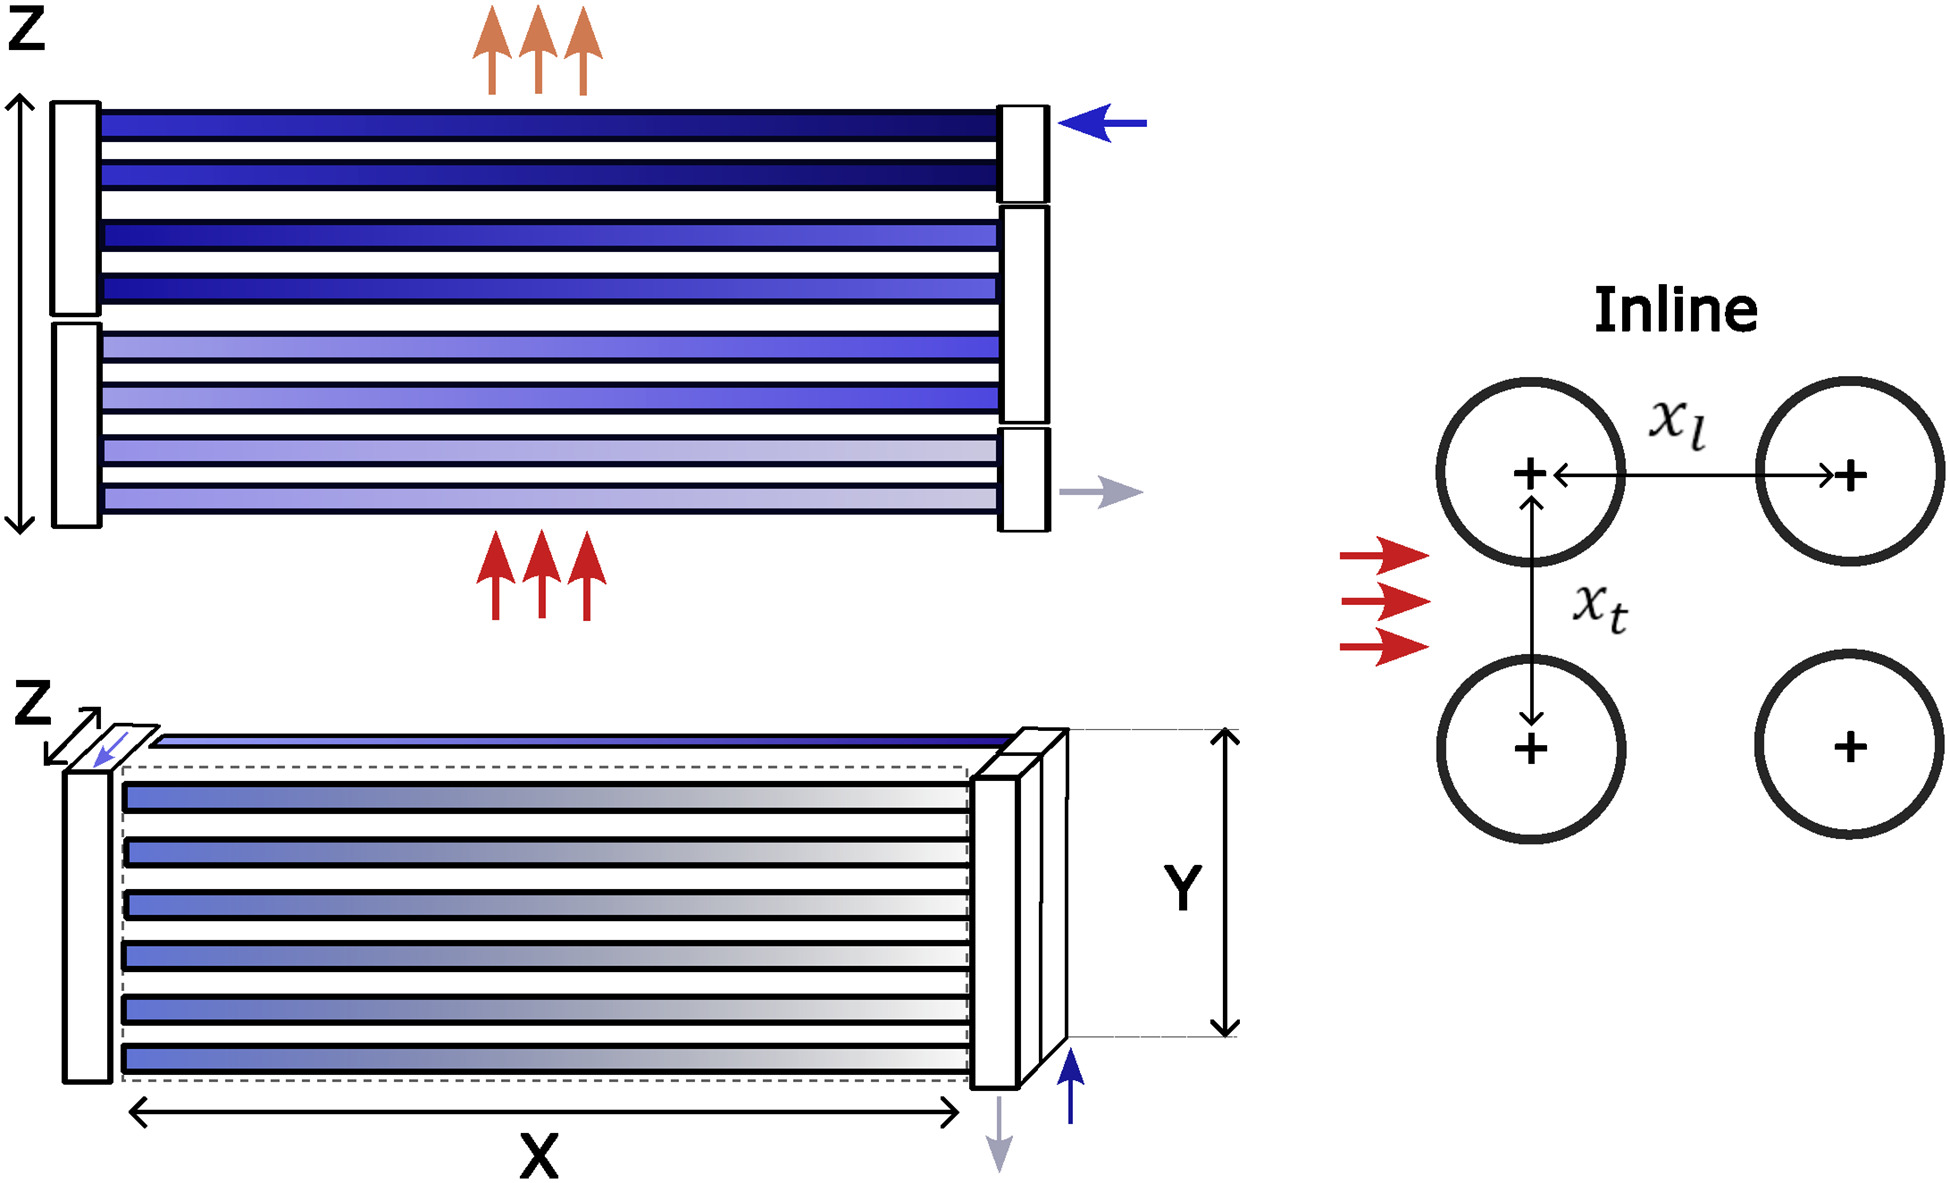
As fluid properties can change significantly for fluids in supercritical conditions, the sizing routine divides the HEX into several subsections or cells in which fluid property variations are small. The total heat duty of the HEX is then distributed over each cell following a logarithmic distribution. In the present study, the number of cells is conveniently set equal to the number of passes, which is an input to the design problem. Initially, a uniform pressure distribution across the cells in the two streams is assumed. This pressure distribution is updated in a convergence loop with the pressure drop estimate until both the fluid properties and the calculated pressure drop in each cell do not change. As a result, the preliminary design problem can be split into a series of interconnected individual HEX sizing problems, in which the heat transfer area Ai is unknown. The core height Yevap and width Xevap of the evaporator, which determine the hot side frontal area, are input to the problem and are estimated given the cross-sectional area of the gas turbine exhaust pipe, assuming a smooth transition to a square-shaped frontal area. The core depth (Zevap) is, instead, calculated to meet the design specifications as

(17)
Zevap=do+xtxldo2Yevap(i=0Ncellsround(ACiπdiXevap)1)

in which ACi is the working fluid side heat transfer area of the cell i, xt and xl are the transversal and longitudinal pitch, respectively. do and di are the tube outer and inner diameters, respectively. The cell cold side heat transfer area is calculated as

(18)
ACi=Q˙i(UCi)1FiΔTmli,

where Ui is the local overall heat transfer coefficient that depends on the fluid velocity and properties, ΔTmli is the local mean logarithmic temperature difference and Fi is its correction factor. In the case of heat transfer at non-constant temperature, Fi is lower than unity for any flow arrangement different from the pure counterflow and depends on the local number of transfer units, effectiveness, and heat capacity ratio. The pressure drop across the tube bundle is calculated by combining the laminar (Cf,lam) and turbulent (Cf,turb) friction coefficients through a switch function (Ff) to estimate the non-dimensional pressure drop per tube row (VDI e. V., 2010, Part L), while the heat transfer coefficient on the hot gas side is calculated from the dimensionless pressure drop as shown by Martin (2002). For the working fluid side, the pressure drop inside the tubes is estimated using the friction factor formulation of Brkić and Praks (2018) while the Nusselt number of the supercritical fluid is calculated using correlations developed by Pioro and Mokry (2011). The output of each sizing iteration is thus the heat transfer area required in each cell. The sizing routine then stops when the calculated required number of tubes remains constant between successive iterations. The model then returns the core mass and pressure drops of the heat exchanger, together with the volume occupied by the working fluid and its corresponding mass during nominal operating conditions.

Condenser

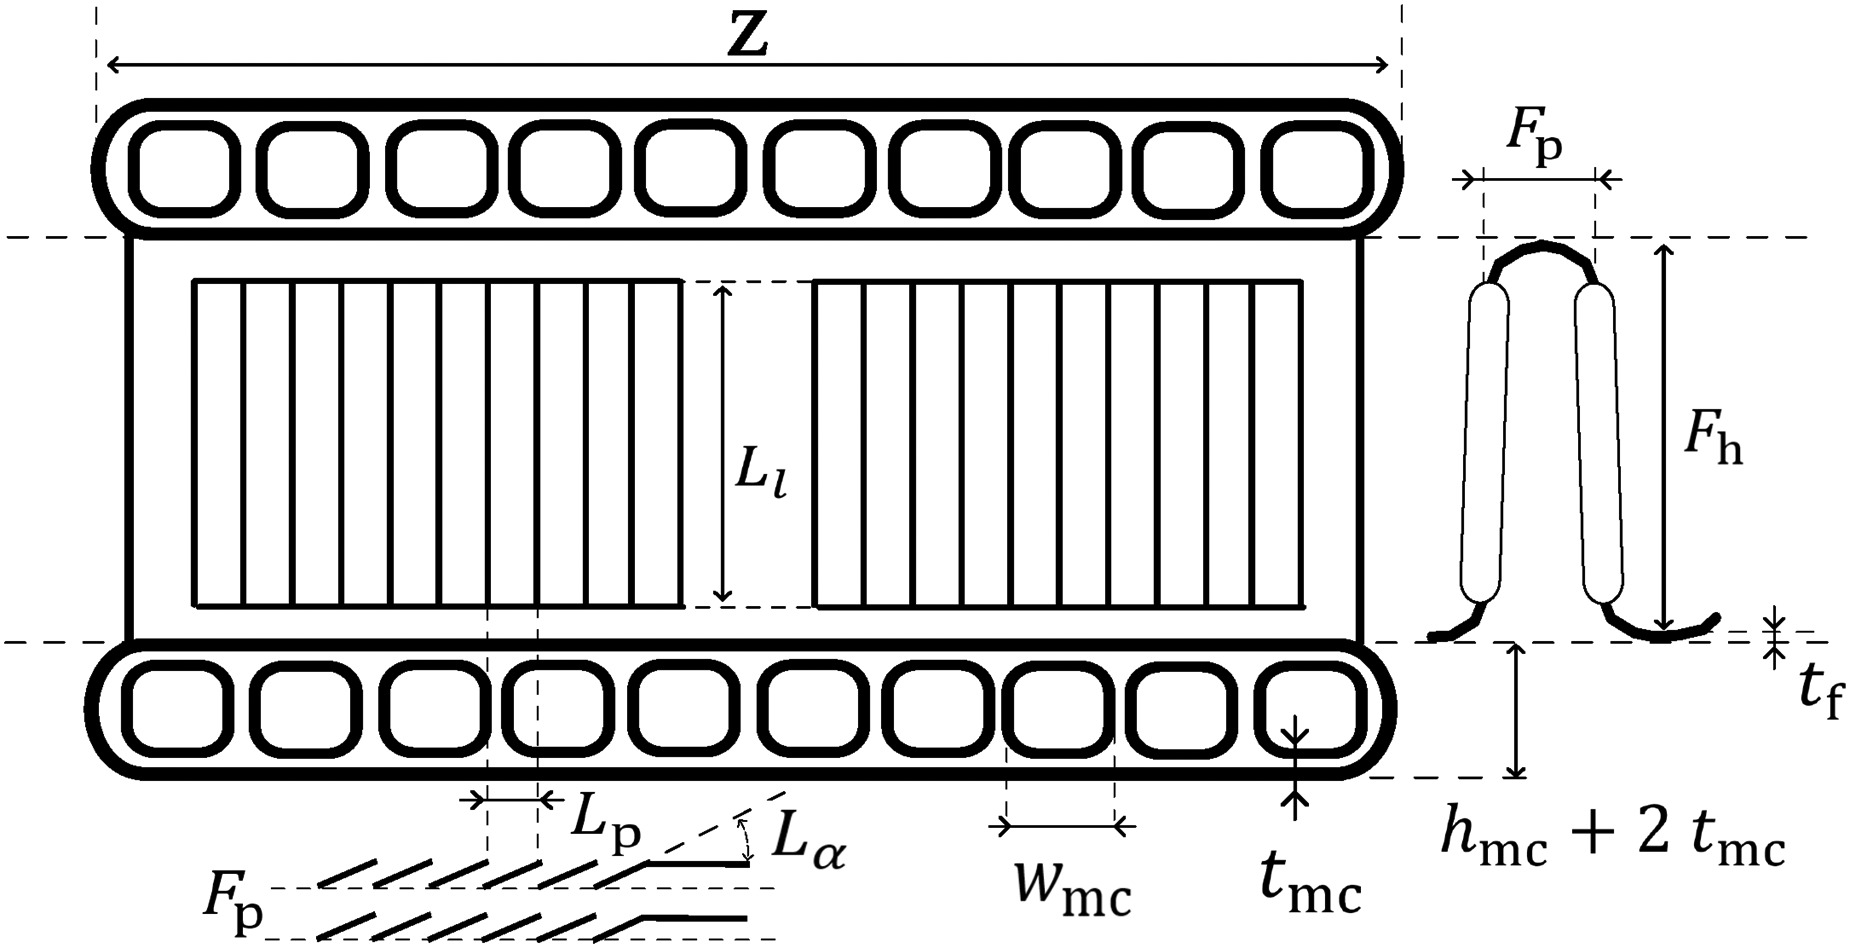
As depicted in Figure 7, the chosen condenser topology is a flat-tube microchannel heat exchanger with louvered fins. The working fluid flows in small rectangular channels within the flat-tubes, while the air flows through fins of the multi-louvered type. These fins allows for high levels of HEX compactness (over 1,100m2/m3 (Shah and Sekulic, 2003)) and of heat transfer coefficient, at the expense of larger pressure drops due to the continuous mixing of the flow passing through the louvers (Shah and Sekulic, 2003). The louvered fin-and-flat-tube HEX topology promotes small and light designs and is often used in the automotive and aerospace sectors. The pitch between two microchannels (wmc) is fixed equal to the flat-tube height (hmc), which is 2 mm. The louver fin angle (Lα) is set to 27°. The flat-tube length is set equal to the condenser core depth (Zcond), which is used as an optimization variable. The louver pitch (Lp) is taken equal to the fin pitch (Fp), which is an optimization variable. The louver length (Ll) is set to 80% of the fin height (Fh), which is an optimization variable. The fin thickness (tf) is set to 0.11 mm while the flat-tube wall thickness (tmc) is 0.2 mm. These fixed geometry-specific parameters are chosen based on engineering judgment and manufacturability considerations. The height of the condenser (Ycond) is fixed to 1.0m. This value is selected based on the available space in the APU compartment, which is approximated using drawings provided in Refs. (Stohlgren and Werner, 1986; Airbus, 2020). The chosen aluminum alloy for the condenser is the 3,000 series, as suggested in the document of the Kaltra GmbH (2020).

Figure 7.

Flat-tube microchannel louvered fin heat exchanger.

https://journal.gpps.global/f/fulltexts/204721/JGPPS-00236-2024-02.07_min.jpg

The condenser sizing tool implements a moving boundary method to capture the variation of the fluid phase along the HEX. Notably, the model subdivides the condenser into three control volumes depending on the working fluid phase: superheated vapor, condensing two-phase flow, and subcooled liquid. The heat transfer area associated with each control volume varies in size depending on the specific enthalpy drop, which is initially estimated assuming a uniform pressure distribution. The enthalpy drops are updated at each iteration with the calculated local pressure drop, till the routine converges to the required heat transfer area of each control volume (ACi). As the core depth Zcond is fixed, the heat transfer area of each control volume is adjusted by changing its width Xcondi. The total core width then reads

(19)
Xcond=i=13Xcondi=i=13ACiNynmc(wmc+hmc2tmc),

where Ny is the number of flat-tubes, and nmc is the number of microchannels within a flat-tube. The sizing procedure keeps updating the HEX core width until the relative difference of the core width (Xcond) between two consecutive iterations is less than or equal to 1%. Once convergence is reached, the model returns the total core width and calculates the overall pressure drops on both sides. Finally, the total dry core weight of the HEX is added to the casing weight. The casing is comprised of two flat plates positioned at the top and bottom of the HEX core, providing structural stability. The manifold weight, on the other hand, is not accounted for.

The adopted heat transfer and pressure drop correlations vary depending on the fluid phase. In particular, for the de-superheating and subcooling zones inside the microchannels, the heat transfer coefficient is estimated using the Whitaker (1972) correlation for turbulent flow with the correction for temperature dependant effects by Sieder and Tate (1936). The pressure drop is calculated using laminar or turbulent flow friction factors as shown in Ref. (VDI e. V., 2010, Chapter L1). For the condensing region, the local heat transfer coefficient is estimated using correlations for internal condensation in horizontal tubes for annular film flow (Shah and Sekulic, 2003, Table C.2), while the Müller-Steinhagen & Heck (MSH) model (Müller-Steinhagen and Heck, 1986) is used to estimate the pressure drop per unit length. On the cold air side, the heat transfer and friction factor coefficients are estimated using correlations of Chang and Wang (1997) and Chang et al. (2000), respectively.

ORC turbogenerator preliminary design

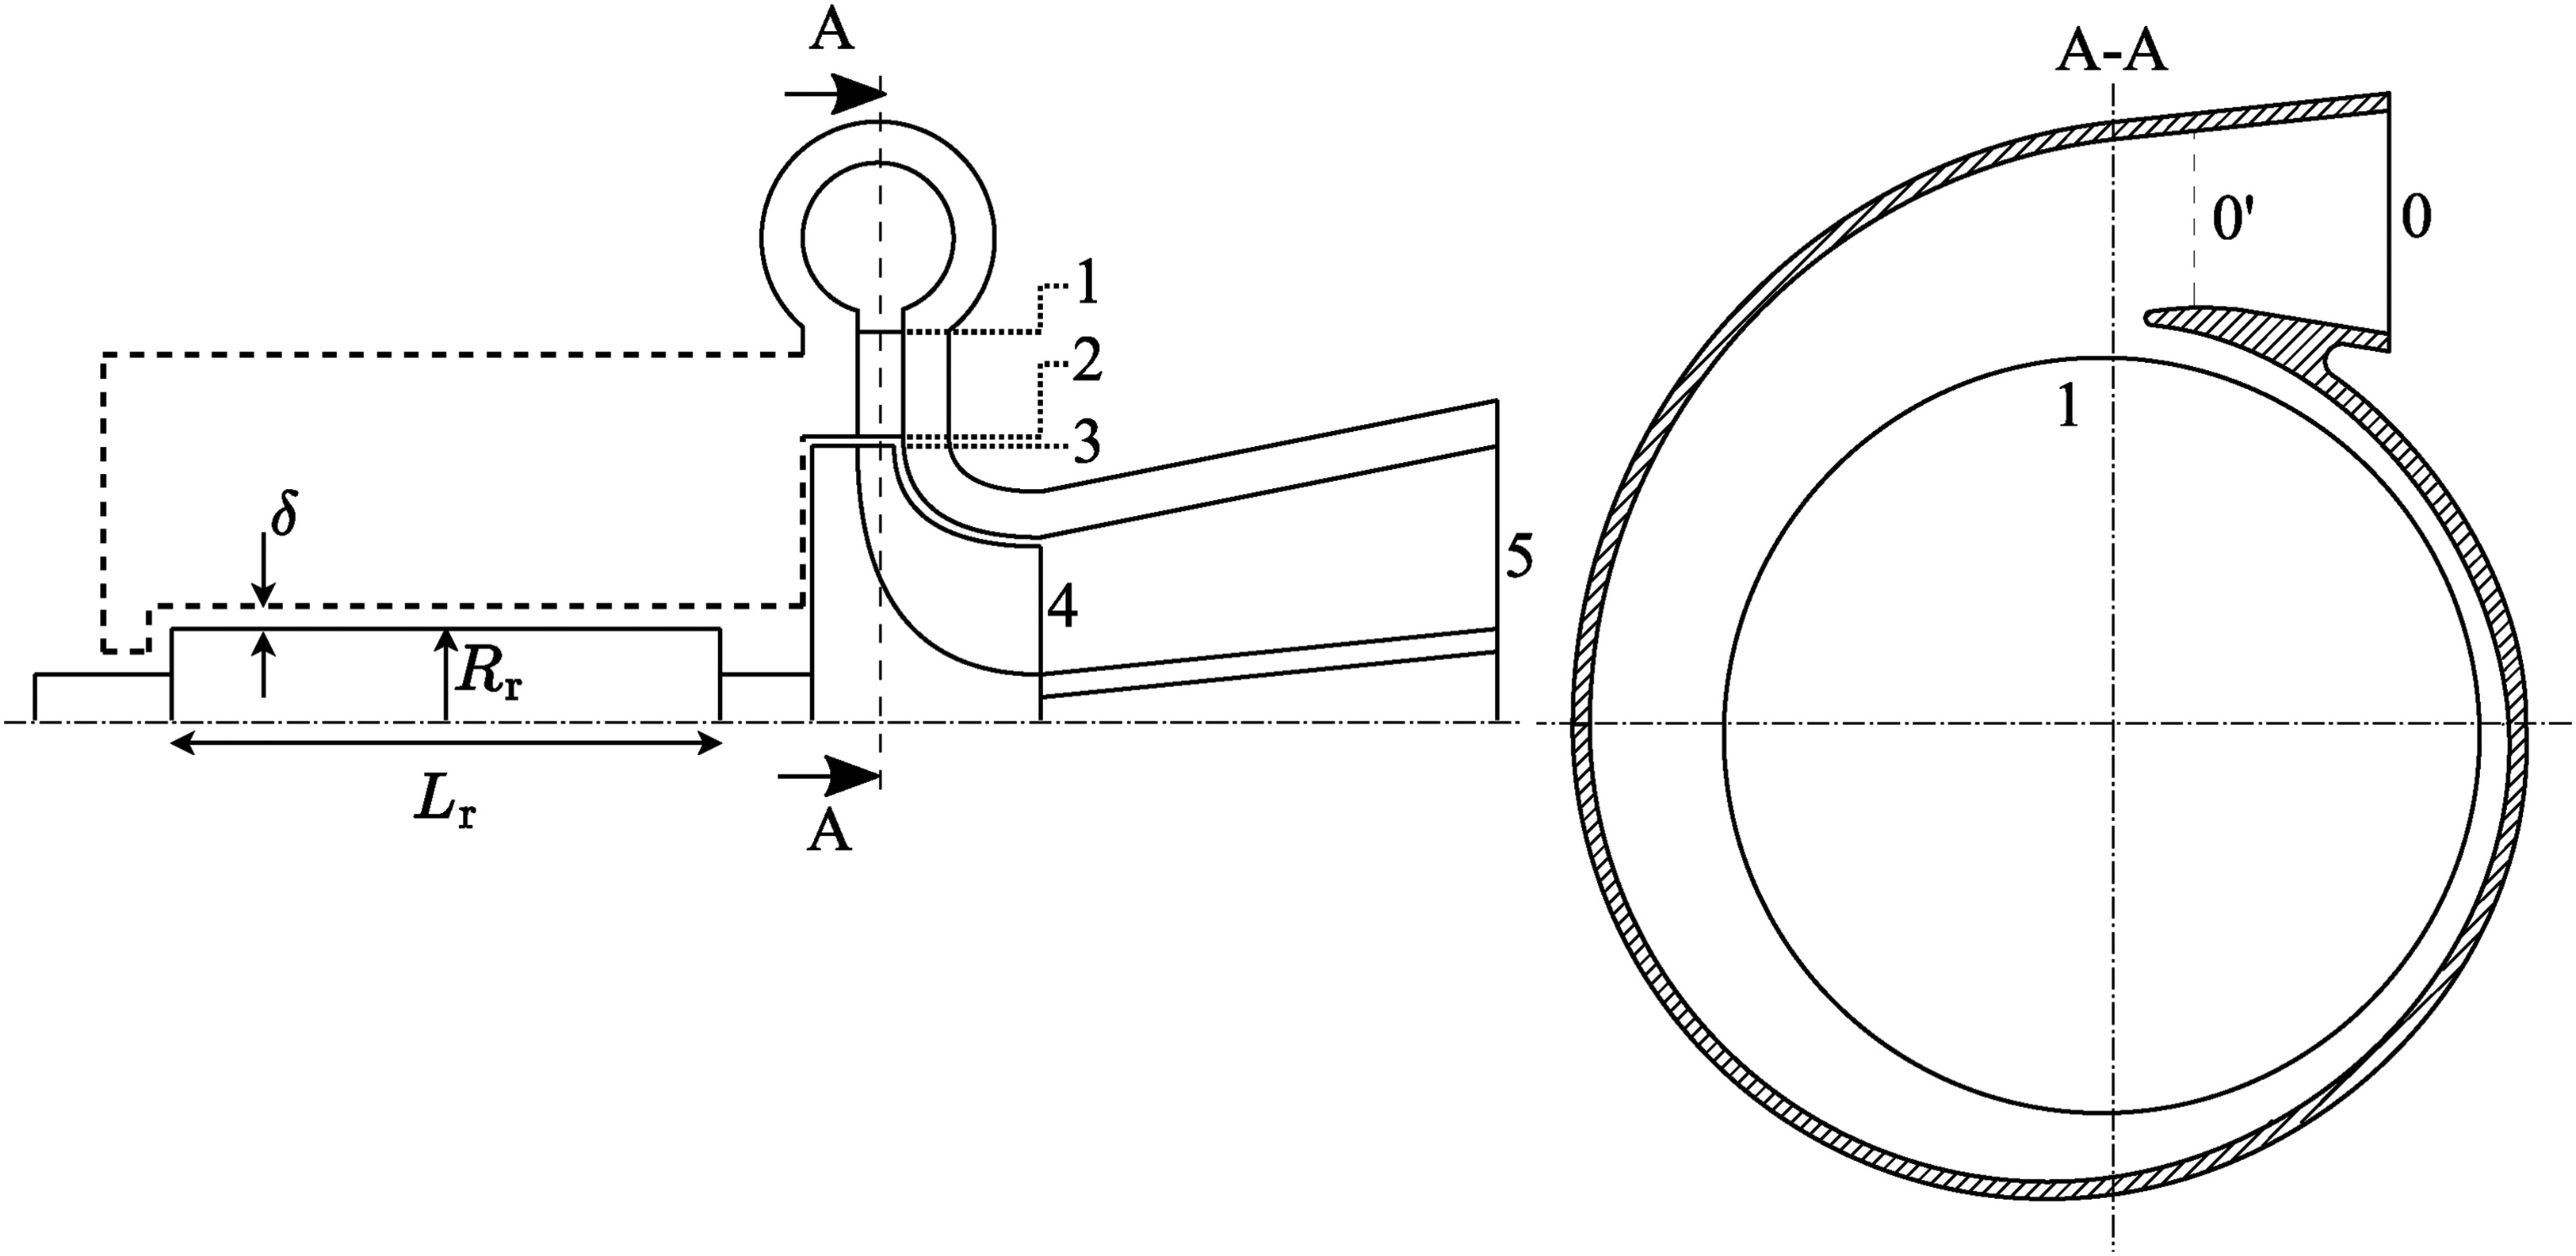
The turbogenerator consists of a radial-inflow turbine (RIT) driving a permanent-magnet (PM) generator. The choice of using a RIT as the expander of the ORC system is based on its high efficiency and mass-specific power, which result in a compact single-stage design (Bahamonde et al., 2017). Furthermore, PM generators are attractive due to a power factor that is close to unity and therefore requires little or null excitation currents to operate them, as well as their high mass-specific power, and high efficiency, which is usually in excess of 95% (Binder and Schneider, 2005). Figure 8 depicts the components of the turbogenerator consisting of (i) a single-stage RIT (section 1–4) comprising a prismatic radial stator (section 1–2) and a radial-axial impeller (section 3–4), (ii) a circular cross-section volute (section 0–1) to distribute the flow tangentially at the stator inlet, (iii) an annular diffuser (section 4–5) to recover the turbine exit kinetic energy, and iv) a PM generator. In the following, the modeling methodology for each of the above components is briefly described.

Figure 8.

ORC turbogenerator schematic (left) and volute cross-section plane A-A (right). The part of the turbogenerator assembly represented using dashed lines corresponds to the main casing containing the stator windings of the PM generator and the power electronics, whose geometry has not been modeled in this work.

https://journal.gpps.global/f/fulltexts/204721/JGPPS-00236-2024-02.08_min.jpg

Radial-inflow turbine modeling

The thermodynamic performance and mechanical design of the RIT is modeled using the numerical framework described in Ref. (Majer and Pini, 2025). This model takes the design variables ψis, ϕ, ν, m˙ORC and the problem boundary conditions pmax,ORC, Tmax,ORC, Tmin,ORC as inputs and computes the thermodynamic conditions and geometrical characteristics in sections 1, 2, 3 and 4 (see Figure 8).

The volute sizing and loss prediction is performed by solving the following system of equations consisting of the angular momentum conservation equation, the mass conservation equation, the thermodynamic equation of state (EoS), and the energy conservation equation across the volute

(20)
V0Rc,0=Vθ1R1,ρ0V0A0=ρ1Vm12πR1b1,s0=EoS(ht1,pt1+Δpt,01),ht0V022=h0(ρ0,s0).

This system of equations is solved iteratively in the 4 unknowns: absolute velocity (V0), density (ρ0), entropy (s0), and enthalpy (h0) at the inlet of the turbine volute as a function of the volute centerline radius at the inlet section Rc,0. The total pressure loss occurring between section 0 and 1, Δpt,01, is computed using the empirical model for centrifugal compressors proposed by Japikse (1996) and adapted to turbine volutes.

At the turbine exit (section 4 in Figure 8) an annular diffuser is used to recover part of the exit kinetic energy and increase the overall turbine total-static efficiency. A one-dimensional physics-based model proposed and validated by Agromayor et al. (2019) is implemented to design the diffuser and estimate its performance. The diffuser model requires the turbine outlet geometry and flow state as input, as well as the diffuser cant angle (ϕdiff), the wall semi-aperture angle (ε), and the diffuser area ratio (ARdiff) and solves the continuity, energy, axial and tangential momentum equations in the diffuser. Viscous losses are computed according to the model documented in (Agromayor et al., 2019), and applying a friction factor coefficient equal to 0.1.

Once the size of the flow path is determined, the total mass of the radial-inflow turbine can be computed. A number of approximations are made when evaluating the turbine mass. Due to the relatively small mass of the impeller blades compared to the disk mass, its contribution is neglected. Similarly, the stator mass is assumed equal to that of the base plate of the ring, neglecting the mass of the blades. The volute geometry is treated as a simple hollow torus, whilst the inlet cone (section 0–0′) is modeled as a hollow cylinder. The annular diffuser mass is determined as the sum of the outer and inner wall mass, whereas the mass of the struts required to align the two diffuser walls is neglected. The wall thickness of the components volute, stator base plate, diffuser, and impeller shroud is set to 5 mm, based on manufacturing considerations. The open-source Python package CadQuery (CadQuery, 2023) is used to perform the geometrical modeling of the turbine impeller, stator, volute, and diffuser. Based on this three-dimensional model, the turbine mass (mturb) is calculated, considering a typical steel grade as material for the turbine components.

The main output parameters of the RIT model include the turbine total-total isentropic efficiency, defined as

(21)
ηis,turb=ht0ht5ht0ht5,is,

the turbine mechanical efficiency (ηmech,turb), and mturb.

Generator modeling

The PM generator technology considered in this work is that of an iron-cobalt FeCo cylindrical permanent magnet electric machine to maximize the magnetic flux saturation and minimize the losses (Geest et al., 2015). The left side of Figure 8 shows a schematic of the PM generator. In this figure the stator windings of the generator are enclosed in the generator casing, represented with the dashed line. The geometrical details of the stator were not part of this investigation and are therefore not shown in the picture. The rotor is geometrically defined by means of the outer radius (Rr) and the axial length (Lr), while the clearance between the stator and the rotor is defined as δ. A forced-air flow is injected into the gap between the stator and rotor, providing the necessary cooling to keep the generator temperature below 150C in the stator windings and 80C on the rotor retaining sleeve (Geest et al., 2015).

The generator rotor radius (Rr) is found by iteratively solving the power balance across the generator defined as

(22)
W˙genηel+ΔW˙w=W˙turb,net,

where the electromagnetic power (W˙gen) and windage loss (ΔW˙w) are calculated according to James and Zahawi (2013) as

(23)
W˙gen=πBsJs(Rr+δ)2LrΩcosϕ,

and

(24)
ΔW˙w=0.5πρgapΩ3Rr4LrCf(Reδ)

respectively.

The values of the air gap inter-space (δ), the magnetic flux density (Bs), the linear current density (Js), and the electrical efficiency (ηel) are assumed according to data of optimized electric machines as a function of Rr (Geest et al., 2015). Cf is the friction factor, herein calculated for a rotating cylinder within a coaxial sleeve, expressed as a function of the air gap Reynolds number (Reδ) (Saari, 1996). The generator rotor length (Lr) is calculated assuming a typical value of the rotor aspect ratio Lr/Rr=3, whereas a conservative value of the generator power factor cosϕ=0.8 is chosen. The mass-specific power is selected according to data of optimized electric machines (Geest et al., 2015) based on the resulting value of Rr. Furthermore, state-of-art mass-specific power values for the power electronics and AC-DC converter of 14.3kW/kg and 62.0kW/kg, respectively, are taken according to Gesell et al. (2019). Estimates based on historical data (Hall et al., 2022) of AC-DC converter technology show that similar mass-specific power values can realistically be obtained by 2030. Additionally, Granger et al. (2021) show that AC-DC converters for aerospace power systems featuring mass-specific power values around 10kW/kg can already be achieved with current technologies. The total mass of the PM assembly (mgen,ORC) is the sum of the electric machine, AC-DC converter, and power electronic masses. The individual component masses are calculated as the product of their inverse mass-specific power values and W˙gen. The main output parameters of the generator model that are utilized in the present work are mgen,ORC and the generator overall efficiency (ηgen,ORC), which is defined as

(25)
ηgen,ORC=W˙genW˙turb,net.

Results

In this section, first results for the optimized CC-APU design are presented. Secondly, the performance of the CC-APU in terms of mission fuel consumption is compared to the reference case which is a GTCP36-300 APU (Stohlgren and Werner, 1986) on-board an Airbus A320neo. Thirdly, design variables and constraints that are identified to be most critical for CC-APU performance are discussed. Lastly, the sensitivity of the final design to perturbations of design variables is analyzed.

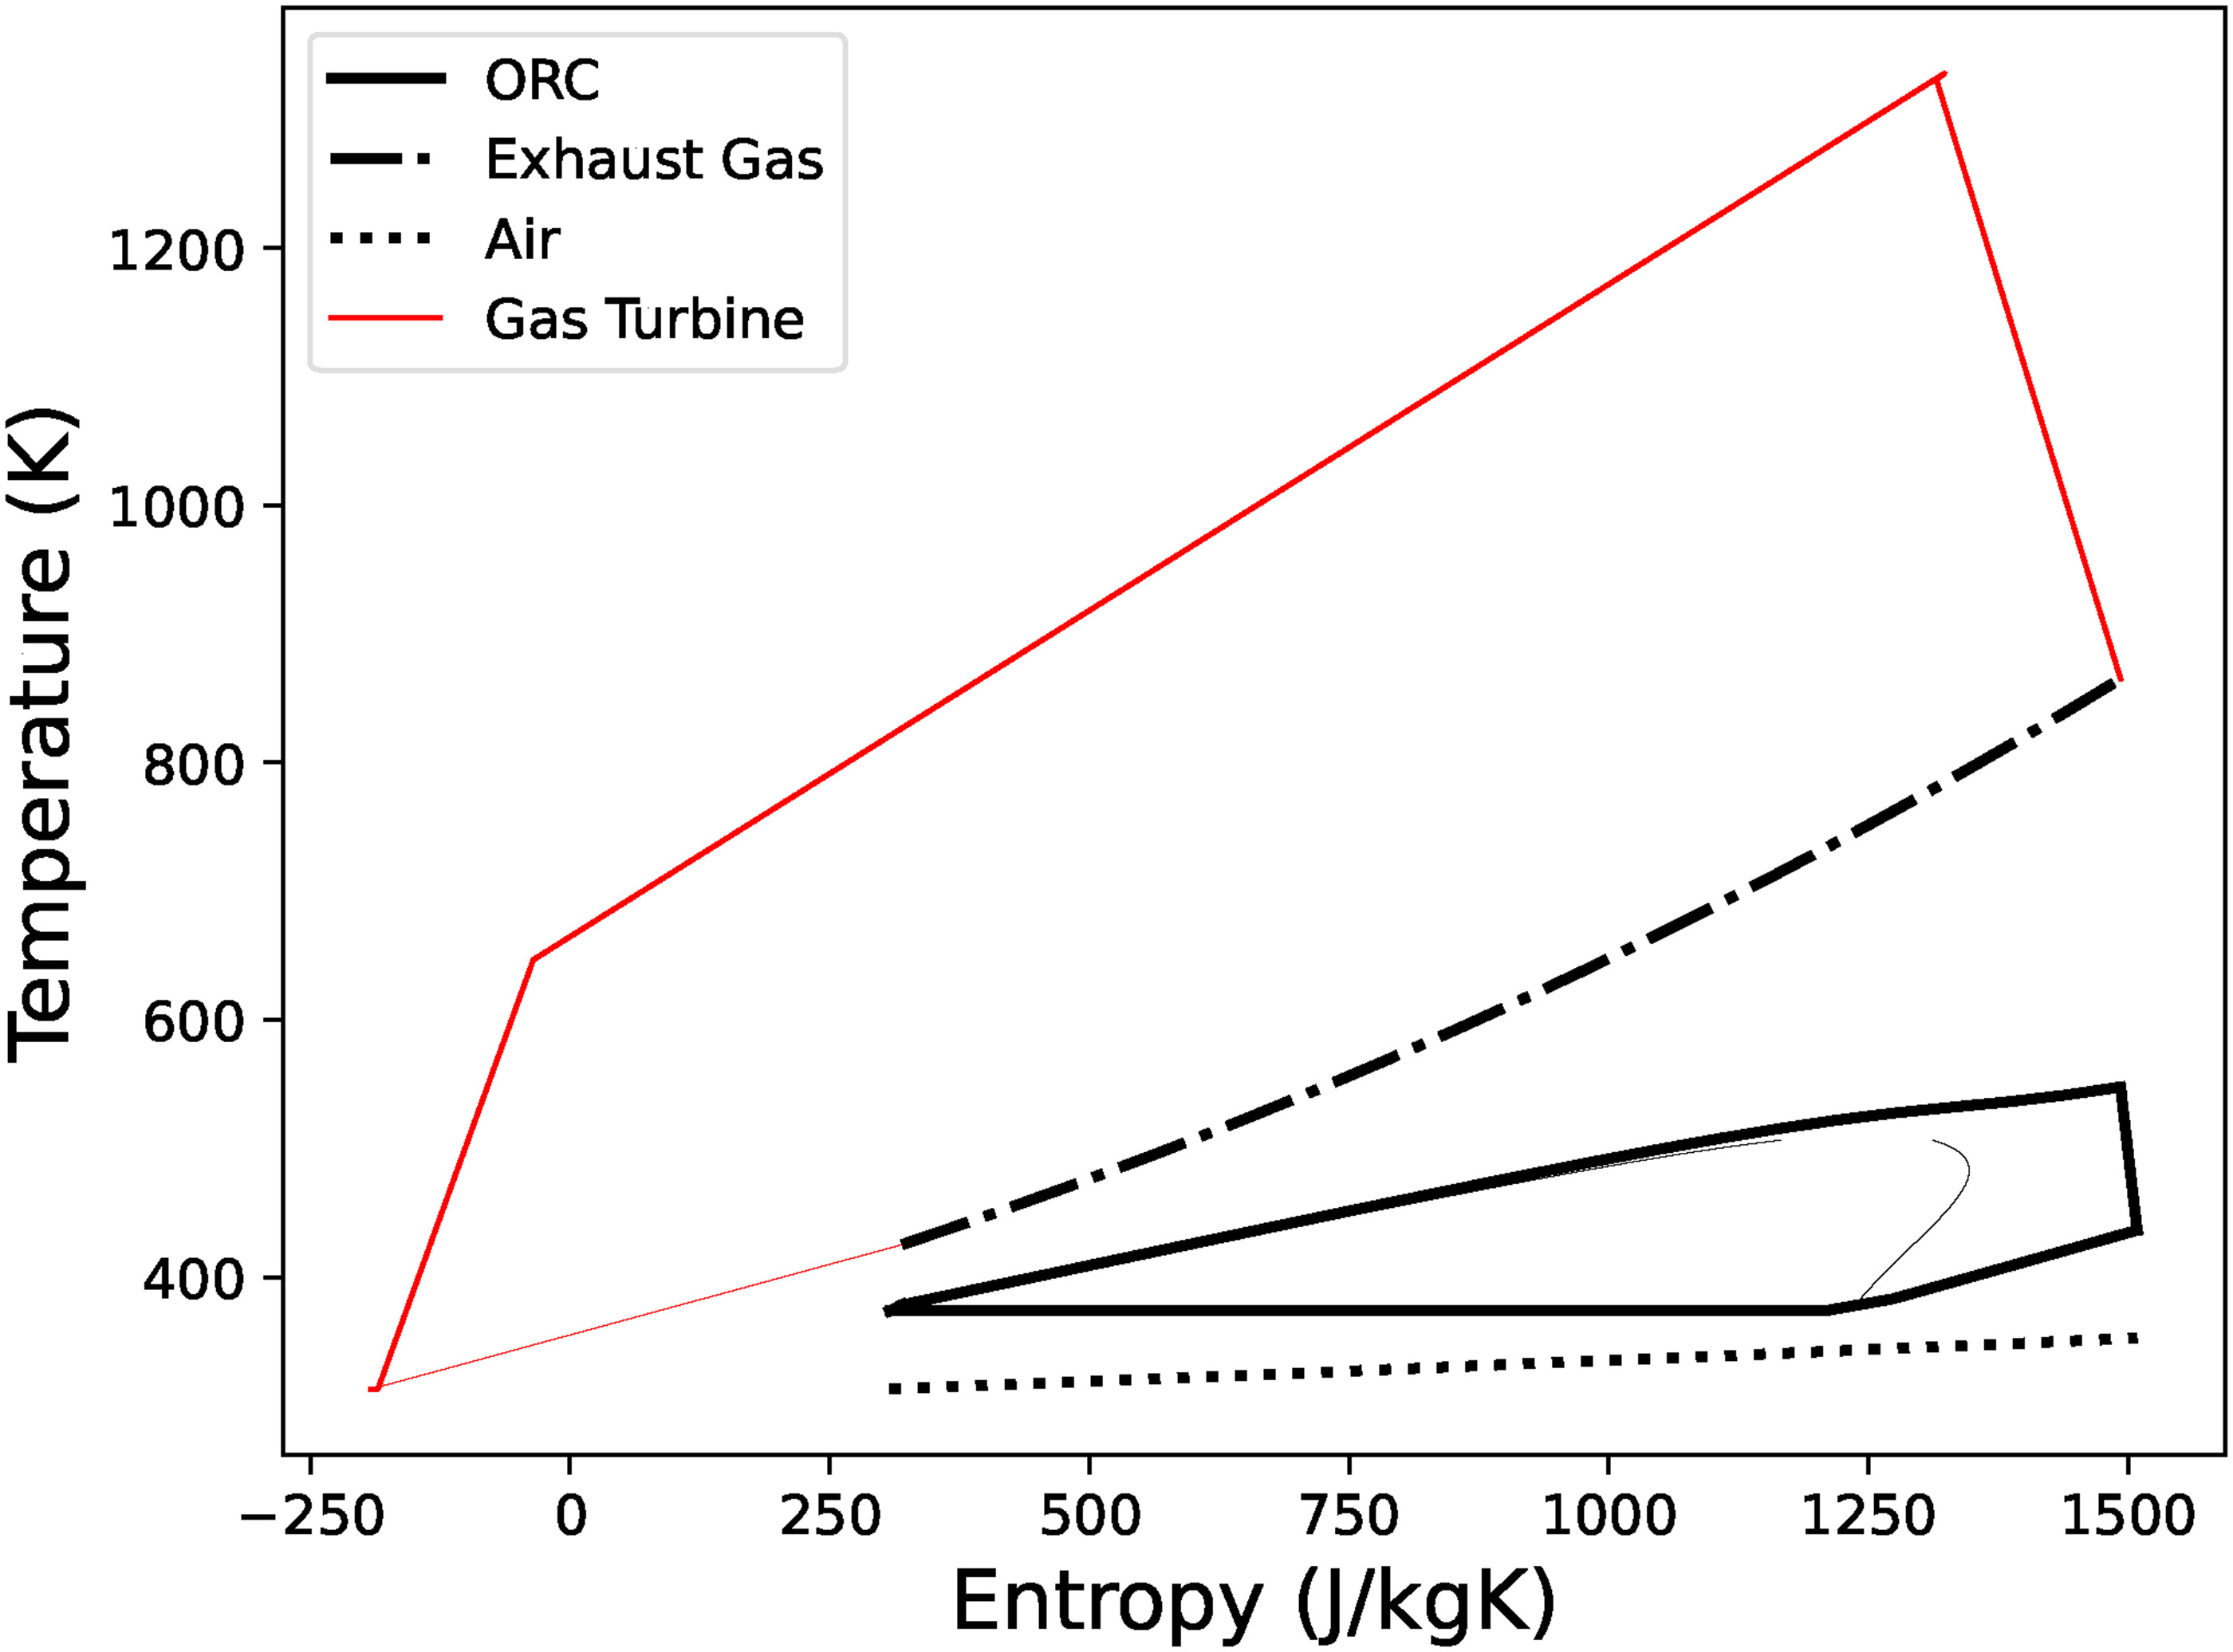
Optimized CC-APU design

Table 4 provides the value of the design variables for the optimized CC-APU system. The design is only constrained by the limitation on the condenser size. Figure 9 gives the corresponding temperature-entropy diagram of the CC-APU. A large temperature difference between the hot-side inlet and the cold-side exit of the evaporator can be observed. This large temperature difference is due to the low thermal efficiency of the prime mover. As a result, the optimal ORC for the studied configuration is the one with the highest Tmax,ORC, thus the highest thermal efficiency. This is in contrast to stationary combined-cycle power units, where the maximum power output is obtained through a trade-off between bottoming cycle efficiency and the recovered thermal power.

Table 4.

Design vector for the optimized CC-APU configuration.

ParameterOPRTmin,ORCTmax,ORCpmax,ORCΔTpp,condΔTpp,evapψisϕ
Value9.5374 K548 K59.5 bar32 K47 K0.8430.400
ParameterνZcondFhFpxtxlnpass
Value0.45741 mm11 mm1.5 mm2.91.2513
Figure 9.

Temperature-entropy diagram of the CC-APU using a non-recuperated ORC.

https://journal.gpps.global/f/fulltexts/204721/JGPPS-00236-2024-02.09_min.jpg

The identified CC-APU design has a total mass
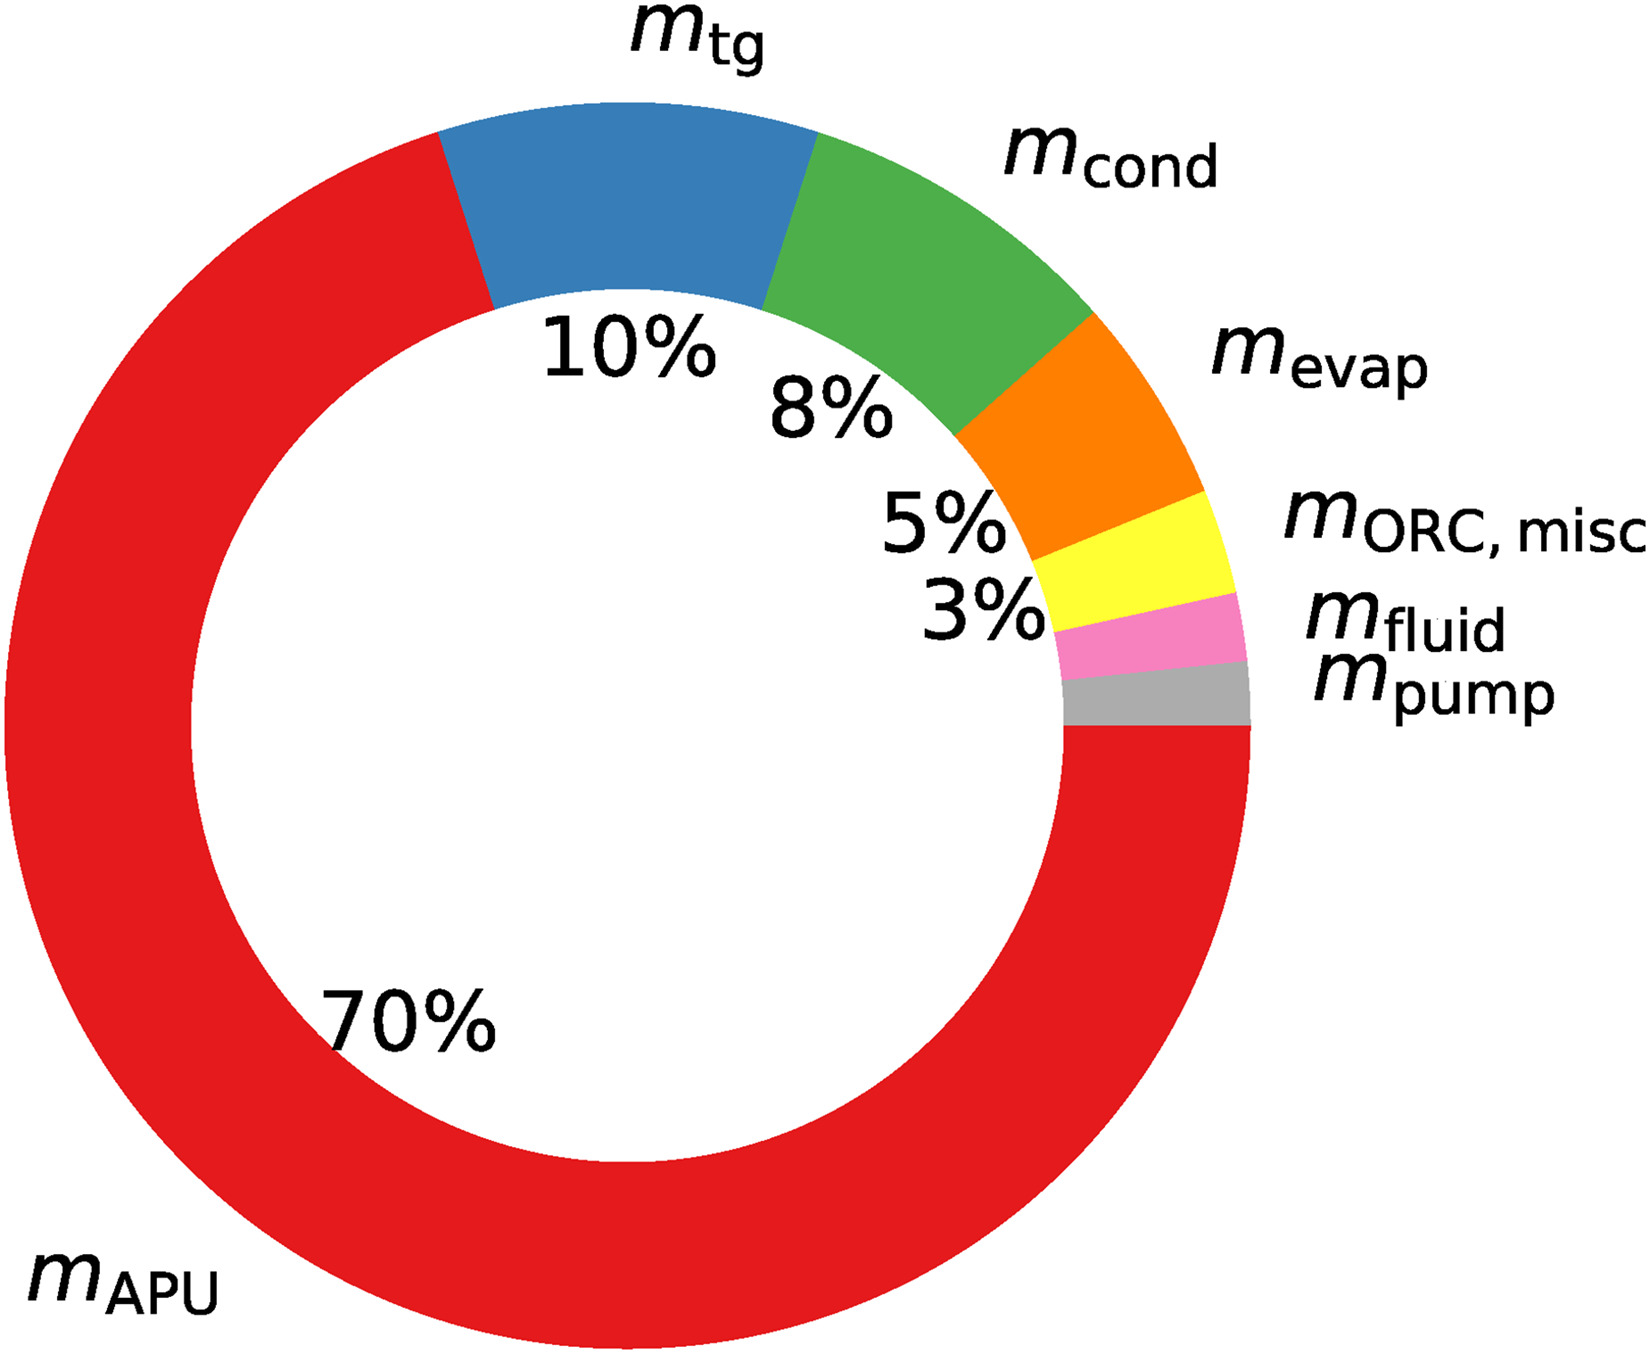
 (mCCAPU) of 148kg and a combined-cycle efficiency (ηCCAPU) (Equation 3) of 33.9%. The APU mass (mAPU) is 104kg and its efficiency (ηAPU,net) (Equation 11) is 25.3%. The ORC mass (mORC) is 44kg and its efficiency (ηORC,net) (Equation 14) is 14.9%. Notably, the ORC turbogenerator has a mass of 15kg constituting about a third of the overall ORC unit mass. In this regard, notice that the generator represents by far the heaviest component of the ORC assembly, with a mass of 12kg. Figure 10 gives the mass breakdown of the CC-APU. The net power output (W˙CCAPU,net) of 250kW is split up into 187kW provided by the APU and 63kW provided by the ORC system (W˙ORC,net). Therefore, the ORC turbogenerator provides 25% of the required power. This results in mass-specific power values of the APU, the ORC, and the CC-APU of 1.8kW/kg, 1.4kW/kg and 1.7kW/kg, respectively. The ORC turbine has a gross power output (W˙turb,gross) of 84kW which results in a mass-specific power of 5.6kW/kg. Notably, the ORC turbogenerator mass-specific power is one order larger than the value assumed by (Zarati et al., 2017). The optimized ORC turbine design features a ηis,turb of 94% and speed of 160krpm. The turbogenerator features a ηmech,turb of 99% and a ηgen,orc of 97%. The evaporator and condenser designs feature an effectiveness (ε) of 89% and 51%, respectively. In the case of the evaporator, the high effectiveness suggests that system performance profits from a maximization of heat transfer rate over a minimization of heat exchanger mass. In the case of the condenser, the moderate effectiveness indicates that a minimization of air-side pressure drop is favored over a maximization of heat transfer area. The exhaust duct diameter required to house the evaporator with a square-shaped frontal area is 0.39m. This is smaller than the dimension of the tail cone where the exhaust gases exit, which is 0.4m (see Figure 1). Table 5 lists additional data related to the design of the ORC unit.

Figure 10.

CC-APU mass breakdown.

https://journal.gpps.global/f/fulltexts/204721/JGPPS-00236-2024-02.10_min.jpg
Table 5.

Results of the optimized ORC WHR system.

ParameterValueParameterValueParameterValue
ηORC,net14.9%Q˙evap426 kWQ˙cond352kW
χ81.0%X/Y/Zevap0.28/0.28/0.23 mX/Y/Zcond1.00/1.00/0.041 m
W˙ORC,net63kWmevap8.0kgmcond12.6kg
W˙fan,net6.7kWTevap,H,in865KTcond,C,in313K
mORC44kgTevap,H,out425KTcond,C,out353K
m˙fluid0.8kg/sΔpevap,H2010PaΔpcond,C513Pa
Tmin,ORC374Km˙evap,H0.9kg/sm˙cond,C8.8kg/s
Tmax,ORC548KΔTpp,evap47KΔTpp,cond32K
pmax,ORC59.5barεevap89.0%εcond51.0%
W˙pump,net9.9kWNtg160krpmηis,turb94.0%

Performance comparison

Table 6 shows a comparison of the GTCP36-300 APU with the optimized CC-APU as well as a simple-cycle APU using advanced technology. The latter case is based on the same design assumptions as the gas turbine of the CC-APU and is presented to allow a fair comparison of the benefits an ORC WHR system can give for the investigated application. The estimated fuel consumption of the CC-APU for the provision of secondary power on the ground is 42kg as opposed to 78kg when using the GTCP36-300 APU. Therefore, fuel consumption for the provision of secondary power on the ground is halved when using the CC-APU. Taking into account the increase in flight phase fuel consumption of 2 kg due to the addition of 31 kg to mOE, an overall fuel saving of 34kg, i.e., a reduction of mission fuel mass by 0.6%, is possible using the CC-APU system. The application of the advanced APU design reduces ground fuel consumption for the provision of secondary power by one-third and reduces mission fuel mass by 0.5%.

Table 6.

Comparison of the GTCP36-300 APU (Stohlgren and Werner, 1986) with an advanced APU design and the optimized CC-APU.

ParameterGTCP36-300Advanced APUCC-APU
ηAPU,net (−)18.3%27.2%33.9%
m˙fuel (kg/s)0.03170.02140.0172
W˙gross (kW)258258274
W˙net (kW)250250250
m˙air (kg/s)1.601.100.88
TIT (K)1,3101,3401,340
OPR (−)6.110.09.5
ηis,comp73.4%a82.5%82.7%
ηis,turb83.2%a86.5%85.6%
m (kg)117109148
mfuel,APU (kg)785242
mfuel (kg)5,5055,4795,471

[i] aValue estimated based on data provided in Ref. (Stohlgren and Werner, 1986).

Sensitivity of design variables: design guidelines

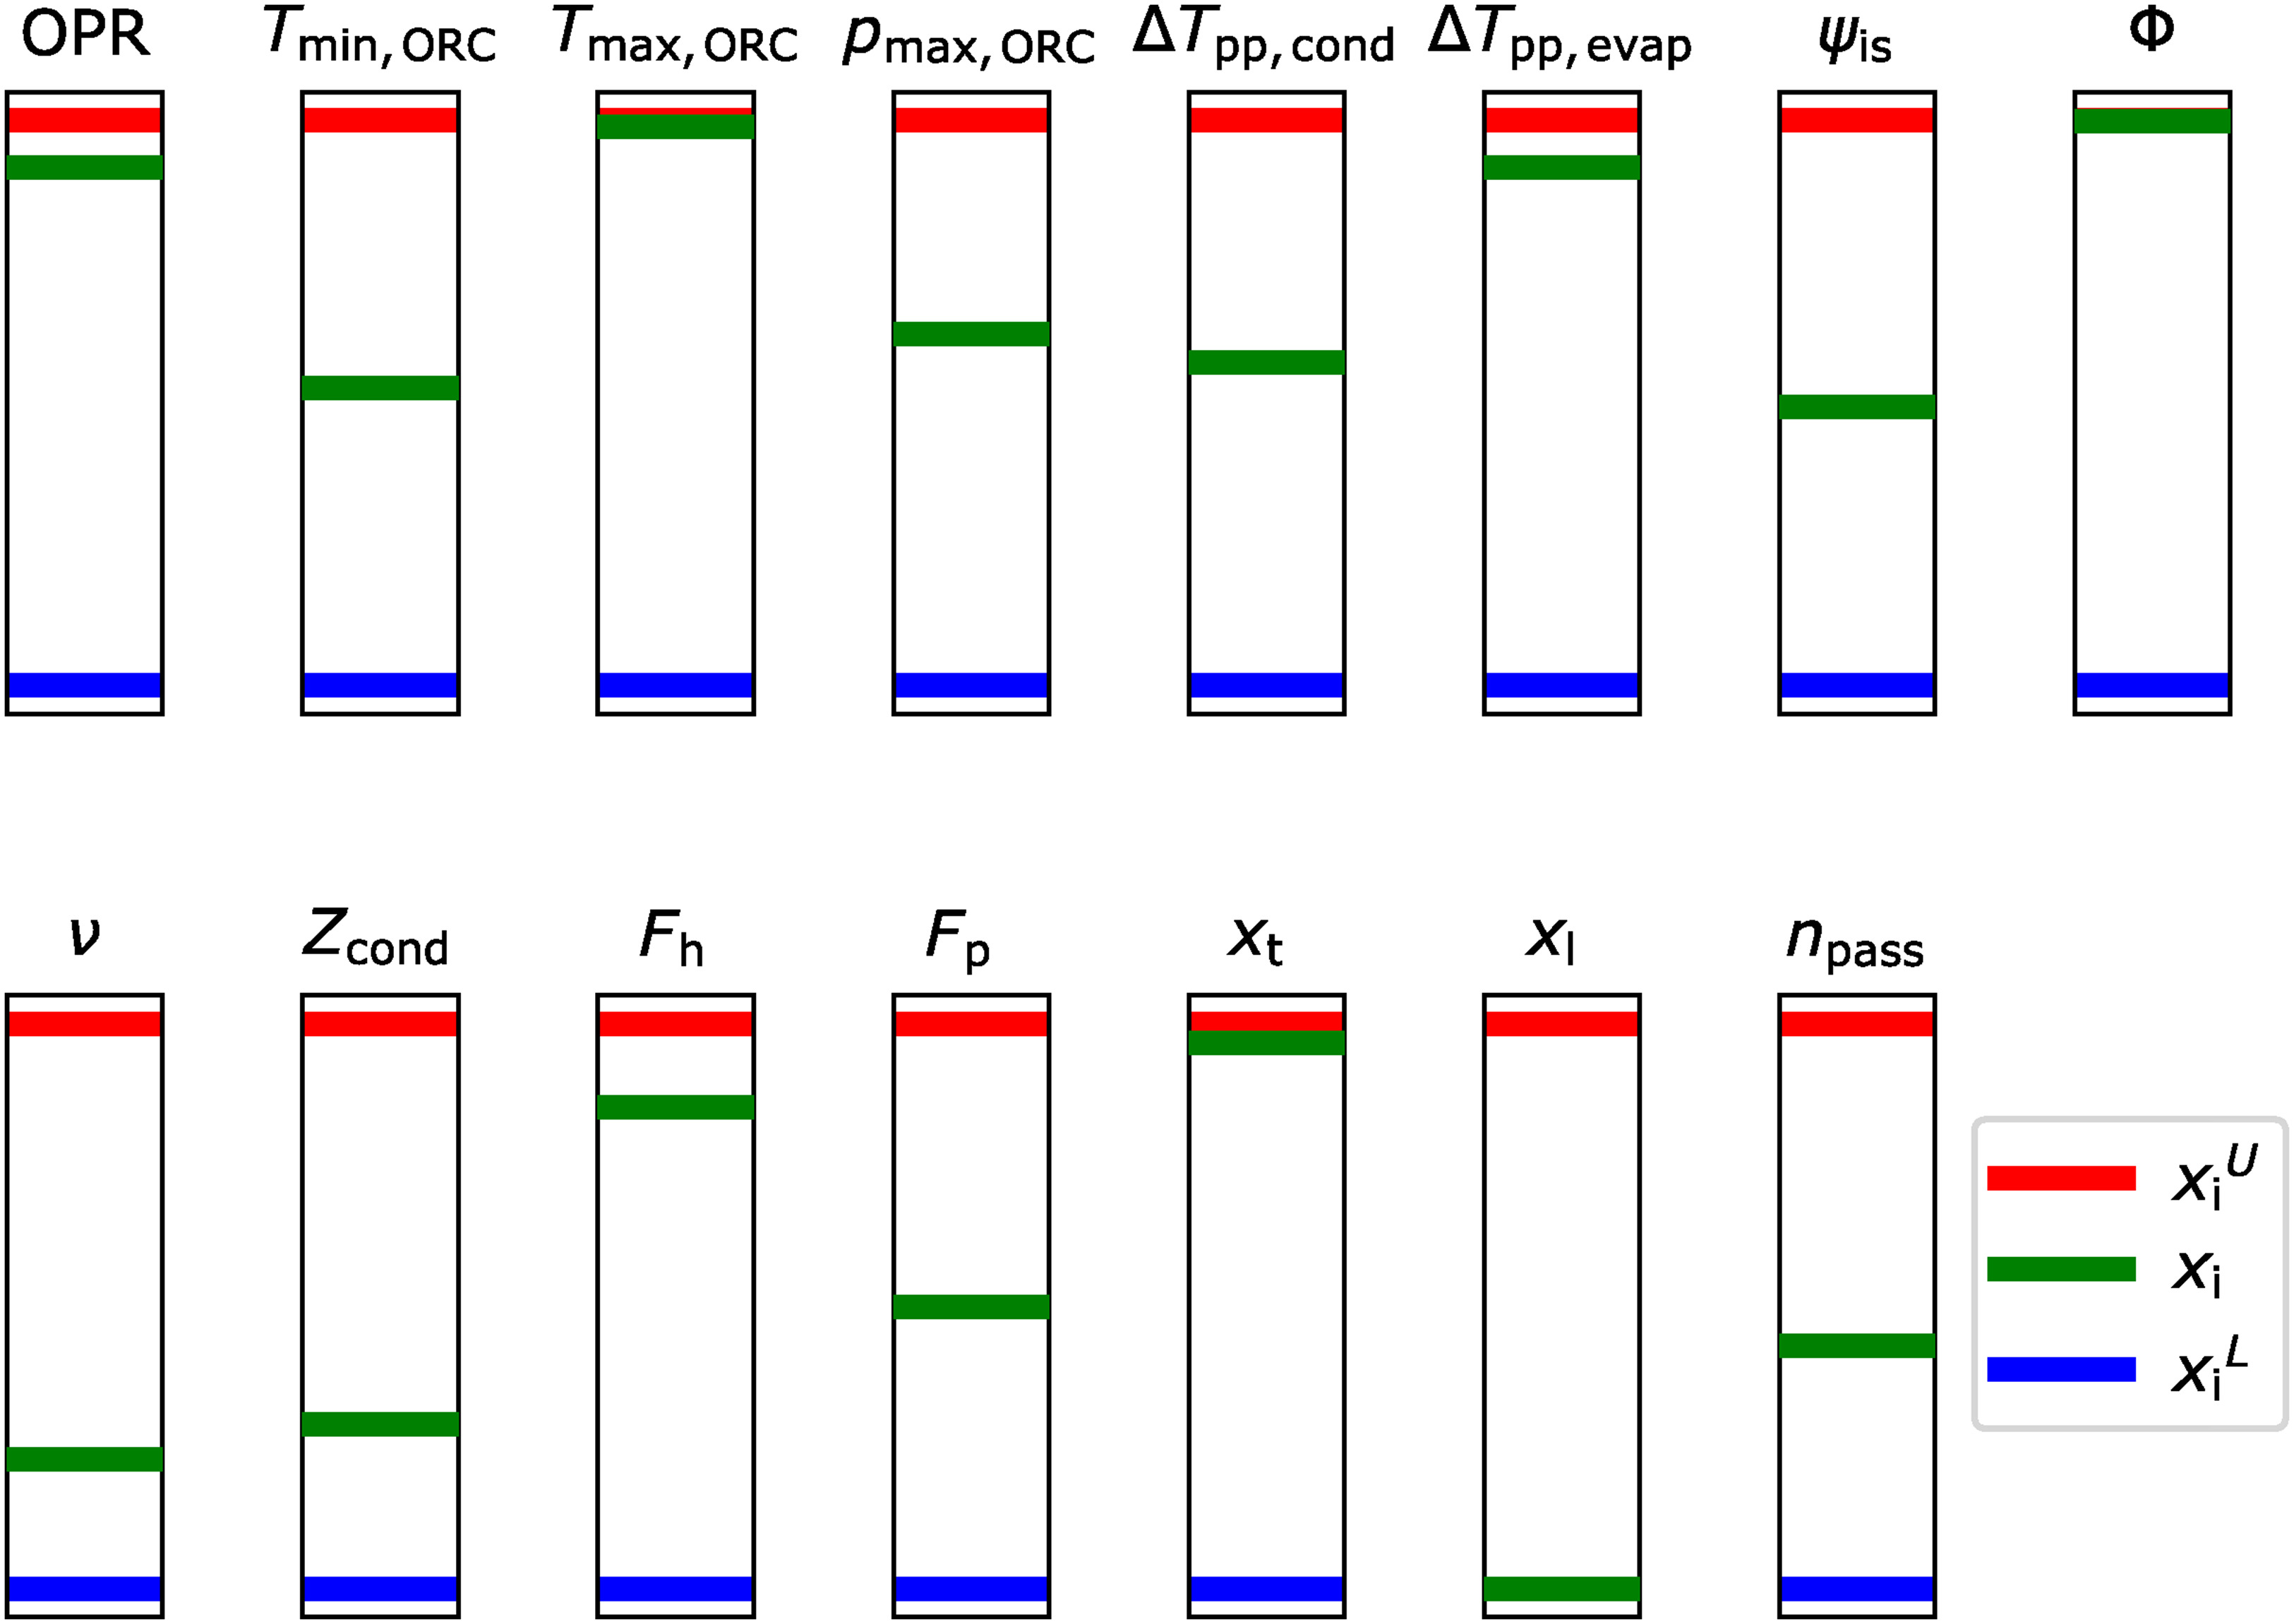
To gain a better understanding of the CC-APU design a discussion of the obtained design vector is presented. This represents a first step towards developing design guidelines for airborne ORC WHR systems. Figure 11 indicates the relation of the optimized design variable values with their respective lower and upper bounds specified in Table 1. Especially those design variables that adopt their respective upper or lower bounds are of interest. In the following, the values obtained for the individual design variables are discussed based on the underlying physical phenomena.

Figure 11.

Bar charts showing the relation of the optimized design variables xi with respect to lower bound xiL and upper bound xiU.

https://journal.gpps.global/f/fulltexts/204721/JGPPS-00236-2024-02.11_min.jpg

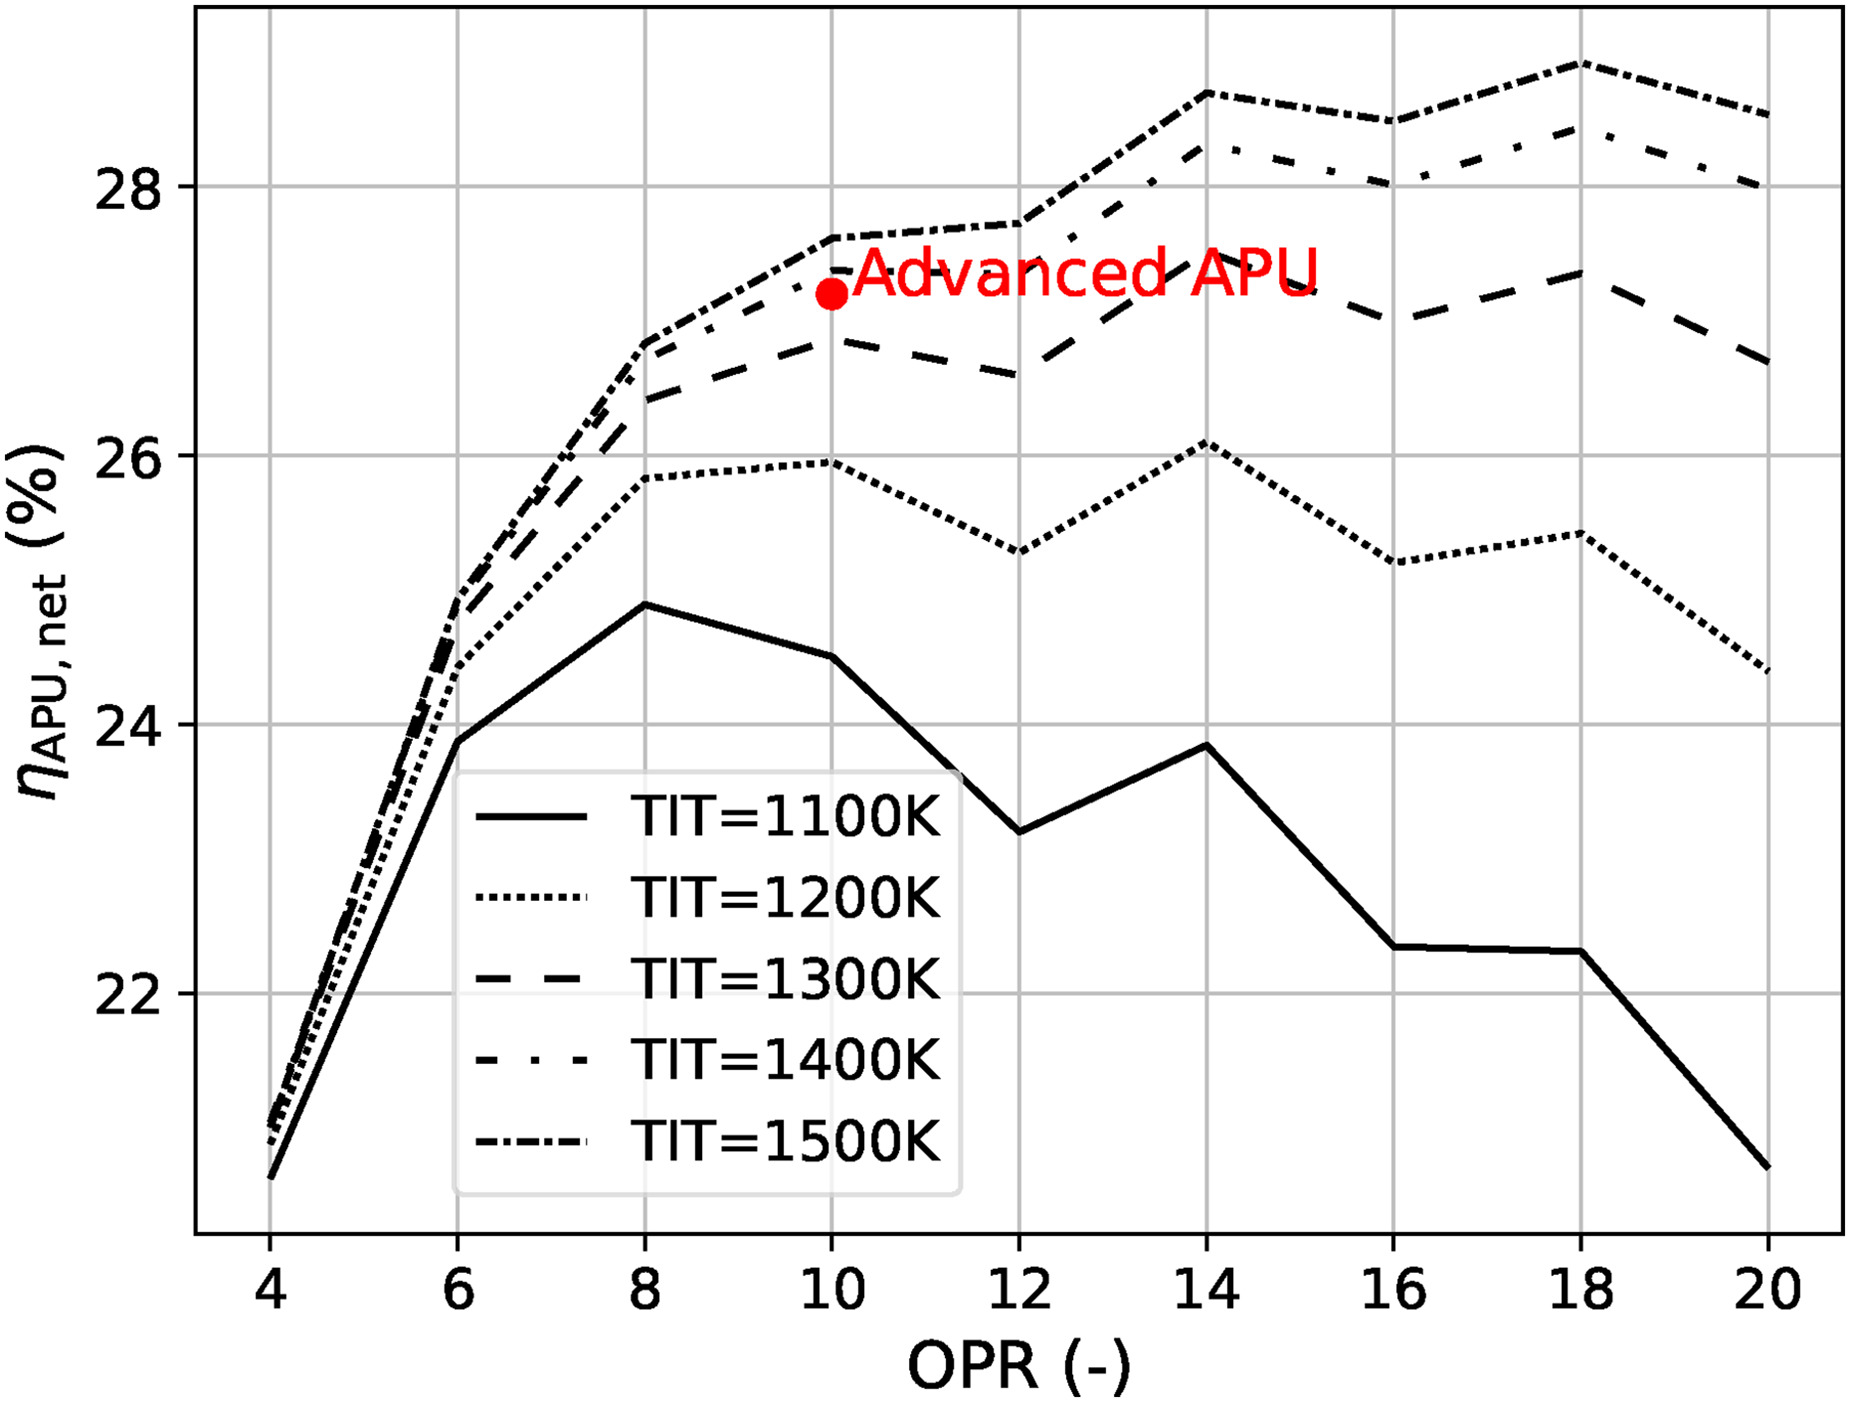
OPR and TIT are the design variables having the largest impact on gas turbine efficiency. The value of TITmax obtained for the CC-APU is only 30 K higher than the TIT of the GTCP36-300 APU which is 1,310 K (Stohlgren and Werner, 1986). The GTCP36-300 uses convectively cooled NGVs made of the material Mar-M-247, which is an early nickel-base alloy, and an uncooled radial inflow turbine whose construction material is not specified by Stohlgren and Werner (1986). The method described in Section Maximum Turbine Inlet Temperature does not apply to radial inflow turbines and, therefore, cannot be verified with the data of Stohlgren and Werner (1986). Figure 12 shows the sensitivity of TITmax to a variation of the input parameters used for the advanced APU design and provided in Section APU Design Assumptions. TITmax shows high sensitivity to the value of ν and low sensitivity to all other input parameters. Together with the thermodynamic conditions, ν determines the blade height, which affects the centrifugal stress along the blade span. Therefore, knowledge of the engine geometry is important to obtain an optimum thermodynamic design. Using statistical data based on engines with higher power capacity such as presented by Grieb (2004) may result in errors in the prediction of small gas turbine engine performance. Incorporating engine gas path and mechanical design methods can improve the accuracy of such analysis.

Figure 12.

Variation of gas turbine net efficiency with turbine inlet temperature (TIT) and overall pressure ratio (OPR).

https://journal.gpps.global/f/fulltexts/204721/JGPPS-00236-2024-02.12_min.jpg

Nevertheless, further improvements in gas turbine efficiency by increasing TIT are limited as shown in Figure 13, which gives the engine thermal efficiency as a function of TIT and OPR. The discontinuity of the presented curves results from a change in the required compressor stage number as OPR varies. The number of stages affects the stage loading which is an input for determining stage polytropic efficiency with the method explained in Section APU Model. Under the assumption of no limitations regarding blade cooling and OPR, a further increase of ηAPU,net of less than 2% is possible when designing the engine with a TIT of 1,500K and an OPR of 18.

Figure 13.

Variation of maximum turbine inlet temperature (TITmax) to a ±5% change in turbine rotor hub-to-tip ratio (ν), turbine stage loading (Ψ), turbine rotor blade tip-to-hub area ratio (dt), and radial temperature distribution factor (RTDF) with respect to the values of the optimized advanced APU design.

https://journal.gpps.global/f/fulltexts/204721/JGPPS-00236-2024-02.13_min.jpg

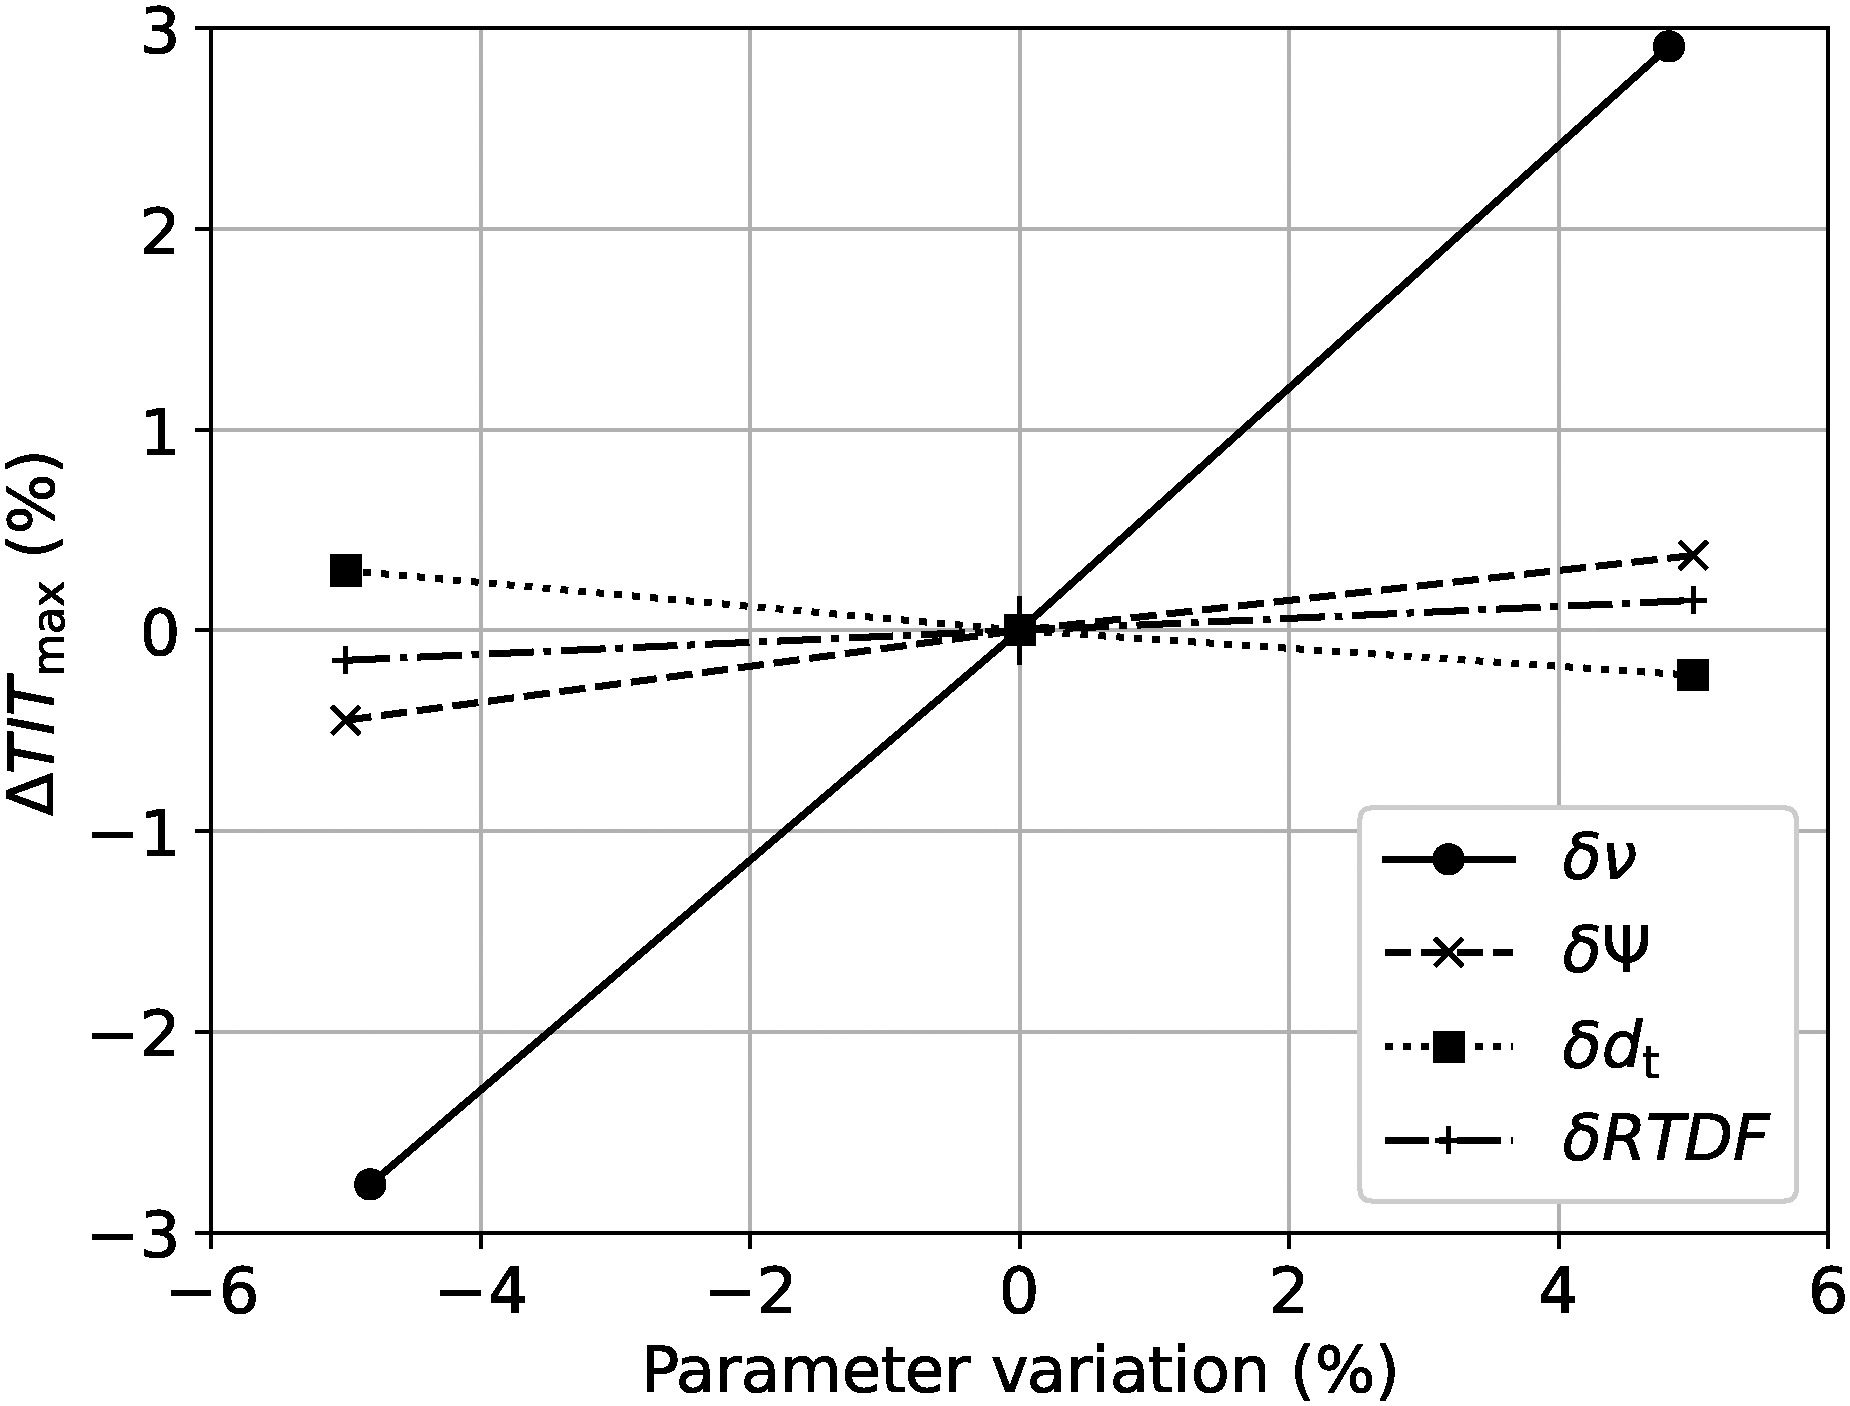
From a thermodynamic standpoint, ORC efficiency is maximized by maximizing Tmax,ORC and pmax,ORC and minimizing Tmin,ORC. Tmax,ORC has a very dominant impact on ηCCAPU and many system parameters have a large sensitivity to its value. The optimized solution adopts a value for Tmax,ORC that is at the upper bound. This indicates that despite its large influence on system design the value of Tmax,ORC can be selected based on thermodynamic considerations. Similarly, high sensitivity of system performance with respect to the value of Tmin,ORC is observed. Contrary to Tmax,ORC, the optimal value of Tmin,ORC is located approximately in the middle of the range explored in the optimization for this design variable. It follows that the selection of Tmin,ORC cannot be based solely on thermodynamic considerations but its optimal value is highly dependent on the system architecture. For example, a reduction of Tmin,ORC by 1% from its optimized value increases m˙cond,C by 20% which causes a 30% higher Δpcond,C. The combined effect leads to an increase of W˙fan,net by 60% (Equation 13). For this reason, W˙fan,net is identified as the most limiting factor of CC-APU performance. To maximize system performance it is therefore crucial to adopt an aerodynamically optimized fan. The maximum value of pmax,ORC is limited by the increasing pump power consumption which at one point counters the thermodynamic advantages of a further pressure increase. Therefore, for the selection of pmax,ORC pump power demand should be considered. At the same time, for the analyzed supercritical cycle the sensitivity of ηCCAPU to variations in pmax,ORC is low which makes the selection of pmax,ORC less critical.

Size and pressure drop constraints limit the amount of heat that can be rejected by the condenser. In the present study, only the limit on the condenser size is an active constraint, while the pressure drop is effectively limited by the penalizing effect of W˙fan,net. The optimization algorithm tends to drive the condenser design towards the maximum available frontal area to reduce flow velocity and therefore pressure drop. As expected, it is more beneficial to add heat transfer area by increasing the core width (Xcond) and varying the core parameters instead of increasing the core depth (Zcond) which linearly increases the pressure drop. Similarly, the free flow to frontal area ratio of the condenser is also minimized to reduce the channel flow acceleration and maximum velocities. This is done by reducing the number of flat-tubes, effectively driving the variable Fh, which represents the fin height, towards the imposed upper bound. Conversely, the fin pitch Fp adopts a value that seems to fall right in the middle of the imposed bounds. This is the result of a non-trivial trade-off between more heat transfer area, higher heat transfer coefficient, and less pressure drop. The pinch point temperature difference in the condenser (ΔTpp,cond) impacts the required heat transfer area as well as the cold side pressure drop. On one hand, larger values of ΔTpp,cond imply larger temperature differences between the hot and cold side, which effectively reduces the required heat transfer area and thus the size of the heat exchanger. On the other hand, larger values of ΔTpp,cond correspond to higher air mass flow rates. This results in higher flow velocities, thus negatively affecting Δpcond,C. As a result, the optimizer adopts a value of ΔTpp,cond that provides a good trade-off between these opposing trends.

As stated in Section APU Design Assumptions, gas turbine efficiency is very sensitive to the pressure loss in the exhaust duct. Therefore, the optimal evaporator design is that with the lowest possible hot side pressure drop and that still satisfies the size constraint on the core depth (Zevap). This is achieved by minimizing the intensity and size of the detached flow vortices behind each tube. The intensity of the recirculation zones is mainly affected by the local flow velocity, which is then minimized as much as possible by driving the transversal pitch xt toward the upper bound. On the other hand, the reduced vortex intensity lowers the heat transfer coefficient and increases the required heat transfer area. Contrary to xt, larger values of longitudinal pitch (xl) slightly increase both the heat transfer coefficient and pressure drop due to the re-attachment of the separated flow before the next tube (El-Shaboury and Ormiston, 2005). Since the heat transfer improvement is weaker than the pressure drop increase, xl is minimized. The number of passes (npass) settles to a value that tends to limit the total number of streamwise tubes, which linearly affects the pressure drop. On the one hand, increasing the number of passes tends to reduce the number of streamwise tubes per pass, thus increasing the working fluid velocity in the tubes and slightly increasing the overall heat transfer coefficient. On the other hand, this results in an increased pressure drop on the working fluid side. As a result, the optimal number of passes is a trade-off value between these opposing trends. Finally, the evaporator pinch point temperature difference (ΔTpp,evap) adopts the upper bound value to reduce evaporator heat load which in turn leads to lower required evaporator heat transfer area and therefore pressure drop.

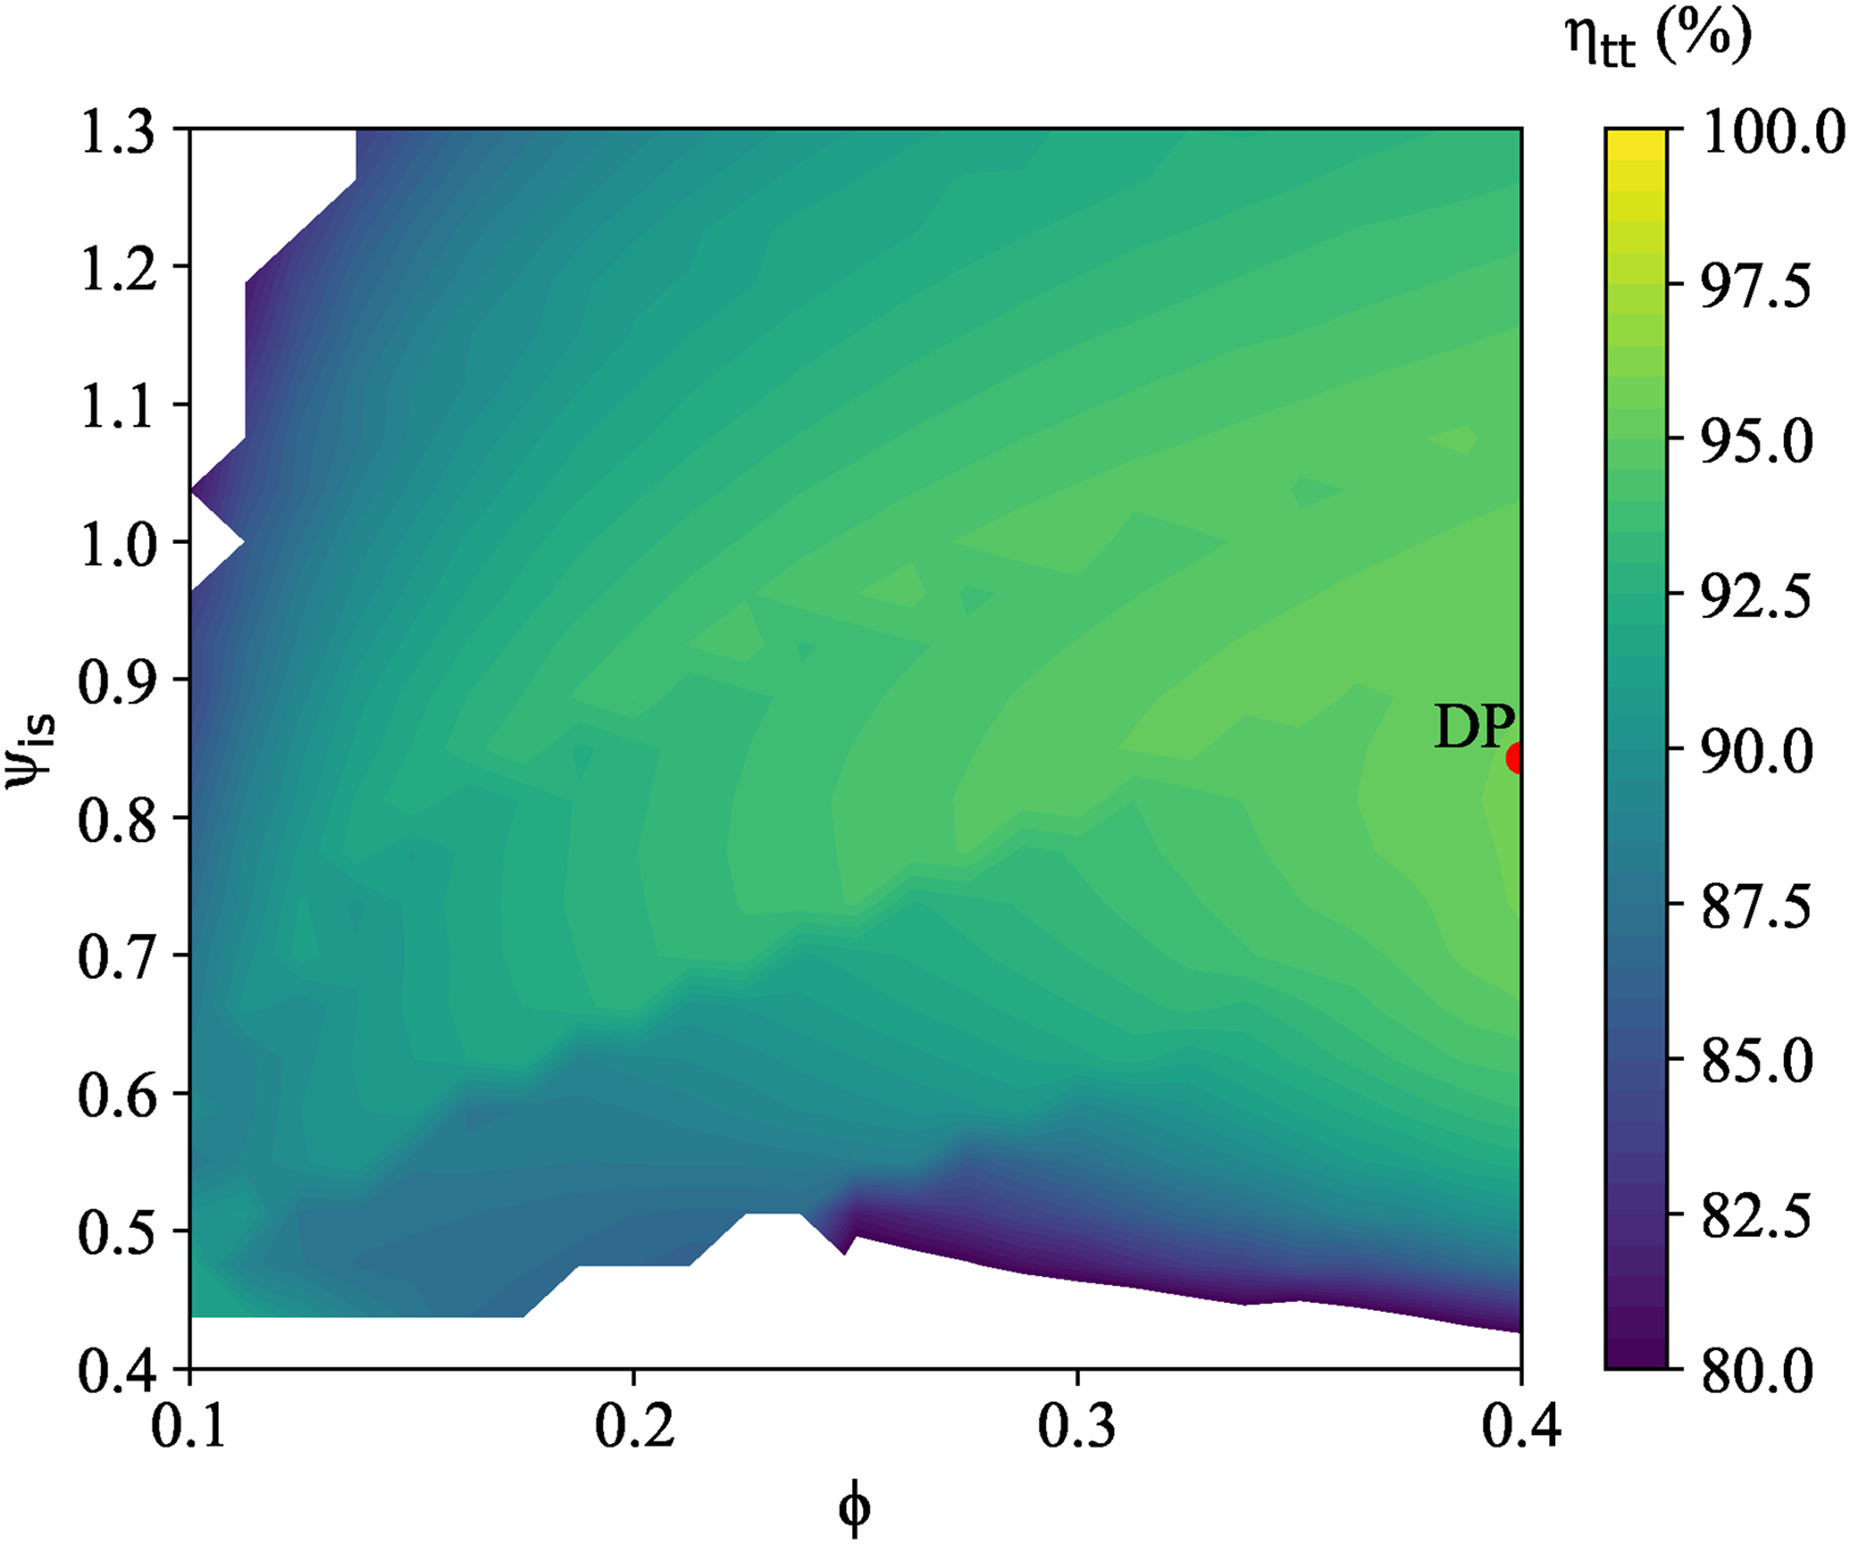
To understand the selection of the optimum ORC turbine design, the impact of varying the design variables ψis and ϕ on turbine total-total efficiency (ηis,turb) is investigated by performing a parametric study. Figure 14 shows a contour plot of ηis,turb with respect to ψis and ϕ, where ν, the turbine inflow conditions as well as the pressure ratio are kept at their respective values identified for the optimized CC-APU design. The point DP in Figure 14 indicates the optimized design point. This point also coincides with the highest mass-specific power of the turbogenerator. Furthermore, the value of the stage efficiency around point DP has rather low sensitivity to small variations in the design variables ψis and ϕ. The analysis also shows that best turbine performance is achieved with values of ν in the lower ranges, leading to lower blade deflection in the impeller for a given set of ψis and ϕ, and thus lower blade loading losses. In this work, the flow kinetic energy at the exit of the turbine diffuser is considered as being completely recovered. This is a reasonable assumption for a closed loop cycle, if one neglects the friction losses in the piping system to convert this kinetic energy into total pressure.

Figure 14.

ORC turbine total-total efficiency map as a function of duty coefficients ψis and ϕ for fixed inflow conditions, pressure ratio and hub-to-tip ratio (ν).

https://journal.gpps.global/f/fulltexts/204721/JGPPS-00236-2024-02.14_min.jpg

In general, it is observed that pressure drops on the ORC working fluid sides of the heat exchangers have little impact on overall system performance. Furthermore, due to the imposed HEX size and pressure drop constraints, the optimal pinch point temperature differences are higher than commonly applied for ORC WHR systems of stationary applications. For stationary applications, depending on the component, pinch point temperature differences in the range of 510C are commonly adopted, as for example reported in Ref. (Krempus et al., 2023).

A summary of design aspects derived from the optimized CC-APU design, that can inform future work on combined-cycle gas turbine engines employing ORC WHR systems, is given in the following list:

  • System performance benefits from selecting the highest possible value of Tmax,ORC.

  • System performance is less sensitive to pmax,ORC. Its value can be selected based on engineering judgement.

  • ORC turbine maximum total-total efficiency coincides with maximum mass-specific power and design variables should be selected accordingly.

  • To limit condenser cold side pressure drop, the condenser design should employ the largest possible frontal area in combination with a minimized number of flat-tubes.

  • To limit evaporator hot side pressure drop, an in-line bare-tube-bundle evaporator design should employ a large transversal pitch and a low longitudinal pitch. The magnitude of the pitches may be dictated by the validity range of the applied heat transfer and pressure drop correlations.

  • Employing an aerodynamically optimized fan is crucial to achieve maximum performance.

Methodology limitations

Steps 1) to 3) of the method to estimate T¯b,max (Section Maximum Turbine Inlet Temperature) is based on the assumption that the turbine operates at a single operating point over its lifetime. In the case of an aircraft APU, this assumption is reasonable. However, in the case of gas turbine engines with a wider operating range, blade creep strain varies between operating points. An analysis considering the thermal conditions and operating times encountered during the entire mission is required to determine blade lifetime for an allowable total strain. However, the presented method can still be used if the equivalent blade life resulting in the allowable strain at a given operating point is known. For example, Halila et al. (1982) state that the strain accumulated over the entire mission life of 18103 hours is equivalent to operating the turbine for 250 h at hot-day take-off conditions. In this case, 250 h can be used as input to determine T¯b,max.

The estimation of system mass presents the largest factor of uncertainty. The current methodology is limited to using an empirical correlation for gas turbine mass estimation. This aspect will be improved in a future version of the ARENA framework by integrating a component-based engine mass estimation tool currently under development (Boersma, 2022; Verweij, 2023). The mass of the ducting related to the ORC system, the APU, and condenser air intakes is currently not modeled. Moreover, estimating the mass of the structural elements required to integrate the system with the aircraft is difficult to model at the conceptual level.

The impact of the CC-APU assembly on aircraft aerodynamics is not modeled in the present analysis. Considering the large size of the condenser its air intake must be closed off during flight using a hatch to prevent additional drag during cruise. Similarly, the air intake of conventional APUs is closed during flight. For example, Figure 1 depicts the APU air intake hatch in the bottom of the tail cone in the open position.

Conclusions

In this work the application of an organic Rankine cycle (ORC) waste heat recovery (WHR) system to an aircraft auxiliary power unit (APU) is investigated using a multidisciplinary simulation framework. An optimal design for the combined-cycle APU (CC-APU) system for the provision of secondary power during ground operations is identified using a genetic algorithm. The objective is the minimization of mission fuel mass based on the variation of 15 design variables. It is shown that the CC-APU can attain an overall efficiency of 34%, 7% more than an advanced simple-cycle APU design with an efficiency of 27%. However, this comes at the expense of a relative increase in system mass of the CC-APU of 35% when compared to the advanced simple-cycle APU. Compared to using a current-day APU, the use of the CC-APU system consumes half the fuel mass required to provide secondary power on the ground. For a short-range aircraft, the optimal CC-APU leads to a mission fuel mass reduction of 0.6% compared to a current-day APU and 0.1% compared to an advanced simple-cycle APU. Fan power consumption in combination with condenser air-side pressure drop is identified as the main limiter of CC-APU performance. In this regard, the minimum ORC working fluid temperature Tmin,ORC is the most critical design variable of the system. Additionally, size constraints imposed on the condenser further constrain the achievable thermodynamic efficiency. The large size of the condenser indicates that the integration of a CC-APU would require substantial modifications to the airframe. The identified ORC WHR unit design is in contrast to conventional designs used for stationary applications. Stationary combined-cycle power units are designed with the objective of maximizing power output, while for the airborne ORC WHR unit of a low power-capacity gas turbine, maximizing ORC thermodynamic efficiency is the optimal strategy. This is achieved with a supercritical ORC configuration. Additionally, as a result of size and mass constraints, the values of minimum ORC operating temperature and heat exchanger pinch point temperature differences optimal for airborne ORC WHR applications substantially differ from those conventionally adopted in stationary systems. Based on the analysis of the obtained optimal solution, a first set of design guidelines for airborne ORC WHR systems is presented. These findings will allow for a refined selection of design variables in future optimization studies.

While this work only considered the operation of the CC-APU to provide the secondary power demand of a current-day aircraft, other use scenarios of such a system can be envisaged. For example, advantages could be derived from operating a CC-APU during flight to provide secondary power. This way the main engines of the aircraft can be relieved from the task of providing secondary power during some flight conditions. This could result in a simplification of their design or operational advantages. Another ground-based application may be the provision of electrical power for electric taxiing concepts that are in active development. A secondary advantage not investigated in this work could be the reduction of jet noise resulting from decreased exhaust velocity and temperatures.

Future studies will include the application of ORC WHR systems to large turboshaft engines of turboelectric and hybrid-electric powertrains. Furthermore, a detailed investigation of the optimal ORC working fluid for the application at hand is required. It is also worth investigating different alternatives for ORC turbine power utilization, such as mechanically coupling the ORC turbine shaft with the shaft of the gas turbine. This could potentially result in system simplification and weight reduction.

Nomenclature

Acronyms

APU

Auxiliary power unit

ORC

Organic Rankine cycle

WHR

Waste heat recovery

EIS

Entry into service

CC-APU

Combined cycle APU

HEX

Heat exchanger

LMP

Larson-Miller parameter

RTDF

Radial temperature distribution factor

TBC

Thermal barrier coating

NGV

Nozzle guide vane

PFD

Process flow diagram

RIT

Radial-inflow turbine

PM

Permanent Magnet

TSFC

Thrust specific fuel consumption (mg/Ns)

TIT

Turbine inlet temperature (K)

OPR

Overall pressure ratio (−)

LHV

Lower heating value (MJ/kg)

SOT

Stator outlet temperature (K)

Greek symbols

ρ

  Density (kg/m3)

ν

  Hub-to-tip ratio APU turbine first stage (−)

ν

  Hub-to-tip ratio ORC turbine (see definition below) (−)

σr

  Blade root stress (MPa)

η

  Efficiency (−)

Π

  Pressure ratio (−)

Ψ

  Stage loading APU turbine (see definition below) (−)

ψis

  Isentropic stage loading ORC turbine (see definition below) (−)

δ

  Stator-rotor air gap size ORC generator (m)

Ω

  Rotational speed ORC turbogenerator (rad/s)

ϕ

  Flow coefficient ORC turbine (−)

Roman symbols

A

area (m2)

m

Mass (kg)

m˙

Mass flow rate (kg/s)

p

Pressure (Pa)

T

Temperature (K)

T¯

Average temperature (K)

h

Specific enthalpy (J/kg)

s

entropy (J/kgK)

Q˙

Heat flow (W)

W˙

Power (WW)

m˙red

Reduced mass flow rate (kg/s)

U

Velocity (m/s)

X

HEX core width (m)

Y

HEX core height (m)

Z

HEX core depth (m)

xi

Design variable (−)

xiU

Design variable upper bound (−)

xiL

Design variable lower bound (−)

F

Mean logarithmic temperature difference correction factor (−)

d

Tube diameter (m)

Ny

Number of flat tubes (−)

nmc

Number of microchannels within a flat-tube (−)

Fh

Condenser fin height (m)

Fp

Condenser fin pitch (m)

tf

Condenser fin thickness (m)

Lp

Louver pitch (m)

Ll

Louver length (m)

Lα

Louver angle (rad)

wmc

Flat-tube microchannel pitch (m)

tmc

Flat-tube microchannel wall thickness (m)

hmc

Flat-tube height (m)

xt

Evaporator non-dimensional transversal pitch (−)

xl

Evaporator non-dimensional longitudinal pitch (−)

npass

Evaporator number of passes (−)

Tt,3

Combustion chamber inlet temperature (K)

Tt,5

Engine exhaust total temperature (K)

pt,5

Engine exhaust total pressure (Pa)

pt,9

Nozzle exit total pressure (Pa)

m˙0

Engine inlet air mass flow rate (kg/s)

m˙5

Engine exhaust mass flow rate (kg/s)

K

Turbine blade linear taper ratio (−)

dt

Turbine blade tip to hub area ratio (−)

tb,life

Turbine blade lifetime (h)

Tmax,fluid

Thermal stability limit of fluid (K)

AN2

Mechanical design parameter (m2/mm2)

Um

Rotor circumferential speed at meridional plane (m/s)

Re

Reynolds number (−)

ΔW˙

power loss (W)

Rc,0

Volute centerline radius at inlet section (see definition below) (−)

V

Absolute velocity (m/s)

R

Radius (m)

Cp

Pressure recovery coefficient (−)

Lr

ORC generator rotor length (m)

Rr

ORC generator rotor outer radius (m)

Bs

Magnetic flux density (T)

Js

Electric current density (A/mm2)

Cf

Friction coefficient (−)

W˙w

Turbine windage loss (W)

Subscripts

0

 ORC turbine volute inlet

1

 ORC turbine stator inlet

2

 ORC turbine stator outlet

3

 ORC turbine impeller inlet

4

 ORC turbine impeller outlet

5

 ORC turbine diffuser diffuser outlet

C

 Cold side fluid

H

 Hot side fluid

OE

 Operating empty

PL

 Payload

amb

 Ambient

exh

 Exhaust

t

 Stagnation condition for thermodynamic properties

st

 Stage

pp

 Pinch point

b

 Turbine blade

evap

 Evaporator

cond

 Condenser

turb

 Turbine or turbulent flow

mot

 Electric motor

th

 Thermal

ref

 Reference condition

min

 Minimum

max

 Maximum

abs

 Absolute reference system

rel

 Relative reference system

is

 Isentropic

cc

 Combustion chamber

comp

 Compressor

crit

 Critical point

mech

 Mechanical

gen

 Generator

θ

 Tangential

m

 Meridional

tt

 Total-total

ts

 Total-static

el

 Electrical

root

 Turbine blade root

tg

 Turbo generator

i

 Inner

o

 Outer

lam

 Laminar flow

ml

 Mean logarithmic

Definitions

Ψ=2Δht,stUm2

Stage loading APU turbine (−)

ψis=Vθ3U3νθ4U3=ΔhttU32

Isentropic stage loading ORC turbine (−)

ϕ=Vm3/U3

Flow coefficient ORC turbine (−)

m˙red=m˙Tin/Tambpin/pamb

Reduced mass flow rate (kg/s)

Reδ=ρairRrΩδμair

Reynolds number based on gap size of the ORC generator (−)

Rc,0=R1+A0π

Volute centerline radius at inlet section (−)

ν=Rm4R3

Hub-to-tip ratio ORC turbine (−)