
Introduction
Aircraft and engine manufacturers as well as policymakers need to focus on the economic and the environmental impact of air traffic, due to the expected strong growth in air traffic, in order to reach the specific objectives of the Advisory Council for Aeronautics Research in Europe (Kallas and Geoghegan-Quinn, 2011). Hence the aim in the development of new aircraft engines is to improve the overall engine efficiency e.g. by increasing the engine bypass ratio. Certain constraints must be observed here, e.g. cruise drag, which is directly coupled to the nacelle diameter, aerodynamic and aeroacoustic factors, which limits the maximum tip speed. A promising concept of such a high bypass ratio engine is the Geared Turbofan (GTF) with a bypass ratio of up to 18. With this technology fuel consumption and noise emissions can be reduced drastically (Riegler and Bichlmaier, 2007).
The side effect of increasing the bypass ratio and thus decreasing the fan pressure ratio is that the fan system becomes more susceptible to perturbations of the incoming flow. A consequence could be the stalling of the fan, which would make a safe operation of the engine impossible. For this reason the interaction between the performance of the fan and the intake flow, especially under off-design conditions, is of major interest. A typical off-design condition is the occurrence of crosswind, especially in the starting phase of an air plane. Several experimental and numerical investigations deal with either fan aerodynamics or nacelle aerodynamics. Only few studies are concerned with the interaction of both. Therefore the objective of the PTF is to provide a combined research setup, including both: wind tunnel capabilities and an operating fan rig. As a result, the fan system can be tested in combination with a representative intake geometry at most critical operation points that occur during flight (Krone and Friedrichs, 2014). An essential question here is whether it would be possible to reproduce an intake separation pattern and thus to generate representative flow for the downstream fan stage in atmospheric wind tunnels. Given that this facility represents an innovative concept, an extensive validation process, both numerical and experimental, is necessary to show the comparability of wind tunnel experiments and experiments under real flight conditions. As a first step the validation process was carried out using the LARA-intake. It has been developed within the work on Hybrid Laminar Flow technology (HLF) in cooperation by Rolls-Royce, Snecma, Hispano-Suiza, ONERA and the DLR (Lecordix, 1996) and has already been investigated by ONERA (Raynal, 1994) in detail providing a well-suited database for experimental validation of the test facility. Furthermore, the LARA-intake is still subject to several numerical and experimental studies with regard to distorted intake flow of the nacelle and fan. (Colin et al., 2007a) conducted extensive numerical research on the LARA-intake under pure crosswind flow. Their research included the ability of different RANS models to predict the correct flow behaviour of the intake flow under crosswind conditions, which is mainly driven by the correct prediction of the flow separation and reattachment process of the boundary layer. The authors also showed the necessity of using a transition model which incorporates laminar boundary layers and its transition to turbulent flow. (Hall and Hynes, 2006) investigated a hysteresis phenomenon with a scaled model of a fan and intake under crosswind conditions. Such a hysteresis of the separated flow region is achieved by running a series of tests with decreasing crosswind angles followed by increasing the crosswind angle again in combination with increasing the mass flow rate through the nacelle with the starting point being a separated intake flow or decreasing the mass flow rate with the starting point being an attached intake flow. Thereby, differing flow patterns for the same operating point develop. Several influences on the hysteresis region and thus the intake flow was examined. Amongst others the influence of the Reynolds number, stream-tube contraction ratio and ground clearance were analysed. It was shown, that while increasing the crosswind angle, the flow separates at a much larger value of the crosswind angle α than for the reattachment while decreasing the crosswind angle. Since the Reynolds number seems to have a considerable effect on the intake flow, some past work was dedicated to its effects on intake performance. For example, (Younghans et al., 1982) showed, that an increased Reynolds number leads to a greater resistance to flow separation and overall lower losses.
As a first step a validated numerical setup has been generated using discrete measuring points of the PTF LARA campaign as well as the pressurized ONERA data set. In a second step the Reynolds number effect has been pointed out via the distortion coefficient of the fan face as well as the isentropic Mach number at the lip. Furthermore, the sensitivity of the crosswind angle and Reynolds number on the numerical predictability of the experimental validation results as well as the observed separation hysteresis will be shown and discussed in detail. Following this a detailed analysis of the discovered hysteresis effect has been done. So far, neither an established theoretical basis for analysing the aerodynamic behaviour of the separation hysteresis nor the ability of the RANS turbulence and transition models exists. This leads to further numerical and experimental investigations in this paper on the aspirated LARA-intake under pure crosswind conditions to give deeper insight to the aerodynamic behaviour of a separated intake under crosswind conditions.
Experimental setup
The facility layout of the PTF represents an atmospheric wind tunnel (Eiffel-configuration). As seen in Figure 1, the flow is sucked in via the inlet tower and is redirected by the corner vanes. Screens and a honeycomb improve the flow quality before it enters the test section, where the test vehicle is located. In total eight blowers are generating a maximum headspeed corresponding to
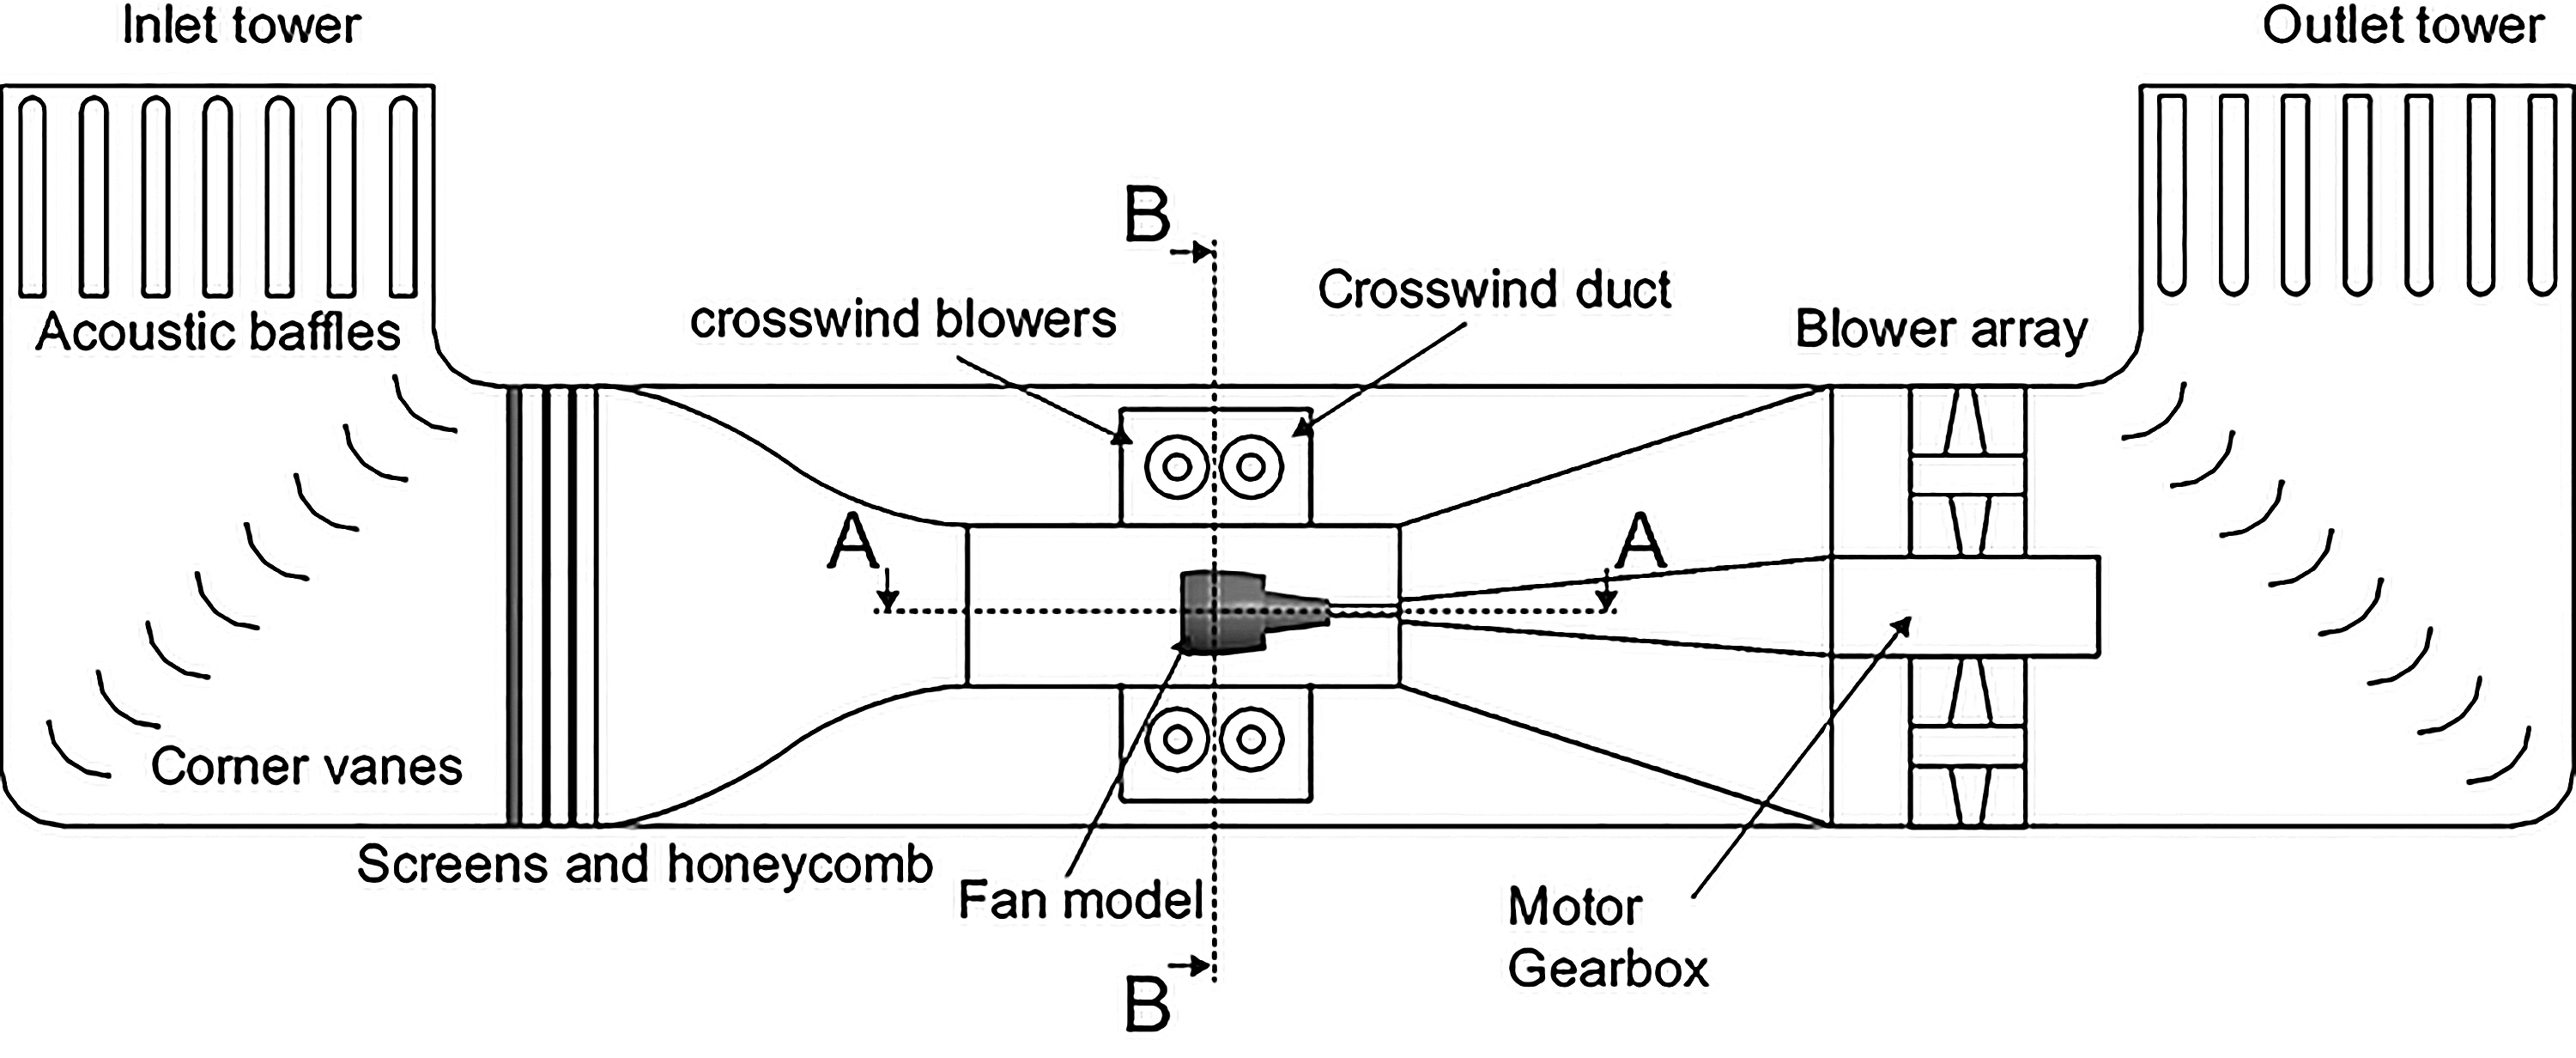
In order to induce an angle of attack to the flow or create pure crosswind conditions, the test section is surrounded by a circumferential crosswind duct. At the crosswind outlet the flow is divided. As seen in Figure 2, half of the mass flow is guided above and the other half below the test section. The whole crosswind duct is powered by four blowers in total. At the crosswind inlet the streams are merged together before the flow is smoothened by screens and honeycombs. The test vehicle itself is not pitchable.

To generate an intake distortion, the incoming crosswind creates a blocking effect which deflects the main flow. As a result, the test section headwind has an angle of attack with respect to the fan model's rotation axis during crosswind operation. To preserve flow quality, the crosswind mass flow itself and the shear layer are not entering the intake model (Krone and Friedrichs, 2014). By changing the ratio between the headwind and crosswind mass flow, the angle of attack can be varied continuously without any steps.
The Aspirated-Intake-Rig (ASI-Rig) has been designed to test aspirated intakes without a main flow component (Krone et al., 2019). As a consequence of the atmospheric conditions, the flow through the nacelle needs to be generated by an aspirating fan using the power of the main shaft. This fan is located further downstream to prevent interaction with the nacelle flow. The distortion at the fan face of the LARA nacelle is measured by using a measuring section. Six long and six short rakes are located circumferentially around the hub cone. To resolve boundary layer effects, the distance between the total pressure probes towards the wall is shortened.
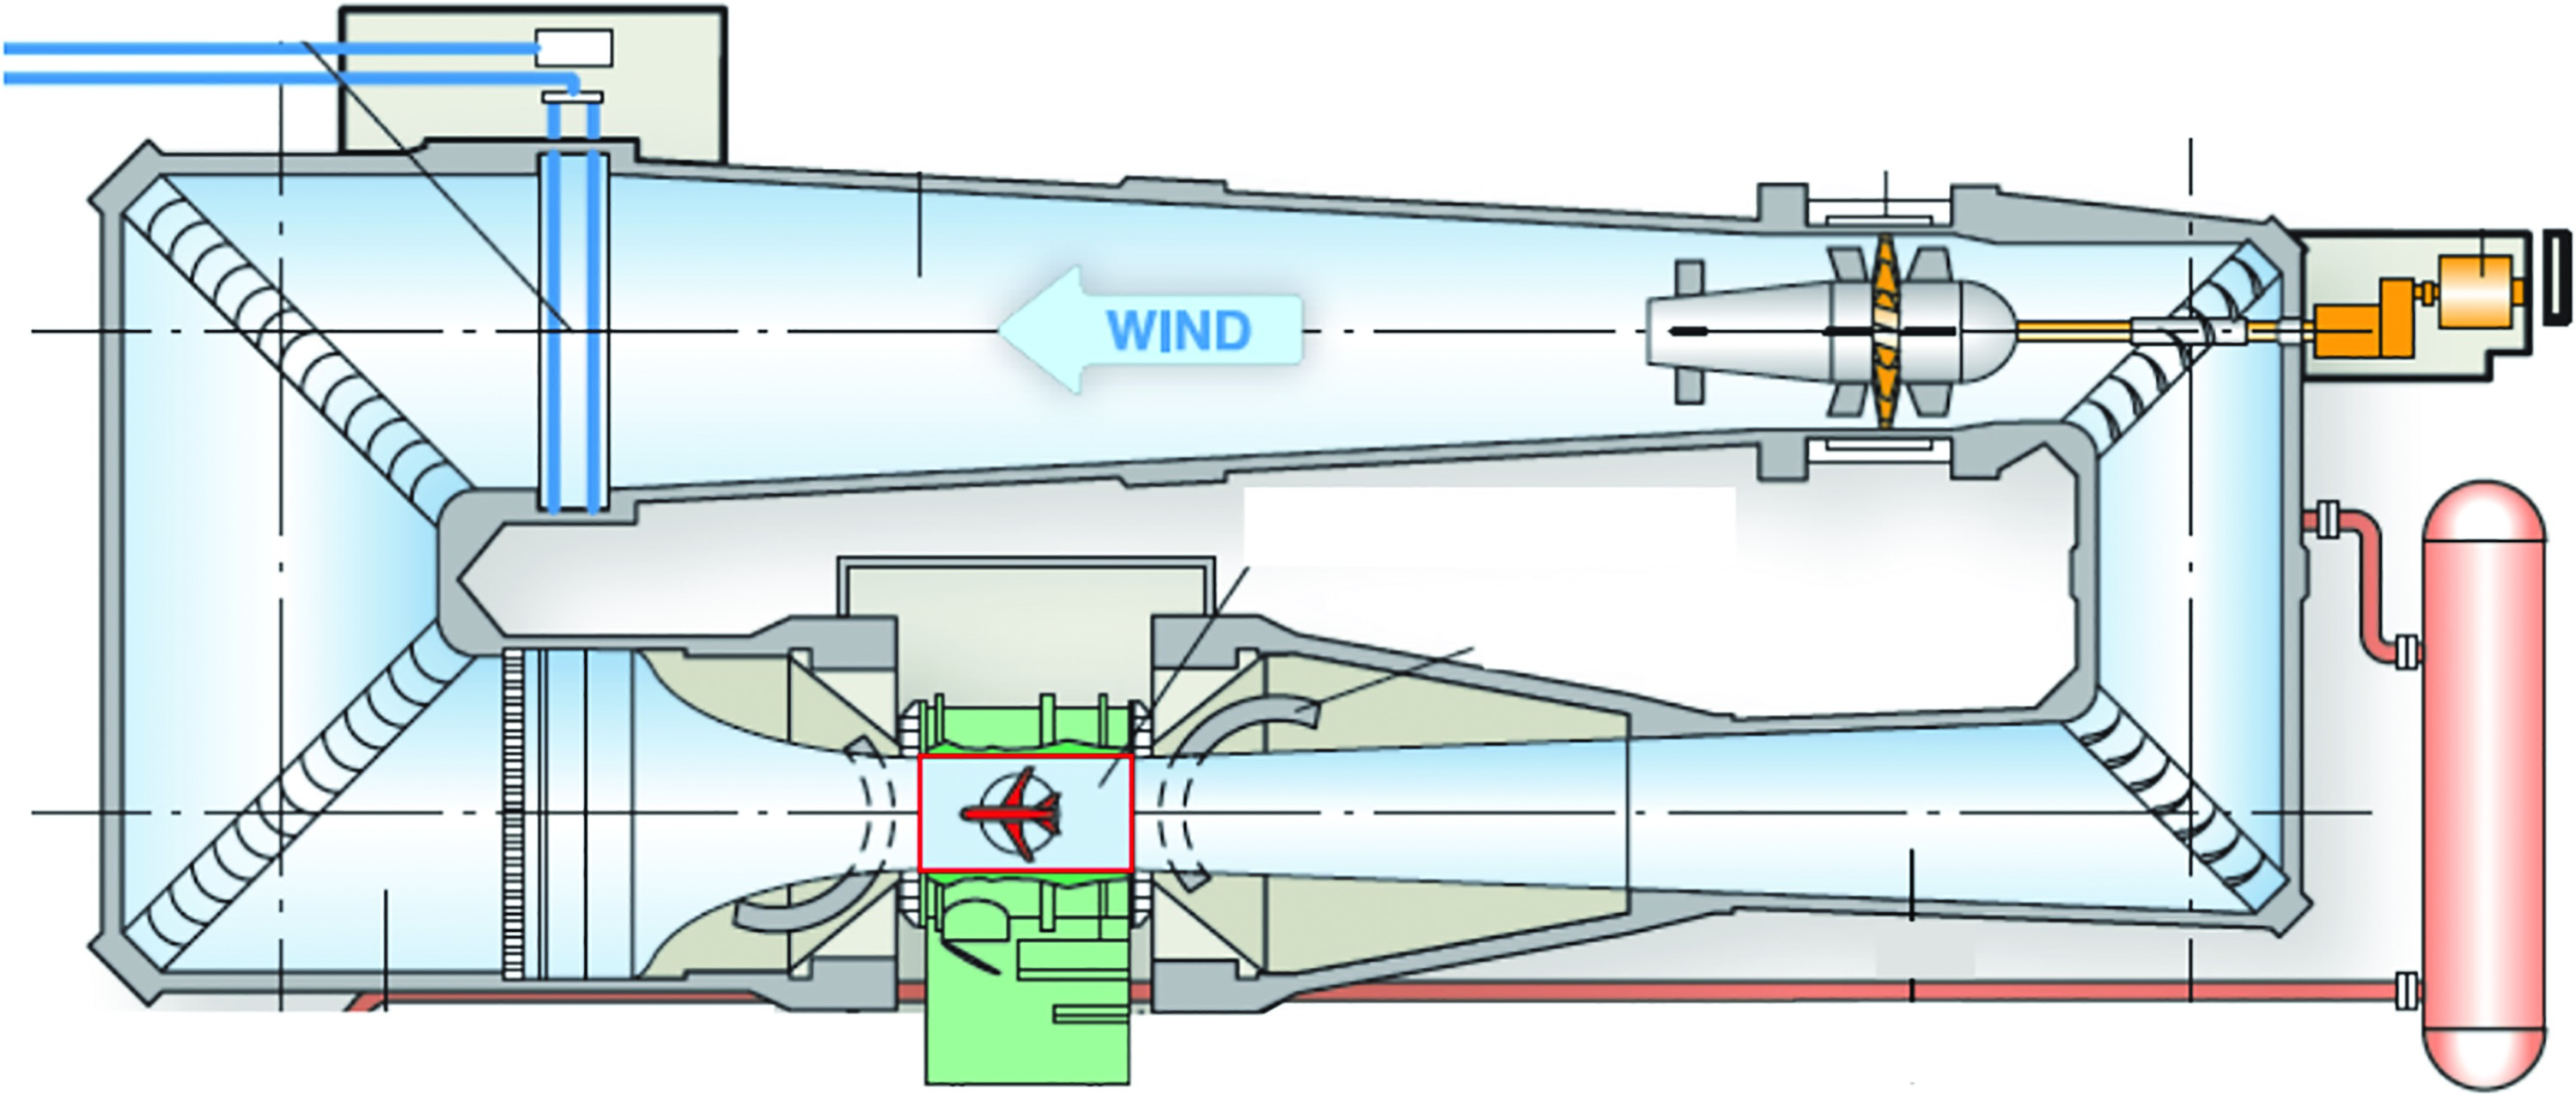
Compared to the PTF wind tunnel, the ONERA F1 wind tunnel, in Le Fauga, is a closed loop, pressurized wind tunnel that can operate up to an ambient pressure of 3.85 bar, it is capable of independently varying the Mach and Reynolds numbers, in order to operate at realistic flight conditions. In contrast to the PTF the F1 tunnel has just one main blower. Therefore, the incoming flow angle can only be set geometrically by pitching the whole nacelle in the test section. For through-flow nacelle tests, the static pressure gradient between the test section and ambient is used to drive the flow through the nacelle to the outside environment. Figure 3 shows the cross section of the tunnel.
Evaluation planes
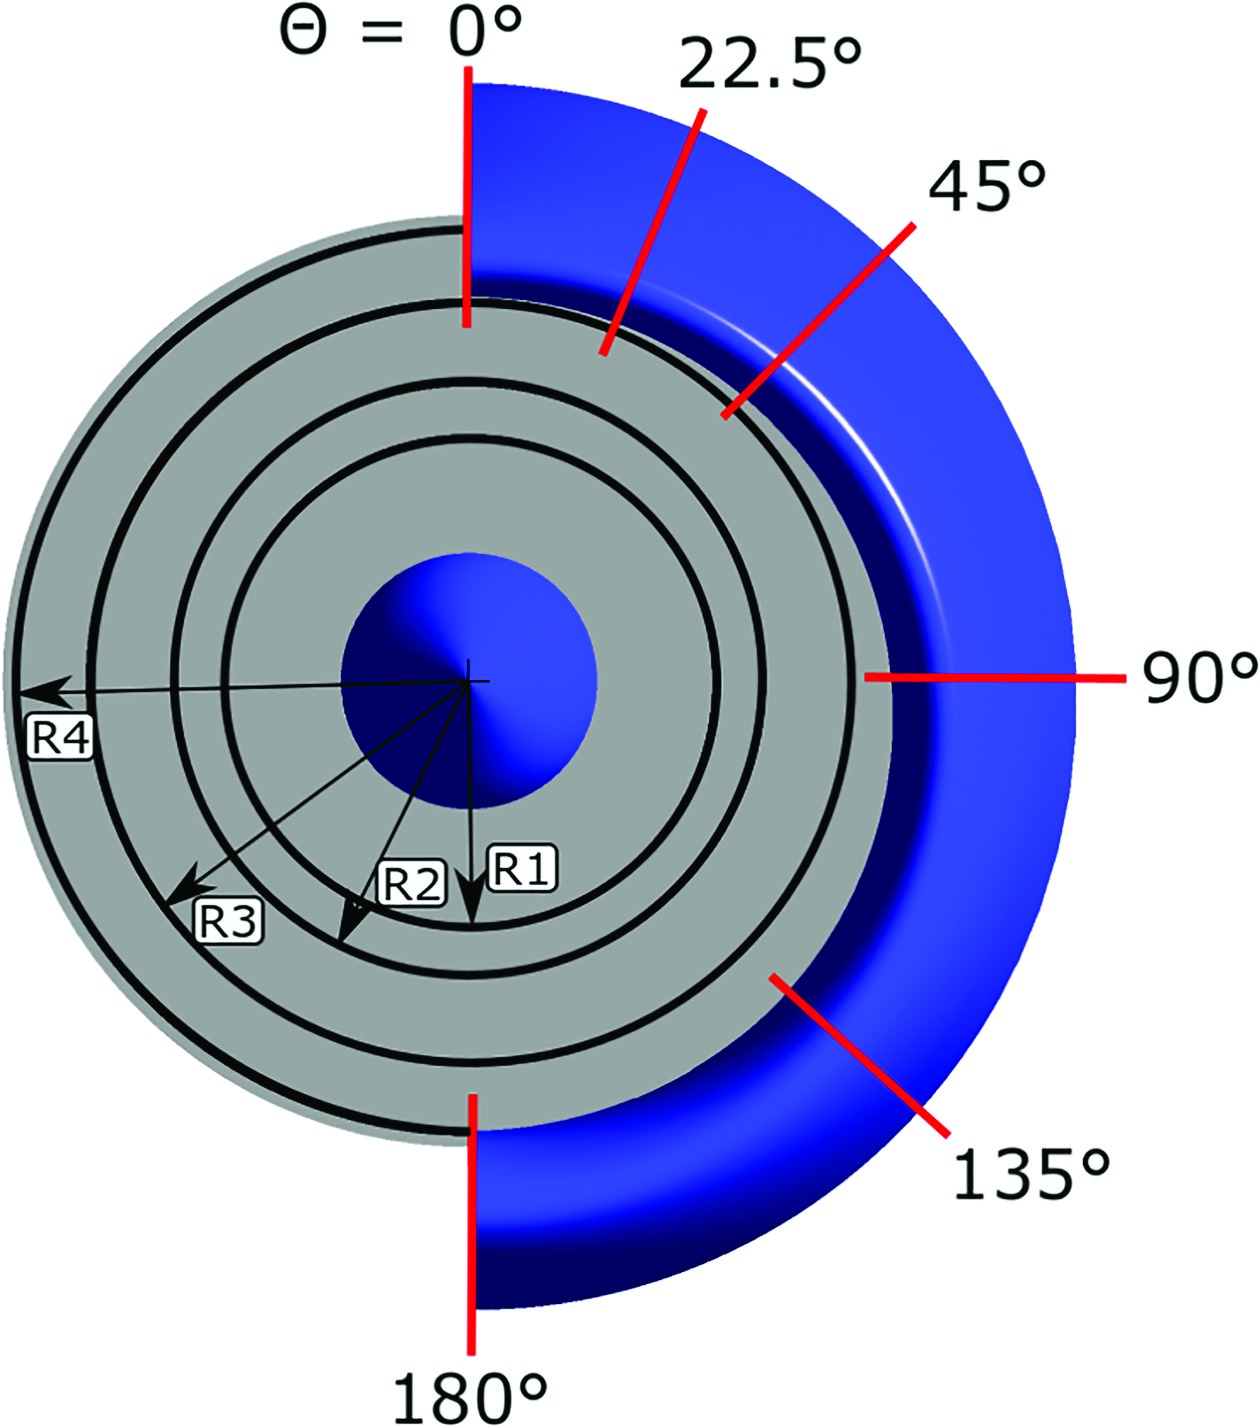
The evaluation planes are shown in Figure 4 and cover the windward side of the nacelle and the fan plane. Along the nacelle contour the surface pressure is evaluated at six different sections. The total pressures on the fan face were evaluated along four different radii, ranging from 50% to 98% of the radius the fan face.
The results were plotted using the following parameters. The pressure distributions were evaluated by using the isentropic Mach number
A parameter to analyse the intake distortions of the fan face is the Distortion Coefficient
In this equation
Additionally, the total pressure distribution on the fan face plane is evaluated along the radii shown in Figure 4. The considered parameter is ξ which is the ratio of the local total pressure to the averaged total pressure on the fan face plane.
Numerical setup
The experimental results of both the through-flow setups of PTF and ONERA, are used to establish a suitable numerical setup for validation purpose and to investigate the capability of conventional RANS turbulence and transition models to predict such kind of flows accurately.
The simulation domain is shown in Figure 5. This domain contains the test section with the LARA nacelle, the outlet is extended by approximately

In the experimental setup the crosswind condition is realized by the facility's crosswind tunnel. Therefore, the crosswind enters the numerical domain through the crosswind inlet boundary condition (green) and leaves the domain from the opposite side, through the crosswind outlet boundary condition (brown). Since the facility's crosswind tunnel forms a closed loop, the crosswind mass flows that enter and leave the domain are equal. The test section inlet (yellow) is defined as a velocity inlet to take the ejector effect into consideration and ensure numerical stability. The test section outlet (red) is defined as a pressure outlet boundary condition. To reach the desired Mach numbers at the fan face plane, the intake outlet (purple) is defined as a pressure outlet boundary condition. In order to investigate different Reynolds numbers, the density of air inside the domain had to be varied by changing pressure to 1 bar (representative for the PTF experiments), 2.5 bar and 3.85 bar (representative for the ONERA experiments). The Reynolds number is defined as
with
Computational grids of an increasing number of cells were generated using the commercial grid generator ICEM-CFD of ANSYS. The sensitivity analysis conducted by (Kellersmann et al., 2013) for the same set up, showed that at least 28.8 million cells were required to model the overall performance parameters accurately and a
Turbulence modelling
Preliminary simulations were performed using ANSYS CFX with different turbulence models in order to find the best suited numerical setup. Figure 6 shows the static pressure distribution along the nacelle contour on different circumferential positions ϴ (cf. Figure 4) for various turbulence models compared to experimental data. The drawbacks of the k-ε for predicting aerodynamic flows with adverse pressure gradients are well known and show up in these results. The results for the k-ω and SST model seem to slightly over predict the suction peaks for every circumferential position ϴ. The transition modelling

Sensitivity to crosswind angle
Another objective of this paper is to assess the sensitivity of the intake flow to the crosswind angle. Therefore, two different crosswind angles were evaluated numerically. The crosswind angle
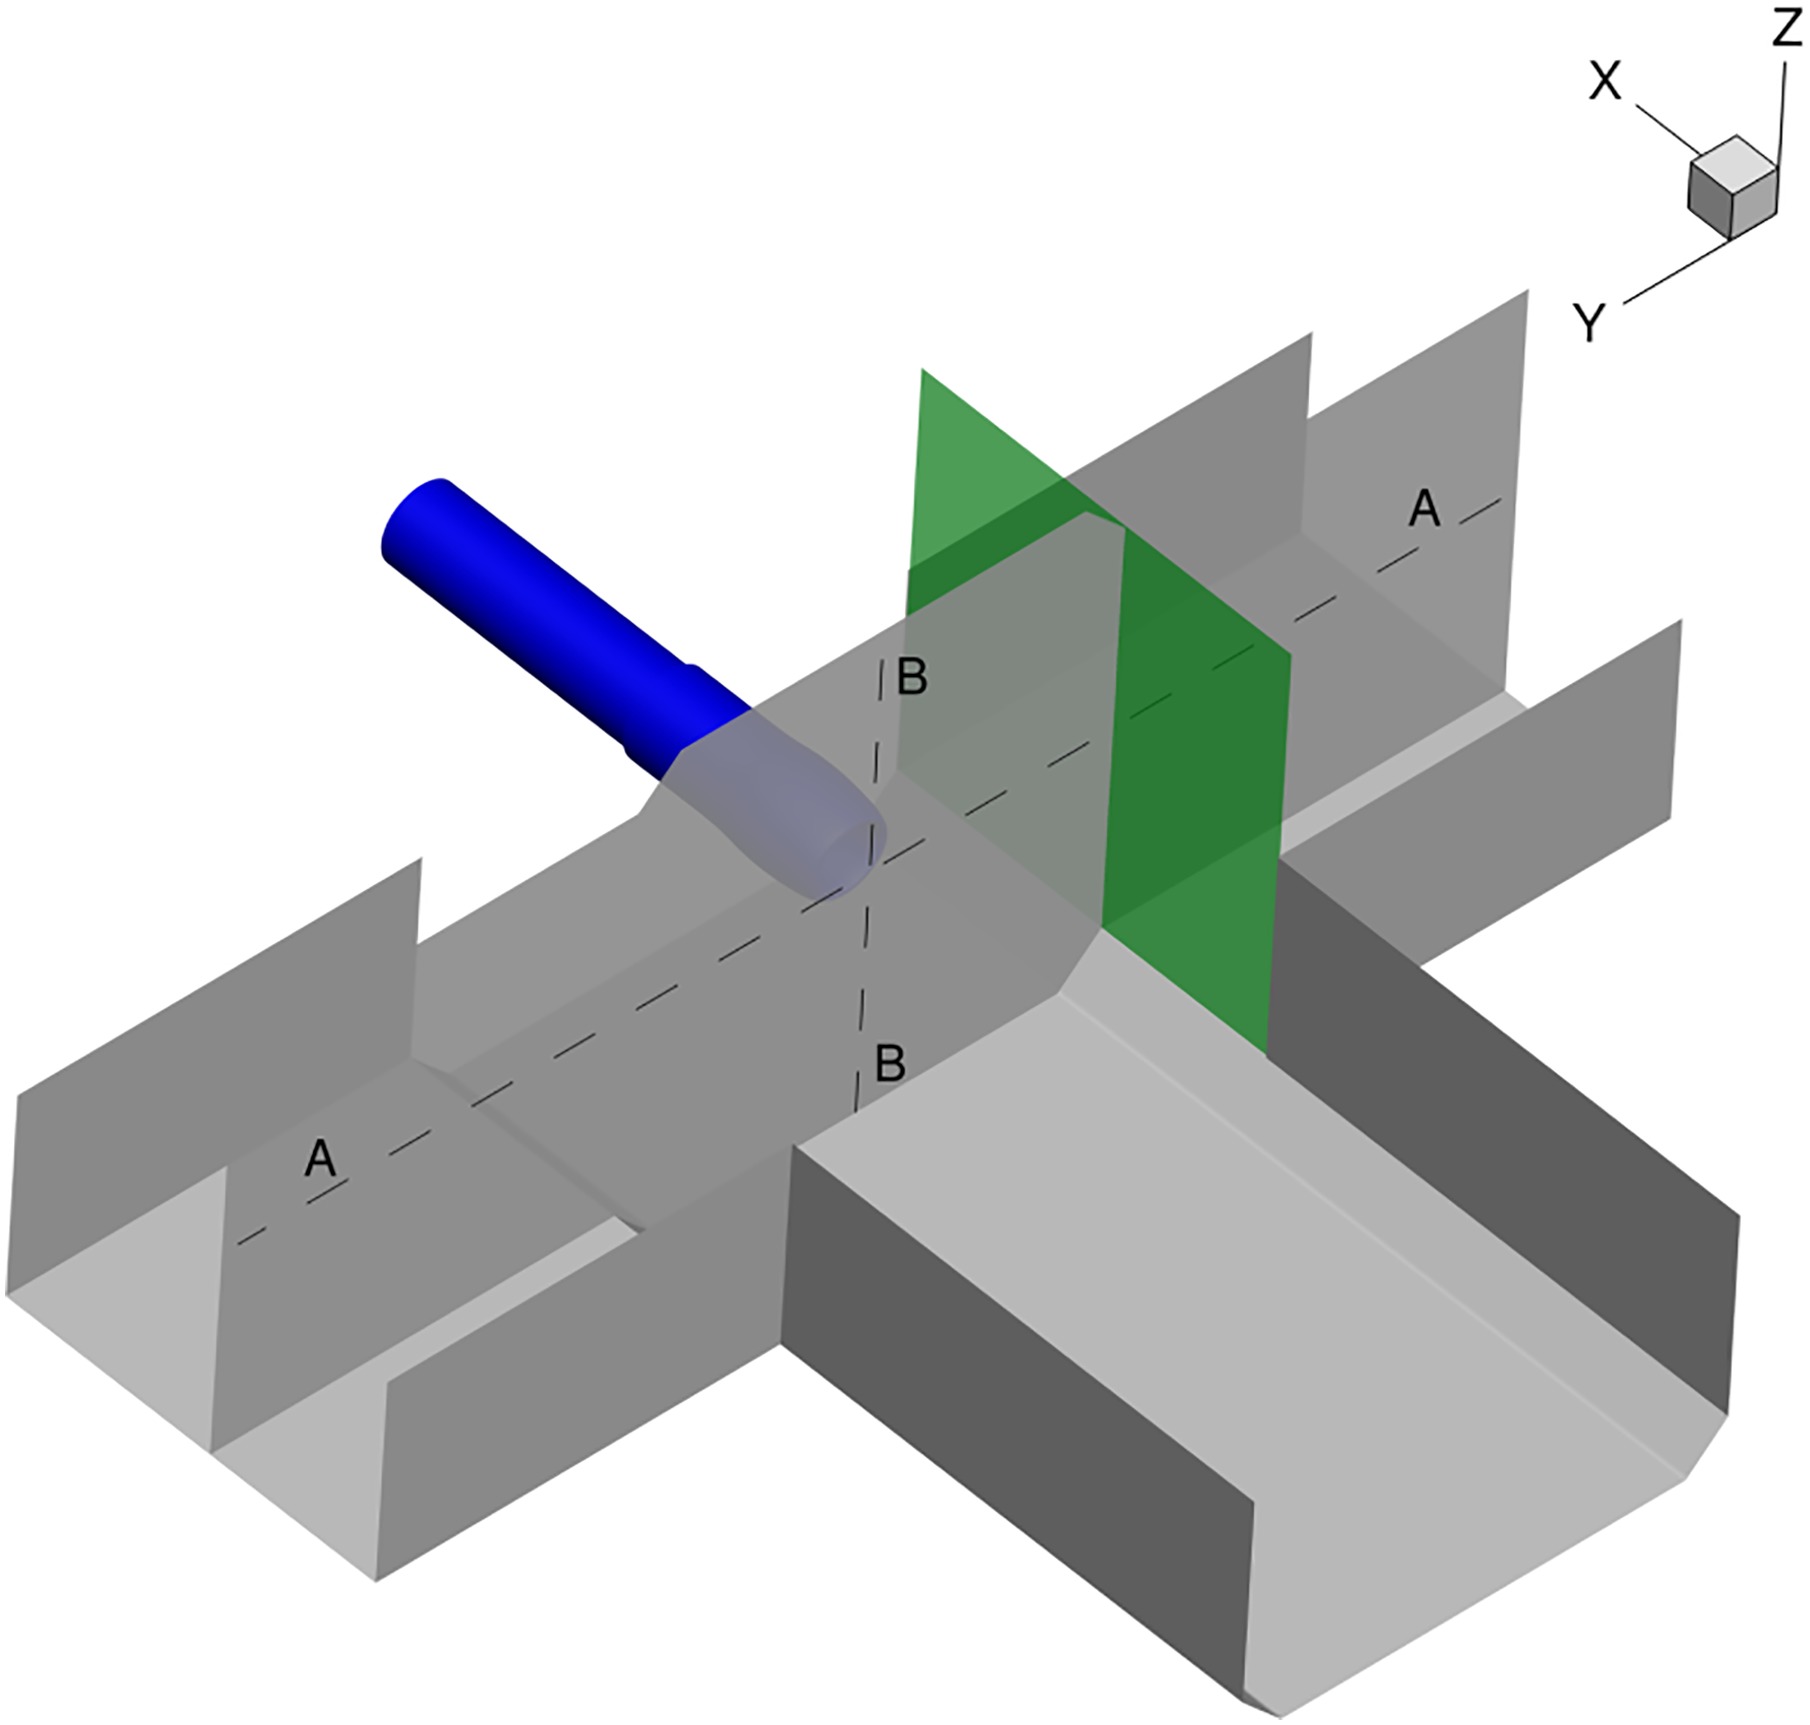
Figure 8 illustrates the flow angles directly in front of the nacelle. α represents the flow angle in the X-Y-Plane and is therefore directly related to the crosswind angle, while β represents the flow angle in the X-Z-Plane.

In Figure 8, three different results are shown. The dashed curve shows the undisturbed flow without crosswind interaction. The remaining two show the angle distributions for two different crosswind angles
The lower plot of Figure 8 shows the results for β. The undisturbed flow shows two maxima. One is representative of
This illustrates the experimental data from ONERA and the two numerical results with the same crosswind angles as discussed above. The static pressure distribution is sensitive to the turning of the flow around the nacelle. The higher the crosswind angle the stronger the suction peak. This is best shown for
Additionally, the results show that the experimental data acquired by ONERA can be reproduced with the numerical setup used in this paper. However it is noted, that the crosswind velocity was set to
Results and discussion
The first results of the LARA campaign at the PTF has shown that the pressure distribution at the lip seems to have a general sensitivity towards the Reynolds number (published in (Krone et al., 2019)) especially for the pressure distribution at
Reynolds number
The sensitivity towards the Reynolds number for intake flows under crosswind conditions is shown in Figure 10, where the Distortion Coefficient
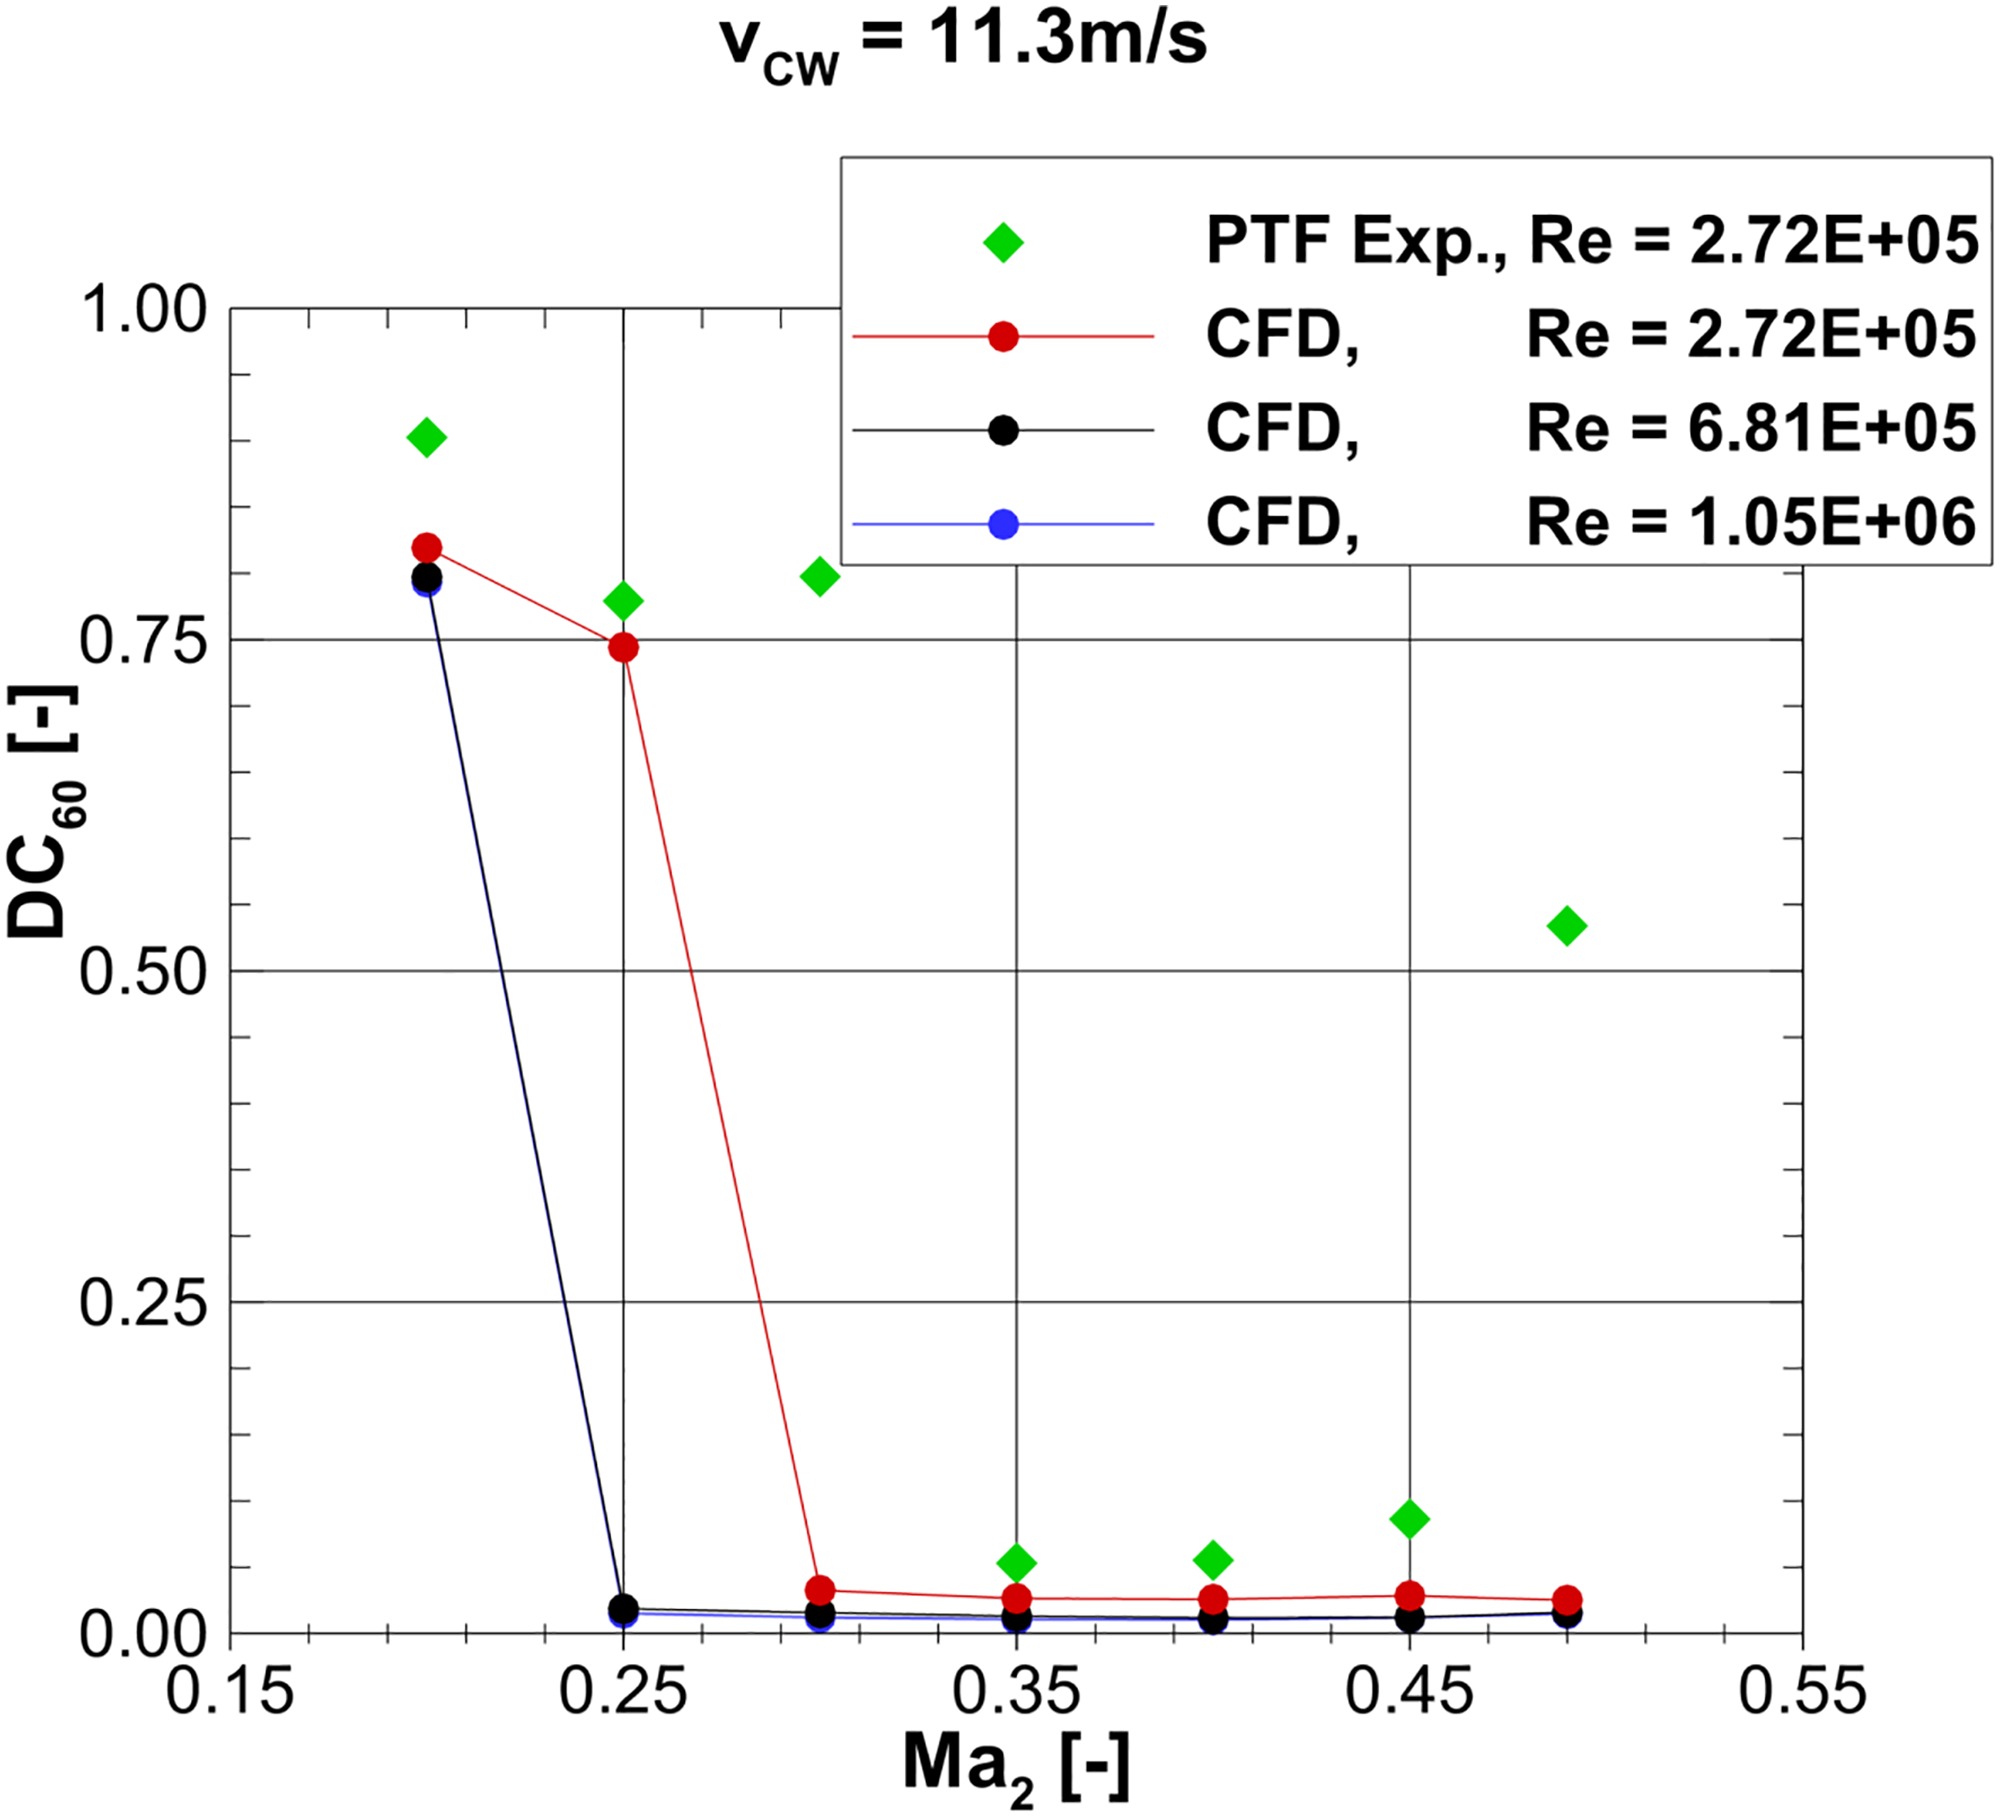
The rising Reynolds number shows its effect on overall reduced distortion levels. Additionally, higher the Reynolds number, higher the flow's resistance to separation onset. This can be seen in Figure 10 at
Younghans et al. (1982) explained the decrease of boundary layer thickness with an increasing Reynolds number. A thinner boundary layer can better withstand a given adverse pressure gradient, thus delaying the separation onset to a lower
Figure 11.
Total pressure distribution along different radiuses for different Reynolds numbers at Ma2 = 0.45.
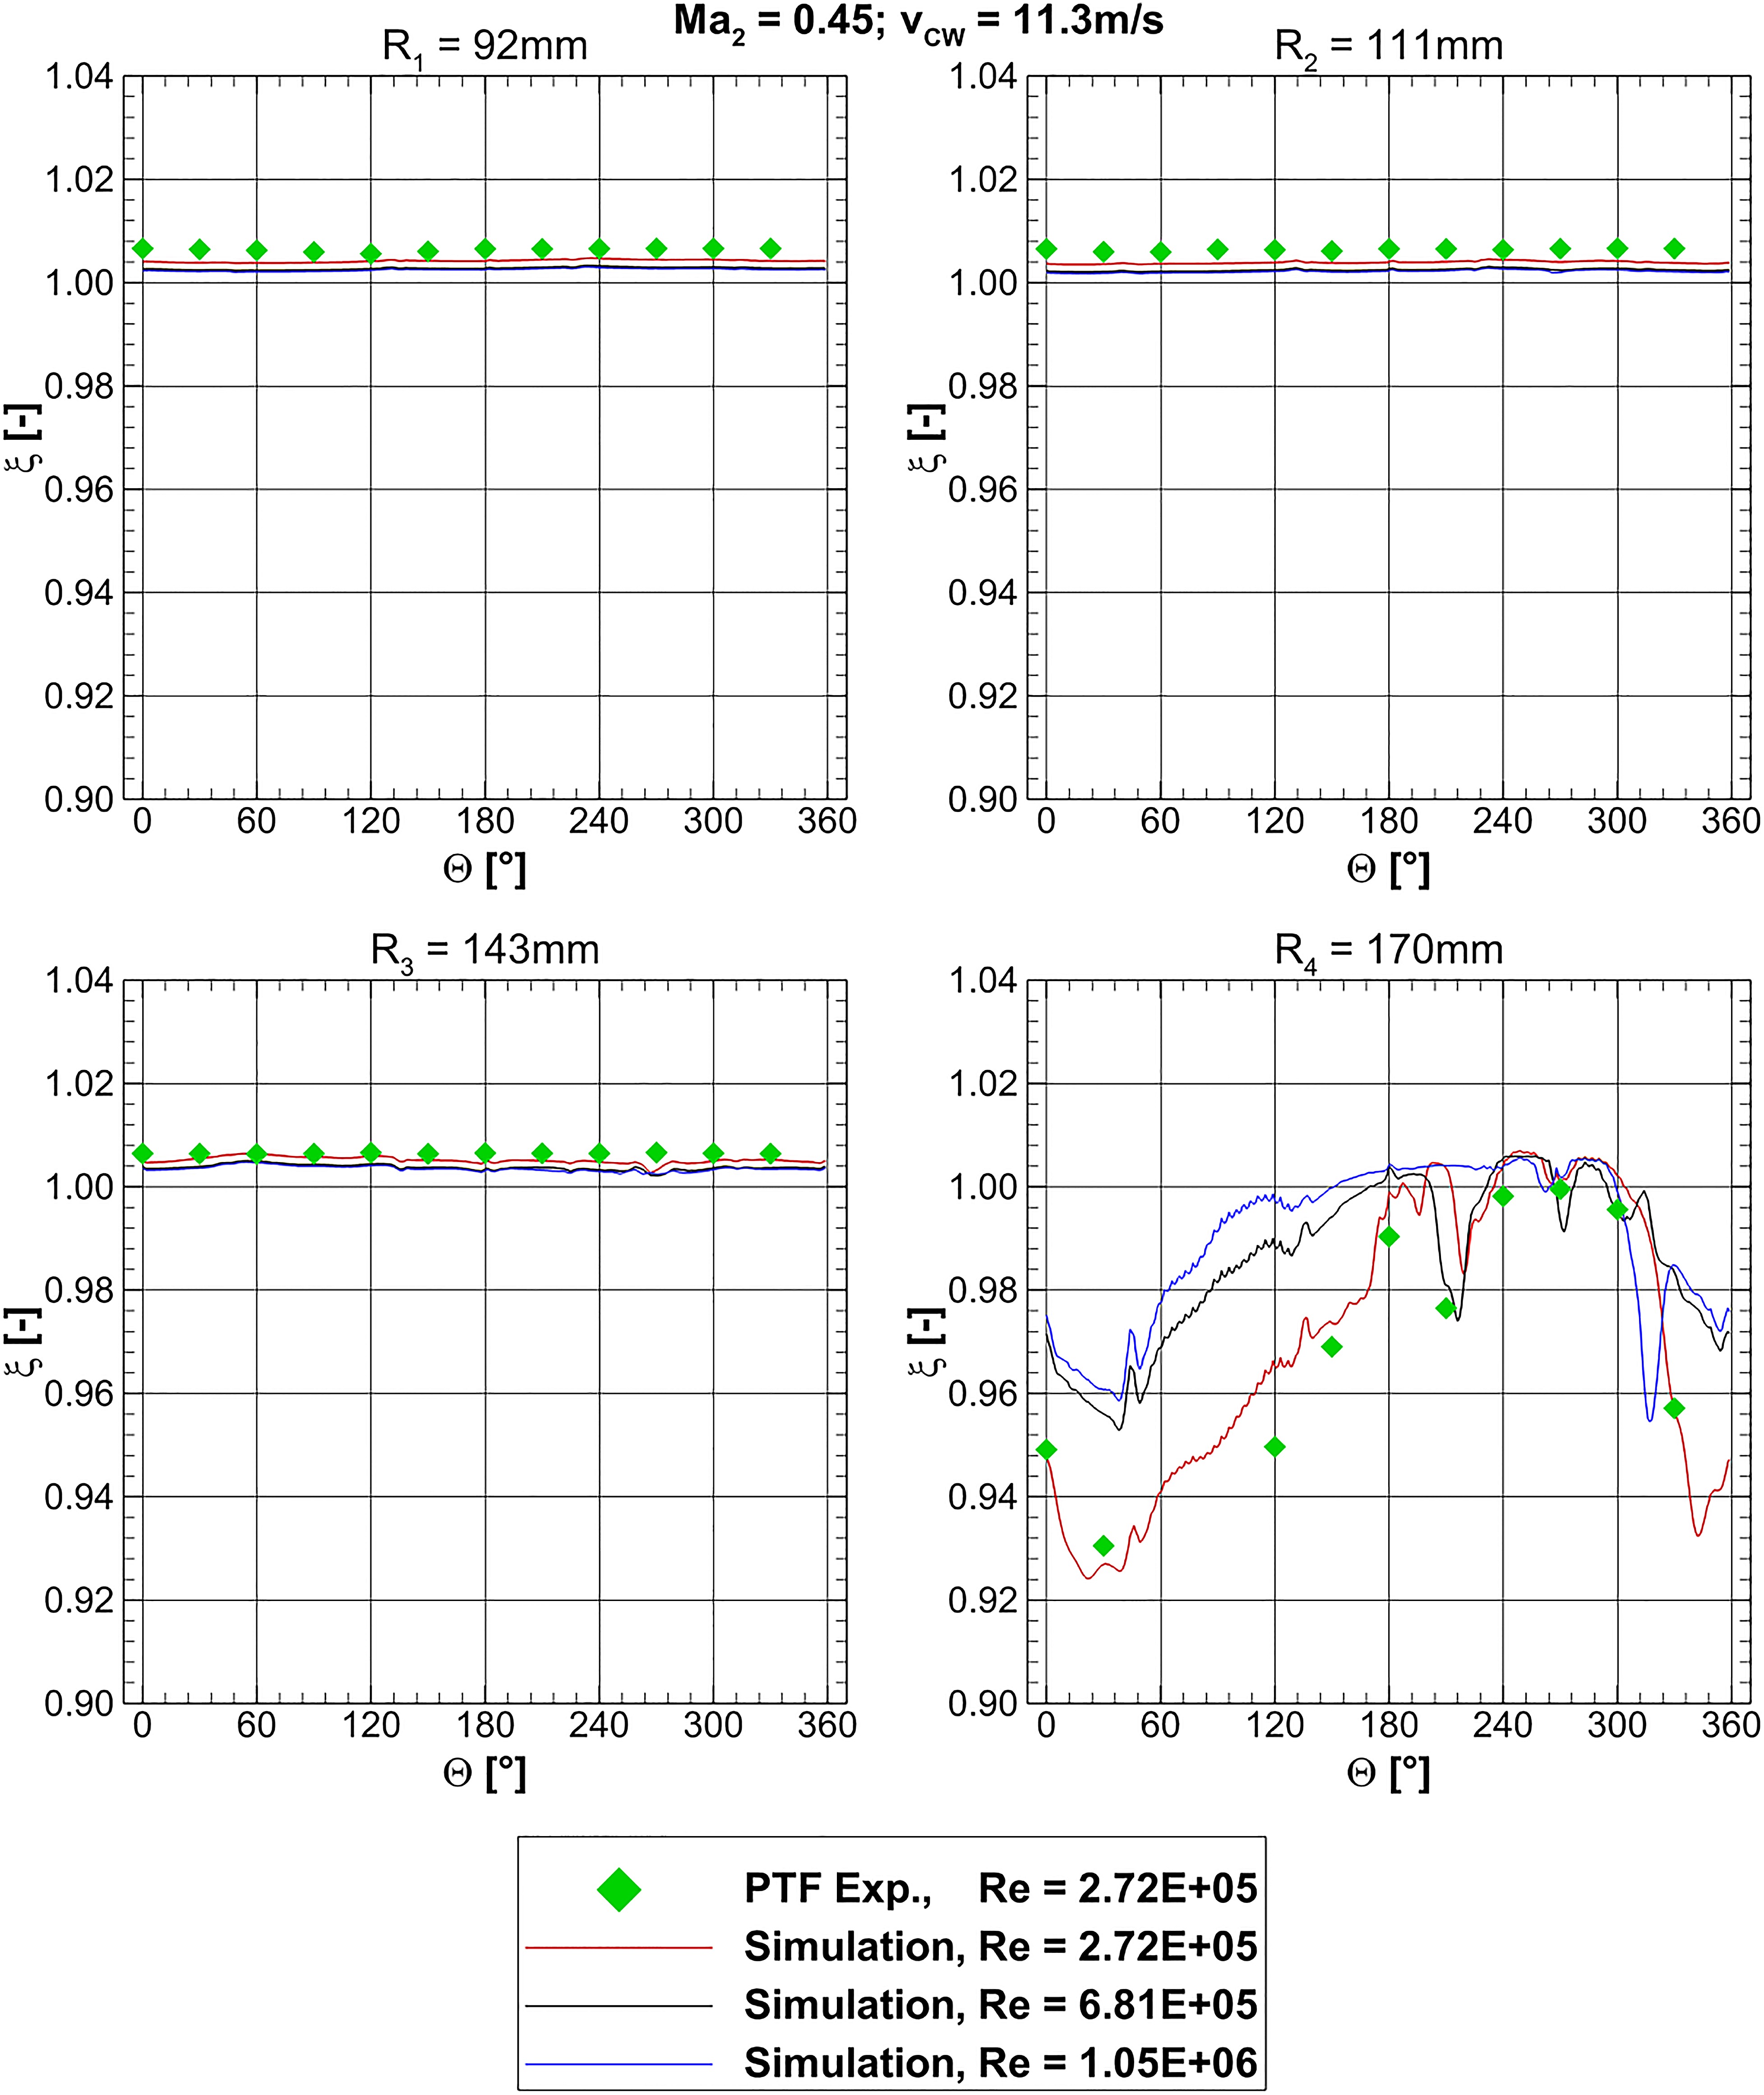
R1 to R3 are representative for the core flow. The values greater than one can be explained by the influence of the boundary layer. The total pressure losses in the boundary layer reduce the value of the averaged total pressure of the fan face. Since the boundary layer thickness decreases with an increasing Reynolds number, ξ results into lower values for rising Reynolds number, because the averaged total pressure in the fan face increases. The boundary layer itself can be seen by ξ at
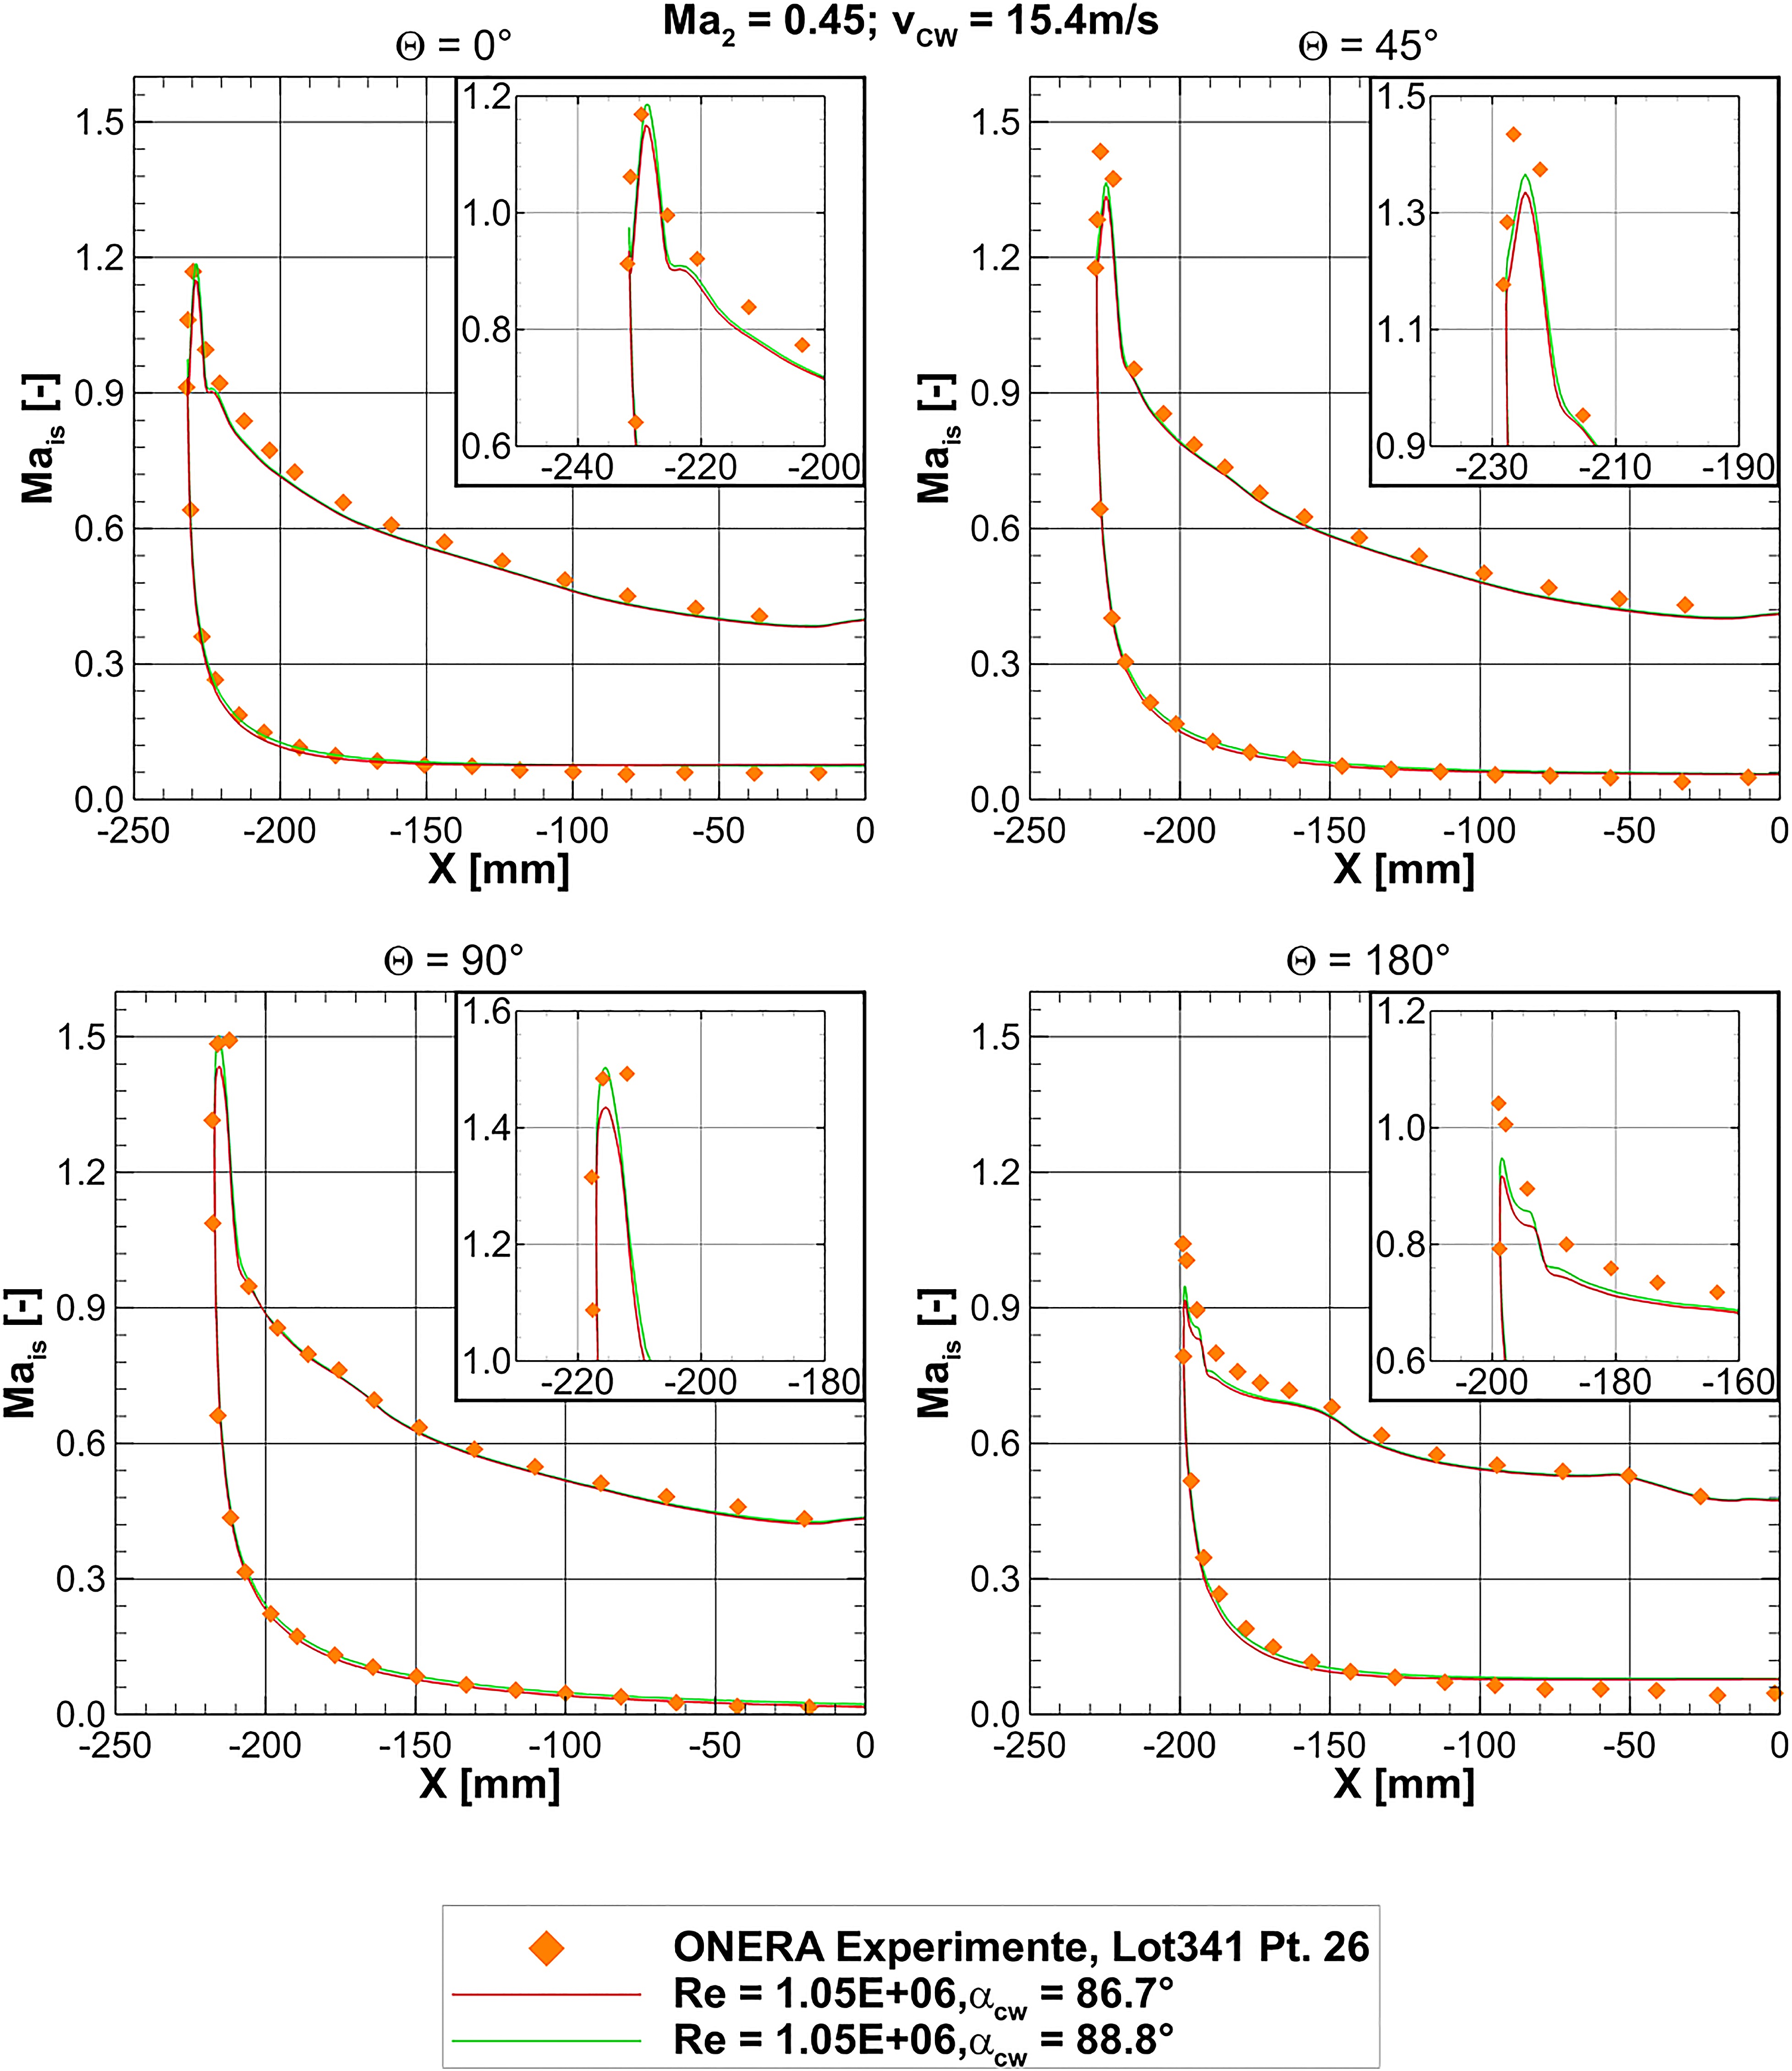
Apart from the distortion coefficient the effect of the Reynolds number can be pointed out by the analysis of the static pressure distribution at the lip — as seen by the isentropic Mach number distribution in Figure 12.
Figure 12.
Isentropic Mach number distribution for different Reynolds numbers at Ma2 = 0.45 and the magnifications of the suction peaks.

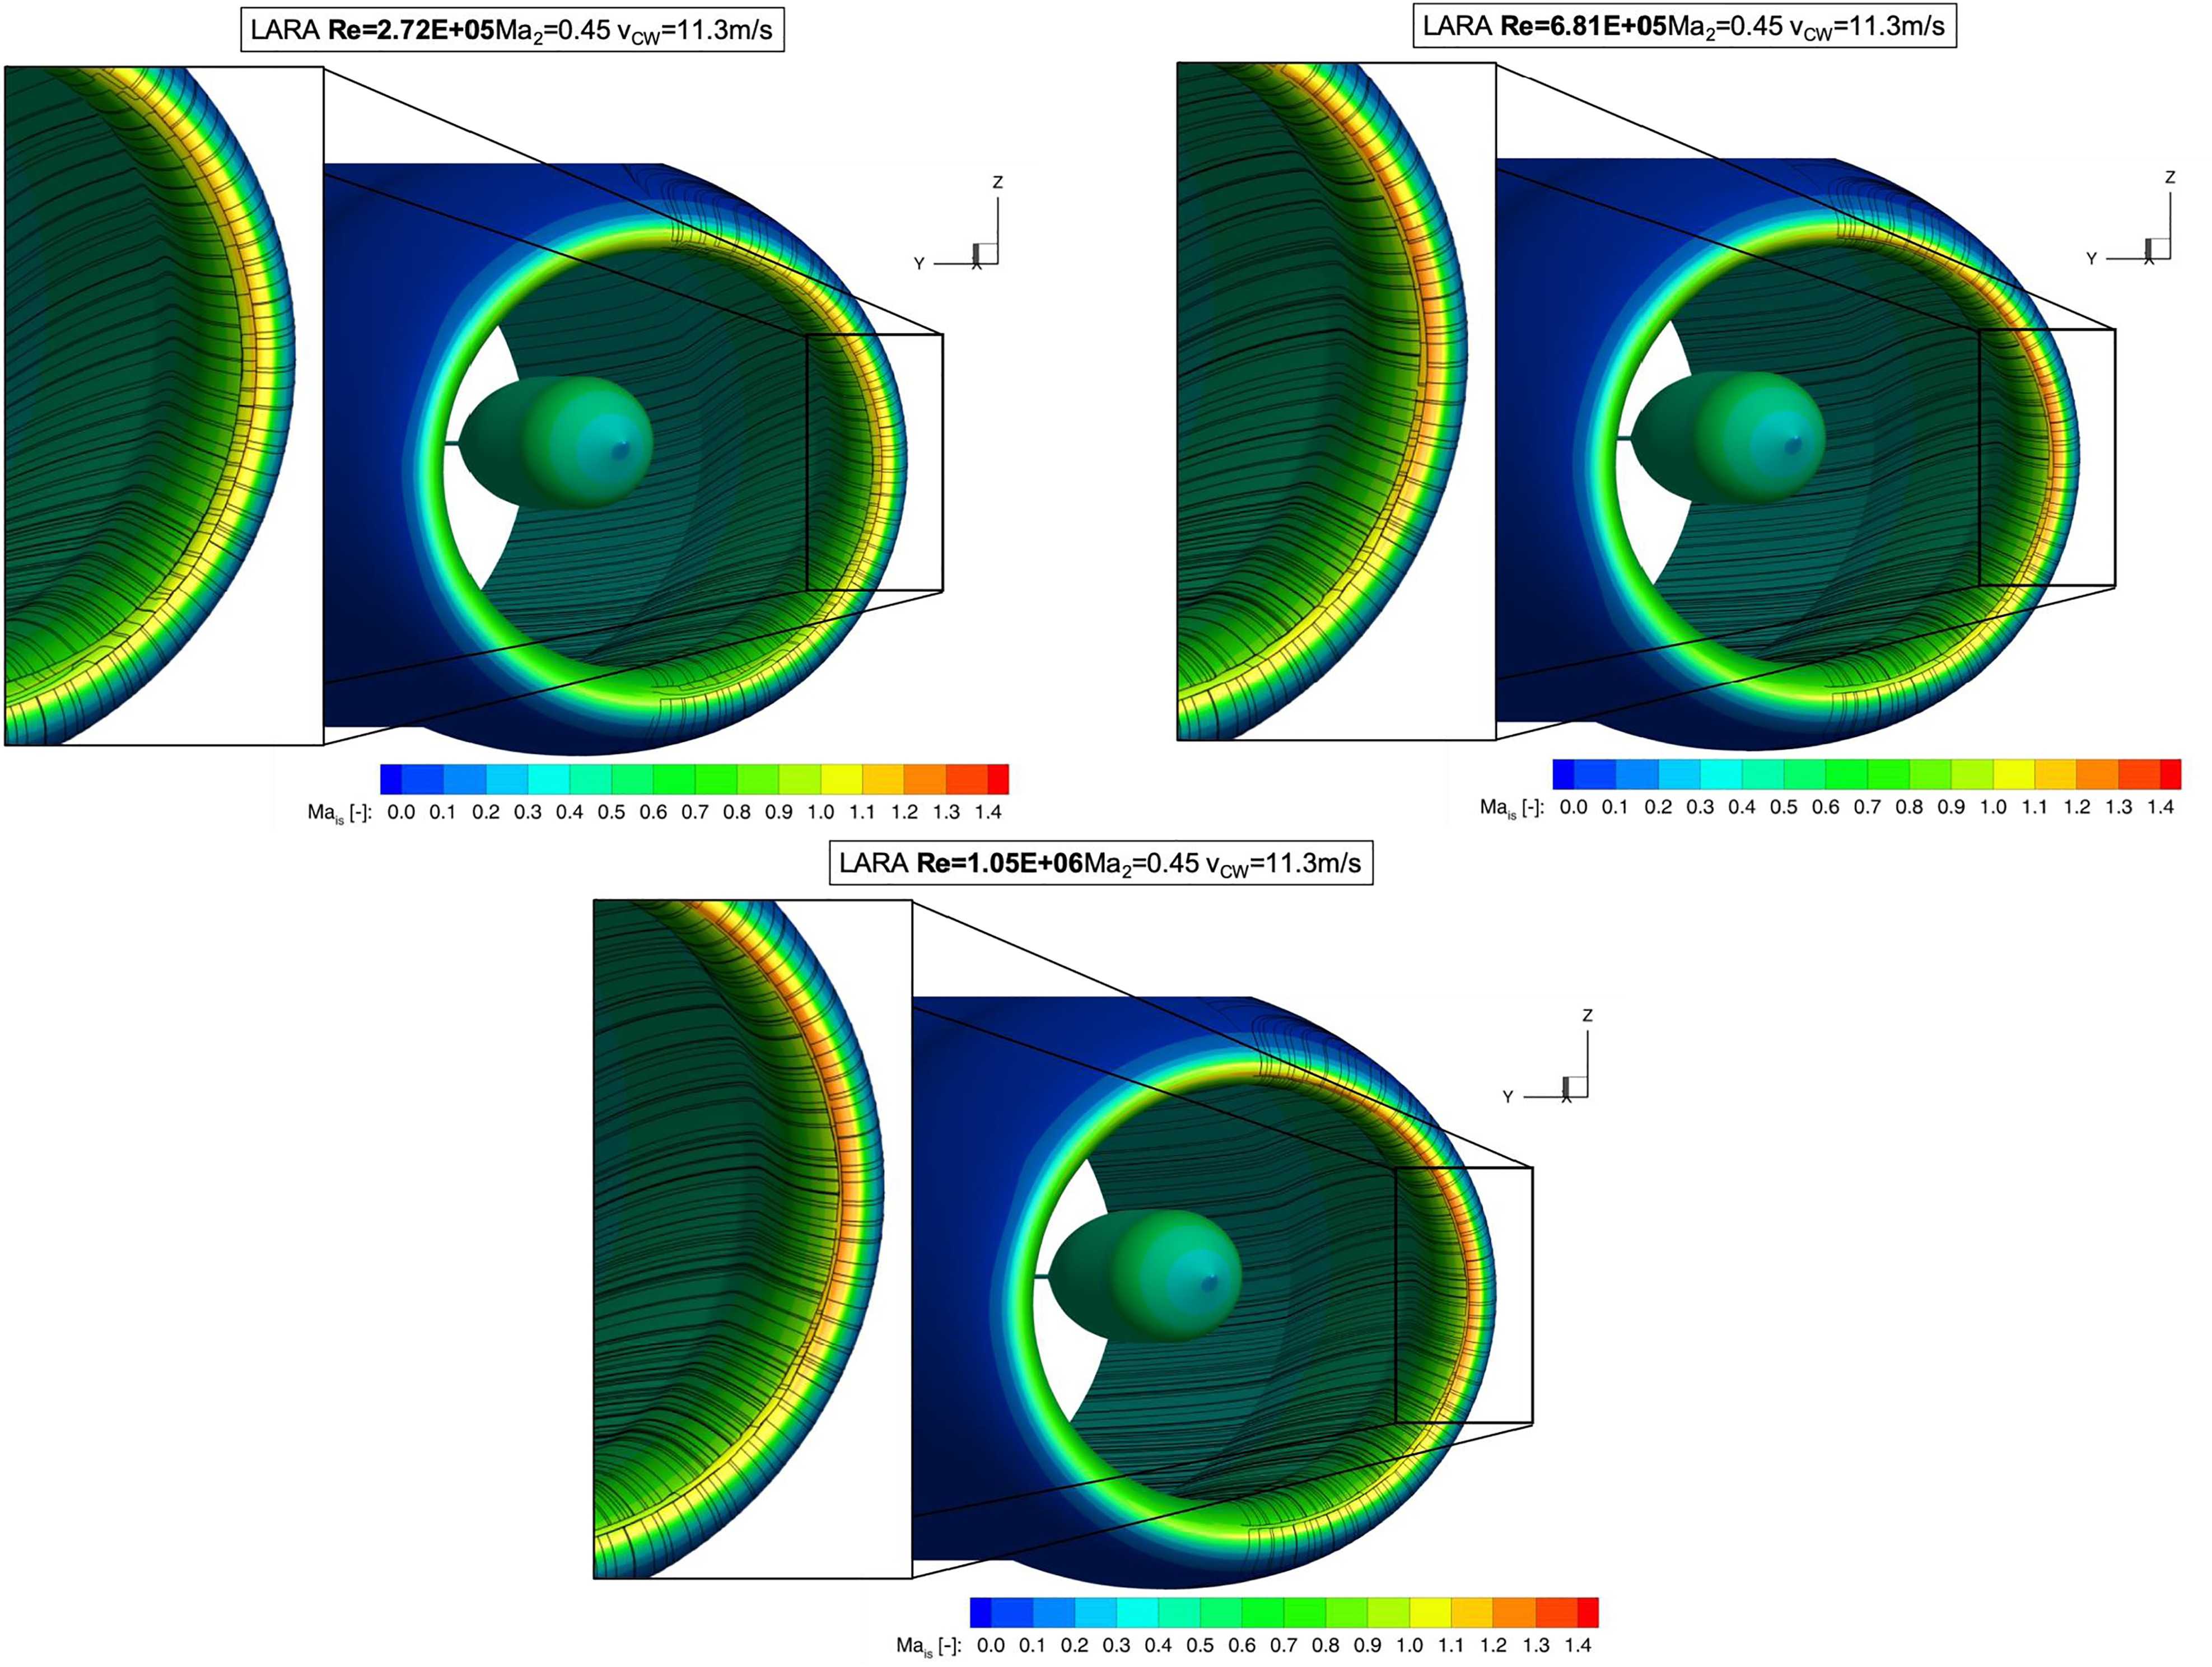
The Reynolds number affects the characteristic of the suction peak for each section ϴ. The higher the Reynolds number the higher the maximum suction peak. This is directly connected to the development of a laminar separation bubble, which can be observed in every subfigure of Figure 12 in the form of a constant pressure plateau followed by a further decrease of isentropic Mach number. This transition process has a substantial effect on the development of the suction peak. With an increasing Reynolds number, the extent of the separated region within the bubble reduces, as seen by the surface streamlines in Figure 13. Thereby, the magnitude of the suction peak increases with the Reynolds number.
Figure 13.
Declining separated region within the separation bubble due to the increasing Reynolds number — seen by the surface streamlines at Ma2 = 0.45.
A similar effect was observed by (Jacobs and Sherman, 1937) and (Pinkerton, 1938) while investigating NACA airfoils. The authors showed that an increasing Reynolds number leads to a reduced transition region where the turbulent reattachment point moves closer to the laminar separation point, thus reducing the extent of the separated region. This result in a higher suction peak and lift coefficient.
Hysteresis effect
During the experiments at the PTF a separation hysteresis was encountered. Figure 14 shows the hysteresis for the low speed separation by plotting the
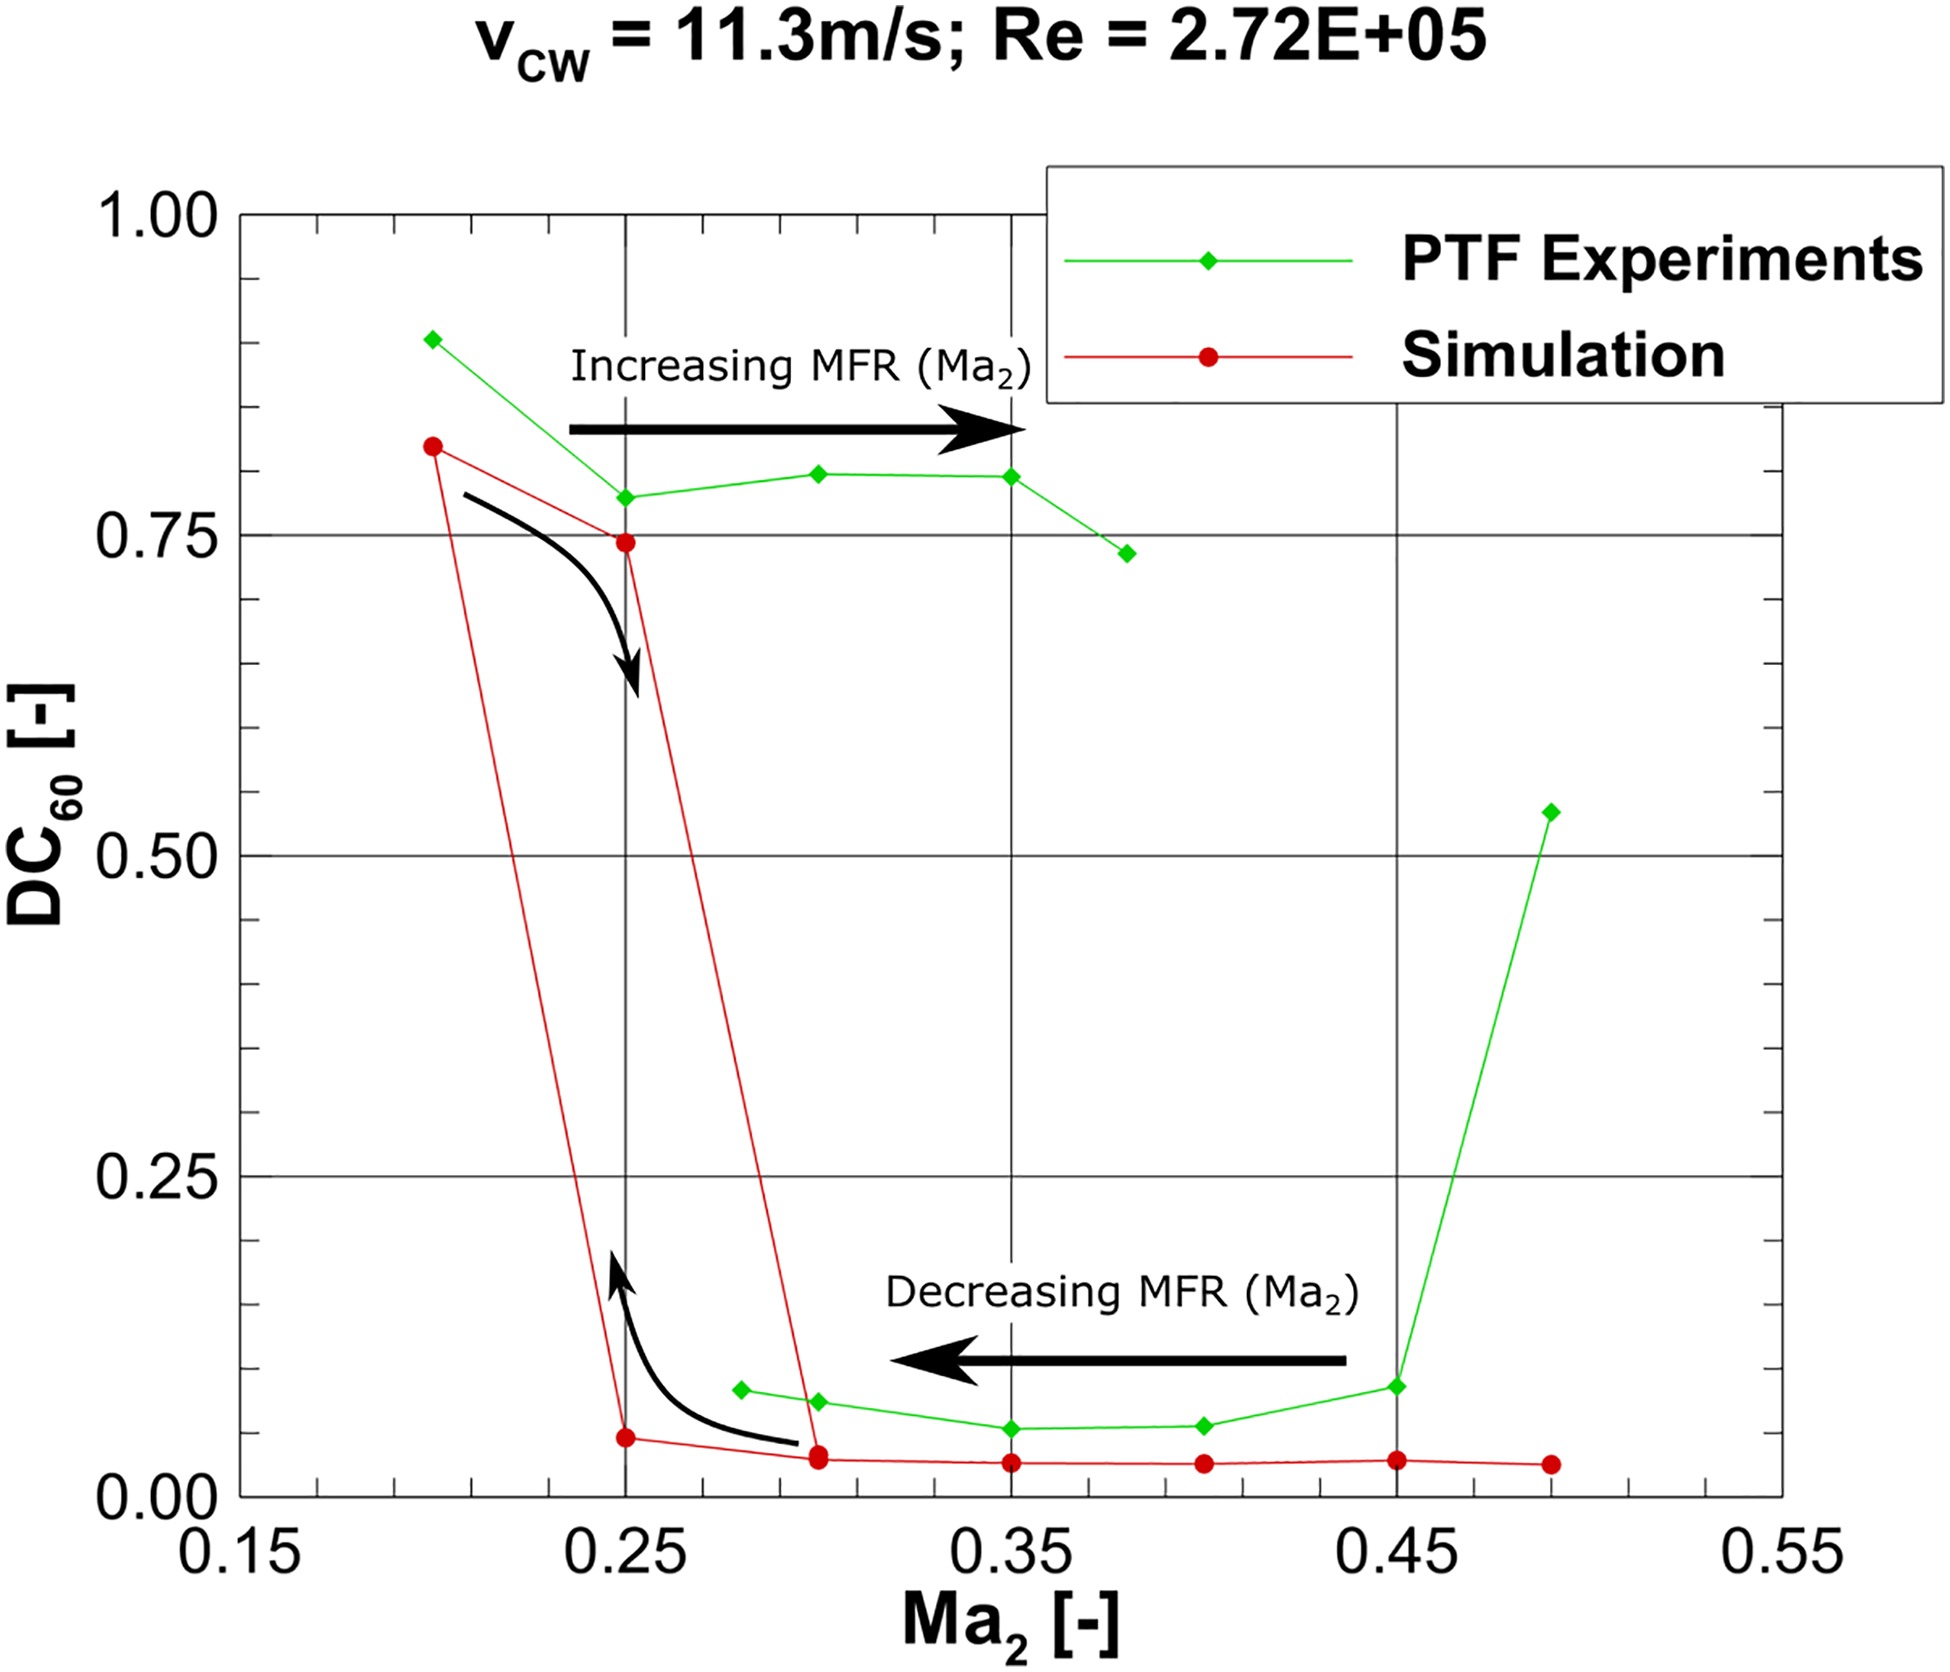
This can be partly reproduced with steady state simulations as shown in Figure 14 by using different results as initialization for the simulation. The operating point corresponding to
This ambiguity is illustrated in Figure 15 where the Mach number distribution at the fan face plane is shown. The crosswind source in both cases is coming from the
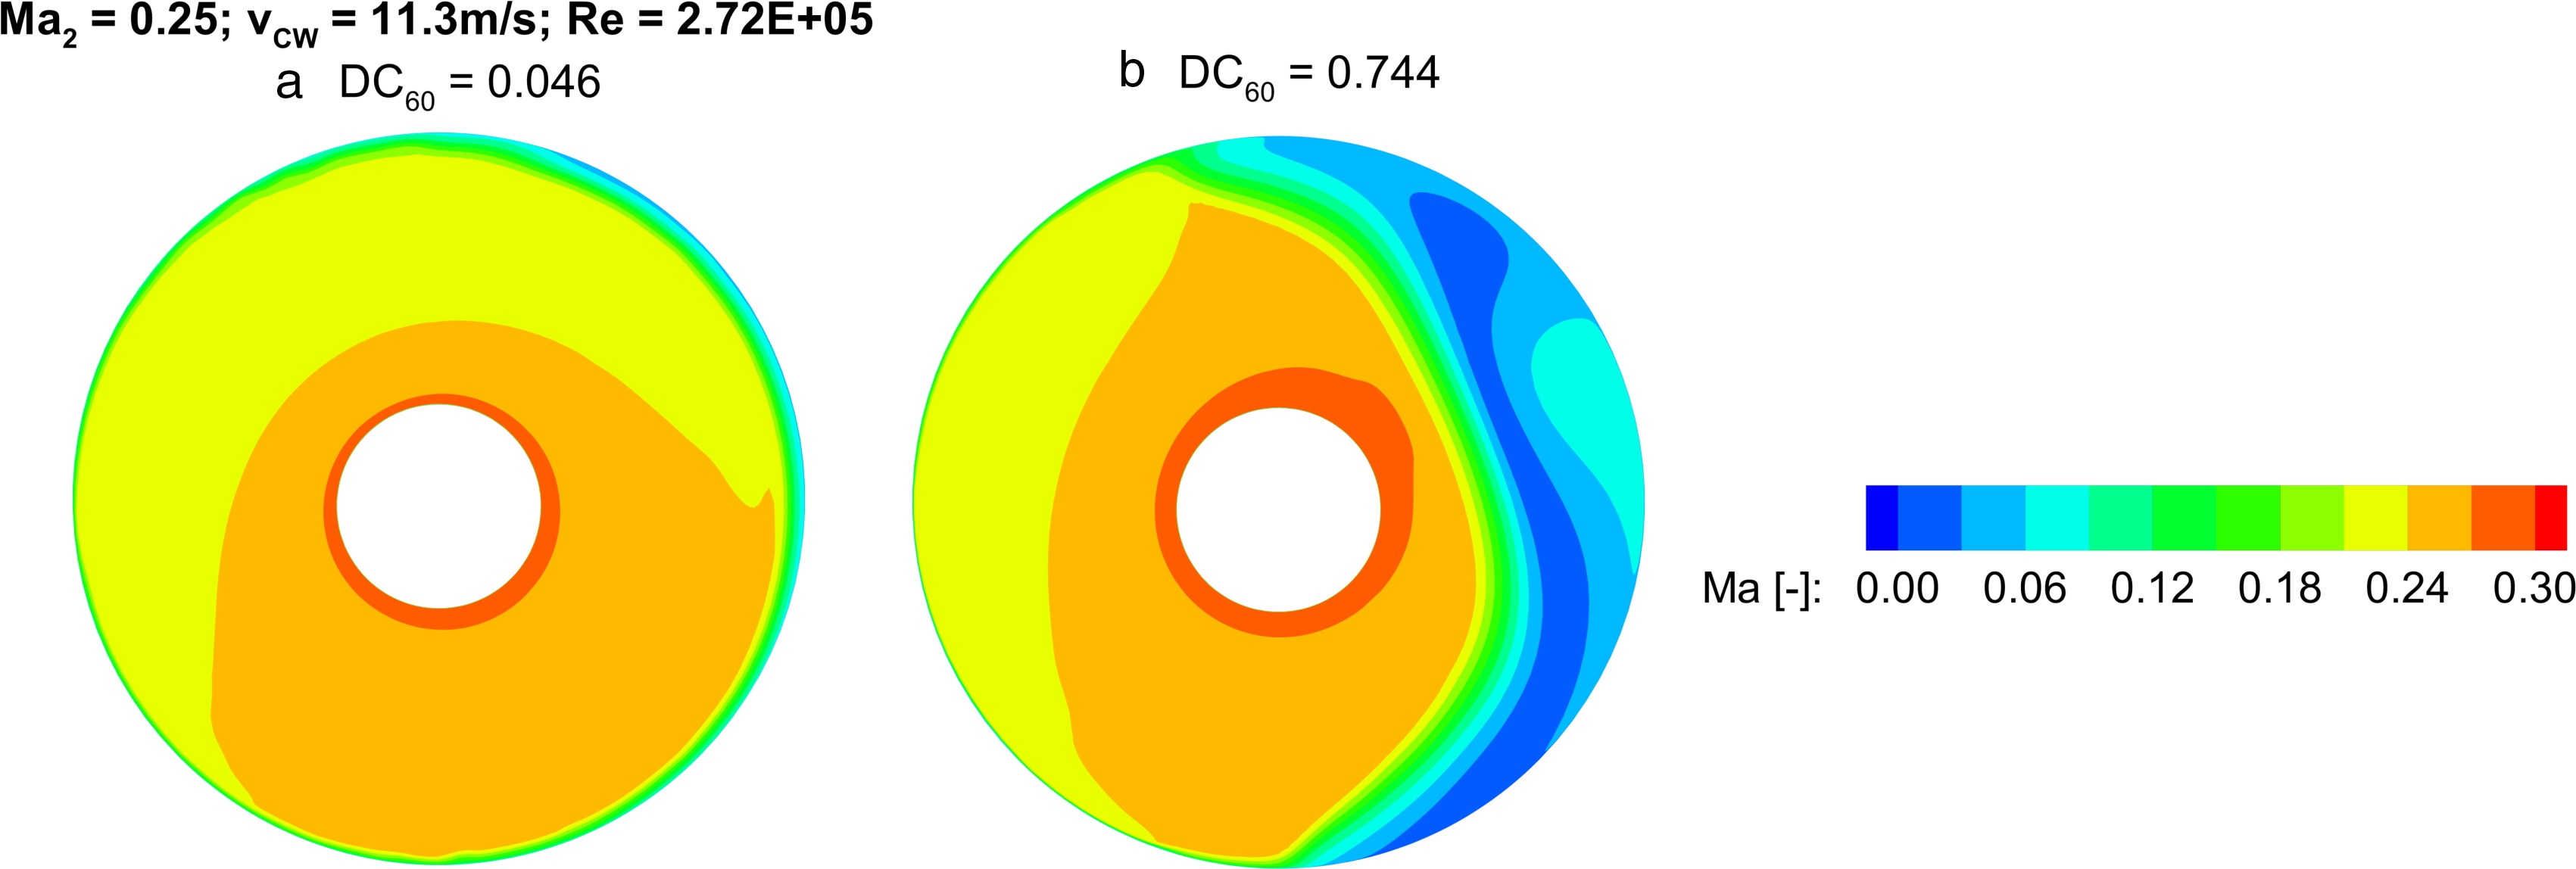
However, the RANS approach is not capable of reproducing the whole hysteresis region. At
At present there are no established theoretical bases for analysing aerodynamic hysteresis and it remains a difficult phenomenon to understand. (Hall and Hynes, 2006) have shown in their work, that separation hysteresis is particularly sensitive to independent variation in stream-tube contraction ratio, ground clearance and Reynolds number. Further studies have pointed out that the separation hysteresis also occurs during static stall condition of an airfoil at high angle of attack (Mittal and Saxena, 2000).
Conclusions
This publication deals with the experimental and numerical investigation of jet engine intake distortions caused by crosswind conditions. In the institute's own propulsion test facility (PTF), experimental investigations of the well-known LARA nacelle under pure crosswind conditions were carried out and compared with already existing experimental data of the same test vehicle in the F1 wind tunnel of ONERA in Le Fauga.
A comparison of the experimental results of the LARA nacelle measured within the PTF to the results measured within the F1 wind tunnel of ONERA at same Mach and Reynolds number of the inflow shows a clear difference in the isentropic peak Mach number distribution in the area of the leading edge lip of the nacelle. Additional numerical investigations showed that the isentropic peak Mach number depends on the Reynolds number as well as on the size of the occurring separation bubble. As the Reynolds number increases, the size of the separation bubble decreases, increasing the suction peak. In addition to this, it could also be shown based on the numerical results that the isentropic Mach number distribution is very sensitive to the angle of the crosswind. The larger the crosswind angle, the larger the suction peak. The reason for this is the position of the stagnation point, which moves further downstream by increasing the crosswind angle, resulting in higher flow acceleration around the lip of the nacelle.
Within the scope of these validation tests, a hysteresis effect of the separation and reattachment process of the occurring flow separation was observed in the experimental investigations. This hysteresis effect occurs when the crosswind and the nacelle mass flow are increased and/or decreased to adjust the different operating points. Therefore, different results for the same operating point develop. At present there is no established theoretical basis for the analysis of this aerodynamic hysteresis. Further fundamental detailed investigations on the mechanisms of this effect have to be carried out.
At present and in future studies, high-resolution measurement techniques will be used to investigate this highly three-dimensional and transient phenomenon. In addition, the hysteresis effect has to be investigated numerically in further studies. Current results using conventional steady RANS simulations have shown that the hysteresis effect can only partly be reproduced compared to the experiments. Further studies on this topic will try to achieve an improved numerical prediction of this phenomenon with transient simulations based on Reynolds stress modelling (RSM).
Competing interests
Lennart Harjes declares that he has no conflict of interest. Christoph Bode declares that he has no conflict of interest. Jonas Grubert declares that he has no conflict of interest. Philip Frantzheld declares that he has no conflict of interest. Patrick Koch declares that he has no conflict of interest. Jens Friedrichs declares that he has no conflict of interest.