
Introduction
To prevent material degradation due to high heat loads, turbine vane leading edge geometries are often cooled with impingement cooling. Current designs use circular steady impingement jets to cool the internal surface, with the spent coolant exhausting from the leading edge through showerhead cooling holes, which cool the external surface (Bunker and Metzger, 1990). Circular jet impingement is well-studied (Jambunathan et al., 1992; Zuckerman and Lior, 2006), and novel geometries are now being considered in attempts to increase heat transfer (Taslim et al., 2000). In particular, with additive manufacturing becoming more available, complex geometries are now possible. One such geometry is a fluidic oscillator, which creates a sweeping jet with no moving parts. The main jet is forced to oscillate from the interference of feedback channels. The resulting oscillation frequency depends on mass flow rate and oscillator geometry, as well as manufacturing roughness. Sweeping jets have been shown to provide heat transfer to a wider region than comparable circular jet designs and benefit from unsteady heat transfer effects for both impingement cooling (Camci and Herr, 2002) and film cooling (Hossain et al., 2017) applications.
From the principles of similitude, it is a common practice to match the Reynolds number, Prandtl number and Mach number during the development of laboratory-scale models. However, the Biot number (Bi) does not appear from nondimensionalizing the governing equations because it couples different sets of equations. For effective turbine cooling design, the ultimate goal is to keep the temperature and its gradient under allowable limits. Therefore, it is very important to study both internal and external cooling simultaneously. One can make experimental measurements in laboratory environments by designing experiments to match Biot number (Bi), simplifying measurements and reducing cost. If the Biot number distributions on the corresponding coolant side and hot-gas are nearly similar to relevant conditions, then the magnitude of dimensionless temperature and heat-flux distributions will be similar although the operating temperatures and pressures differ considerably (Ramachandran and Shih, 2015). As far as the temperature and heat-flux distributions in the material are concerned, matching Biot number could provide meaningful results for the actual turbine configuration operating under engine-relevant conditions. This study investigates sweeping jet impingement cooling on the internal surface of a simulated turbine vane leading edge geometry with an engine-relevant Biot number that is exposed to an external hot flow. A large-scale leading edge (LE) model was developed to allow a low-speed assessment of sweeping jet impingement cooling at varying mass flow rates, jet-to-wall spacing (H/D), jet pitch (P/D), device aspect ratio (AR) and freestream turbulence (Tu). Experiments were conducted to evaluate the performance of the sweeping jet impingement cooling and compare it to the conventional steady jet impingement case.
Methodology
The wall thickness of a symmetric airfoil shaped LE model was estimated to match the Biot (Bi) number of an actual engine vane (Bi = 0.1–0.35) (Dyson et al., 2013). Since convective heat transfer is occurring at the internal and external walls of the leading edge, Bi is a function of both internal and external heat transfer coefficients.
To derive the Biot number, consider the one dimensional (1D) steady state conduction across the flat plate shown in Figure 1, where the heat flux across the plate can be described by Equation 1-
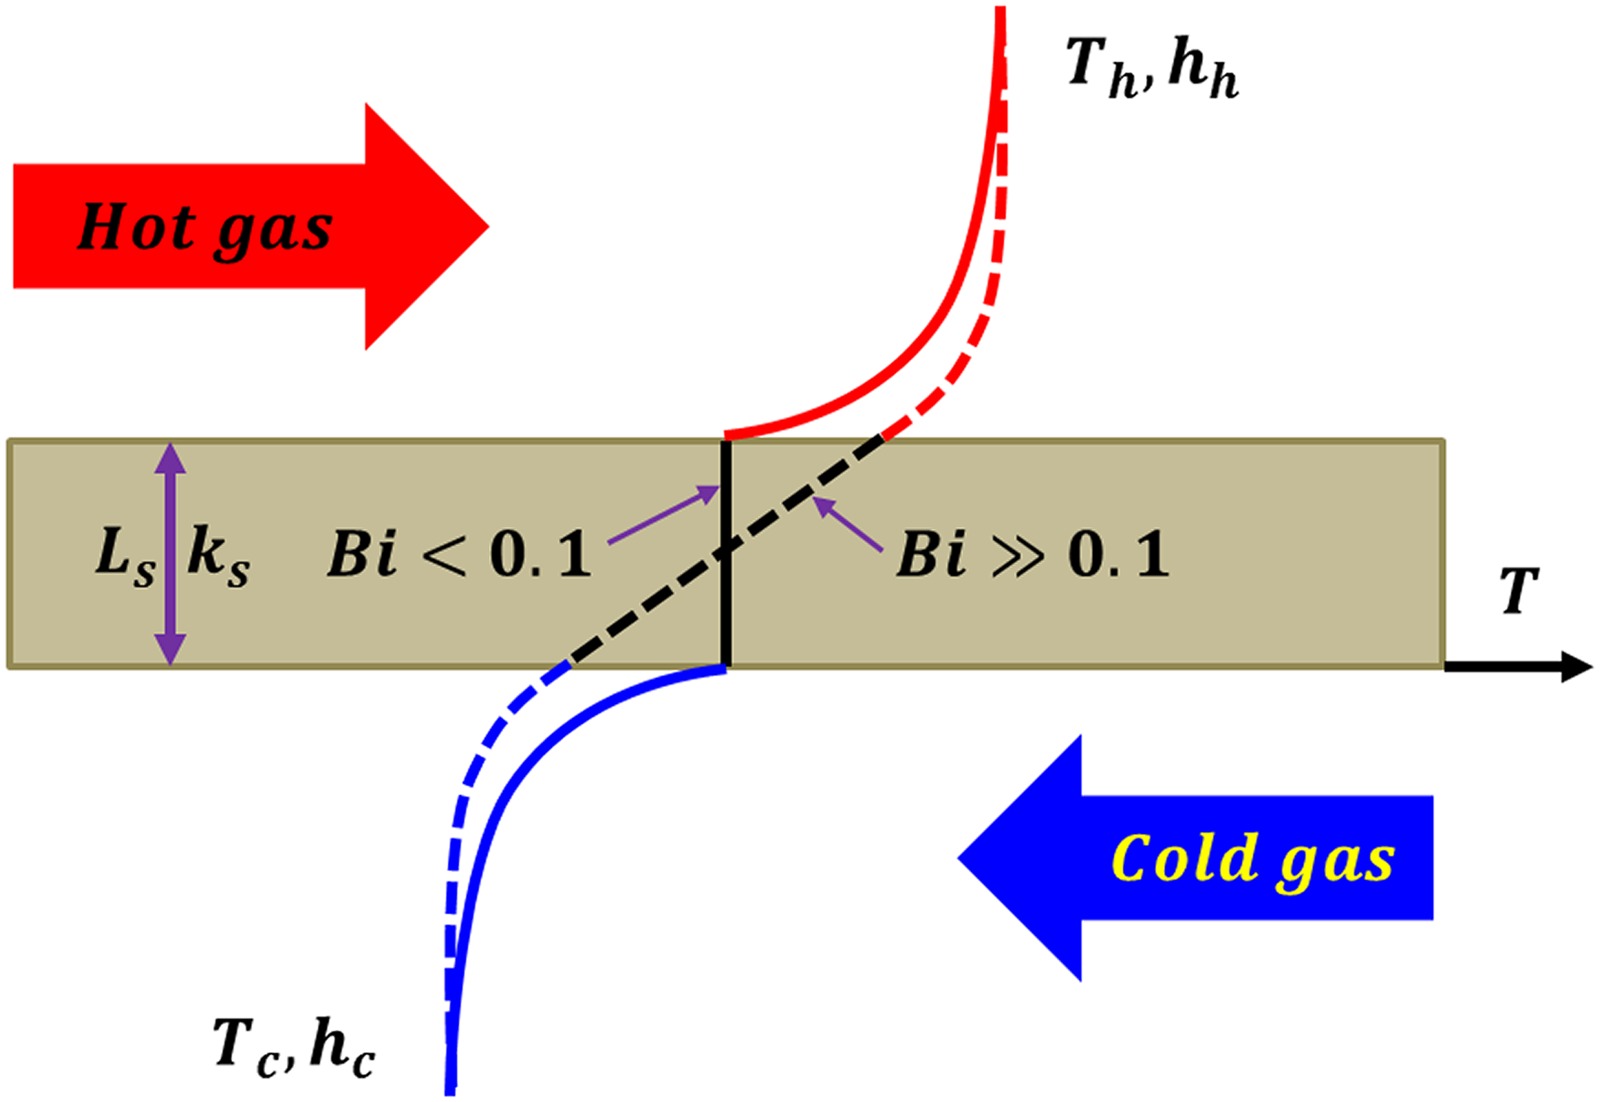
where Bi is defined as-
Ramachandran and Shih (2015) showed that if the Biot number distributions on the coolant and hot-gas sides are similar to an actual engine, the magnitude of the nondimensional temperature and heat-flux distributions will be similar although the operating temperatures and pressures differ considerably. This principle was used in the current experiment to estimate the nondimensional temperature distribution and overall cooling effectiveness of an engine-relevant condition similar to the large-scale leading edge model.
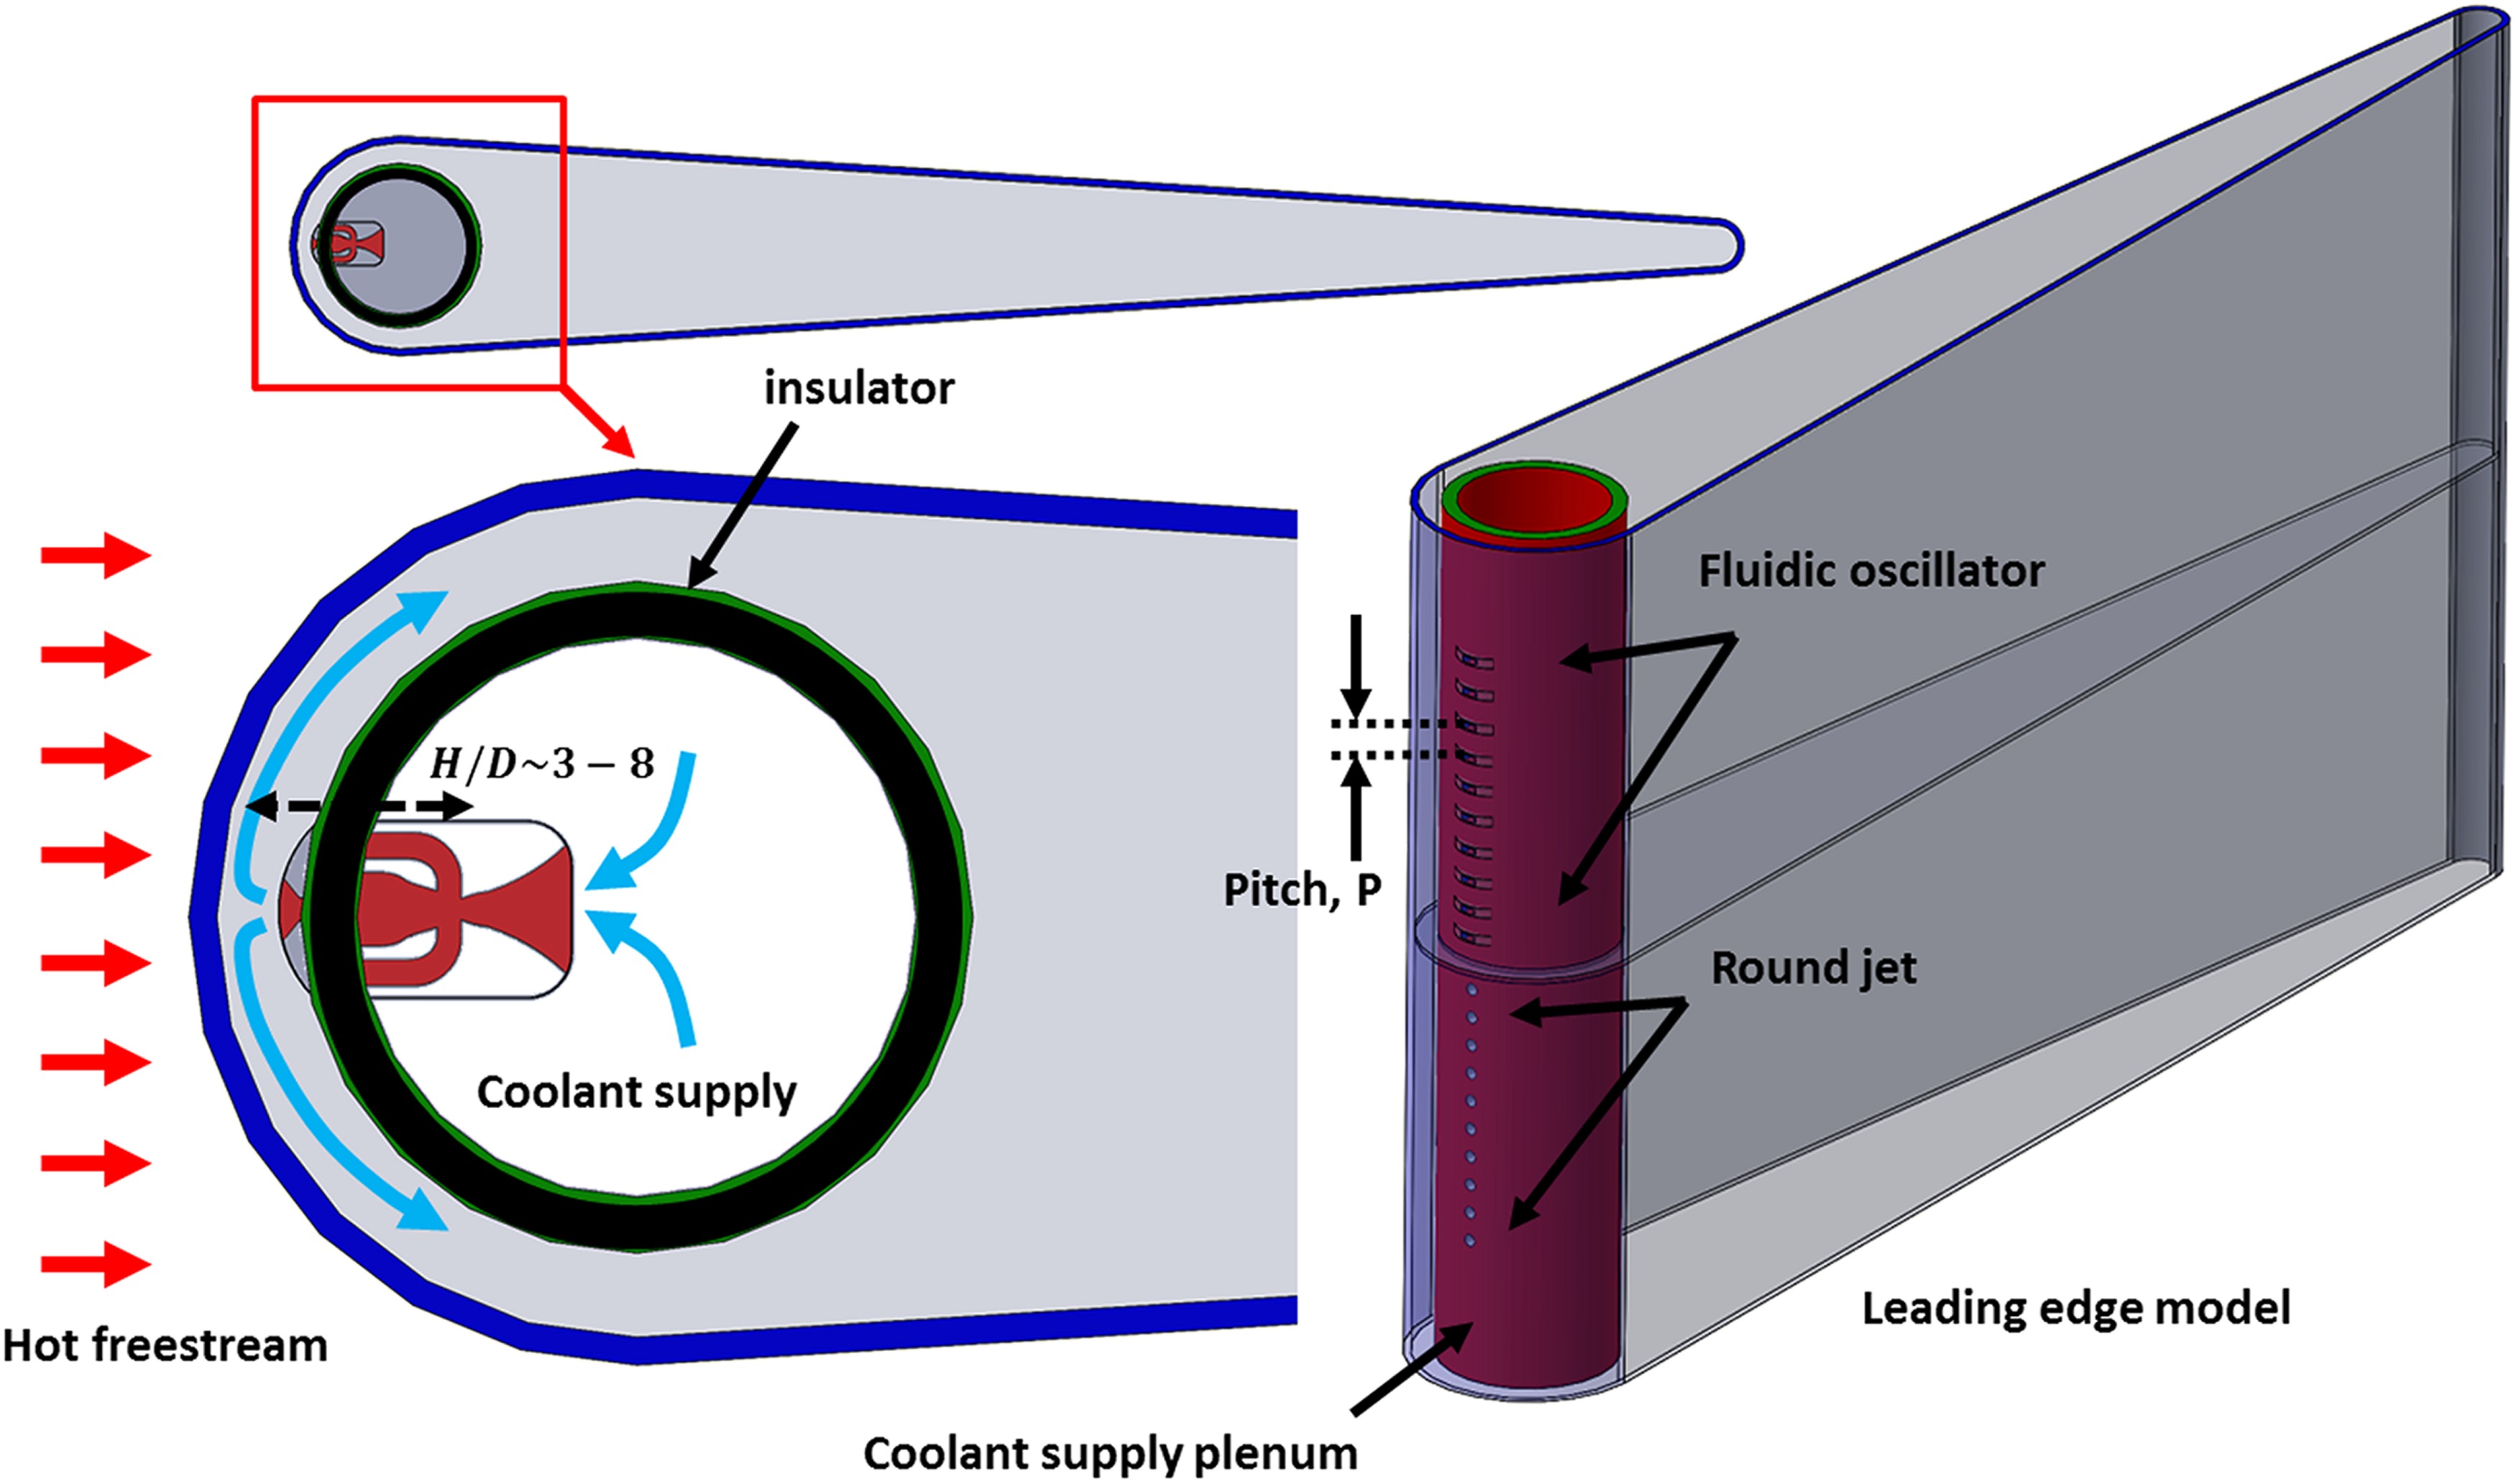
In the present study, a 1.5 mm thick polyethylene sheet was used to make the leading edge (LE) model. Figure 2 shows the schematic of the LE model assembly. The diameter of the leading edge is 105 mm. A supply plenum was designed to install nine oscillator modules and round jets. The inlet section of each oscillator module was shaped like a 2D converging nozzle in order to reduce the pressure loss (Figure 3). Separate coolant supply lines were used for sweeping jets and steady jets. The coolant plenum was insulated with a thin fiberglass insulation strip. A 0.5 mm bead diameter T-type thermocouple was installed inside the coolant plenum to measure the total temperature of the coolant. A pressure port was also made to measure the total pressure inside the plenum. The plenum was designed to be movable inside the LE model to adjust the jet-to-wall spacing (H/D) from the target wall. A set-screw was used to maintain a constant H/D throughout the test. The external flow temperature was measured with two T-type thermocouples at 10D upstream of the leading edge. Two separate thermocouples were used to ensure temperature uniformity of the incoming flow.
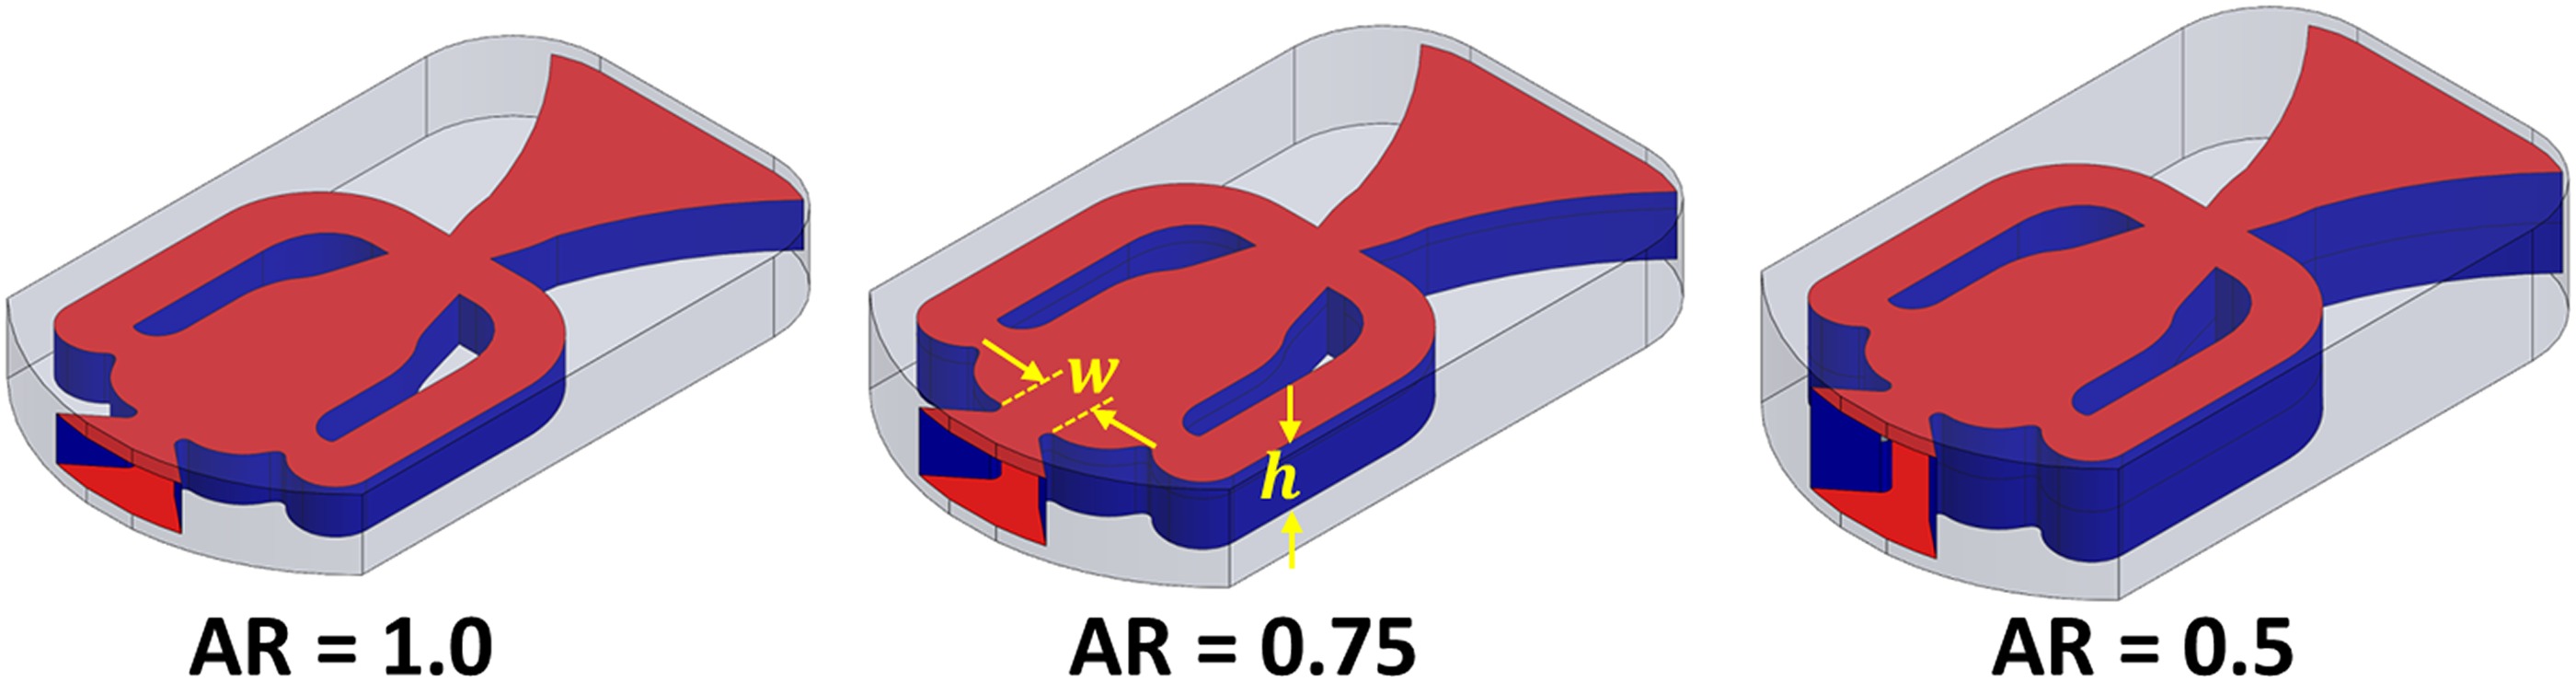
The oscillator device used in this experiment was a conventional curved fluidic oscillator. The aspect ratio (AR) of the device varied from 0.5 to 1, with aspect ratio defined by Equation 3. The hydraulic diameter of the oscillator matched the diameter of the round jet to facilitate comparison. Table 1 shows the detailed dimensions of different aspect ratio fluidic oscillators and the corresponding round jets.
Table 1.
Geometric dimension of the fluidic oscillator and round jet.
| Aspect ratio | Fluidic Oscillator | Round jet | ||
|---|---|---|---|---|
| Throat width [mm] | Throat height [mm] | Hydraulic diameter [mm] | Diameter [mm] | |
| 0.5 | 2.5 | 5 | 3.33 | 3.33 |
| 0.75 | 2.5 | 3.33 | 2.85 | 2.85 |
| 1 | 2.5 | 2.5 | 2.5 | 2.5 |
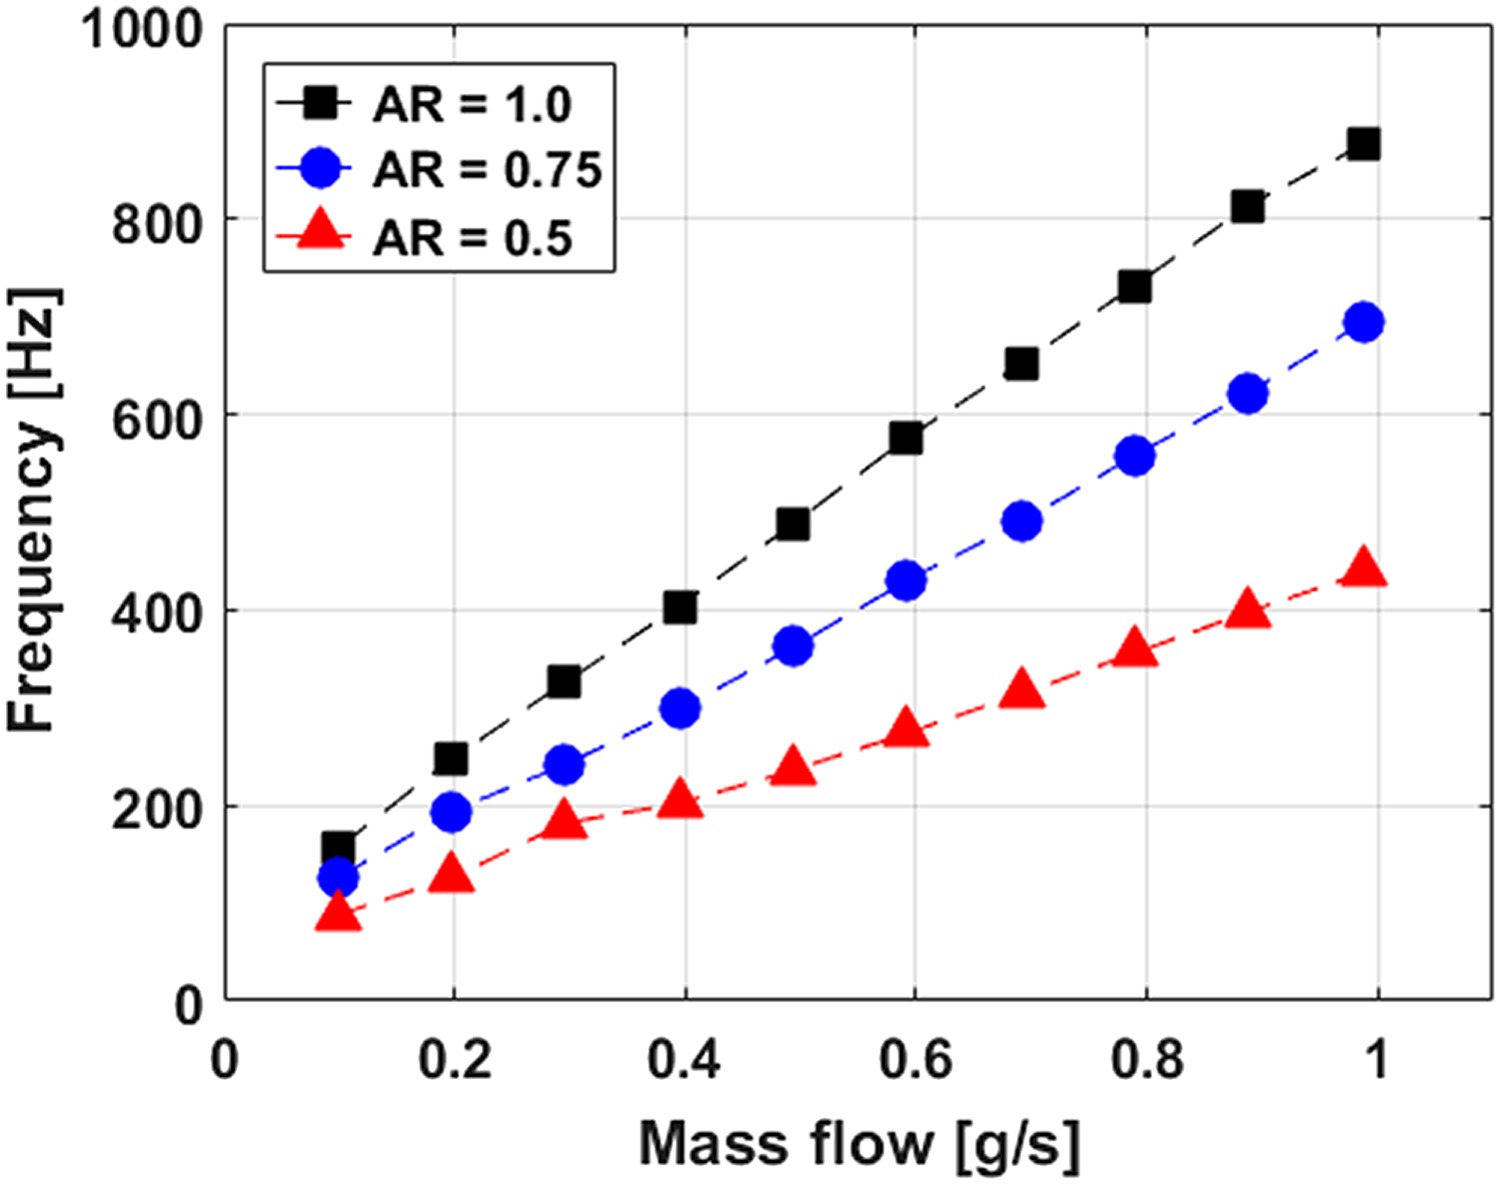
The devices were characterized by the oscillating frequency of the sweeping jet. The fluctuating pressure wave caused by the unsteady motion of the fluidic oscillator was measured by a 1/4″ DeltaTron type 4954B microphone. The bandwidth of the microphone sensor was 30–3,000 Hz, which limited the frequency measurement at very low flow rates. The test was conducted at flow rates between 0.1 and 4 g/s. The peak frequencies for three different aspect ratio fluidic oscillators are plotted in Figure 4. A proportional relationship between peak frequency and aspect was observed. Similar behavior was observed for large-scale fluidic oscillators and has been reported previously (Ostermann et al., 2016).
Figure 4.
Peak oscillation frequency of different aspect ratio fluidic oscillator as a function of mass flow rate.
During each test, the external surface temperature was measured by a FLIR 325sc infrared (IR) camera. The camera has a resolution of 320 × 240 pixels and a maximum frame rate of 60 Hz. At each test condition, surface and flow temperatures were monitored until steady state was achieved. It took approximately 30 minutes to reach the steady state condition during each test. A sequence of 50 images was recorded with the IR camera during each test. The temperature of the coolant and the freestream were also recorded simultaneously. Since the heat transfer is occurring at the internal and the external surfaces of the leading edge, the overall cooling effectiveness (θ) was estimated with Equation 4-
Here, T∞ and Tc are the temperature of the freestream and the coolant respectively and Tw is the external surface temperature obtained from the IR measurement. The effect of jet-to-wall spacing (H/D), aspect ratio (AR), jet spacing (P/D) and freestream turbulence (Tu) on the overall cooling effectiveness are discussed in the subsequent sections.
Test conditions
Since the Biot number of the leading edge is a function of both internal and external heat transfer coefficients, the coolant mass flow rate and the freestream flow velocity need to be adjusted to match the Biot number of the actual engine. The estimated Bi number is approximately 0.1 for a nominal freestream velocity of 10 m/s. Several parameters such as aspect ratio (AR), jet spacing (P/D), jet-to-wall (H/D) distance and freestream turbulence (Tu) were varied. A detailed list is shown in Table 2.
Results
Effect of jet-to-wall spacing (H/D)
Figure 5 shows the overall cooling effectiveness (θ) contours for the sweeping jet and the steady jet at three different jet-to-wall spacings (H/D). The left column of Figure 5 shows the sweeping jet results with an aspect ratio of unity and the right column of Figure 5 shows the overall cooling effectiveness for the steady jet. The jet-to-wall spacing (H/D) is increasing from top to bottom of the contour plots. A high overall cooling effectiveness is observed at the stagnation region (S/D = 0) for both sweeping jet and steady jet cases.
Figure 5.
Overall cooling effectiveness contours for sweeping jet (AR = 1) and steady jet (Dh = 2.5 mm) at three different jet-to-wall spacing (H/D).

In addition, the overall value of θ decreases as H/D increases. It is well established from the previous research that the flowfield of a steady impinging jet varies significantly with the jet-to-wall spacing (Zuckerman and Lior, 2006). At low H/D (∼3–5), the jet impinges the wall with a strong potential core. The boundary layer remains very thin at the stagnation zone resulting in a high rate of heat transfer. As H/D increases, the width of the potential core reduces due to viscous diffusion and the jet velocity approaching the wall reduces significantly resulting in a reduction of heat transfer rate. This phenomenon was also observed in this study. The overall cooling effectiveness decreases as H/D increases for the steady jet.
However, the sweeping jet shows non-monotonic performance compared to the steady jet. At low H/D = 3, the cooling performance of the sweeping jet and the steady jet are similar. The sweeping action of the fluidic oscillator is not effective at this low jet-to-wall spacing due to lack of space to sweep. However, the sweeping action becomes more dominant at H/D = 5 and the overall cooling effectiveness improves significantly at this jet-to-wall spacing compared to the steady jet case. In addition, the curved surface keeps the sweeping jet more normal to the wall resulting in a uniform coolant distribution in a wider area compared to the steady jet. It is important to note that the sweeping action of the jet also increases viscous dissipation. Therefore, the sweeping jet loses its potential core at a faster rate compared to the steady jet. This effect is also observed at H/D = 8 where the overall cooling effectiveness for the sweeping jet is significantly lower than the steady jet.
Figure 6 shows the span averaged overall cooling effectiveness distributions for the sweeping jet and the steady jet at three different jet-to-wall spacings (H/D = 3,5,8). In addition, the results are shown for three different aspect ratio (AR) oscillators, compared to the correspondingly sized circular jets. It is evident that at H/D = 3, the span averaged cooling effectiveness for the sweeping jet does not change significantly compared to the steady jet. However, the span averaged effectiveness is significantly higher for the sweeping jet at H/D = 5 compared to the steady jet at the similar H/D. This phenomenon was observed for all aspect ratio oscillators. As described earlier, the cooling effectiveness for sweeping jet drops substantially at H/D = 8 compared to the steady jet, which is evident in Figure 6. Similar results were observed for P/D = 6.
Figure 6.
Overall cooling effectiveness distribution for sweeping jets of different aspect ratios (AR) and the corresponding steady jets at P/D = 4.
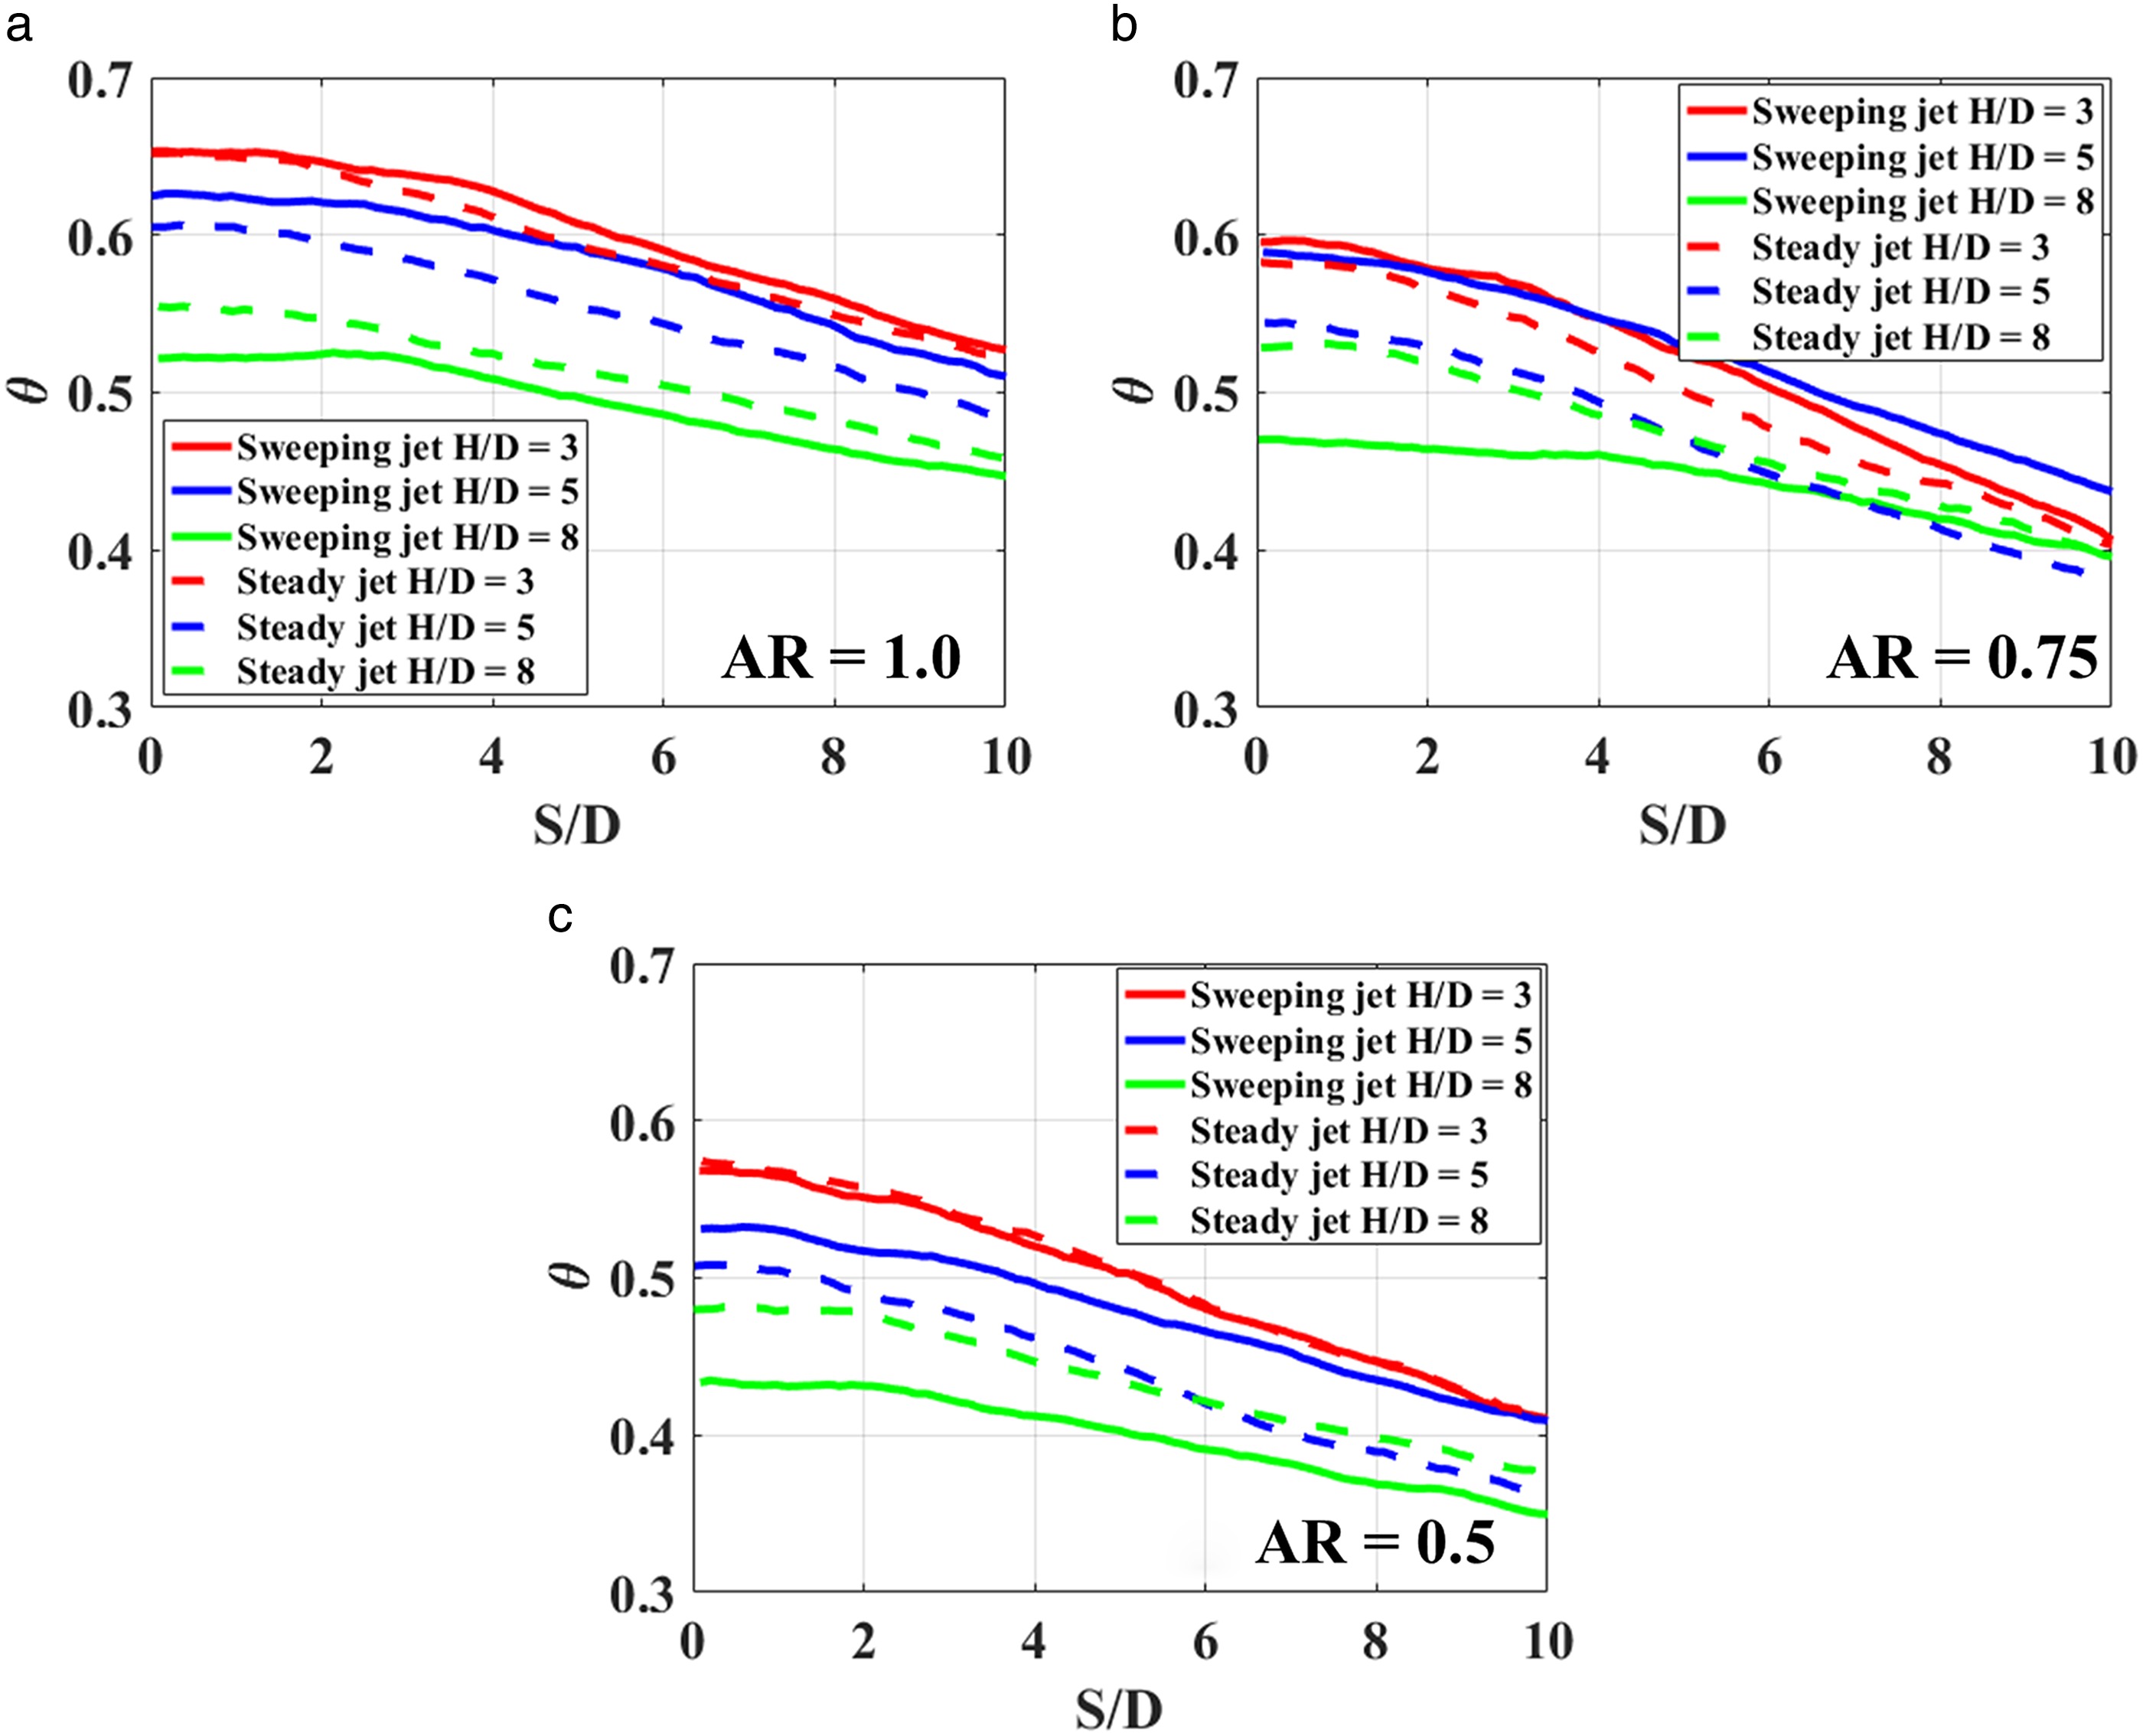
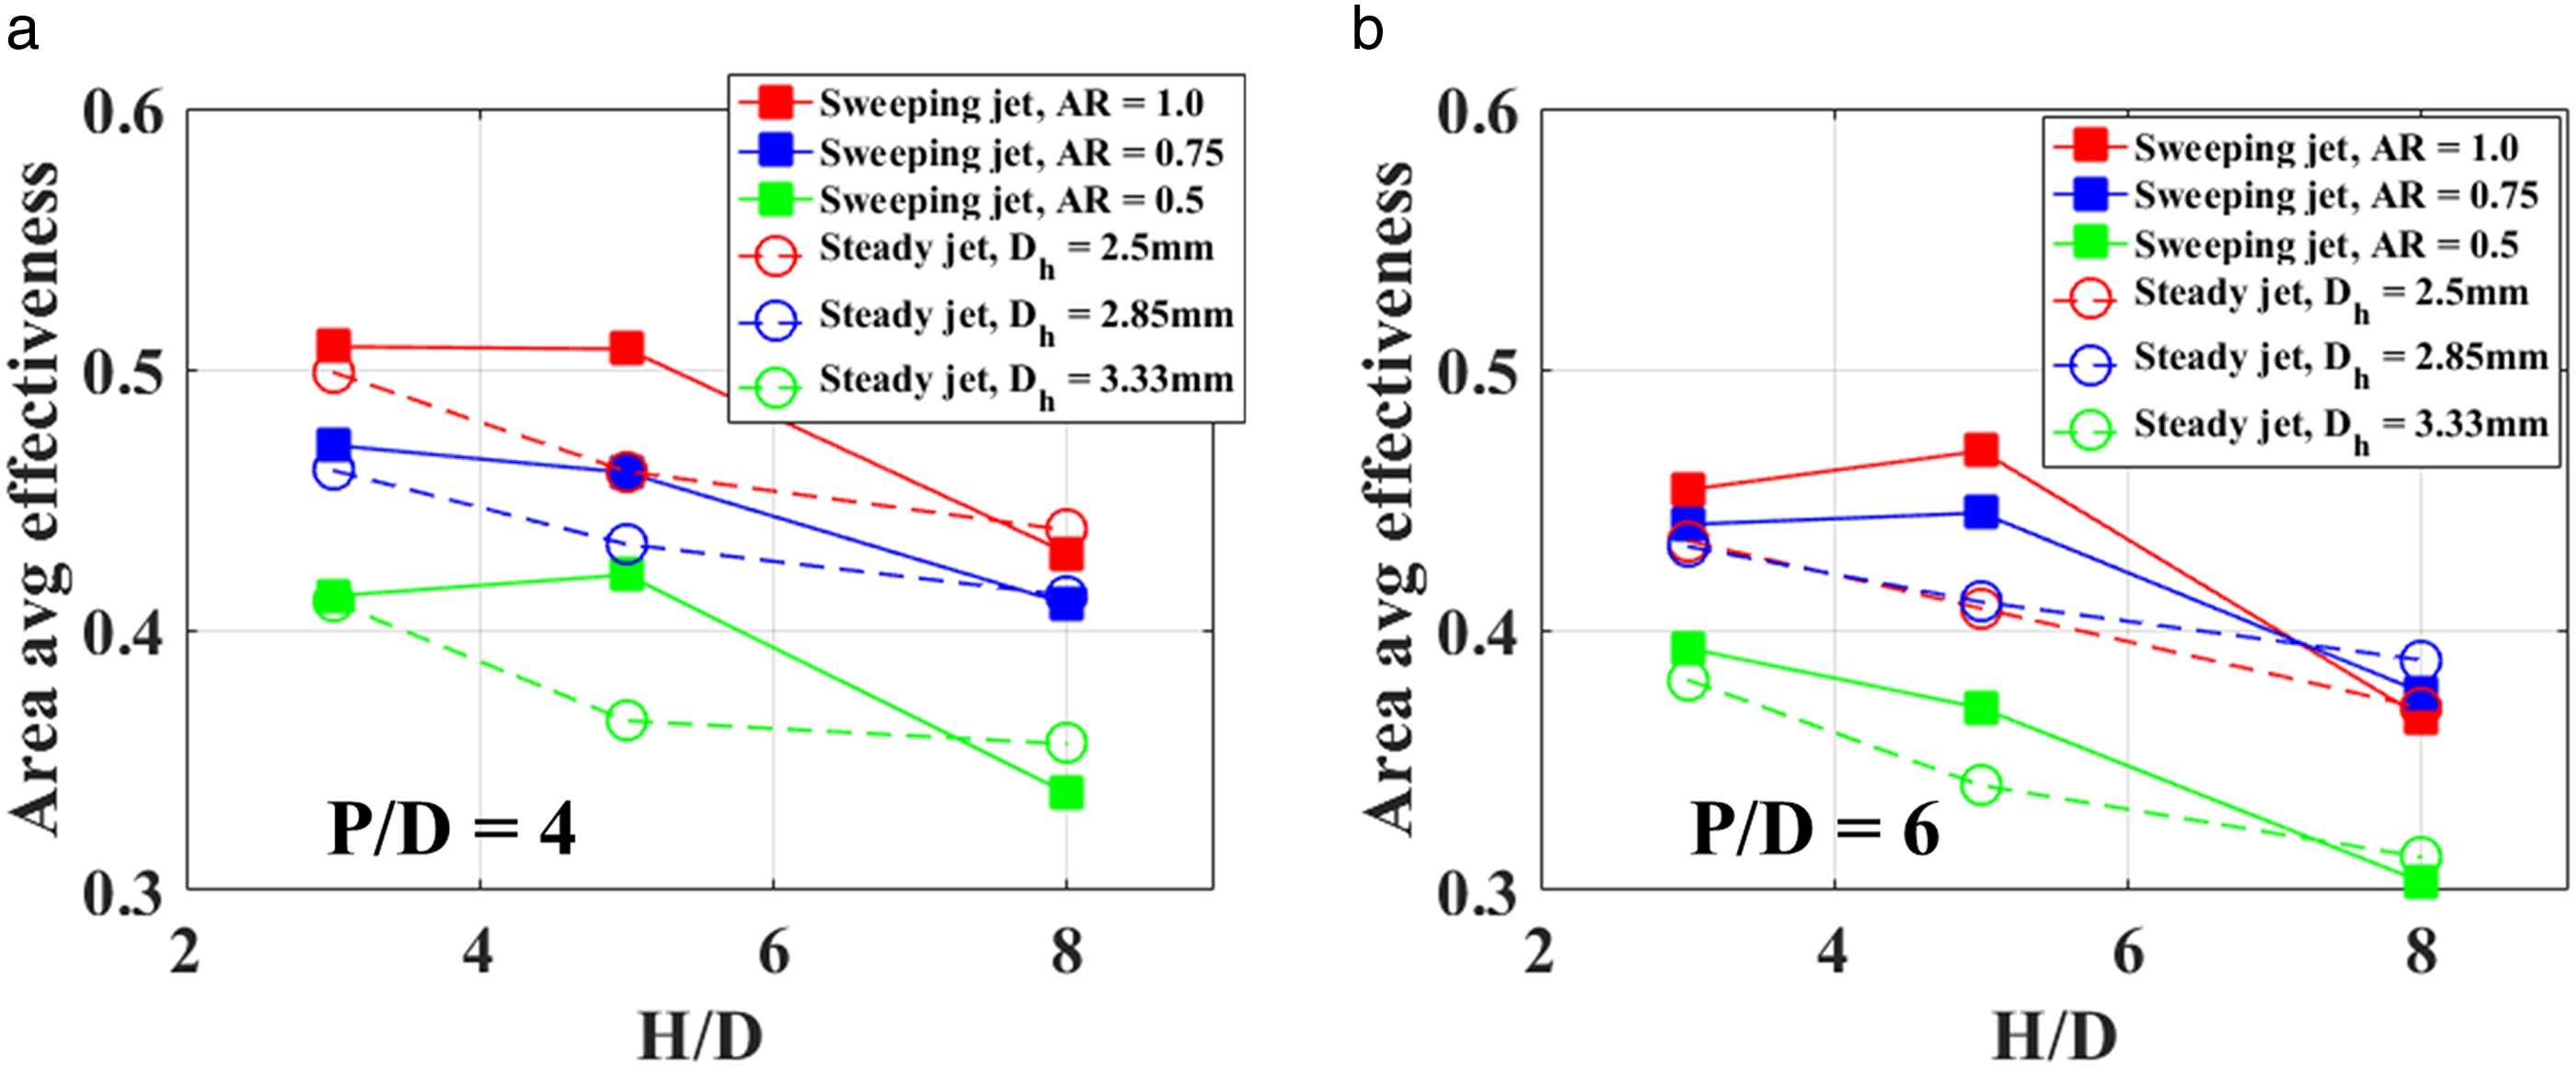
Figure 7 shows the area averaged cooling effectiveness for the sweeping jet and the steady jet as a function of jet-to-wall (H/D) spacing. Results are shown for three different aspect ratio fluidic oscillators at a jet spacing of P/D = 4 (Figure 7a) and 6 (Figure 7b). It is evident that the fluidic oscillator with an aspect ratio of unity exhibits the best cooling performance of the three aspect ratio oscillators. In addition, the highest improvement in cooling performance for sweeping jet compared to a steady jet was observed at H/D = 5 at all aspect ratios and both jet pitches.
Effect of aspect ratio (AR)
Figure 8 shows the overall cooling effectiveness (θ) contours for the sweeping jet and the steady jet at three different aspect ratios (AR). The left column of Figure 8 shows the sweeping jet results with decreasing aspect ratio from top to bottom and the right column of Figure 8 shows the overall cooling effectiveness for the steady jet at a hydraulic diameter that corresponds to each aspect ratio oscillator. Results are shown at H/D = 5, as this jet-to-wall spacing showed the best cooling performance for the sweeping jet. A high overall cooling effectiveness (θ) is observed for a sweeping jet with an aspect ratio (AR) of unity, and the overall value of θ decreases as AR decreases. Since low aspect ratio fluidic oscillators have a larger volume (Figure 3), it requires a higher massflow rate to initiate a stronger oscillation at the exit of the throat. Due to a weak oscillation, the lower aspect ratio (AR = 0.5) fluidic oscillator tends to have a poor cooling performance compared to the high aspect ratio (AR = 1) oscillator.
Figure 8.
Nondimensional temperature contours for sweeping jet and steady jet at H/D = 5 and different aspect ratios (AR).
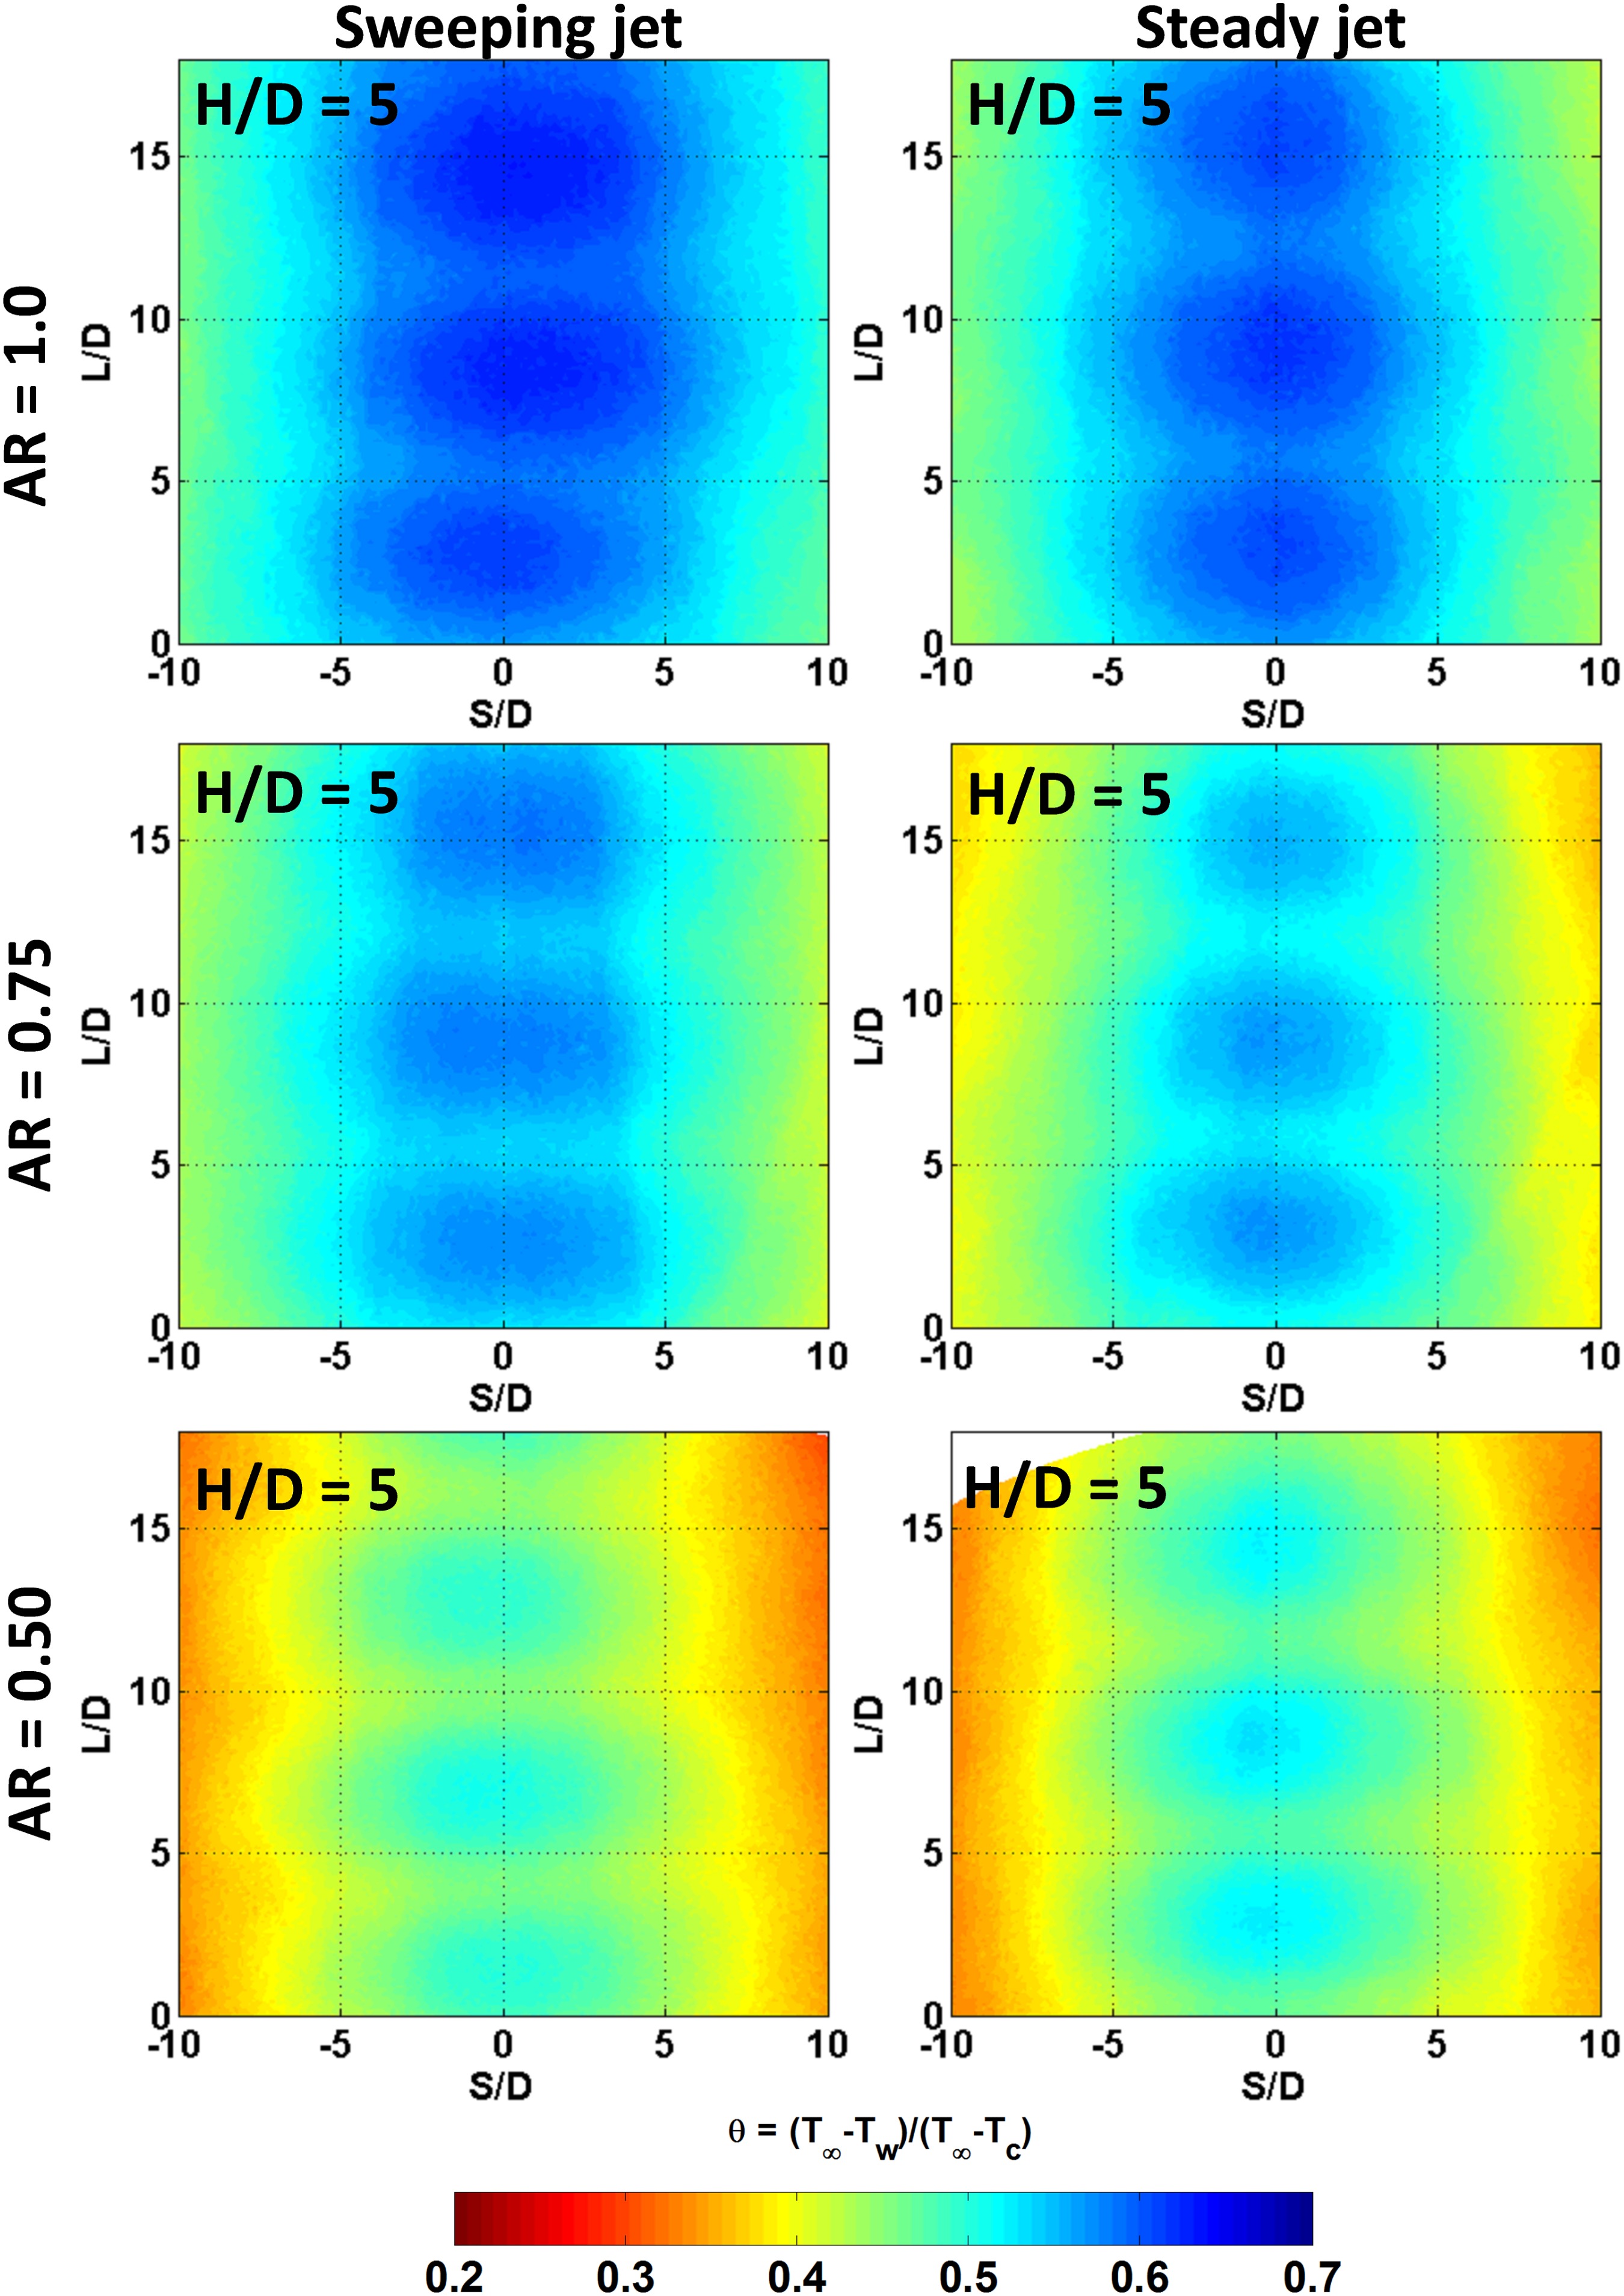
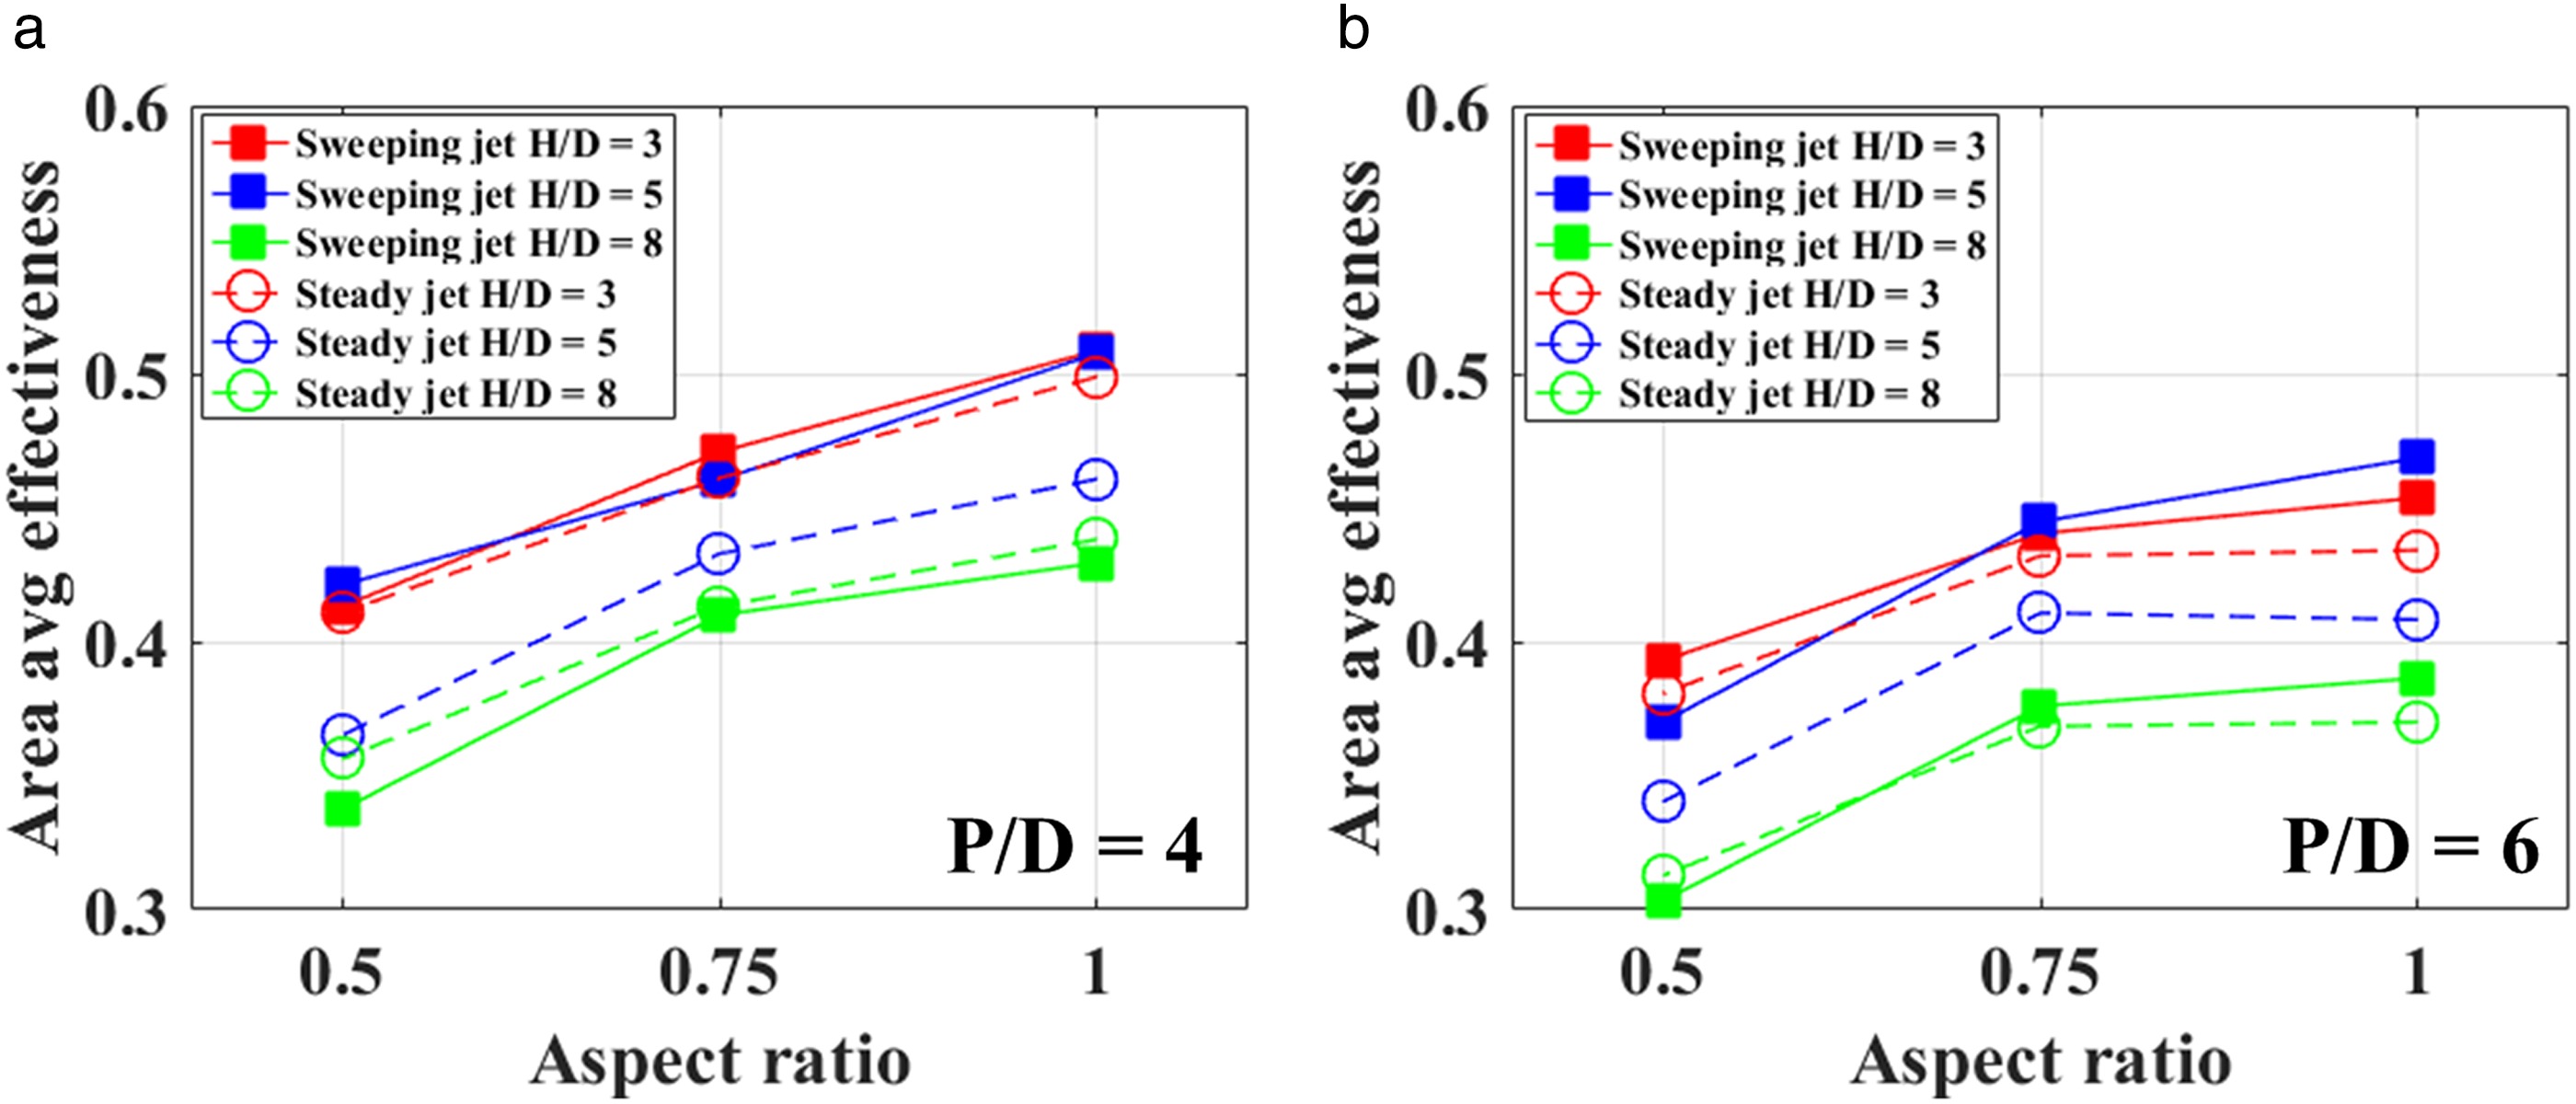
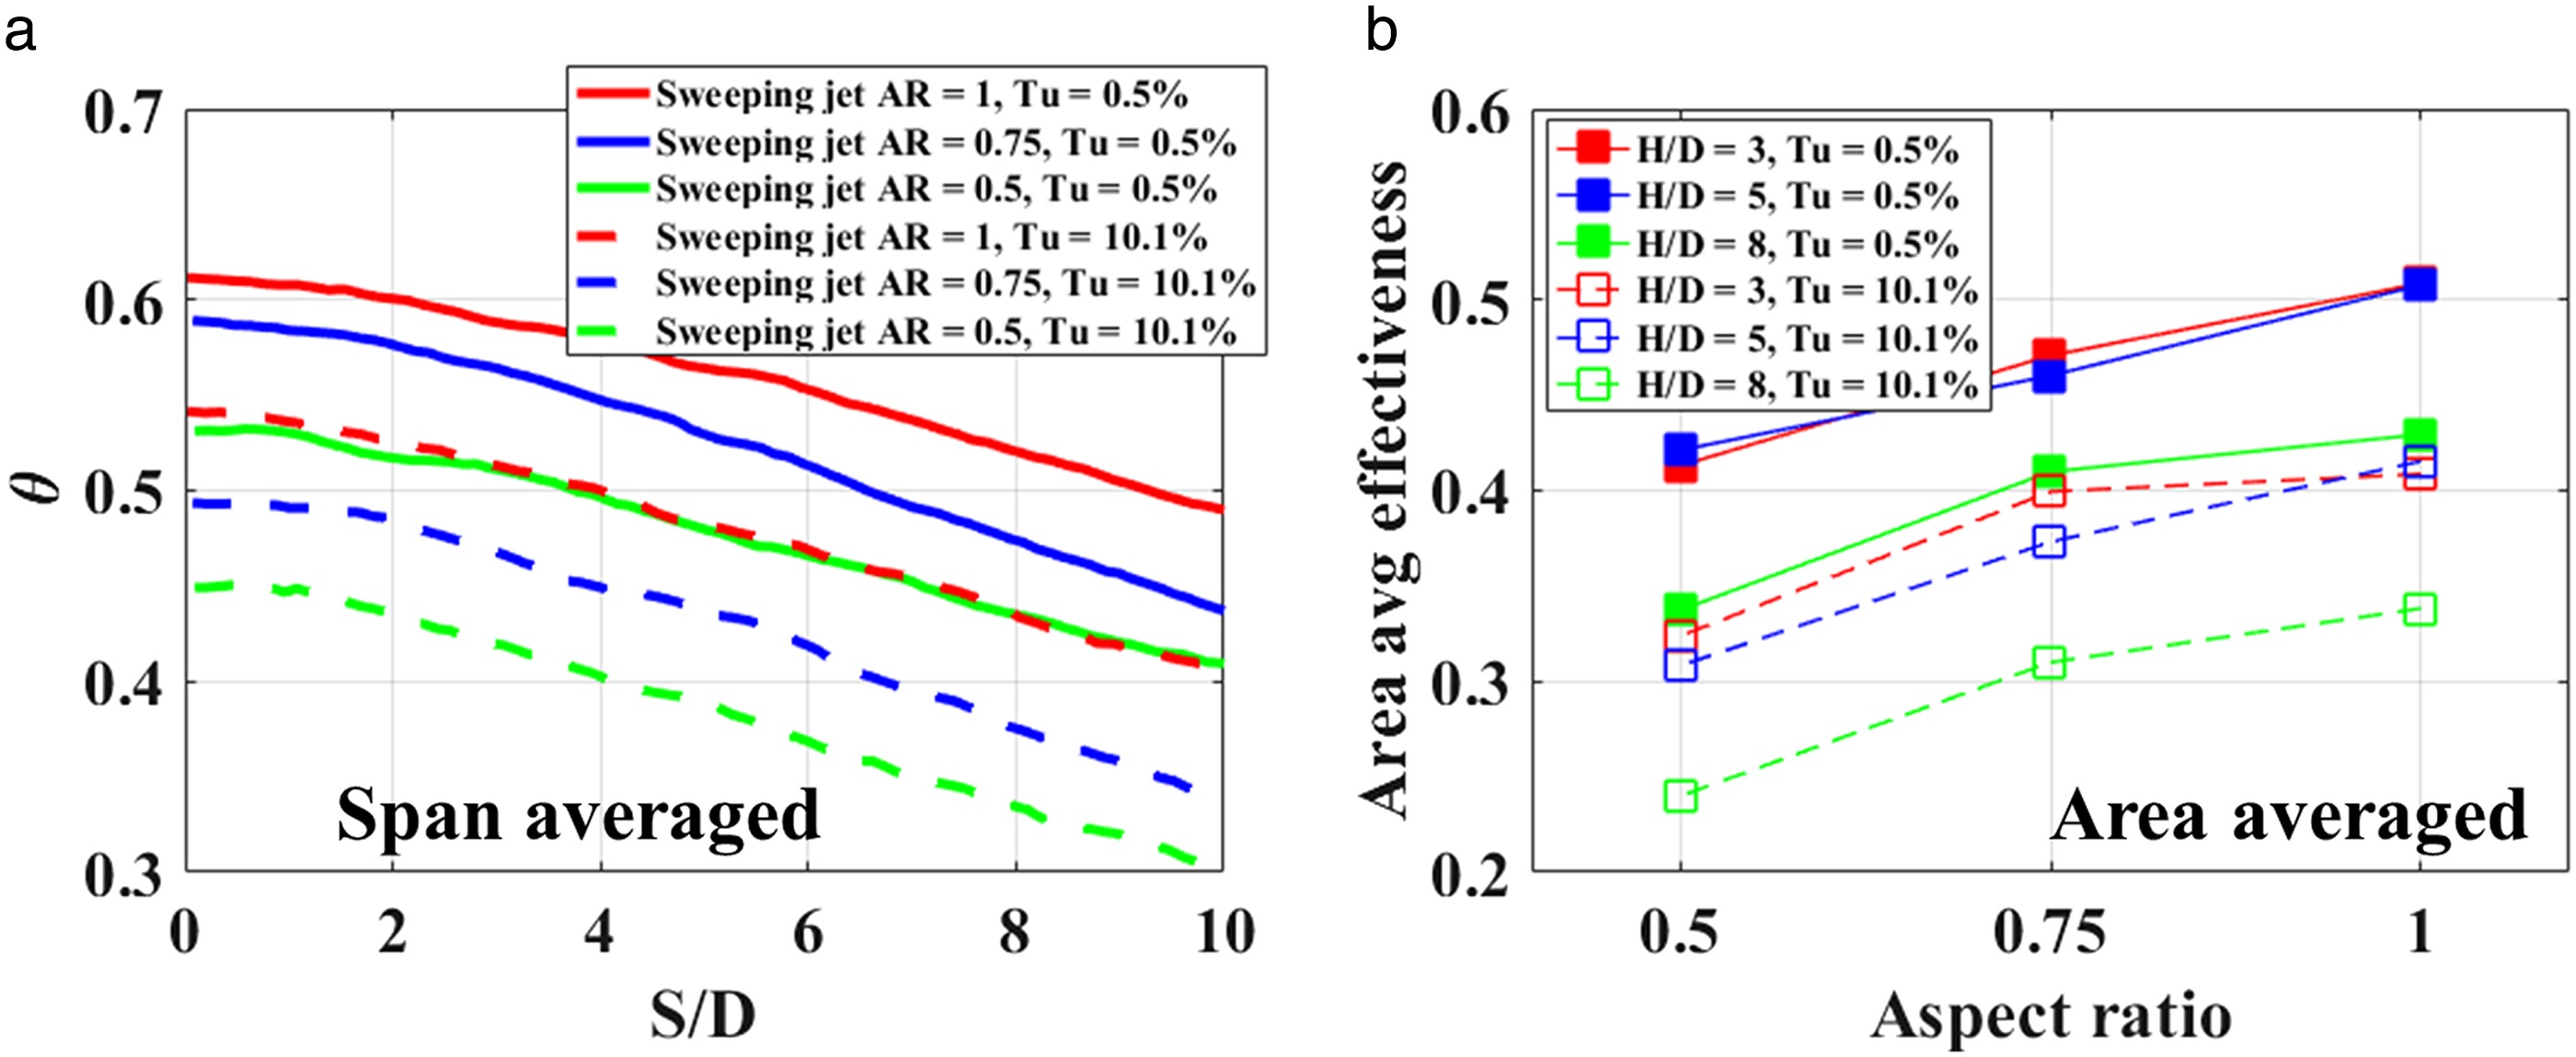
Figure 9 shows the span averaged cooling effectiveness distributions for the sweeping jet and the steady jet at three different jet-to-wall spacings (H/D = 3,5,8). In addition, the results are shown for three different aspect ratio (AR) oscillators. It is evident that at AR = 1, the span averaged cooling effectiveness for the sweeping jet shows the highest cooling performance among all three aspect ratio oscillators. Figure 10 shows the area averaged cooling effectiveness for the sweeping jet and the steady jet as a function of aspect ratio (AR). Results are shown for three different jet-to-wall spacings (H/D) at P/D = 4 (Figure 10a) and 6 (Figure 10b). It is evident that the fluidic oscillator with an aspect ratio of unity exhibits the best cooling performance of all three aspect ratio oscillators. In addition, the highest improvement in cooling performance for sweeping compared to a steady jet was observed at H/D = 5 at all aspect ratios and both jet pitches.

Effect of jet spacing (P/D)
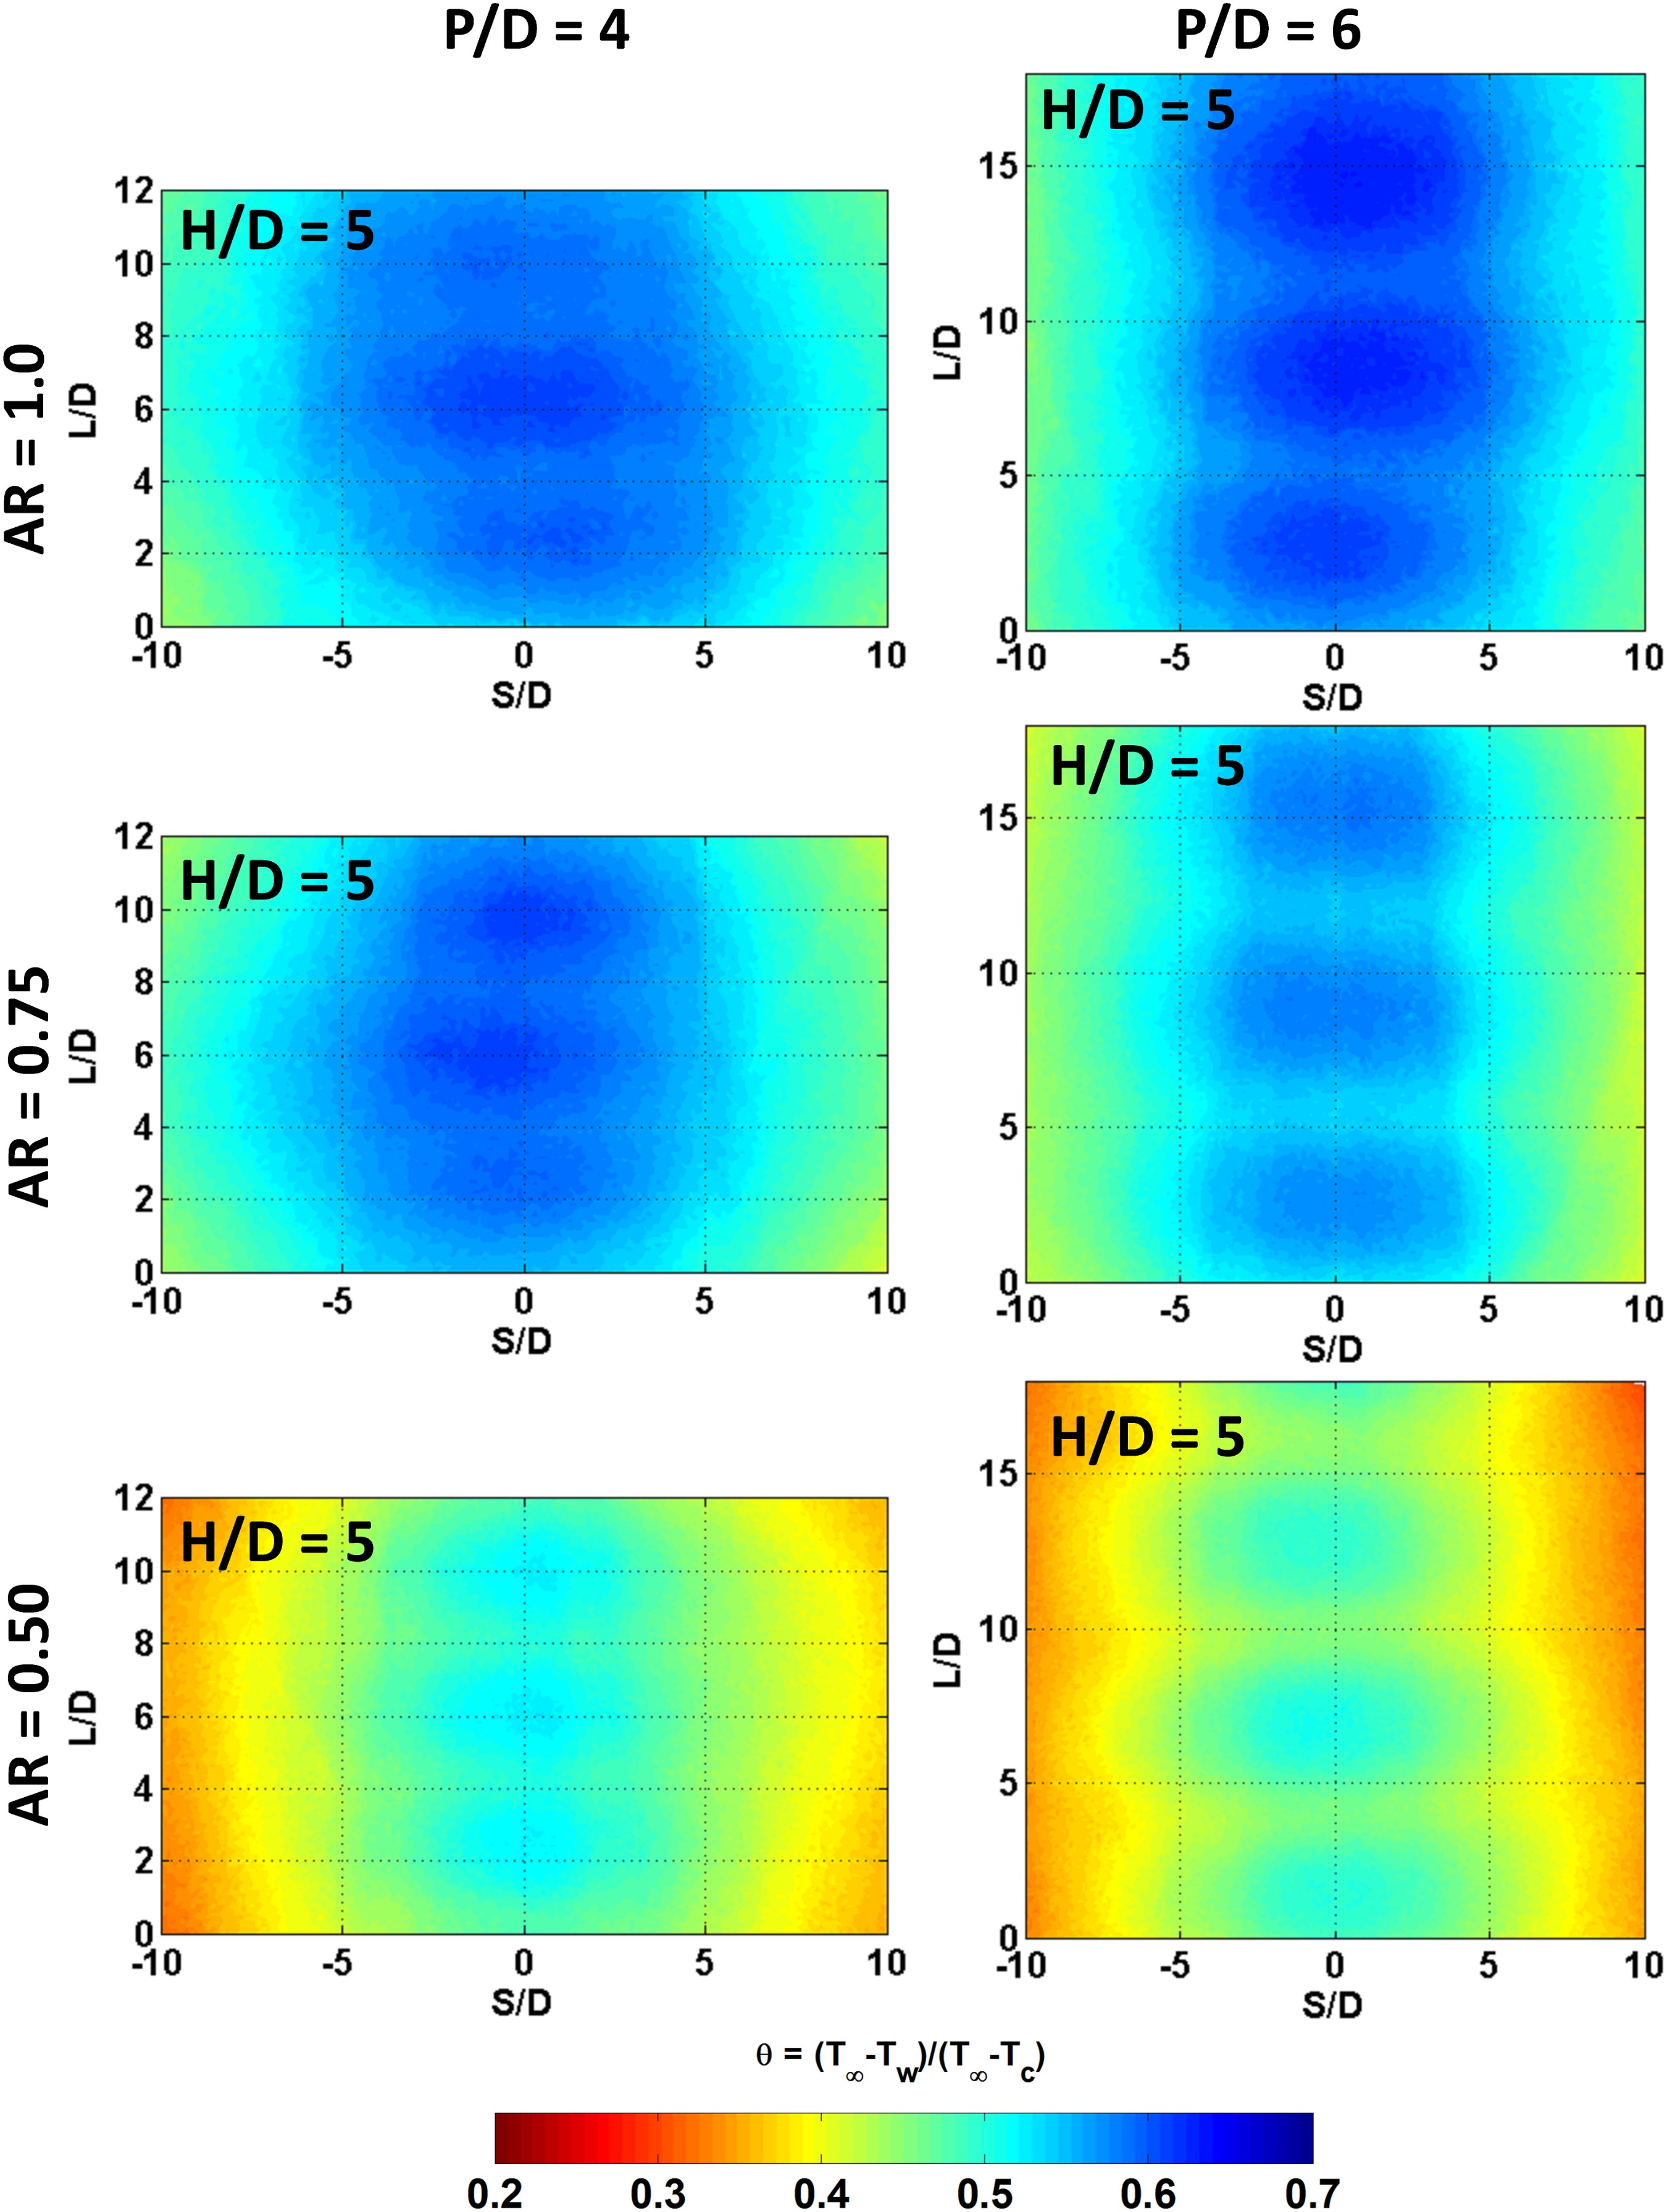
Figure 11 shows the overall cooling effectiveness contours for the sweeping jet at three different aspect ratios (AR). The left column of Figure 11 shows the sweeping jet results with a decreasing aspect ratio (top to bottom) and a jet spacing of P/D = 4. The right column of Figure 11 shows the sweeping jet results for a jet spacing of P/D = 6. Results are shown at H/D = 5, as this jet-to-wall spacing showed the best cooling performance for the sweeping jet. A high overall cooling effectiveness is observed for the sweeping jet with a jet spacing of P/D = 4. In addition, the overall value of θ decreases as AR decreases. The data were consistent with all aspect ratio devices and all jet-to-wall spacing cases which is shown in Figure 12. Since the high jet spacing (P/D = 6) corresponds to a largely spaced oscillator, the interactions between the adjacent jets are less dominating thus reduce the cooling performance.

Effect of freestream turbulence (Tu)
Figure 13 shows the effect of freestream turbulence on overall cooling effectiveness contours for the sweeping jet at three different aspect ratios (AR). The left column of Figure 13 shows the sweeping jet results with a decreasing aspect ratio (top to bottom) and a low freestream turbulence of Tu = 0.5%. The right column shows the sweeping jet results for a high freestream turbulence of Tu = 10.1%.
Figure 13.
Overall cooling effectiveness contours for sweeping jets with different freestream turbulence at H/D = 5 and P/D = 6.
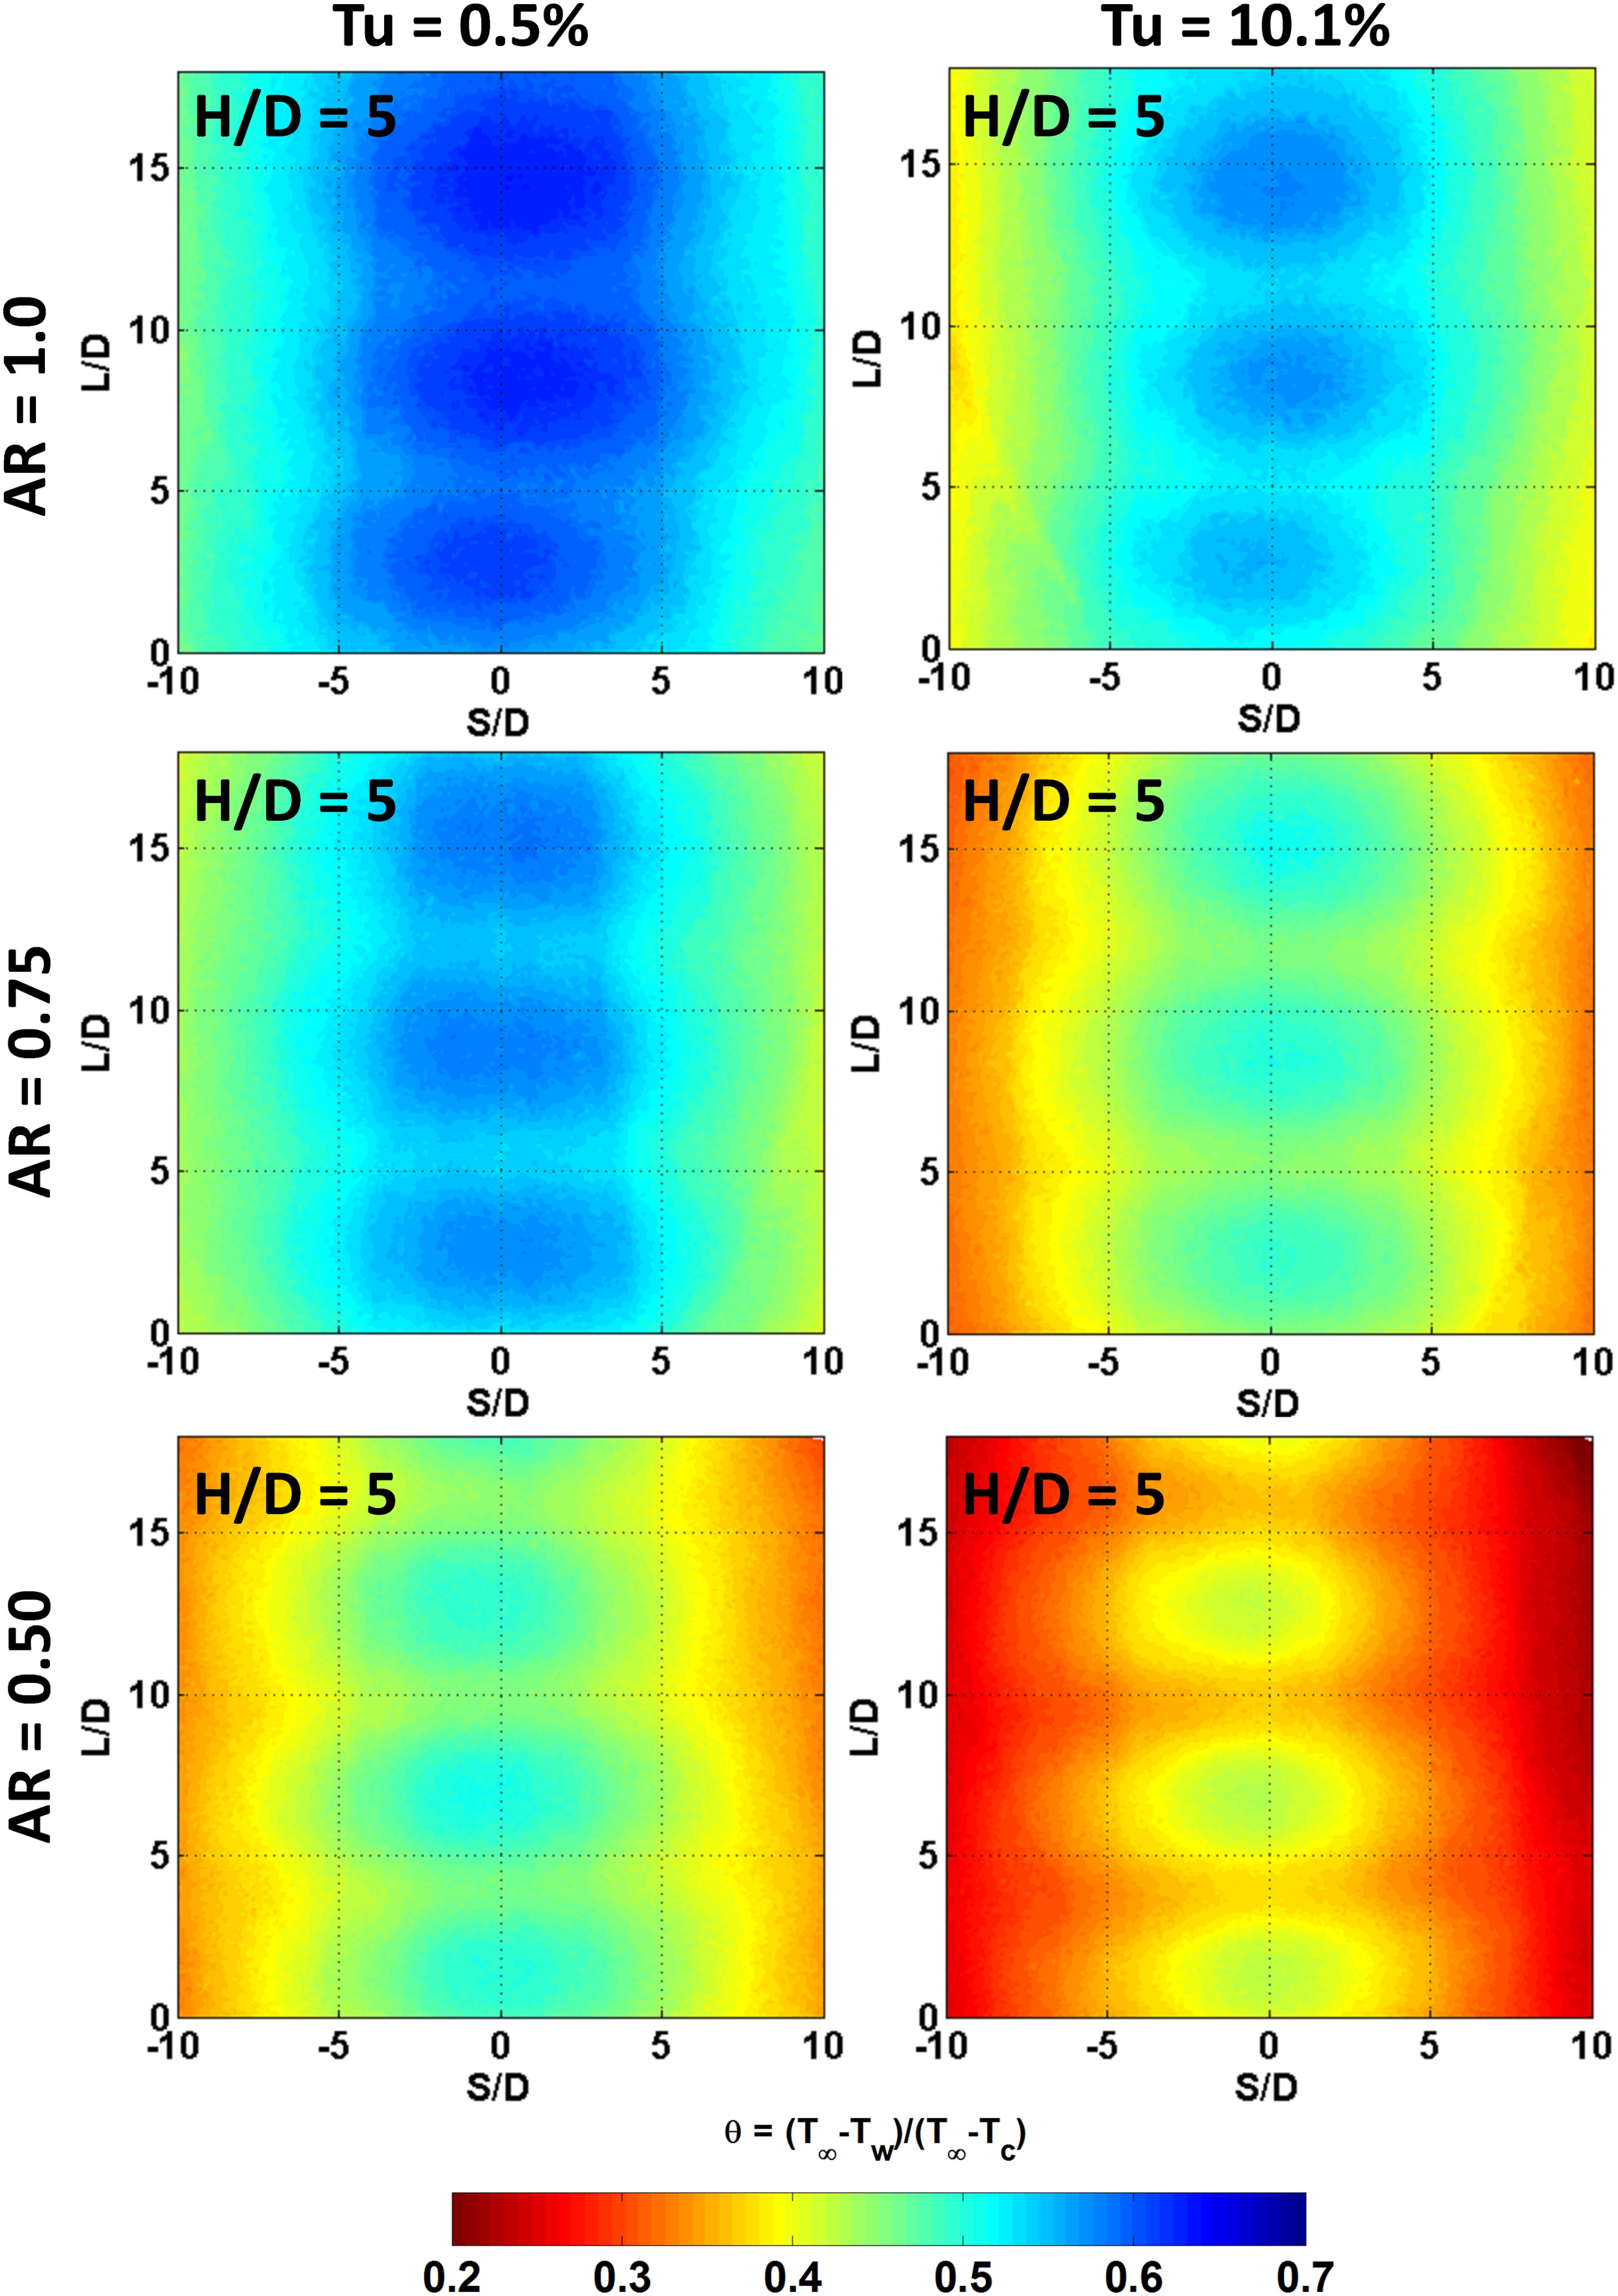
Results are shown at H/D = 5, as this jet-to-wall spacing showed the best cooling performance for the sweeping jet. The overall cooling effectiveness decreases significantly with the freestream turbulence. In addition, the overall value of θ decreases as AR decreases. The data were consistent with all aspect ratio (AR) devices and all jet-to-wall spacing (H/D) cases which are shown in Figure 14. Since the high freestream turbulence augments heat transfer on the external surface of the leading edge, the internal cooling is less effective thus reduces the cooling performance.
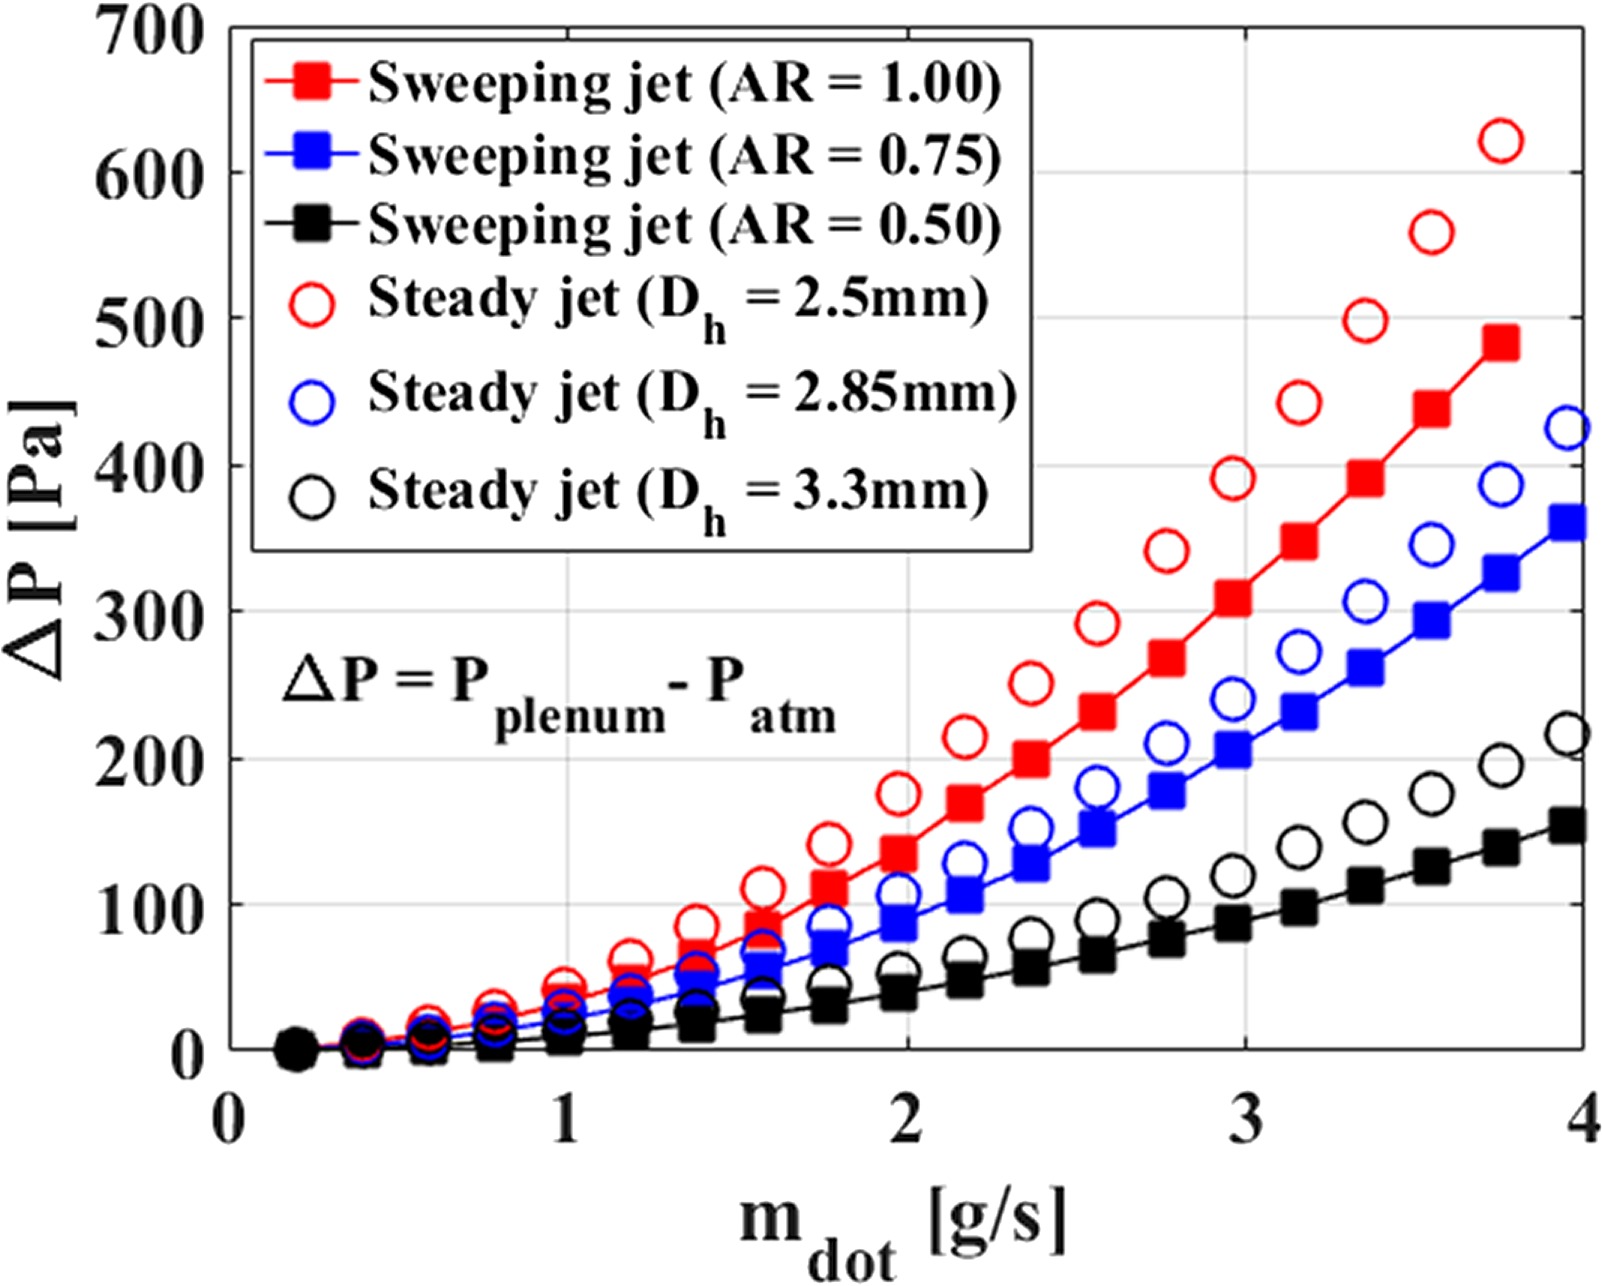
Pressure loss measurement
Figure 15 shows the pressure drop between the supply plenum and the exit of the nozzle for both sweeping jet and steady jets as a function of the massflow rate. It is evident that the pressure drop has a decreasing trend as the aspect ratio decreases. Since the aspect ratio is defined as the ratio of the throat width to throat height, smaller aspect ratios correspond to the larger throat area. Similar trends are also observed for the steady jet. However, the pressure drop for the sweeping jet is smaller than the steady jet at the corresponding massflow, which implies an additional benefit of using sweeping jets for impingement cooling.
Conclusions
A simulated turbine vane leading edge cooling experiment was performed using sweeping jet impingement cooling. A low-speed wind tunnel was used with a scaled up faired cylindrical leading edge at engine relevant Biot number. Overall cooling effectiveness was estimated at varying jet-to-wall distance (H/D), jet aspect ratio (AR), and jet spacing (P/D) and compared with conventional steady circular jet results. The key findings are listed below –
The overall cooling effectiveness decreases with increasing jet-to-wall (H/D) spacing for steady jet. However, the sweeping jet shows non-monotonic performance compared to the steady jet. At H/D = 5, the sweeping action is dominant and the overall cooling effectiveness improves significantly at this jet-to-wall spacing compared to the steady jet case.
A high overall cooling effectiveness (θ) is observed for sweeping jets with an aspect ratio (AR) of unity. Due to a weak oscillation, the lower aspect ratio (AR = 0.5) fluidic oscillator tends to have a poor cooling performance compared to the high aspect ratio (AR = 1) oscillator.
A high overall cooling effectiveness (θ) is observed for sweeping jets with a jet spacing of P/D = 4. Since the high jet pitch (P/D = 6) corresponds to a largely spaced oscillator, the interactions between the adjacent jets are less dominating thus reduce the cooling performance.
Overall cooling performance tends to deteriorate with increases freestream turbulence.
The pressure drop for the sweeping jet is smaller than the steady jet at the corresponding massflow rates.
Nomenclature
AR
Aspect ratio [-]
At
Throat area [m2]
Bi
Biot number [-]
D
Throat hydraulic diameter [m]
H
Jet to wall distance [m]
h
Throat height [m]
hh
External convective heat transfer coefficient [W/m2 K]
hc
Internal convective heat transfer coefficient [W/m2 K]
ks
Thermal conductivity of solid [W/m K]
Ls
Characteristics length scale of solid [m]
P
Jet pitch or pressure [Pa]
Tc
Coolant temperature [K]
Tw
Surface temperature [K]
T∞
Freestream temperature [K]
Tu
Turbulence intensity [%]
W
Throat width [m]
θ
Overall cooling effectiveness [-]