
Introduction
Radial compressors are found in a diverse range of applications and are operated with many different working fluids. The demand for aerodynamic performance and efficiency results in high material load and induced vibrations. Resonance on the rotating blades leads to high cycle fatigue and is one of the main contributors to failures (Srinivasan, 1997). It is therefore required to assess vibrations and high cycle fatigue mechanisms during the design phase of the components since they contribute to the development and maintenance costs (El-Aini et al., 1997; Kielb, 1998).
Among other sources of excitation, fluid structure interaction between the impeller blades and the downstream vaned diffuser is of significance as showed by (Haupt and Rautenberg, 1984). Past research on impeller-diffuser interaction (IDI) is often focused on the impact of geometrical design variations. For example experimental flow investigations have been undertaken by (Ziegler et al., 2003a,b) where a small radial gap between impeller exit and diffuser inlet lead to more homogenous flow structures, and according to (Gallier et al., 2010) it also leads to reduced wake regions at impeller exit. Time resolved flow simulations of radial compressors have been conducted by (Boncinelli et al., 2007) showing that smaller radial gap sizes are beneficial to the compressor performance. More recent studies on the influence of the radial gap size on resonant blade response have been conducted by (Zemp and Abhari, 2012). Experimental and numerical investigations showed increased unsteady forces and the highest vibratory response amplitude for small radial gaps. Damping and response characteristics were found to be highly dependent on blade mode and operating points. It has been shown that numerical flow simulations alone are not sufficient to predict response behaviour.
A numerical study investigating the impact of disk and blade geometry on mode coupling was conducted by (Walton and Tan, 2016). The generalized force, obtained by unsteady CFD simulations, and mode shape, was used as input for a two mass-spring system to estimate the amplitude response. The results indicate that the generalized force is able to describe blade excitation mechanisms.
In the area of vibration in process compressors, research has focused on acoustic modes generated in the compressor and causing fatigue of the connected piping system (Li et al., 2015) but not on resonant blade vibration. In the publication of (König et al., 2009) the cause of two impeller failures for high pressure natural gas compressors have been investigated and found to be caused by fluid structure interaction.
To the best of the author’s knowledge, no study has been undertaken that provides a direct comparison in terms of vibratory response for two working fluids of a compressor stage while the modal response remains unchanged. Due to the high sensitivity of blade excitation to flow and forcing, an investigation was found to be beneficial for future compressor design optimizations which would aim on minimizing the blade forcing. Within the scope of this study, CO2 was chosen for comparison with air. CO2 possesses distinct gas properties while allowing safe operation of the facility. Additionally, compression of CO2 will have increased relevance for carbon capture and storage (CCS) application in near zero emission power plants (Metz et al., 2005). Publications in this field were found to focus on efficiency improvements of the capturing process (Botero et al., 2009; Al-Abdulkarem et al., 2012). Further applications for CO2 are found in super critical power cycles with on-going research in efficiency and performance, e.g. (Heo et al., 2017) and fluid structure interaction of a simplified impeller like disk setup (Pereboom et al., 2016).
Methodology
The goal of this paper is to discuss the impact of forcing and damping on the resonance response amplitudes of a radial compressor for two different working fluids.
Dynamic strain gauges on the impeller main blade are used to measure the resonance crossing of mode 4, excited by the downstream vaned diffuser. Capturing the resonance crossing allows determining the maximum strain as well as estimation of the system’s critical damping ratio. This information is sufficient to determine the contribution of unsteady blade forcing to the operating point dependent resonant response amplitudes.
Unsteady CFD and FSI simulation approaches are used to complement the experiments. The generalized force distribution on the impeller blade is calculated based on time dependent blade pressure data obtained by CFD simulations. The results allow investigation of the blade regions that are most affected by changes in blade forcing.
Additional FSI simulations, using CFD and damping information from strain gauge (SG) measurements as input, are used to estimate the validity of the CFD simulations.
Facility overview
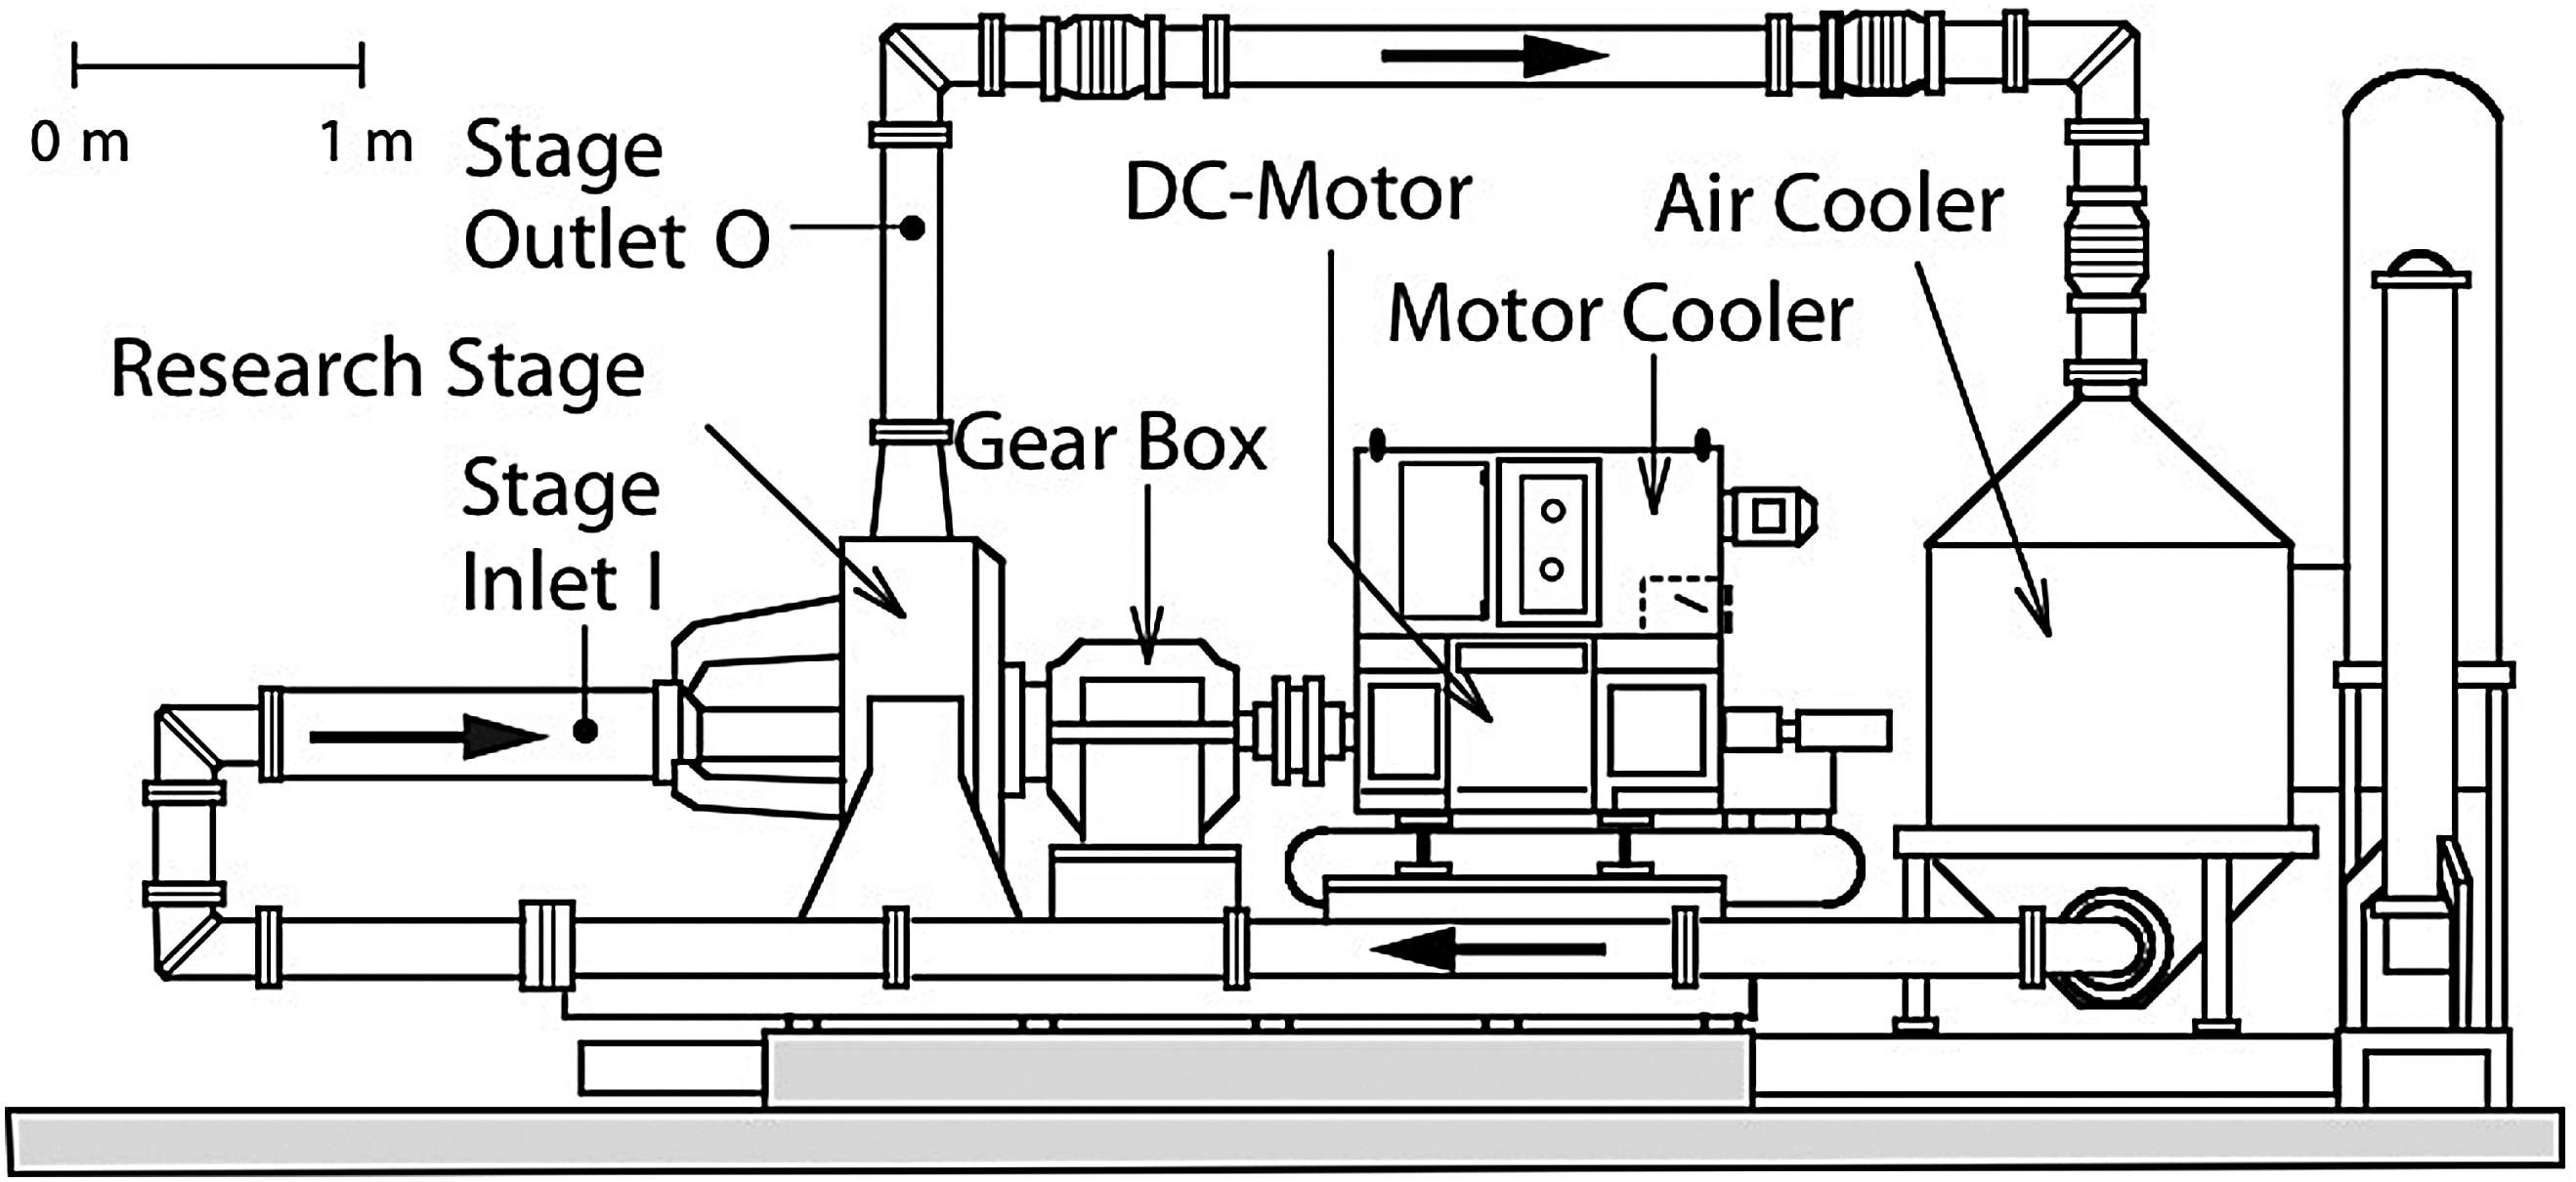
The experiments have been conducted at the ‘RIGI’ centrifugal compressor facility at the Laboratory for Energy Conversion at the Swiss Federal Institute of Technology in Zurich, Switzerland. A schematic of the test rig is shown in Figure 1 and is operated in a closed loop configuration, which allows controlling the stage inlet pressure, temperature and working fluid composition independently from the ambient conditions. The compressor is driven by a 485 kW electric motor allowing a maximum shaft speed of 22,000 rpm. Downstream of the compressor the working fluid is cooled by a heat exchanger. A variable throttle is used to discharge the flow and to set the desired mass flow rate, which is measured by a standard orifice. Pressure and temperature sensors up and downstream the compressor stage are used to estimate the compressor performance. The upstream pressure is actively controlled by a gas extraction and injection system. This in-house developed system is also responsible for controlling the CO2 concentration of the working fluid and measuring it with a time of flight sensor. The sensor is temperature compensated and calibrated to ambient air before each measurement run. Measurement accuracy of the CO2 concentration is 1.4 wt%, estimated by the method presented in (GUM, 1995).
The maximum inlet pressure, and density of the stage is limited by the available power of the electric motor and is below atmospheric for the rotational speeds of interest. The pressure and CO2 controller has to compensate for small leakages of air into the closed loop of the facility, limiting the maximum CO2 concentration to 50 wt%.
Compressor stage and operating point definition
The investigated high-speed centrifugal compressor stage is a state-of-the-art industrial design for turbocharging applications. The stage consists of an impeller with 9 main and 9 splitter blades and the downstream diffusor consists of 18 evenly spaced vanes, acting as source of forced blade vibration.
The study has been conducted for impeller main blade mode 4 for three volume flow rates and two working fluid compositions. Resonance conditions are achieved at 75% of the compressor’s design rpm. Higher modes exceed the rotational speed limitations of the facility and lower modes were found to be not critical to high cycle fatigue failures due to low blade forcing that occurs at volume flow rates and pressure ratios <50% of the design point.
The two working fluid compositions applied to the system consist of pure air and an air-CO2 mixture with 46 wt% of CO2. The differences in working fluid properties are shown in Table 1. Changes in the specific gas constant, specific heat and heat capacity ratio lead to changes in the compressor performance. At constant rotational speed the circumferential Mach number at the impeller exit increases by 11%, and an increase in pressure ratio is expected. This also results in an increase of the volumetric flow rate at choked conditions in the diffuser throat area, which is illustrated in Figure 4 of the performance map. Further information about this behaviour can be obtained from (Casey and Rusch, 2014), which provides a one-dimensional approach for determining the maximum flow capacity of the stage for a choked diffuser.
Figure 4.
Normalized compressor performance for air and air-CO2 mixture. CFD results are represented as single points.

Table 1.
Ratio of gas properties for constant compressor inlet density.
| MuMix/MuAir | 1.11 |
| 0.96 | |
| PEMix/PEAir | 0.84 |
The differences in the performance characteristics require the selection of comparable operating points. A specific percentage of the choked flow rate was used for comparison. Near choked (NC) conditions are defined by a volumetric flow rate of 97.5% of the choked volumetric flow rate for the applied gas. Near design (ND) conditions are subsequently defined at 90% and near stall (NS) at 80% choked volumetric flow rate. The inlet pressure for the CO2 mixture was adapted to achieve same gas density as for pure air at the compressor inlet. This decision was made to make optimal use of the available power of the facility and to maximize the vibrational response amplitudes.
Blade vibration measurements
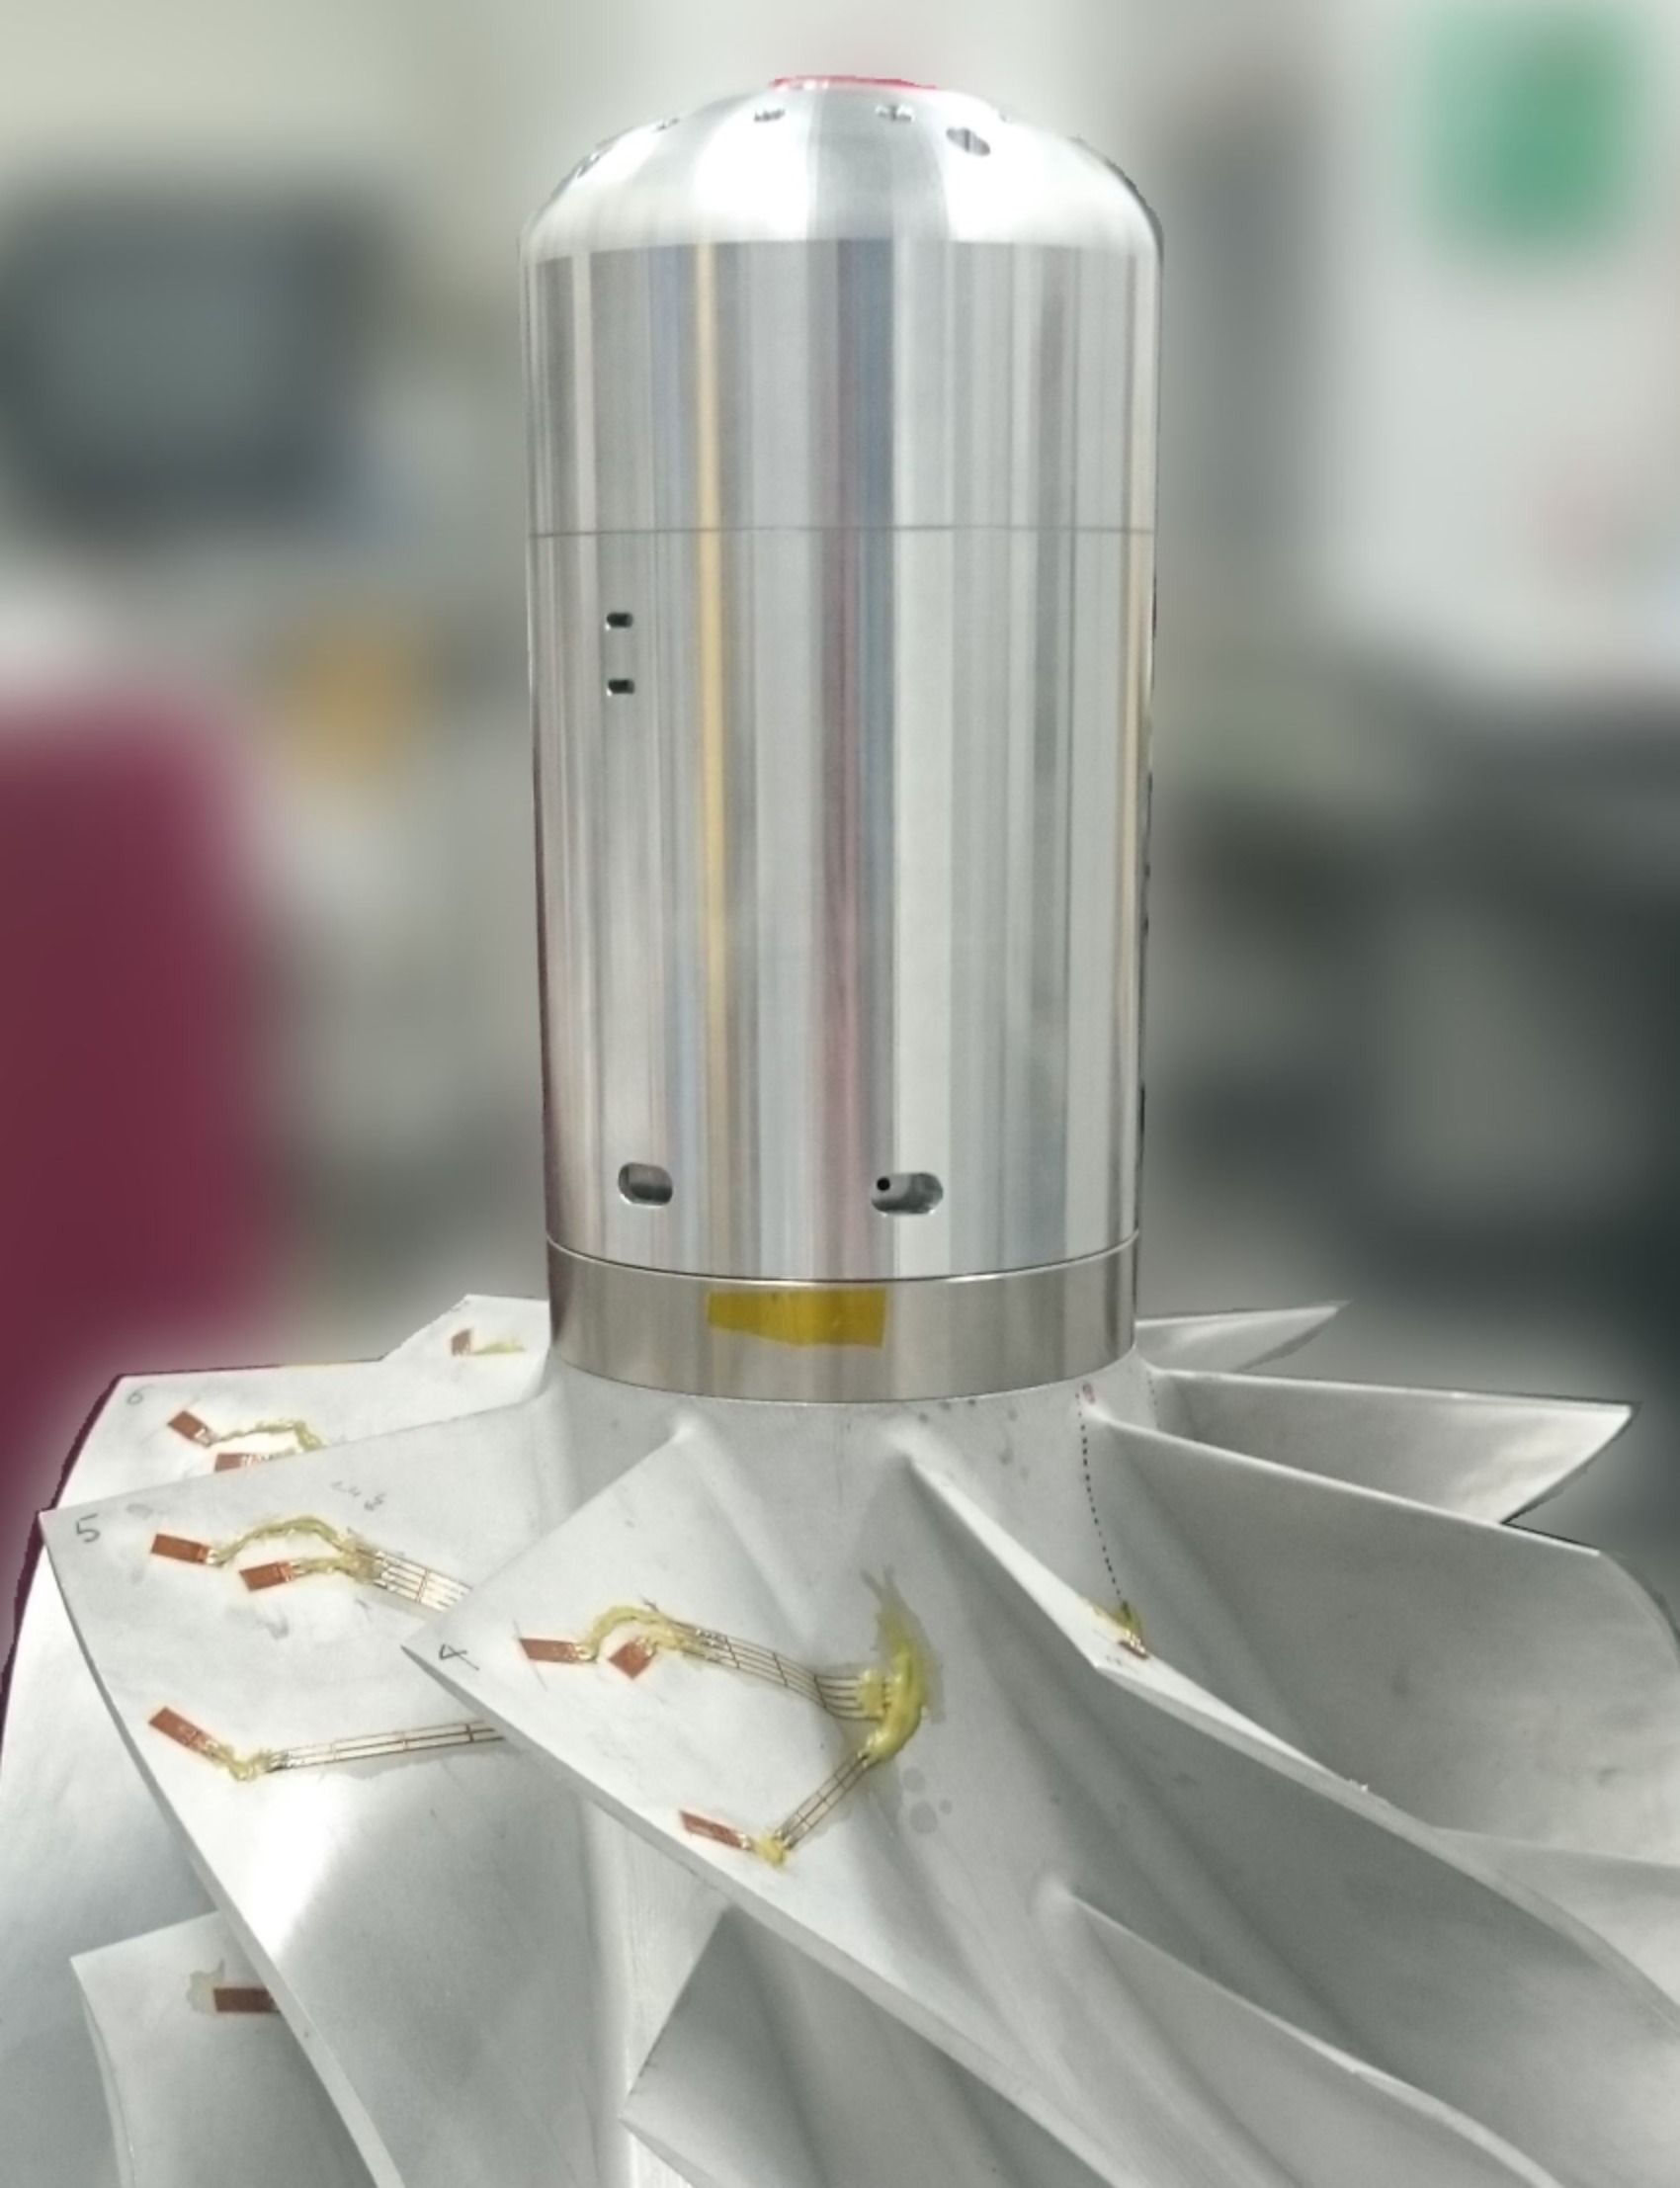
Each of the 9 impeller main blades has been instrumented with three strain gauges at locations with maximum surface strain for mode 1, 3 and 4, using the procedure presented by (Szwedowicz et al., 2002). Three splitter blades have been instrumented with a strain gauge as well, leading to a total number of 30 sensors. All strain gauges are recorded simultaneously by the in-house data acquisition system, which is located inside a spinner, mounted on the impeller hub. The impeller with the acquisition system is shown in Figure 2. It consists of 8 circular acquisition cards, stacked on top of each other and powered by a battery pack. The system consists of no moving parts leading to a maintenance free operation and no struts are distorting the upstream flow. Similar acquisition cards have been introduced by (Rebholtz et al., 2015) to measure unsteady blade surface pressure on a rotating axial turbine disk.
The measurement chain of each SG has been calibrated to elude deviations in the various current sources and signal amplifiers. This has been achieved by placing well-known resistors in parallel to the strain gauges. The resulting drop in equivalent resistance has been linearly correlated to the change in the ADC converter’s digital level recording.
Measurement uncertainty estimation with (GUM, 1995) has been conducted for each strain gauge individually. The measurement uncertainty is calculated to be 6.5% of the measured response amplitude. Noise to signal ratio during calibration is 1.42e-2 and is expected to drop further during operation since the closed loop would shield the acquisition chain from ambient electromagnetic noise. Fourier transformation of resonance crossing measurements show that the average off-resonance noise carpet is 2 orders of magnitude lower than the resonance amplitudes and is therefore neglected. Sensitivity of the boards varies between 1e2 and 1e3 digital levels per megapascal surface strain. The sampling frequency is set to resolve the resonance of interest with 14 samples per period.
A transient measurement approach has been used to avoid exposing the compressor blades to continuous resonance conditions. A constant sweep rate of 1 rps/s has been chosen to achieve quasi-steady state blade response as suggested in (Ewins, 2000).
Unsteady CFD simulations
The numerical domain consists of a 40° segment modelling one main and one splitter blade in the impeller, as well as 2 diffuser passages. The computational domain includes the blade filets and the tip gap height is set to values measured in the test rig. The numerical inlet is located 4.5 impeller blade heights upstream the impeller and the domain follows the geometry of the acquisition system as well as a contraction of the facility’s inlet pipe. To reduce the influence of the numerical outlet, the position of the boundary has been extended by 4 diffuser vane heights downstream of the diffuser exit and has been pinched to avoid numerical back flow. The segment consists of a structured mesh with 7 million elements where 2 million elements are used to model the diffuser area and 5 million elements for the impeller and its upstream geometry.
Temporal resolution is 0.5° rotation per time step, which leads to 40 time steps per vane passing to resolve the unsteady impeller diffuser interaction. The commercial solver ANSYS CFX 18.2 has been used to conduct the numerical flow field investigation. High resolution schemes were used and for turbulence the k-omega SST model (Menter, 1992) was applied.
Rotational speed is set to the resonant condition of the experiment. The inlet boundary conditions are defined as the total pressure and total temperature measured in the facility. The operating points are defined relative to the choked mass flow rate, similar to the experimental approach. The outlet boundary condition is static pressure that was tuned to match the target flow rate.
As convergence criteria for the unsteady CFD simulation serves the generalized force
Harmonic FSI simulations
The impeller is represented as a 40° segment including one main and one splitter blade modelled by quadratic tetrahedrons. The mesh consists of 120,000 elements and has found to be sufficient after a refined mesh with 500,000 elements resulted in a 1% change in response amplitude.
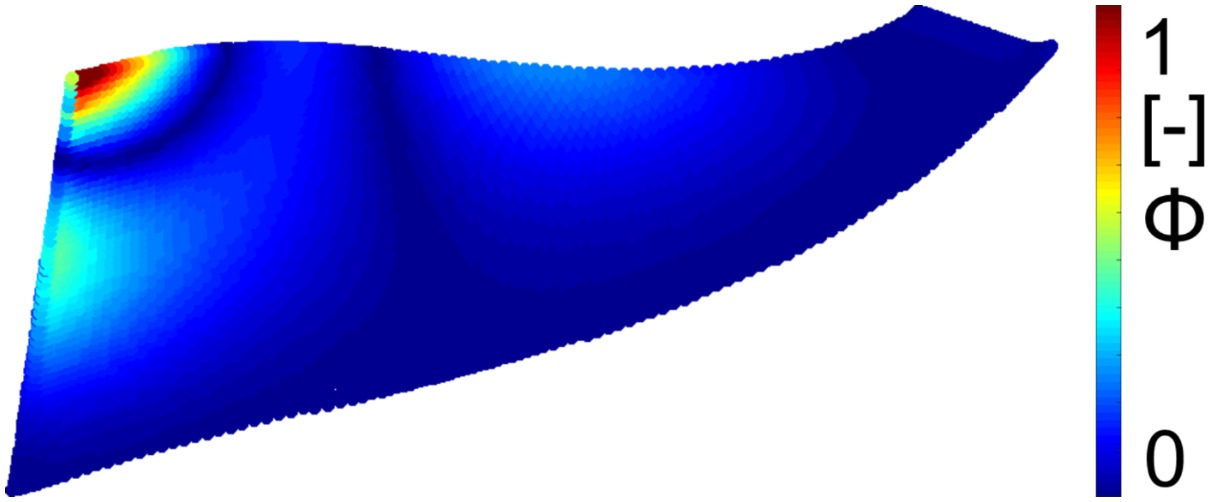
The simulations are set up with Abaqus 6.14 and are based on the modal superposition approach. Cyclic symmetry is applied to the rotational periodic boundaries. Centrifugal load and static surface pressures are applied to the model to achieve a pre-stressed state. In a following step the eigenmodes of interest are extracted, and in a final step the resonance response is predicted. Excitation is achieved by applying the frequency content of the blade surface pressure at the diffuser vane passing frequency to the blades obtained by the unsteady CFD simulations. The applied modal damping has been determined by fitting the SDOF model to the strain gauge measurement results. The normalized mode shape magnitude of mode 4 is presented in Figure 3. It is a view of the main blade pressure side with the leading edge pointing to the left. The maximum deformation is highlighted in red colours and is located at the tip region of the impeller leading edge. Two further local maxima are located mid span at the leading edge and mid stream at the tip.
Generalized force
In the scope of this work, the generalize force
where
Results and discussion
This section evaluates the differences in compressor performance between the investigated operating points and the two working fluids. The strain gauge measurements of the mode 4 resonance crossings allow estimating the influence of damping and forcing to the resonant response amplitudes. The highest difference in resonance amplitude between air and CO2 mixture appears at near choked conditions. These two points are investigated in detail by determining the generalized force distribution on the blade to highlight the cause for the change in resonant amplitude. These effects are linked to wave propagation effects in the flow field.
Compressor operating points
In turbocharging applications the compressor operates in a wide range of rotational speeds, which are defined by the demand of the combustion engine. The main blade mode 4 resonance crossing for this compressor configuration appears at a representative operating condition of 75% design speed
Comparing the two gas compositions with each other shows that the CO2 mixture results in an increase in pressure ratio by 22%.
Below design speed the compressor usually chokes in the diffuser throat area, and the CO2 mixture results in a 9% greater choked flow rate as compared to air. The increased pressure ratios and flow rates for the mixture are correlating with the changes of circumferential Mach number and working fluid properties (Casey and Rusch, 2014).
The choked measurement points were measured with the throttle fully opened. The low pressure ratios at this points are representing the resistance of the closed loop system. The investigated operating points are defined relative to the choked volume flow as described in the methodology section.
The time averaged CFD results are shown as single points in Figure 4. The CFD over predicts the choked flow rate for both gases by 2% while the measurement uncertainty of the facility is ±1%. The total pressure ratios of the CFD results are around 5% above the measured values since the CFD model does not include the collector geometry of the facility. The total pressure losses generated between the diffuser exit and the measurement plane (“Stage Outlet O”) in Figure 1 are not captured by the numerical model, but the differences are in agreement with literature data on losses generated by compressor volutes (Cumpsty, 1989). The time resolved volumetric flow of the unsteady flow simulations oscillate around an average value, reaching from 0.5% at the near choke operating conditions and reach up to 4%, close to the near stall operating conditions. This behaviour is caused by mismatch in flow incidence at part load conditions.
Contribution of blade damping and forcing to resonance response
The resonance crossing of mode 4 excited by the vaned diffuser is shown in Figure 5 where the amplitude spectrum of an on-blade strain gauge is plotted over a variation in rotational speed. The information obtained from the strain gauges is used to determine the maximum resonant response amplitudes
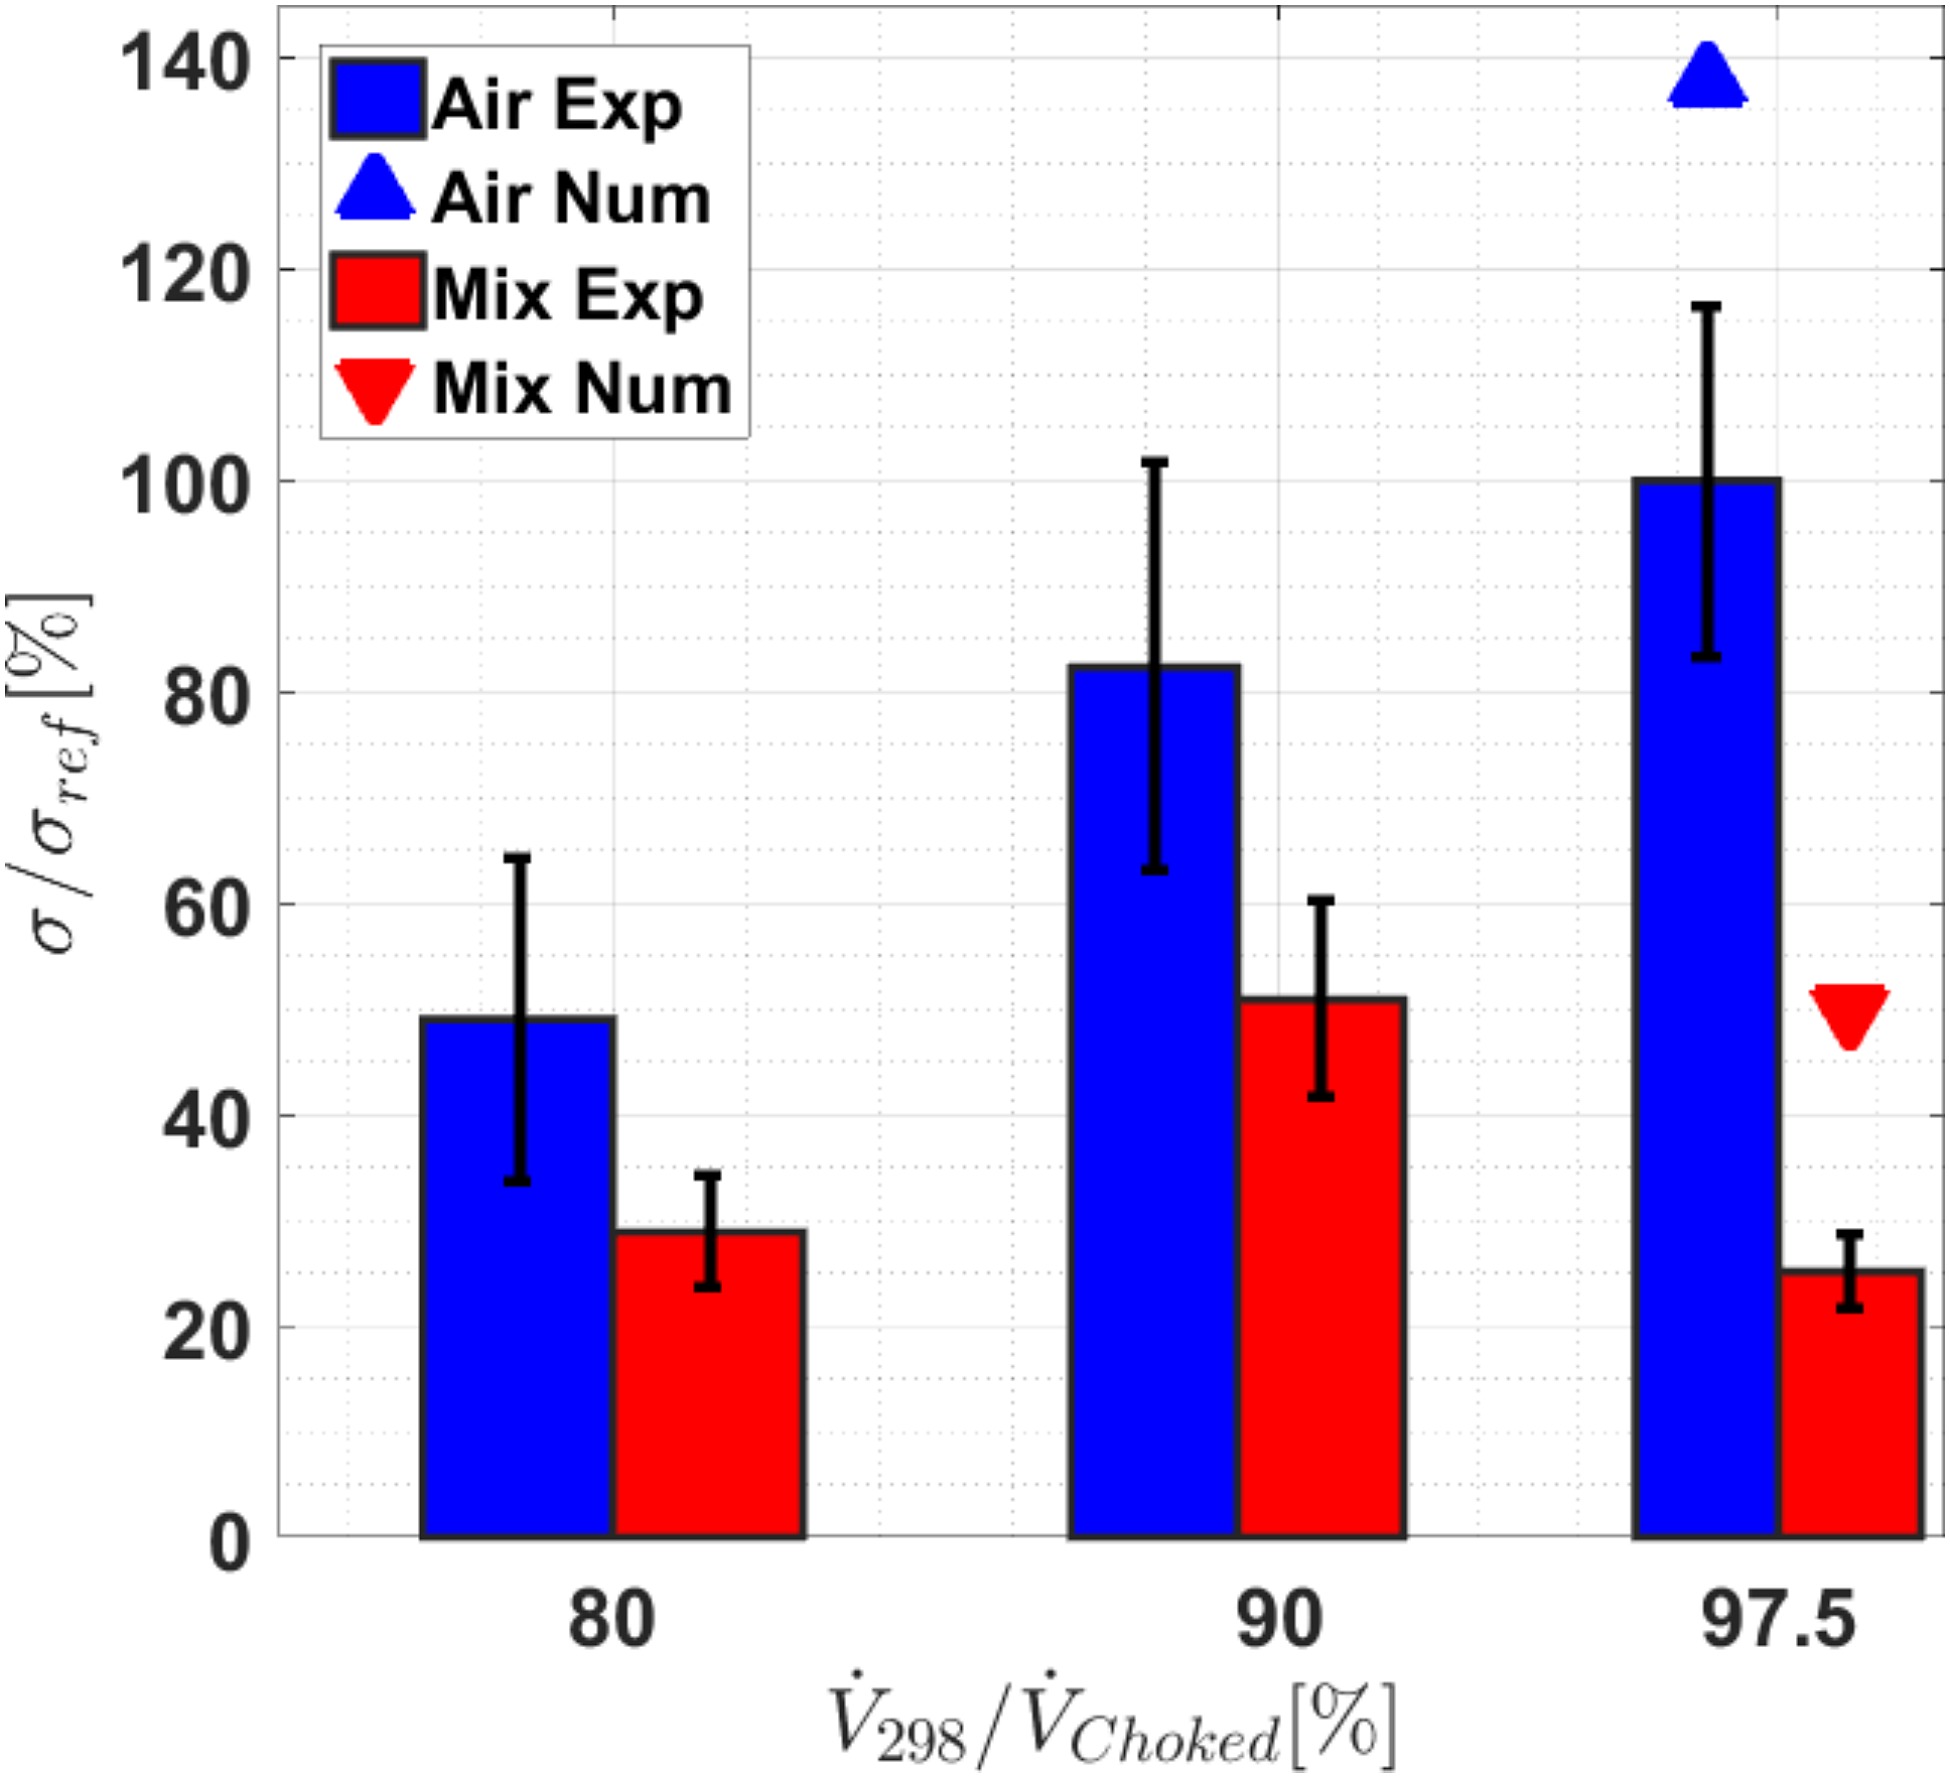
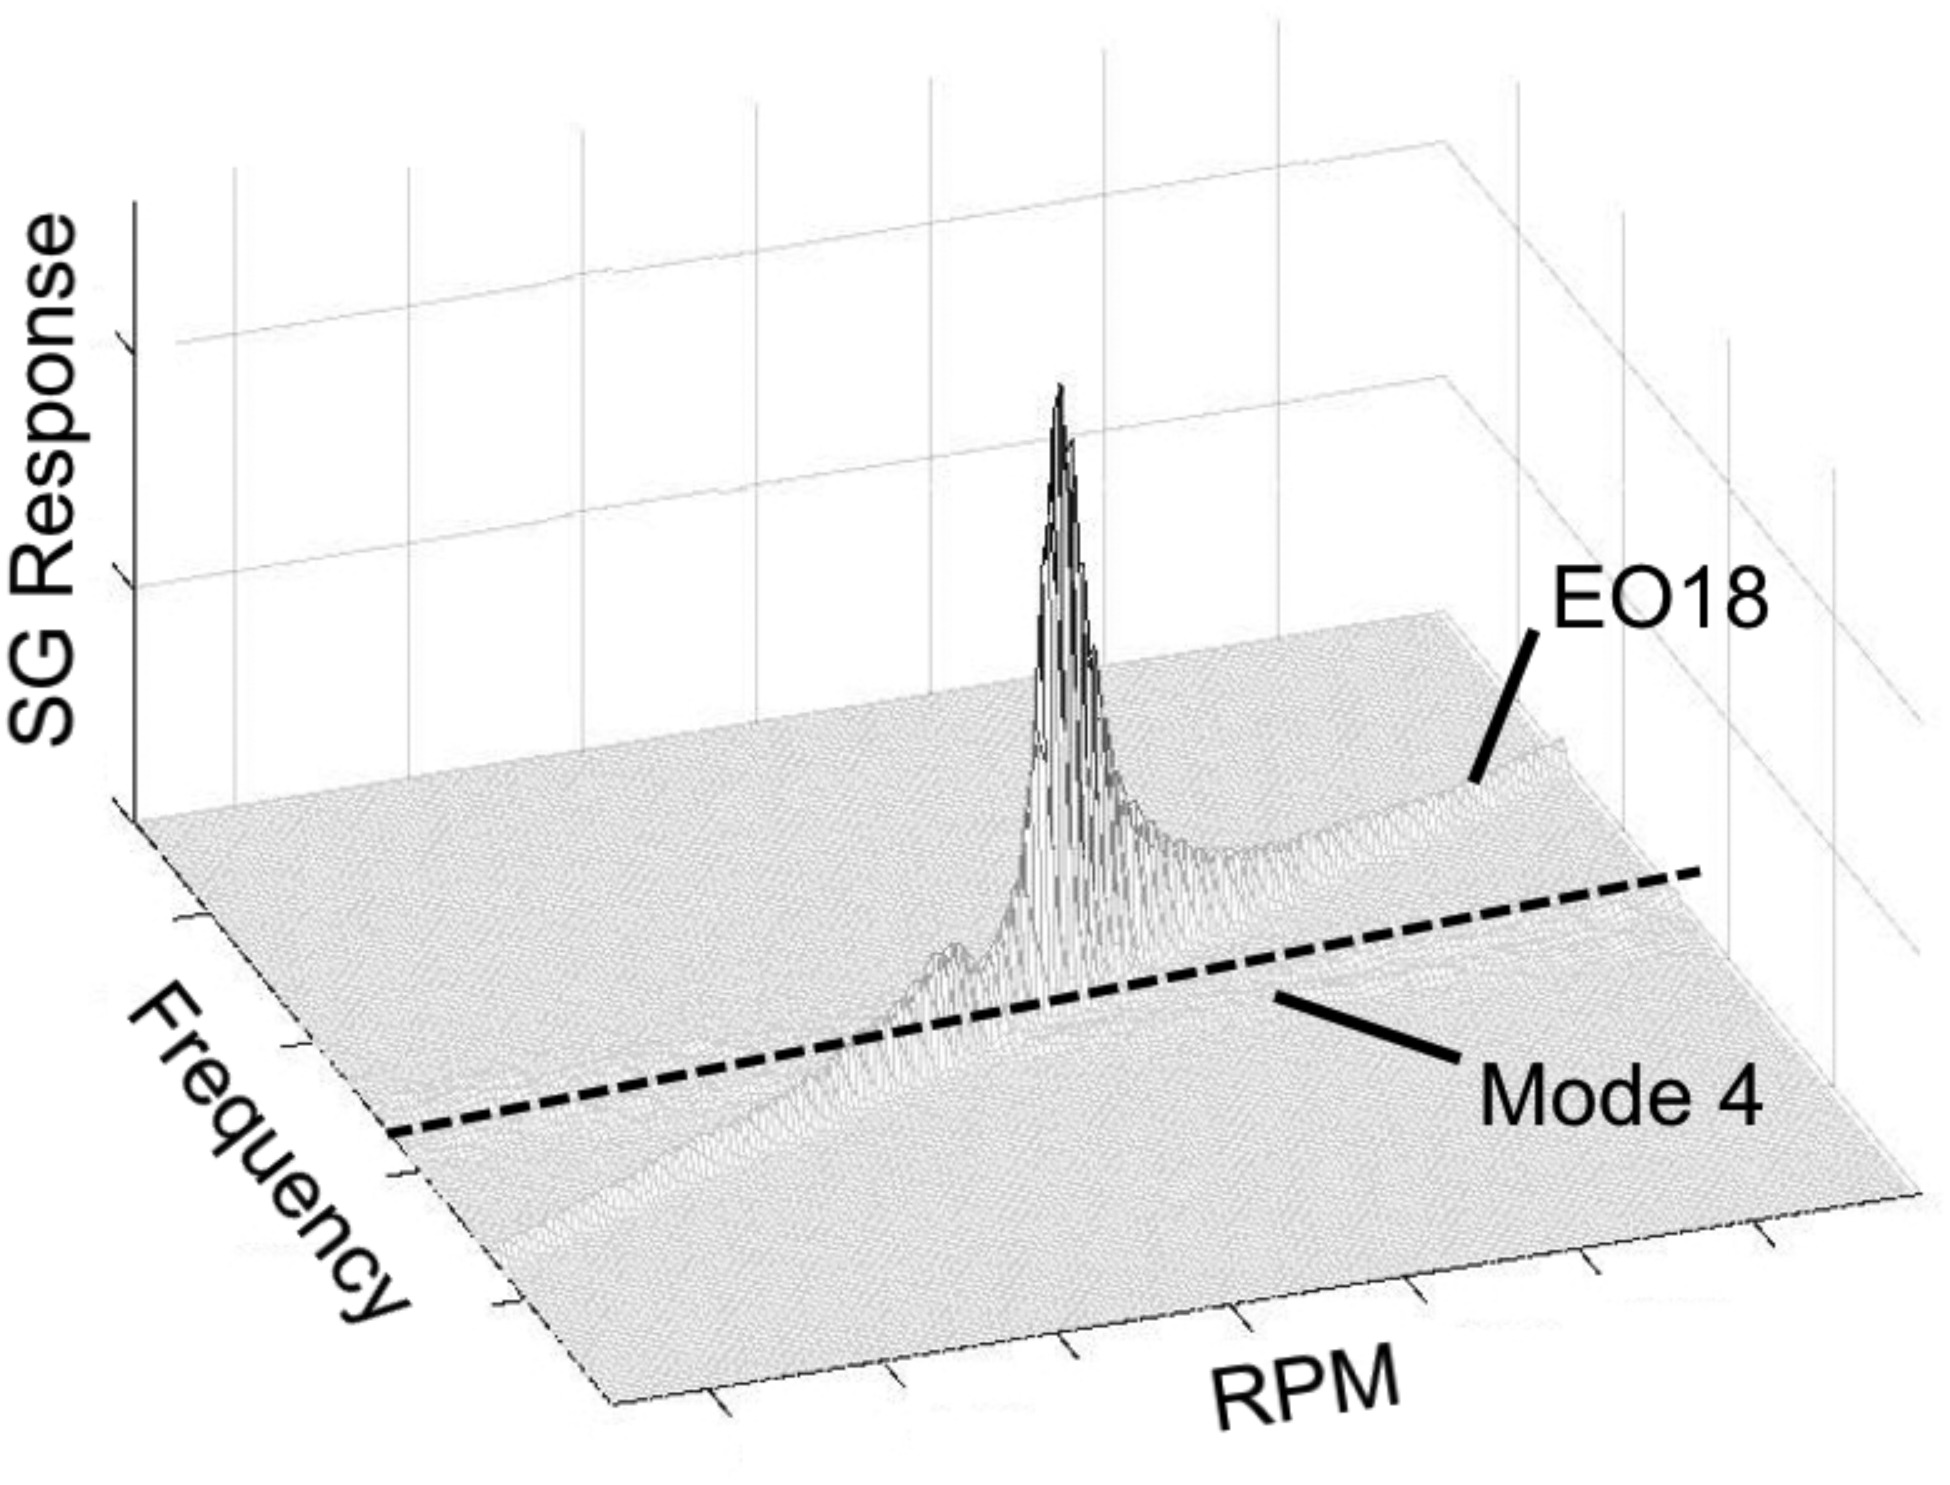
The measurement results for air show a continuous decrease in amplitude from 100% at near choke to 49% at near stall conditions. The response amplitudes for the CO2 mixture are lower and are showing a different trend with flow rate. Maximum response amplitude is at 49% of the reference value and reduces down to 29% at near stall and 25% at near choke conditions. The generally lower resonance response amplitudes for the mixture can reduce the risk of HCF failures for this mode. The variations in resonance amplitudes depend on the exciting force and the damping on the blades. The contribution of these two variables is determined by assuming the resonance crossings follow the response of a SDOF system.
The critical damping ratios
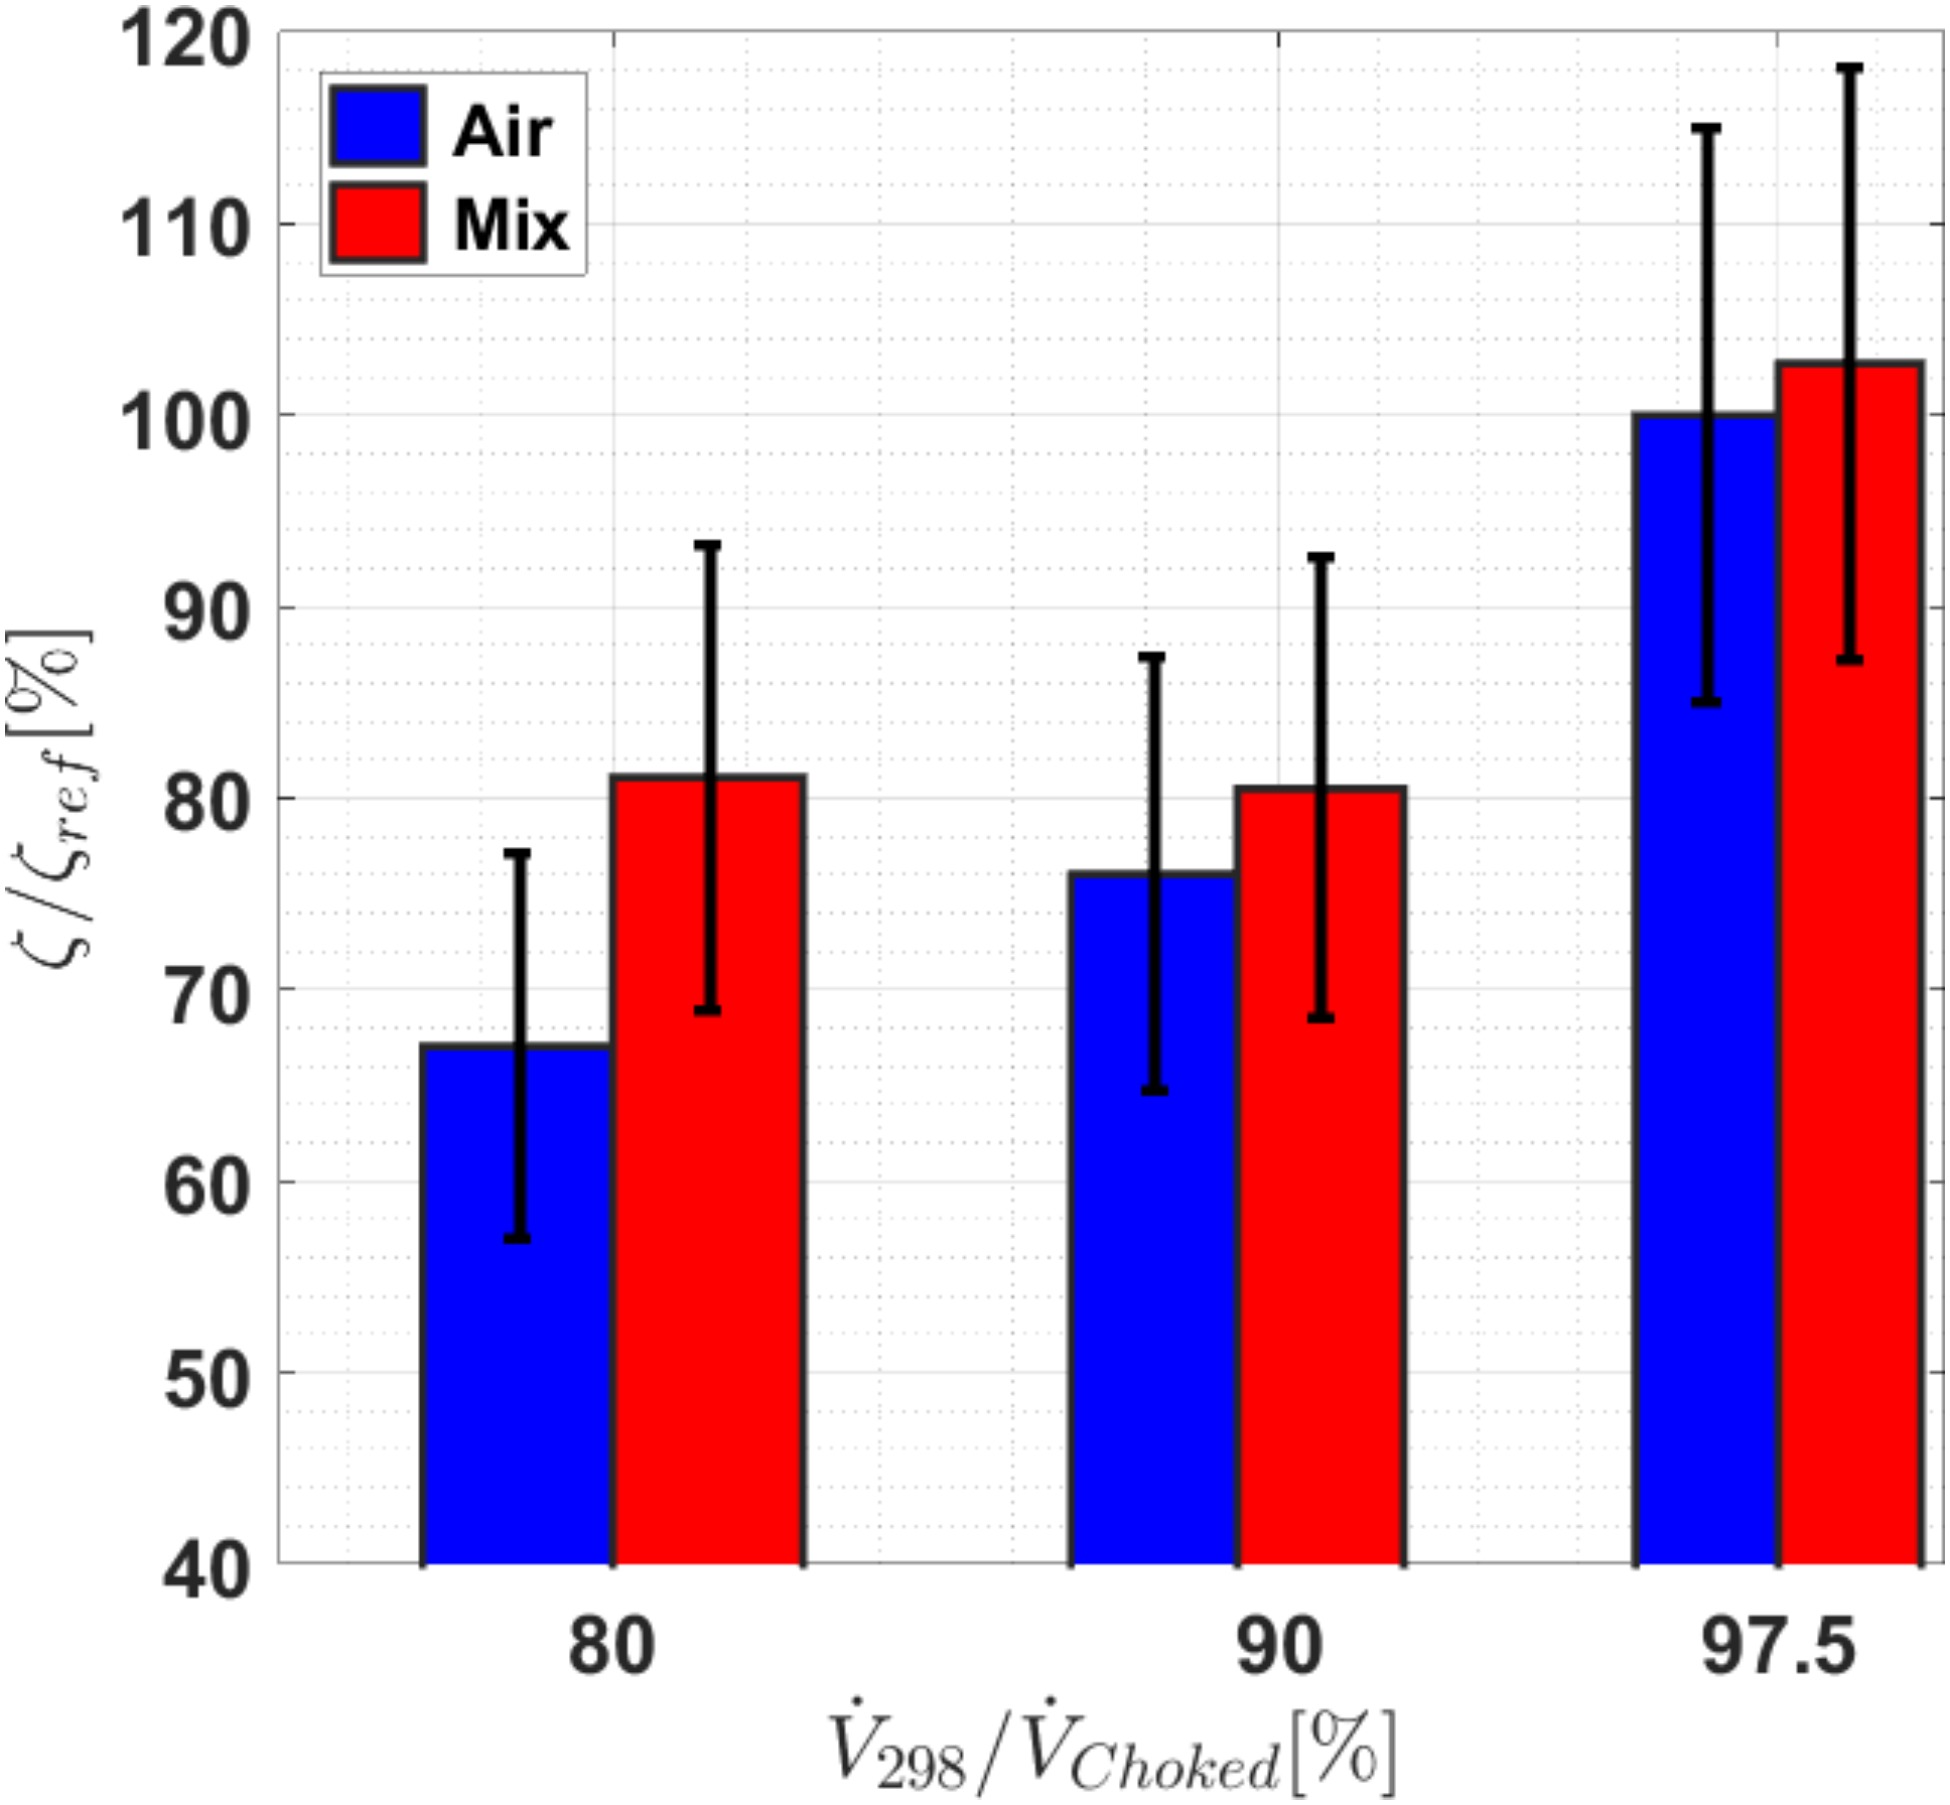
Both gases possess the highest damping values at near choked operating conditions and are not distinguishable from each other. Both show a decrease in damping ratio with a decrease in flow rate. At near stall conditions air is at 67% and mixture at 81% of the reference damping. The mixture shows a tendency of slightly higher damping values than air but still within the uncertainty range. It indicates that flow rate has a higher impact on the damping properties than the gas properties.
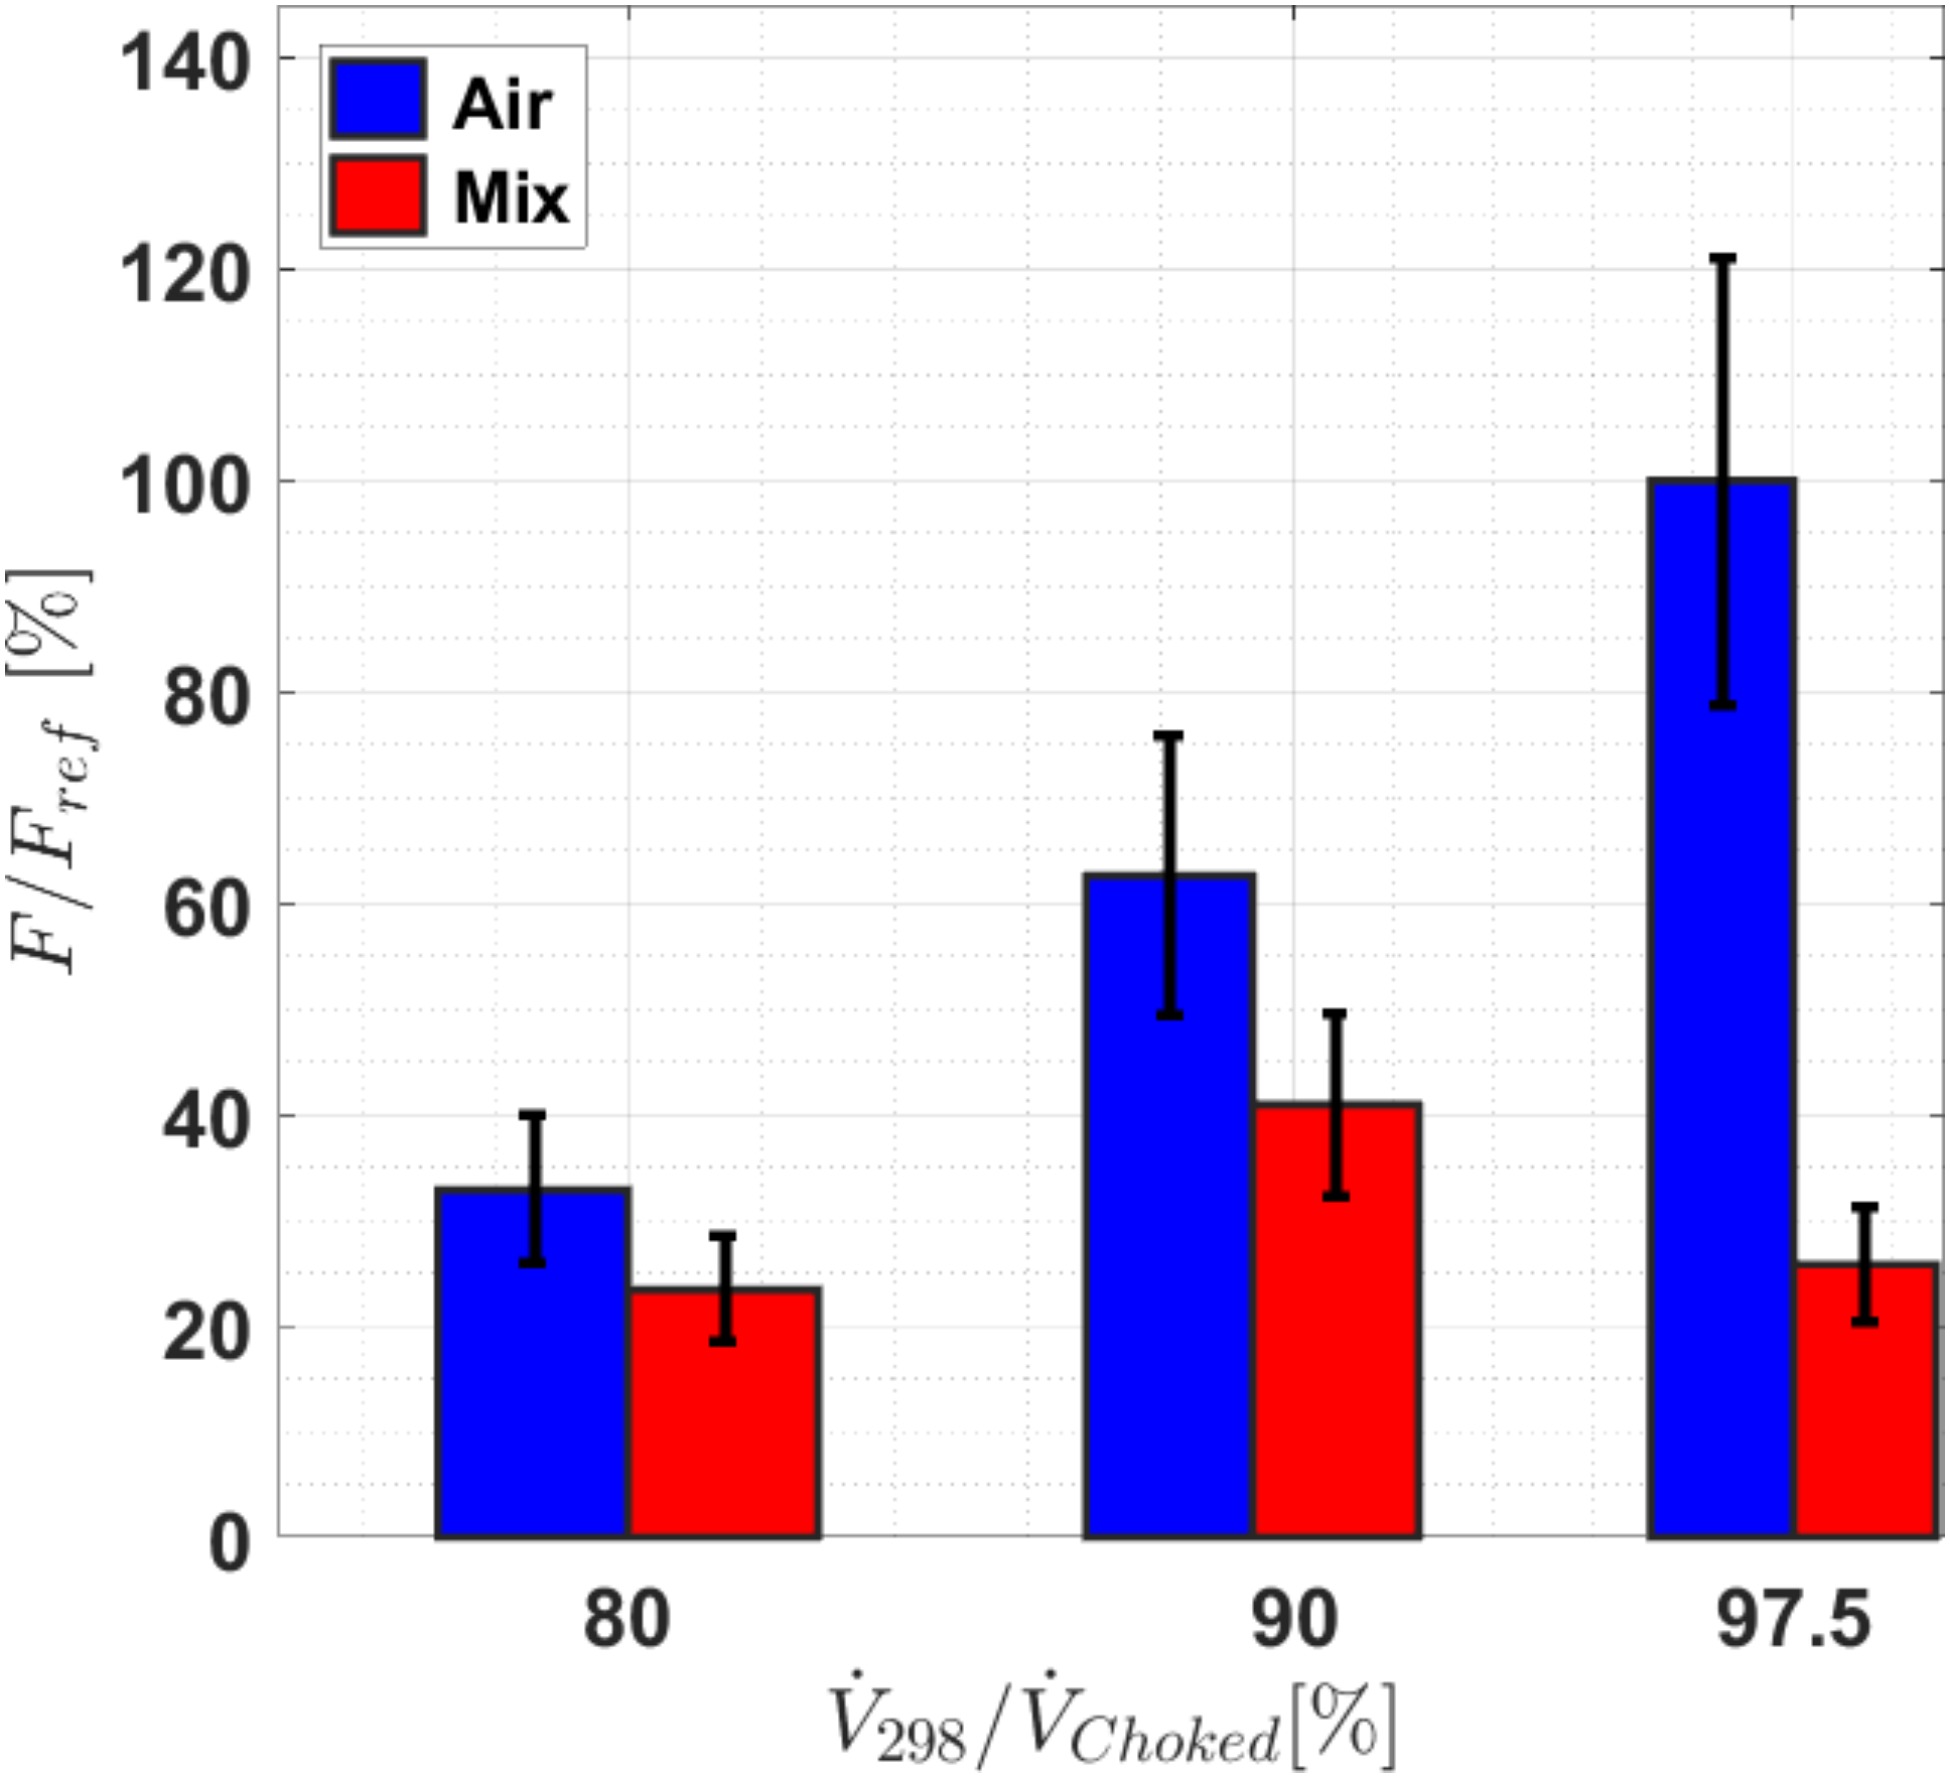
The knowledge of resonance response amplitudes from Figure 6 and the critical damping ratios in Figure 7 allow estimating the influence of the exciting force F. The linear correlation given in Equation 3 is based on a SDOF model at resonance.
The results of evaluating Equation 3 for the different test cases are presented in Figure 8 with the force for air at near choke as reference. The uncertainty is estimated to be ±21% and is obtained by combining the repeatability effects of the response amplitude and the damping estimation. The forcing appears to be the main contributor to the observed changes in response amplitudes since the plot reassembles the resonance response pattern. At near choked conditions both gases possess similar damping and the observed factor of 4 difference in response amplitude is caused by the exciting force. At the near stall conditions the differences in response amplitude between the gases are caused equally by changes in damping and forcing. Forcing for air decreased continuously with flow rate to 33% to compensate for reduced damping values, while the trend for the CO2 mixture is unsteady.
In the subsequent numerical investigation the change in forcing will be discussed between air and the CO2 mixture at near choked operating conditions. The strain gauge measurements are able to determine the change in forcing but are not able to determine blade areas responsible for the changes.
Harmonic FSI response analysis
Before interpreting the CFD blade pressure distribution for the generalized force and its impact on excitation it is recommended to estimate the accuracy of the CFD simulations by comparing the vibratory response measurements with results of a harmonic response analyses.
Figure 6 shows the measured response amplitudes together with the outcome of the FSI simulation for NC conditions.
The simulation results are over predicting the response amplitudes for both operating conditions. The simulation results for the mixture are over predicted by 100% and for air the FSI approach is over predicting the response amplitude by 38%. It cannot be determined clearly if the differences are dominated by offset or scaling effects. Even though the absolute amplitudes are over predicted the amplitude ratio between both cases is 2.8. This trend is consistent with the ratio of 4 observed in the SG measurements and therefore it is possible to explain the differences in excitation based on the CFD results.
Unsteady CFD and generalized force distribution
The aim of the flow simulations is to obtain information about the spatially and time resolved blade pressure to investigate the forcing. The frequency components responsible for exciting the mode 4 are equal to the diffuser vane passing frequency and are extracted by Fourier transformation. Authors in the past have described the unsteady forcing on the compressor blades caused by the downstream diffuser vanes as upstream traveling waves. Maximum amplitude was found to be at the trailing edge area of the compressor and dropping in upstream direction (Gould et al., 2007; Walton and Tan, 2016). This will lead to a time dependent interaction between blade deflection and the local blade surface pressures. It was also found to be sensitive to the involved mode, geometries and operating point and thus difficult to predict.
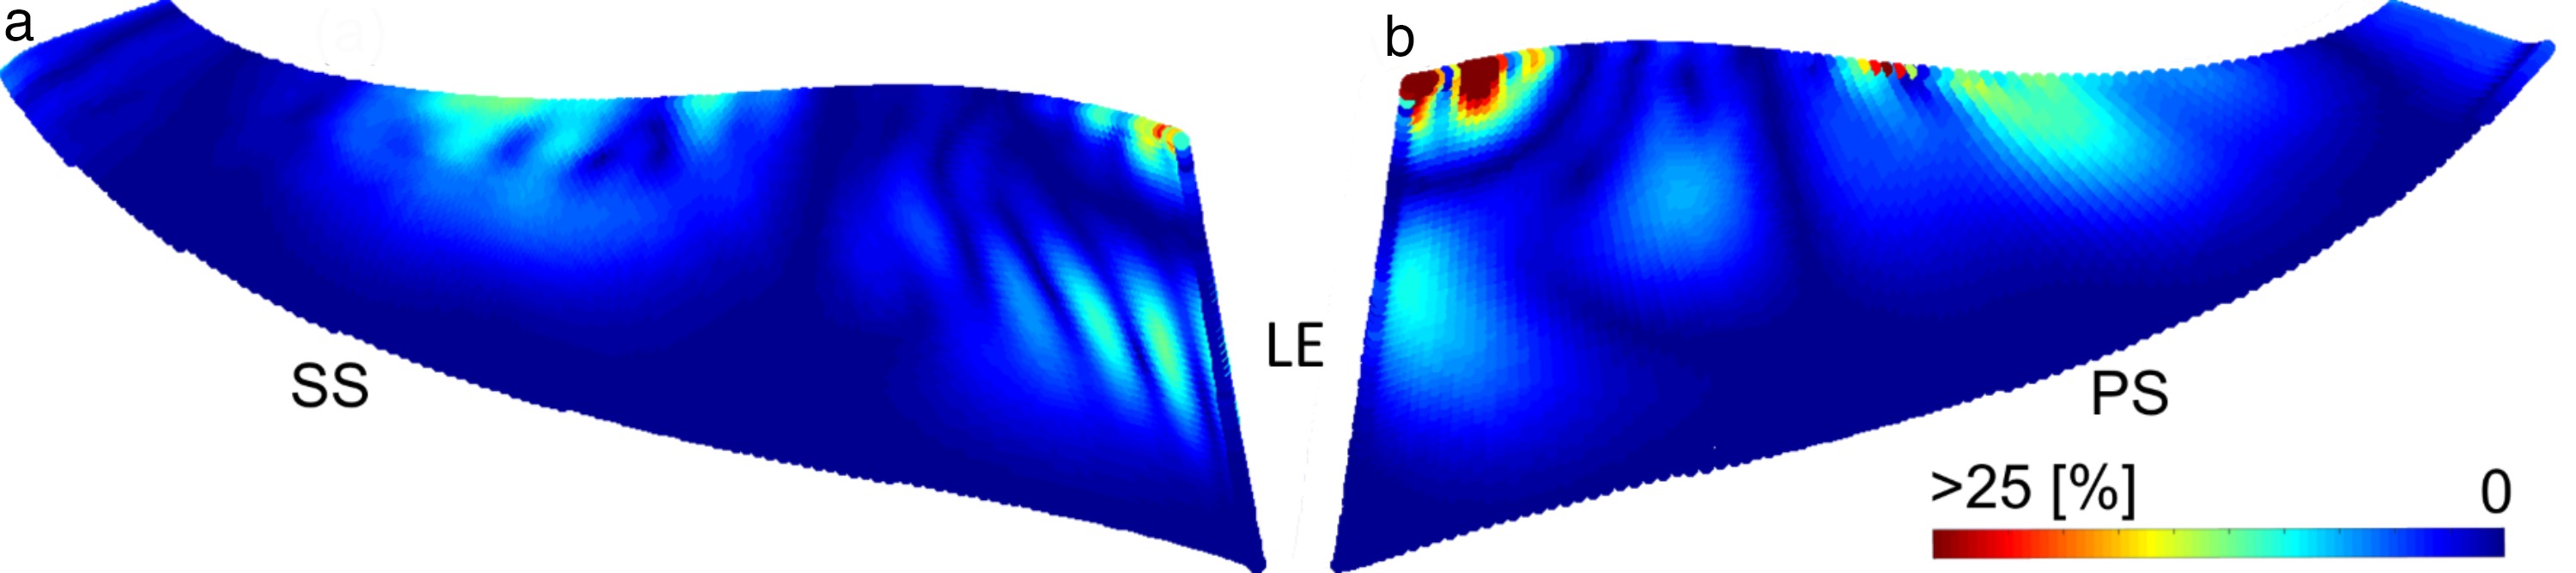
The generalized pressure distribution, defined as the integrand of Equation 1, is presented in Figures 9 and 10 for air and the CO2 mixture at near choked conditions. The images show the magnitude of the complex distribution, representing the excitability of the blade. The mode shape can be interpreted as the sensitivity of the blade to interact with the local force caused by the pressure unsteadiness. The colour range is consistent for all the plots to allow a qualitative comparison. Zero amplitude is visualized in blue and maximum in red colour. In all of the presented figures the pattern reassembles the mode shape. The sensitivity is dominating over the pressure unsteadiness, which is highest at the trailing edge area, in proximity to the diffuser. Comparison of both gases with each other reveals increased pressure unsteadiness for the CO2 mixture at the trailing edge region (Figure 10b). Figure 9b shows the pressure side of the main blade for air and reveals higher generalized pressure at the impeller leading edge region and mid stream at the tip region where the mode shape possesses deflection. Both, the amplitude and the relevant area are increased, compared to the mixture (Figure 10b). A similar trend is visible at the main blade suction side in Figures 9a and 10a. The relatively rigid trailing edge area is contributing to the generalized pressure since it possesses the highest unsteady blade pressure amplitudes (Zemp and Abhari, 2012).
Figure 10.
Generalized pressure amplitude distribution for mode 4 and air-CO2 mixture. Impeller main blade suction side (a) and pressure side (b).
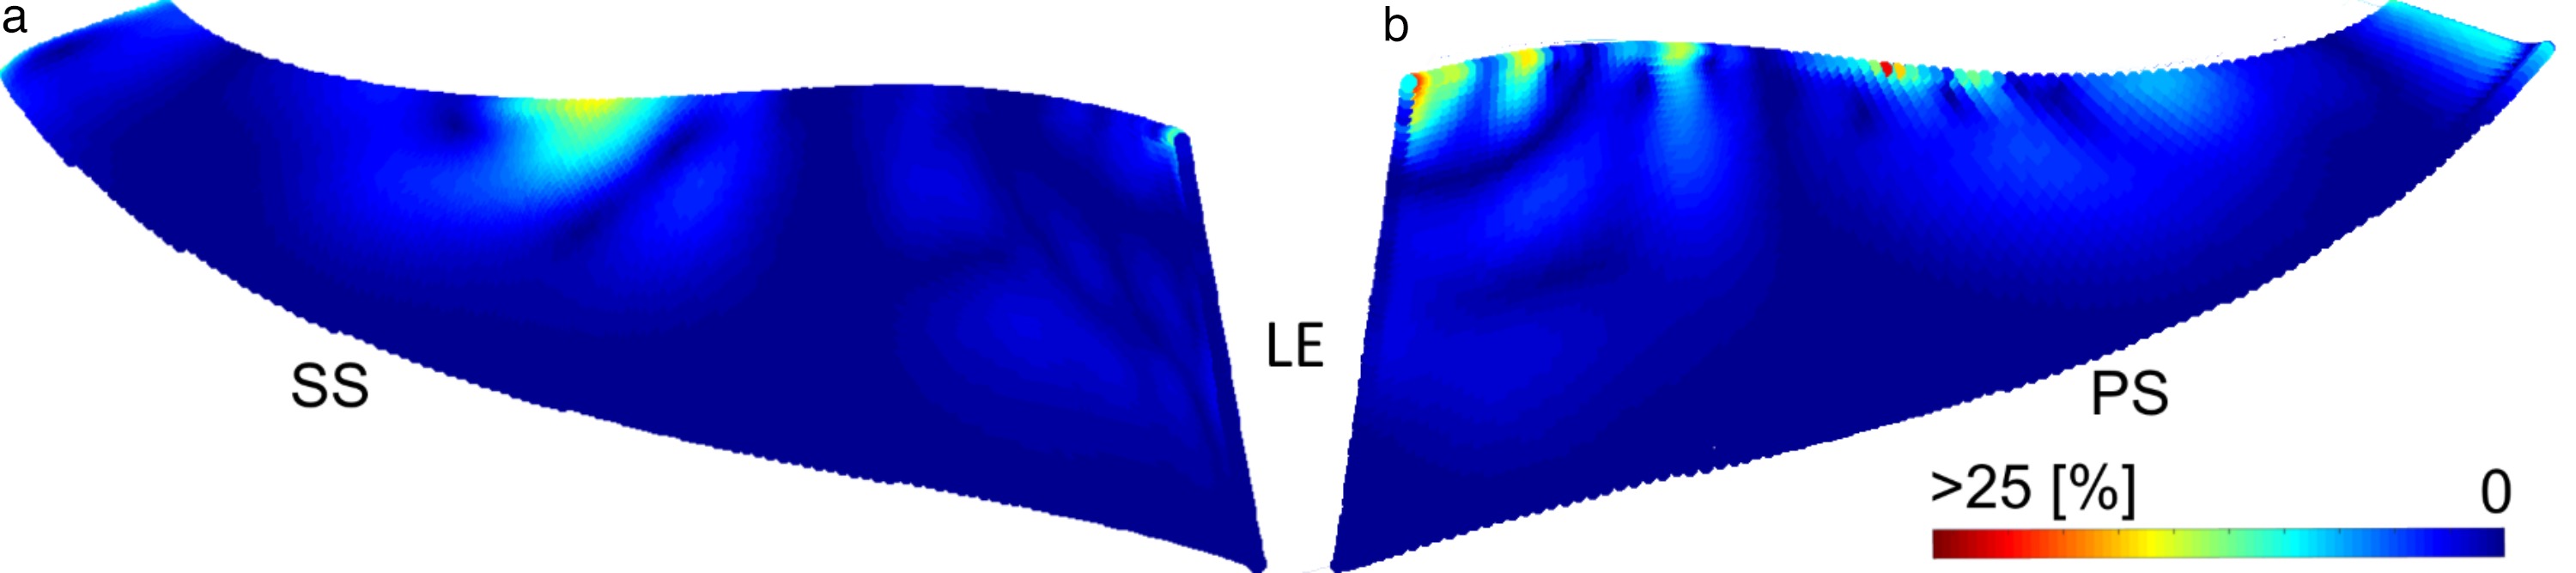
Figure 9.
Generalized pressure amplitude distribution for mode 4 and air. Impeller main blade suction side (a) and pressure side (b).
Local excitation on the blade is a combination of force on pressure and suction sides
Figure 11.
Real and imaginary components of the generalized force along streamwise direction. For air (a) and air-CO2 mixture (b).
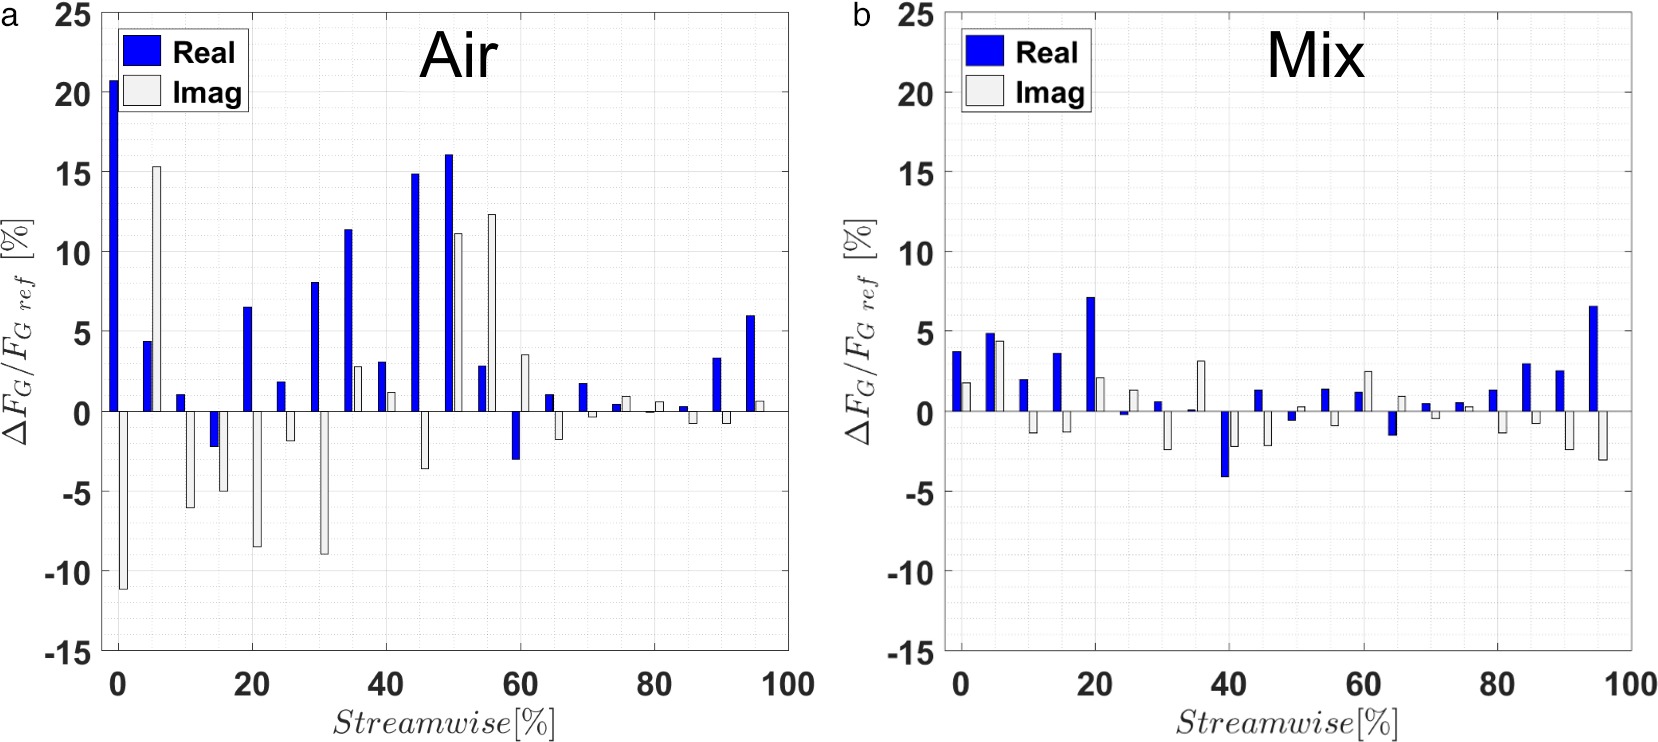
The generalized force distribution for air is presented in the Figure 11a. The relatively rigid trailing edge area between 90 and 100% streamwise location is contributing around 10% to the generalized force and is dominated by the local high unsteady pressure amplitudes. The pressure amplitudes decrease in the upstream direction, and together with the local phase distribution, it results in low and partially negative generalized force components between 60 and 90% streamwise. For air the midstream area (25–60% streamwise), where the mode possesses deflection, is the main contributor to the generalized force with approximately 65% of the overall amplitude. The leading edge area (<25% streamwise) possesses low unsteady pressure amplitudes but contributes 25% to the generalized force due to high mode deflections.
The CO2 mixture, Figure 11b, shows for the trailing edge area an increase in generalized force to 14% of the reference value. This is caused by higher unsteady pressure amplitudes and shifts the first negative real component to 70–85% streamwise location. The 30–80% streamwise area was found to be contributing to the reduced forcing with the CO2 mixture. The generalized force amplitudes are lower in amplitude and are dominated by negative real components, counteracting the excitation in this area by −7.4%. In this case the leading edge area (<25% streamwise) contributes the most to the forcing with around 25% of the reference value. The overall excitation in the <25% streamwise area comparable to air. In the case of the mixture the amplitudes are lower but the phase distribution is more beneficial to the excitation.
To explain the cause of these differences the modal content of the static pressure in the flow is visualized in Figure 12 at a 95% spanwise location. The real components of the static pressure are calculated under the condition of maximum excitation and shown in a logarithmic scale for improved visualization. Negative values are visualized in blue and positive values in red.
Figure 12.
Real components of the static pressure field at 95% spanwise location in logarithmic scale. For air (a) and air-CO2 mixture (b).
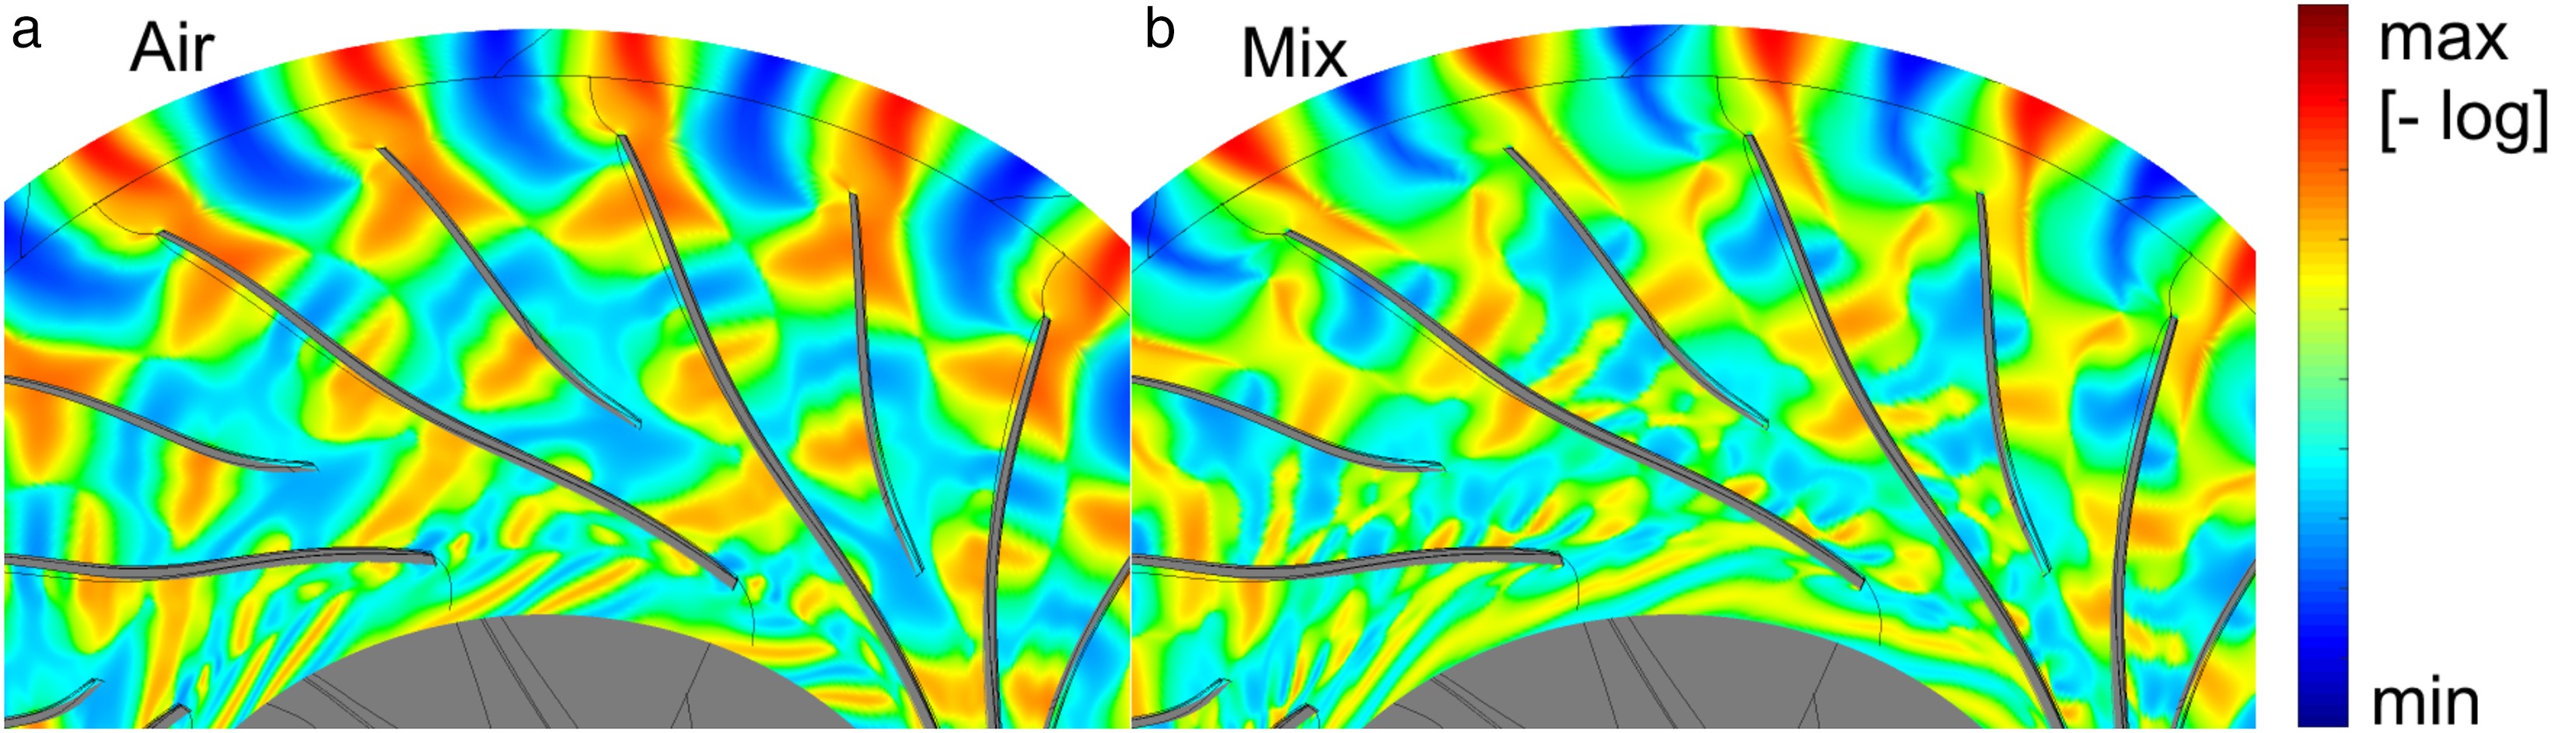
The highlighted area indicates the midstream region where the mode possesses deflection. It can be seen that for air (Figure 12a) the wave pattern is leading to a high blade load. The CO2 mixture in Figure 12b possesses a different wave pattern with local elimination of the load with respect to the mode shape. The load depends on wave propagation effects in upstream direction. The potential field from the diffuser can be seen in the upper part of the figures and is alternating around the blade trailing edge area. This leads to pressure waves travelling in upstream direction. The speed of propagation and therefore the spatial wave length depends on the local speed of sound and the opposing flow Mach number. Further influence is caused by the splitter blade leading edge area where the flow channels merge and also by the main blade leading edge. The pattern is highly case dependent and a small change in the working fluid and operating point can change the pressure field with respect to the mode shape. In the case of the CO2 mixture, the pressure field is not well aligned to the mode shape, leading to a reduced forcing and low resonance amplitudes. These observations suggest co-optimizing the compressor design with respect to minimizing the generalized force for critical blade modes. This will be relevant for turbo charging applications where due to the big range of rotational speeds a resonance free operation cannot be ensured.
Conclusions
The resonance response behaviour of an industrial design centrifugal compressor stage has been investigated for two different working fluid compositions. This allows changing the system’s damping and forcing without influencing the modal response. On-blade strain measurements were conducted to capture the resonance response amplitude of impeller main blade mode 4 excited by the vaned diffuser. Measured resonant response amplitudes for air are up to a factor of 4 higher than for the CO2 mixture at near choke conditions. This can pose a risk of high cycle fatigue failures and has to be considered in the design process of the compressor.
Fitting a SDOF oscillator to the measured resonance crossings allowed determining the contribution of forcing and damping to the measured response amplitudes. At the near choked operating points similar damping values for air and the air-CO2 mixture are observed. In this case the difference in resonance amplitude is dominated by changes in the unsteady blade forcing. For lower flow rates the differences in the damping increases but the forcing remains the main contributor to the changes in amplitude.
Unsteady CFD simulations of the compressor stage were used to obtain time-resolved blade pressure information, serving as input boundary conditions for harmonic FSI simulations. The FSI setups over-predict the resonance amplitudes at the near choked operating conditions, but are able to capture the trend in response amplitudes and thus the CFD model captures the responsible flow effects. This justifies the usage of the generalized force distribution to identify the blade areas responsible for the changes in the forcing.
It was found that, even though the impeller diffuser interaction causes maximum unsteady blade pressure at the impeller trailing edge area, it contributes less than 15% to the generalized force for both working fluids. The excitation is dominated by the areas where the mode possesses deflection and thus by the sensitivity of the blade.
Two effects were found to dominate the changes in resonance response between air and the CO2 mixture at near choked conditions. First, reduced amplitudes of unsteady blade pressure in the sensitive areas and second, negative forcing components which are locally counteracting the excitation. This depends on the local blade pressure and phase on both sides of the blade combined with the vibration direction if the blade.
The origins of these differences were found in wave propagation effects originating from the impeller trailing edge area, propagating in upstream direction and their interactions in the blade leading edge areas of splitter blade and main blade. The resulting generalized force is sensitive to the compressor operating conditions and depends on how well the excitation pattern matches with the mode shape. Based on these observations a co-optimization of flow dynamics and structural dynamics to minimize excitation of critical resonances is suggested. Especially in turbocharging applications where resonance free operation cannot be ensured, the resonance crossings can be optimized to appear at operating conditions where the forcing pattern matches the mode shape less.
Nomenclature
Blade surface area
Analog-to-digital converter
Computational fluid dynamics
Carbon Dioxide
Carbon capture and storage
Fluid-structure interaction
Exciting force of a SDOF system
Generalized force
Swiss Federal Institute of Technology
Frequency
Impeller-diffuser interaction
Complex imaginary component
Blade Leading Edge
Circumferential Mach number
Blade surface normal vector
Rotational speed
Near choked flow settings
Near design flow settings
Near stall flow settings
Static pressure at compressor inlet
Unsteady blade surface pressure
Main blade pressure side
Complex real component
Centrifugal compressor test facility
Single degree of freedom model
Strain gauge
Main blade suction side
Temperature
Blade Trailing Edge
Volume flow rate
Heat capacity ratio
Difference; blade PS-SS
Blade surface strain
Critical damping ratio
Pressure ratio
Normalized mode shape vector