
Introduction
Reductions in fuel burn for ducted propulsors for civil aviation can be achieved through the increased propulsive efficiency of low pressure ratios. Key challenges posed in reducing the fan pressure ratio (FPR) below 1.5 are the increased demand for operability at low flight speeds caused by a greater shift in the fan working line towards its stability boundary, and increased diameter and associated weight of the engine (Cumpsty, 2010). Variable pitch ducted fans address both issues: allowing greater stable operating range through varying rotor pitch, and potentially eliminating the weight penalty of bypass-mounted thrust reversers.
Reverse thrust can be produced by repitching the fan to an angle extreme enough to drive flow in through the bypass nozzle and expel the flow from the intake against the oncoming far-field flow on landing. NASA experimental campaigns demonstrated reverse thrust as a percentage of gross take-off thrust of 53% for Stage 51B (Kovich and Moore, 1976), 66% for Stage 51 (Moore et al., 1976), 53% for the Q-Fan (Schaefer et al., 1977), and 43% for the QCSEE scale fan (Giffin et al., 1977) – exceeding the estimated requirement on landing for the QCSEE program of 35%. These thrust values were measured at engine-static conditions, which excluded the significant reduction in fan flow with representative bypass duct inlet distortion, observed in rig tests by Reemsnyder and Sagerser (1979) and in flight-configuration URANS simulations by Rajendran and Pachidis (2019).
Under clean bypass duct inflow conditions, the reverse thrust fan-stage flow field is defined by poor alignment of rotor leading edge angle to the oncoming flow, as demonstrated by the ADP fan using RANS calculations (Williams and Hall, 2019). The rotor is repitched through feather (opening the blade) so that the trailing edge under conventional forward operation becomes the leading edge in reverse thrust operation. This leads to large negative rotor incidence angles below 70% span, and associated pressure surface separation, with flow driven mostly through the fan tip. The efficiency of this high work tip region is limited at high rotor speeds as shock strength and associated boundary layer separation are augmented by surface curvature in the upstream portion of the rotor blade, which was designed for subsonic diffusion in forward operation.
The aim of this paper is to quantify the effect on a variable pitch fan stage’s reverse thrust performance of aerodynamic design changes that maintain its performance in forward operation. The approach taken is to firstly present the computational method and the baseline test case, the NASA ADP fan. The computational method is validated using a comparable ducted fan, NASA Stage 51B. This is one of the few cases for which test data is available for reverse thrust operation. The method to design modified versions of the ADP fan rotor is then presented and the various new designs are shown to match the ADP fan pressure ratio and efficiency in forward operation. Reverse operation stage flow angle, Mach number, and blockage variations are presented for the new designs, and these are analysed to explain the effects of the design changes on the flow field and resulting reverse thrust generated. Overall, this paper represents the first study of variable pitch fan design for reverse thrust independently of forward thrust performance.
Computational method
Steady RANS calculations were carried out using the Turbostream solver (Brandvik and Pullan, 2011) using the Spalart-Allmaras turbulence model. Surface friction was modelled with wall functions, with
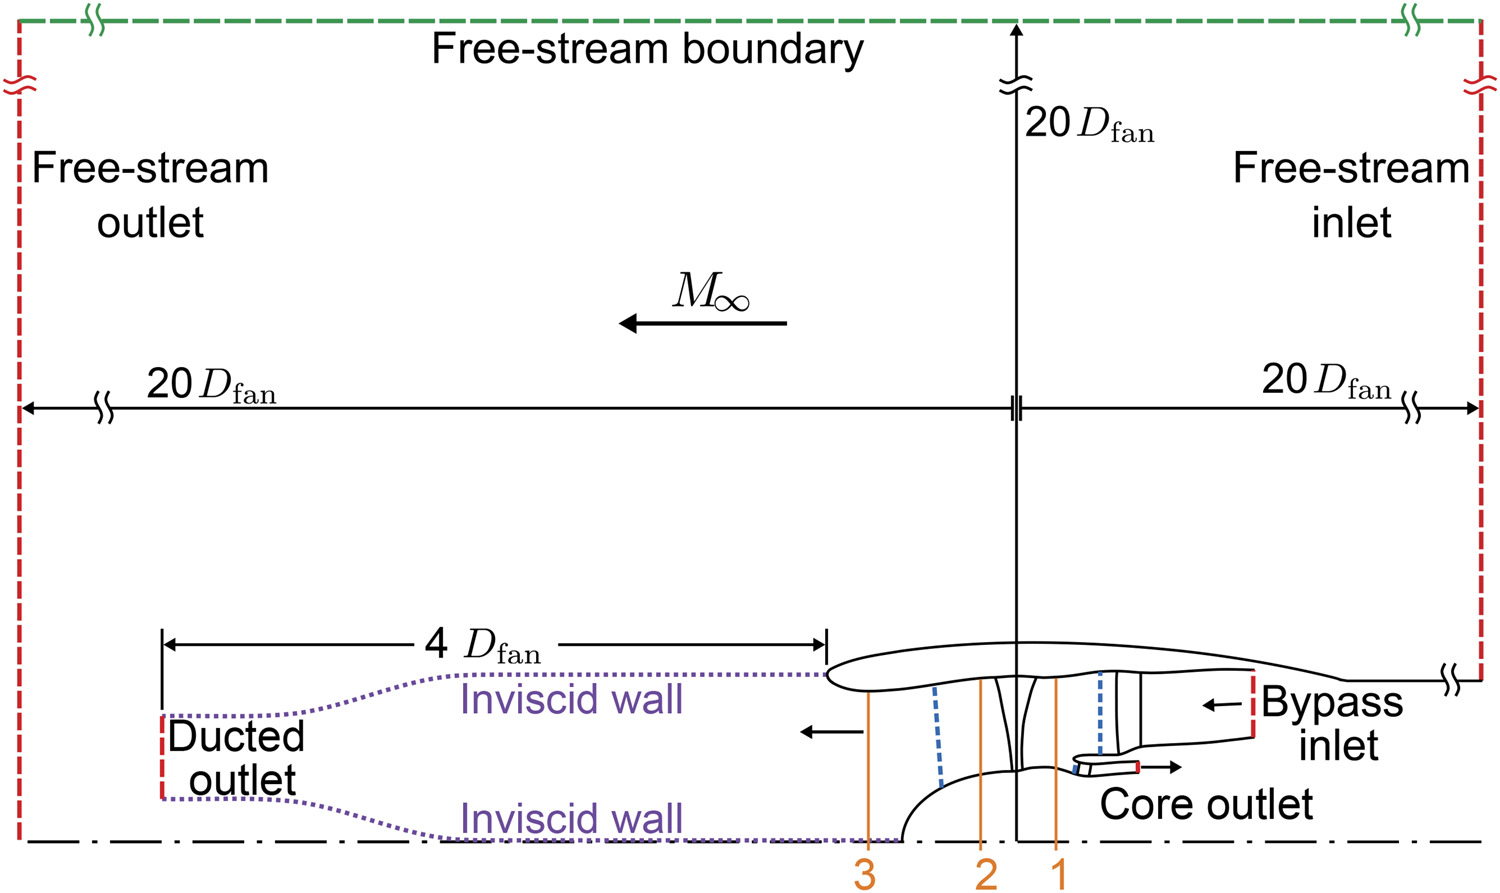
Calculations share the approach presented by Williams and Hall (2019), where separate domains were defined to produce predictions for working lines and constant speed characteristics. Figure 1 illustrates the two domains. The free-steam outlet domain models a
Structured, multi-block grids were generated in Numeca IGG/Autogrid5™ (NUMECA International, 2019). The rotor domain had 4.0 × 10⁶ grid nodes, with 153 spanwise nodes, including 25 nodes across the tip gap. The bypass and core stator domains had 2.0 × 10⁶ and 0.90 × 10⁶ total, and 133 and 81 spanwise nodes, respectively. This grid resolution matched the cruise operating condition stage efficiency to within 0.06 percentage points of the highest resolution grid of a grid sensitivity study, which contained 50% more grid nodes.
The fan stagger settings simulated for reverse thrust calculations were between −83° and −92° relative to the cruise stagger setting – a range identified as stably producing the highest reverse thrust for the baseline ADP fan by Williams and Hall (2019). The restagger was applied as a solid-body rotation about the pitch-change axis, with a negative value representing opening the rotor blade through feather.
Method validation for NASA Stage 51B
Test results from NASA Stage 51B were used to validate the RANS method used to predict the flow field in reverse thrust operation. Stage 51B produced measurements for reverse thrust operation, which showed similar recirculation regions and flow redistribution to predictions of the ADP fan under comparable conditions. Comparing RANS predictions to measurements of corresponding operating points for Stage 51B demonstrated how the method could achieve representative performance, even with the unconventional rotor incidence and blockage of the reverse thrust flow field, and under which conditions predictions were less accurate. The fan stage was modelled with a domain like the ducted outlet domain described above, but without a core stator row, as shown in Figure 2. Rotor and stator geometry was generated from definitions by Kovich and Moore (1976), with the double-circular arc sections definition of Crouse et al. (1969) implemented. Solver settings were identical to, and grid resolution matched to the ADP study.
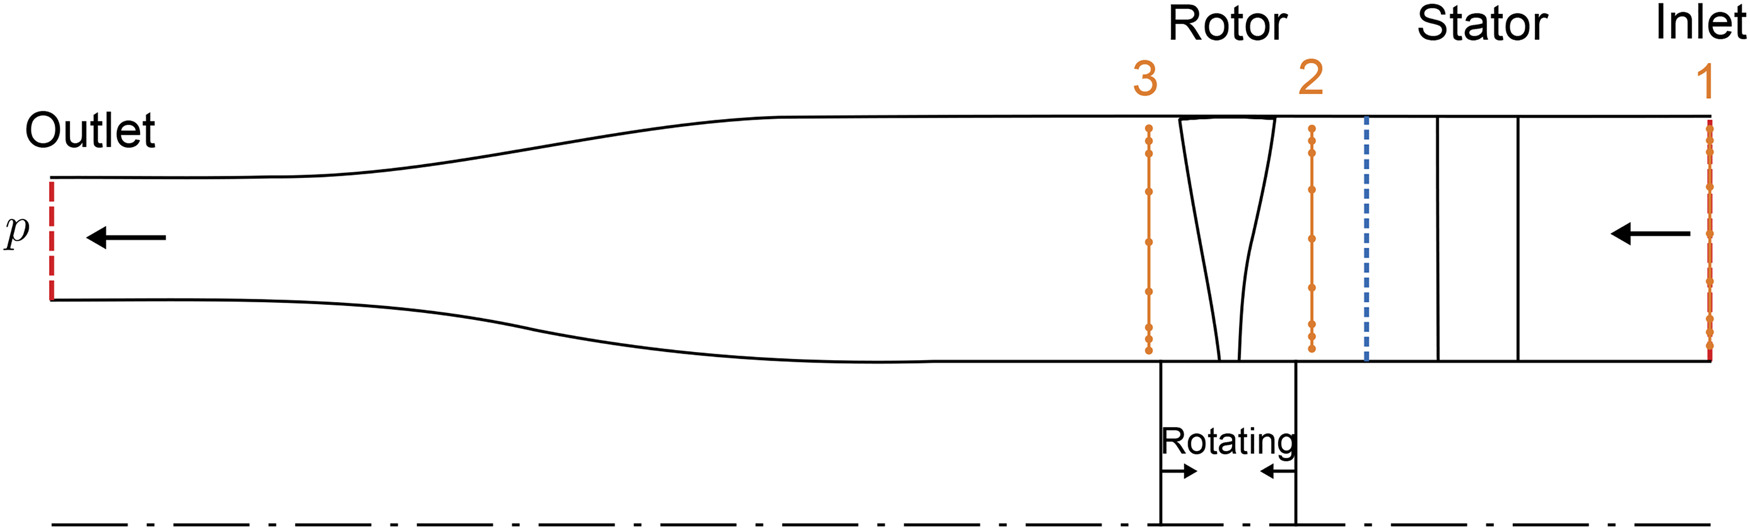
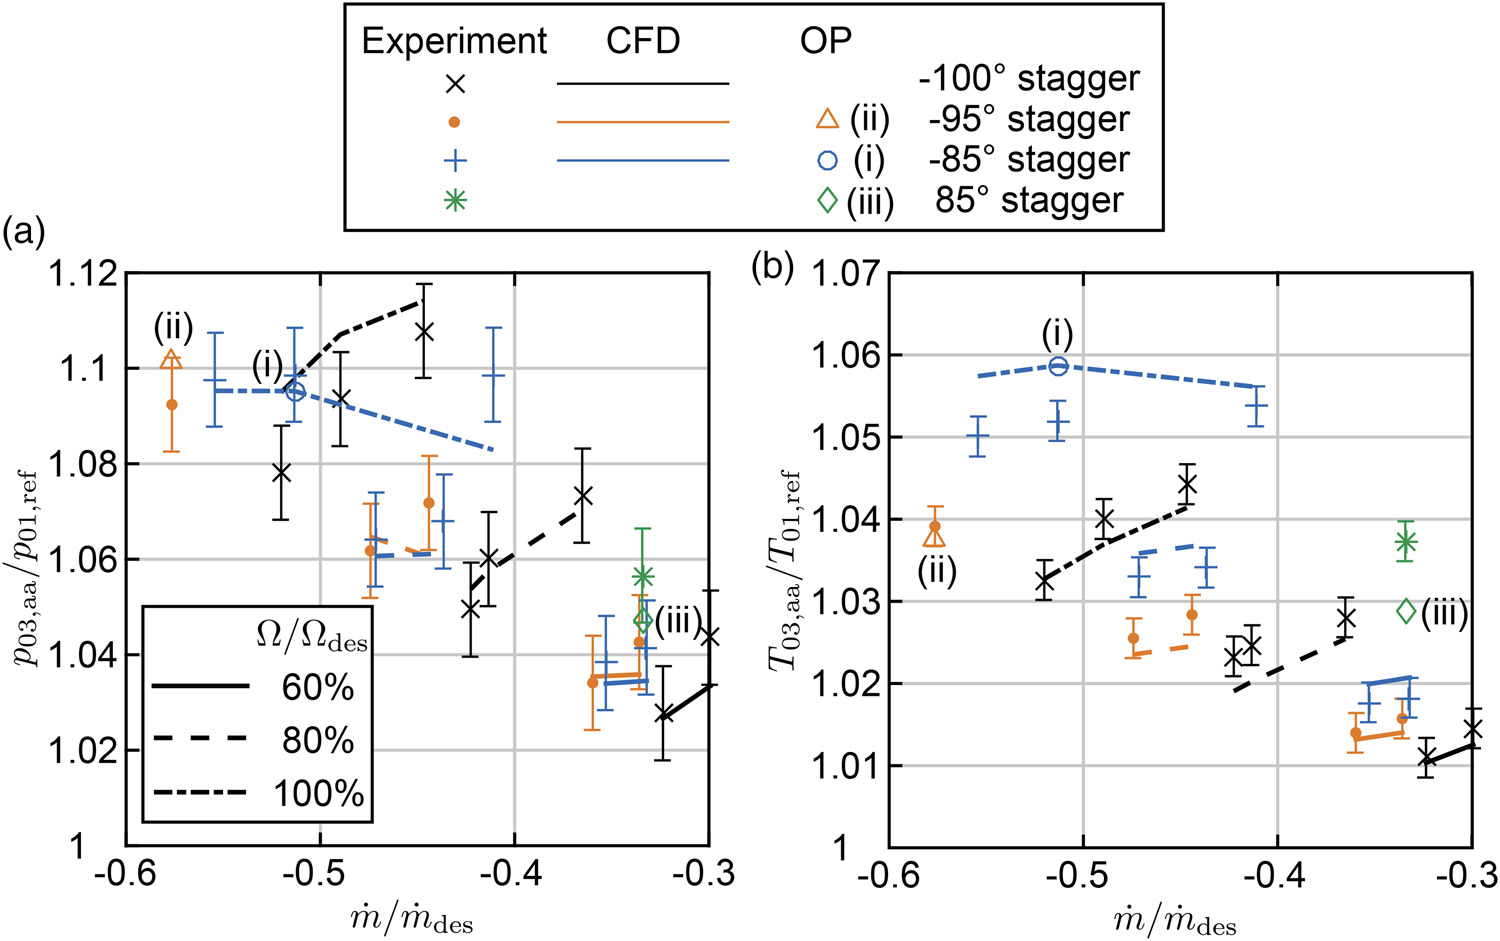
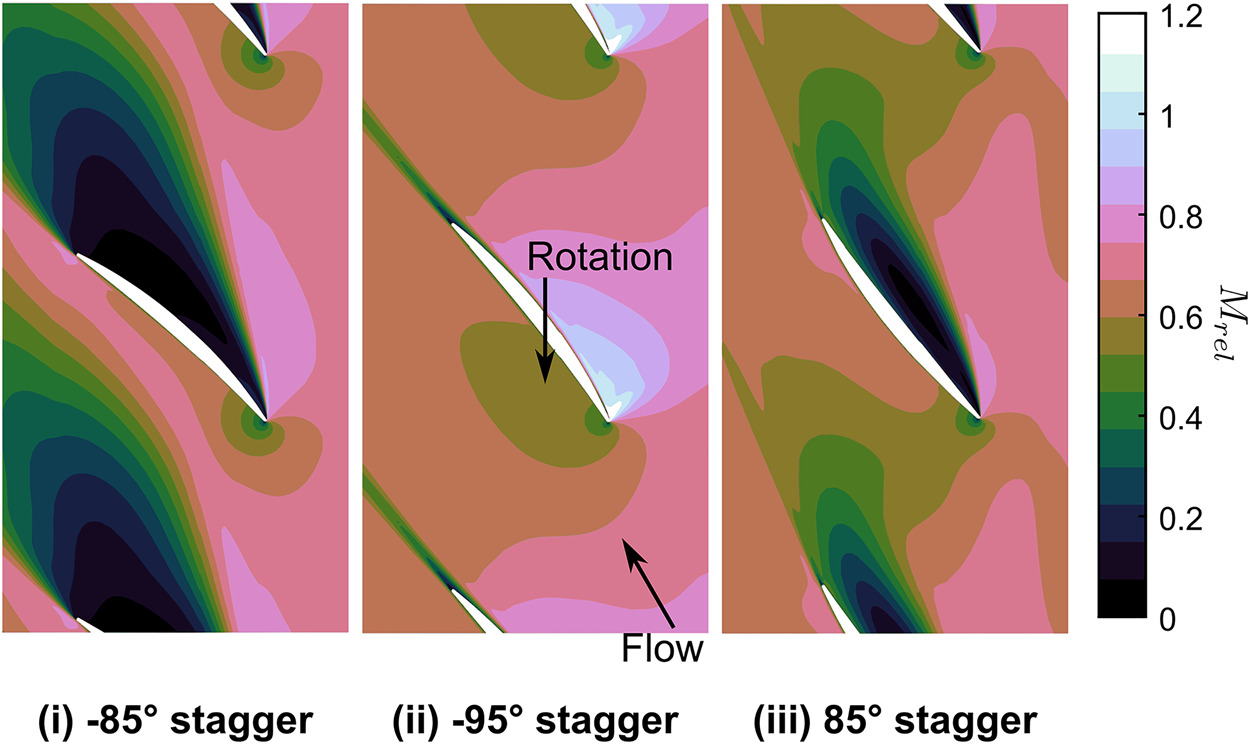
Figure 3 compares the area-averaged rotor outlet total pressure and total temperature, normalised by the inlet reference values, at 4 reverse stagger settings: 3 reversed through feather, and 1 reversed through flat (85° stagger). Not all CFD solutions lie within experimental error, but the trends with rotor stagger setting and speed are reflected in calculations. Note 100% rotor speed operating points (i), (ii), and (iii), marked by open symbols, which will be used for subsequent comparisons.
Figure 3.
NASA Stage 51B reverse thrust area-averaged outlet (a) total pressure, and (b) total temperature. Operating points (i), (ii), and (iii) mark CFD solutions for Figures 4 and 5.
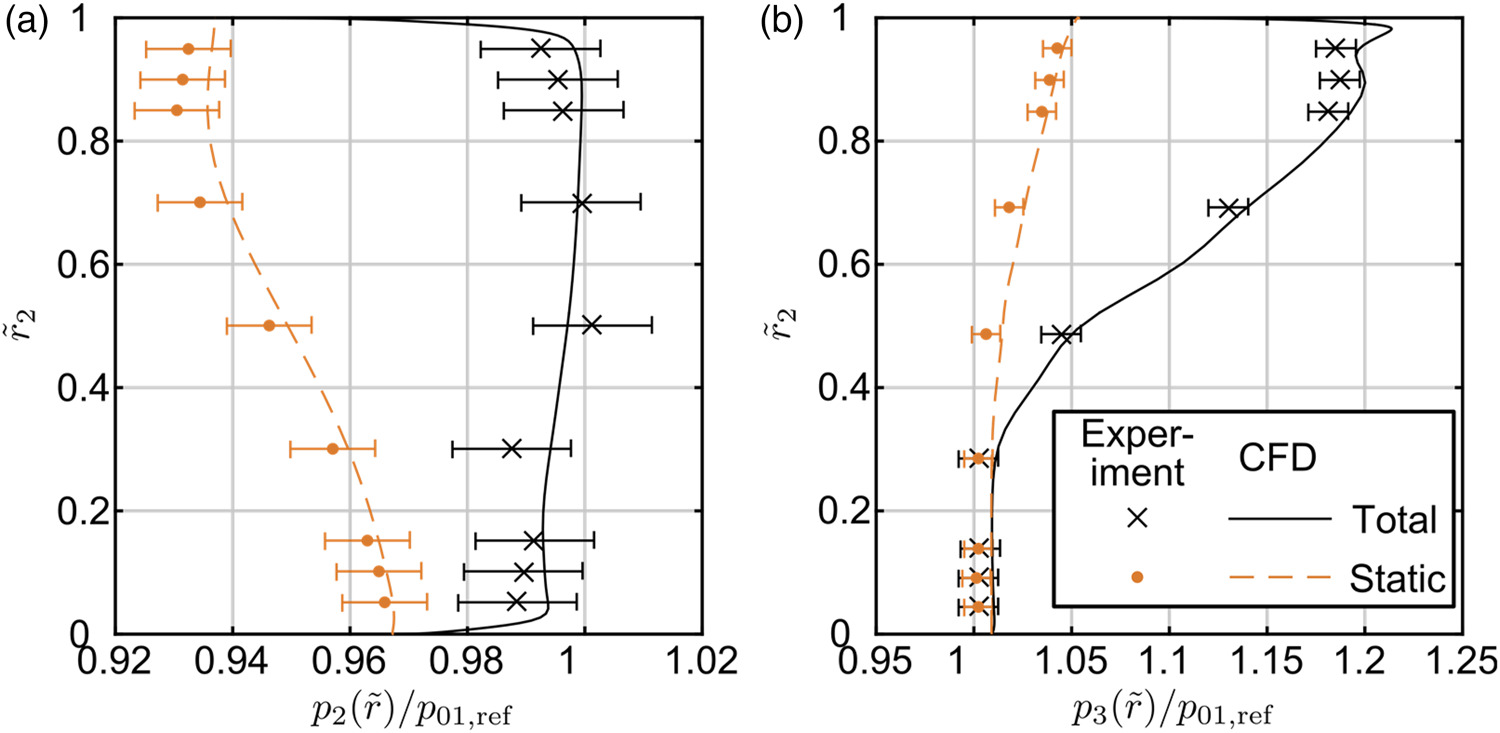
Rotor inlet and outlet static and total pressure radial profiles are plotted in Figure 4 for the −95° stagger setting, 100% speed point labelled by the triangle (ii) in Figure 3. Figure 4b highlights the low flow region below 40% span, where the static and total pressure coincide. The match achieved across the simulated conditions demonstrates that the CFD method accurately captures the key region of blockage characteristic of reverse thrust operation. Replicating both total and static pressure at rotor inlet in Figure 4a, combined with a similar level of agreement achieved for this station’s flow angle (not included for brevity) show radial swirl and mass flow distributions are representative. The hub recirculation and tip high work regions observed for the ADP in reverse thrust operation (Williams and Hall, 2019) are also present in Stage 51B.
Figure 4.
NASA Stage 51B −95° stagger setting, 100% rotor speed (operating point (ii)) radial pressure distributions at (a) rotor inlet, and (b) rotor outlet.
The most significant error in CFD predictions was observed at the 85° stagger setting (marked by the diamond (iii) in Figure 3), and the 100% speed points for the −85° setting (exemplified by operating point marked (i) in Figure 3). These conditions were the only to exhibit significant tip suction surface separations, as shown in Figure 5, where the raised incidence at the tip causes stall-like behaviour for the −85° setting (i), and the inverse camber imposed by restaggering through flat leads to a leading edge separation at 85° stagger (iii). Where these tip-region separations were absent, predictions mostly fell within experimental error, as for point (ii) at −95°. The ADP fan could not be restaggered through flat, as the rotor hub sections would clash, so the leading edge separations that would occur under this configuration were not present in any ADP simulations.
The RANS method was shown to accurately predict the trends in overall performance and flow distribution in reverse thrust operation with stagger setting and rotor speed for NASA Stage 51B. CFD calculations matched the trends of radial pressure and temperature profiles with rotor stagger setting and speed, with acceptable error to the experimental measurements, except where the rotor tip suction surface separated near the tip. The hub recirculation, or blockage region, observed in ADP reverse thrust solutions, was present, and its extent captured faithfully. This suggests the method is appropriate to assess the performance of the ADP in reverse thrust, but also that RANS predictions of the ADP, or other test cases in reverse thrust operation are not reliable where significant tip suction surface separations occur.
Rotor design modifications
Changes to rotor pitch to chord, chordwise camber, and radial loading distribution were considered to affect the key flow features defining the reverse thrust flow field in previous work (Williams and Hall, 2019).
These suggested design parameters were varied from the baseline ADP fan stage, with the constraint that the averaged forward operation at cruise and take-off is maintained. Table 1 summarises the cruise and take-off performance for the baseline fan stage, and the changes for 6 redesigned fan stages at equivalent operating conditions, demonstrating that consistent pressure ratios and efficiencies were achieved for these designs. Significant differences in reverse thrust performance between these cases would thus demonstrate design effects largely independent of forward operation.
Table 1.
Cruise and take-off conditions bypass total pressure ratio and isentropic efficiency for modified designs.
The 6 redesigned fan stages form studies of 3 design parameters:
Pitch-to-chord ratio. 16, 20, 22, and 24 rotor blade designs matching the chord and loading distribution of the baseline 18 blade fan.
Radial loading distribution. A mid-loaded rotor relative to the baseline, and redesigned bypass stator.
Forward camber. Matching the baseline loading distribution with the position maximum camber moved towards the leading edge, adding turning to the forward section, introducing a more symmetric camber distribution to transonic tip sections.
For the mid-loaded design, the objective loading distribution was redefined, as plotted in the later discussion of results. This was the only stage with a redesigned bypass stator, modified with the same approach as above. After the loading distribution was achieved, rotor chord was increased near the mid-span, to limit section Lieblein diffusion factors to baseline design levels. 90% span sections for the baseline, mid-loaded, and forward camber designs are illustrated in Figure 10b.
Resulting rotor designs achieved the match in performance presented by Table 1. Control of stagnation point incidence produced similar efficiency and loading variations with incidence at the cruise rotor speed for all designs. No further design optimisation was carried out.
Reverse thrust performance
Pitch-to-chord ratio
Rotor pitch-to-chord ratio was varied by changing the number of blades. Table 2 lists the designs and their pitch-to-chord at rotor hub and tip. 20 and 22 blade designs are omitted from the presented results, as the trends observed in their performance are replicated in the comparison of the highest and lowest pitch-to-chord ratio designs: with 16 blades (blade A), and 24 blades (blade B).
Table 2.
Pitch-to-chord ratio for rotor hub and tip sections.
| Blade number | 16 | 18 | 24 | |
|---|---|---|---|---|
| Blade label | A | Baseline | B | |
| Pitch-to-chord ratio | Hub | 0.725 | 0.645 | 0.483 |
| Tip | 1.08 | 0.961 | 0.725 | |
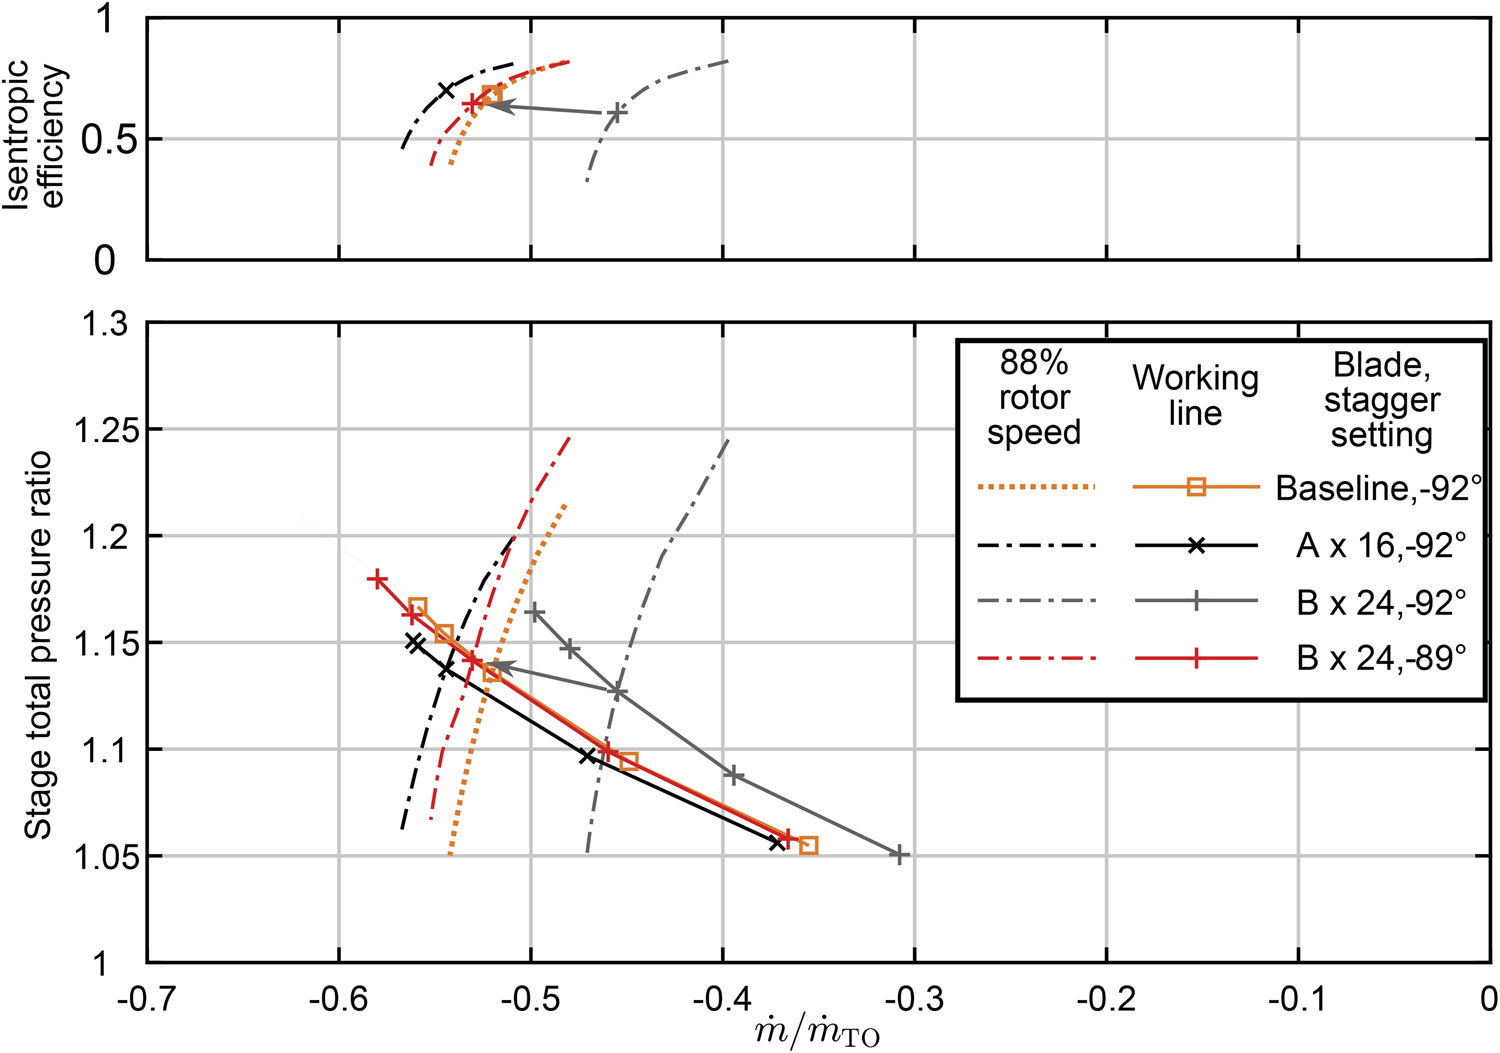
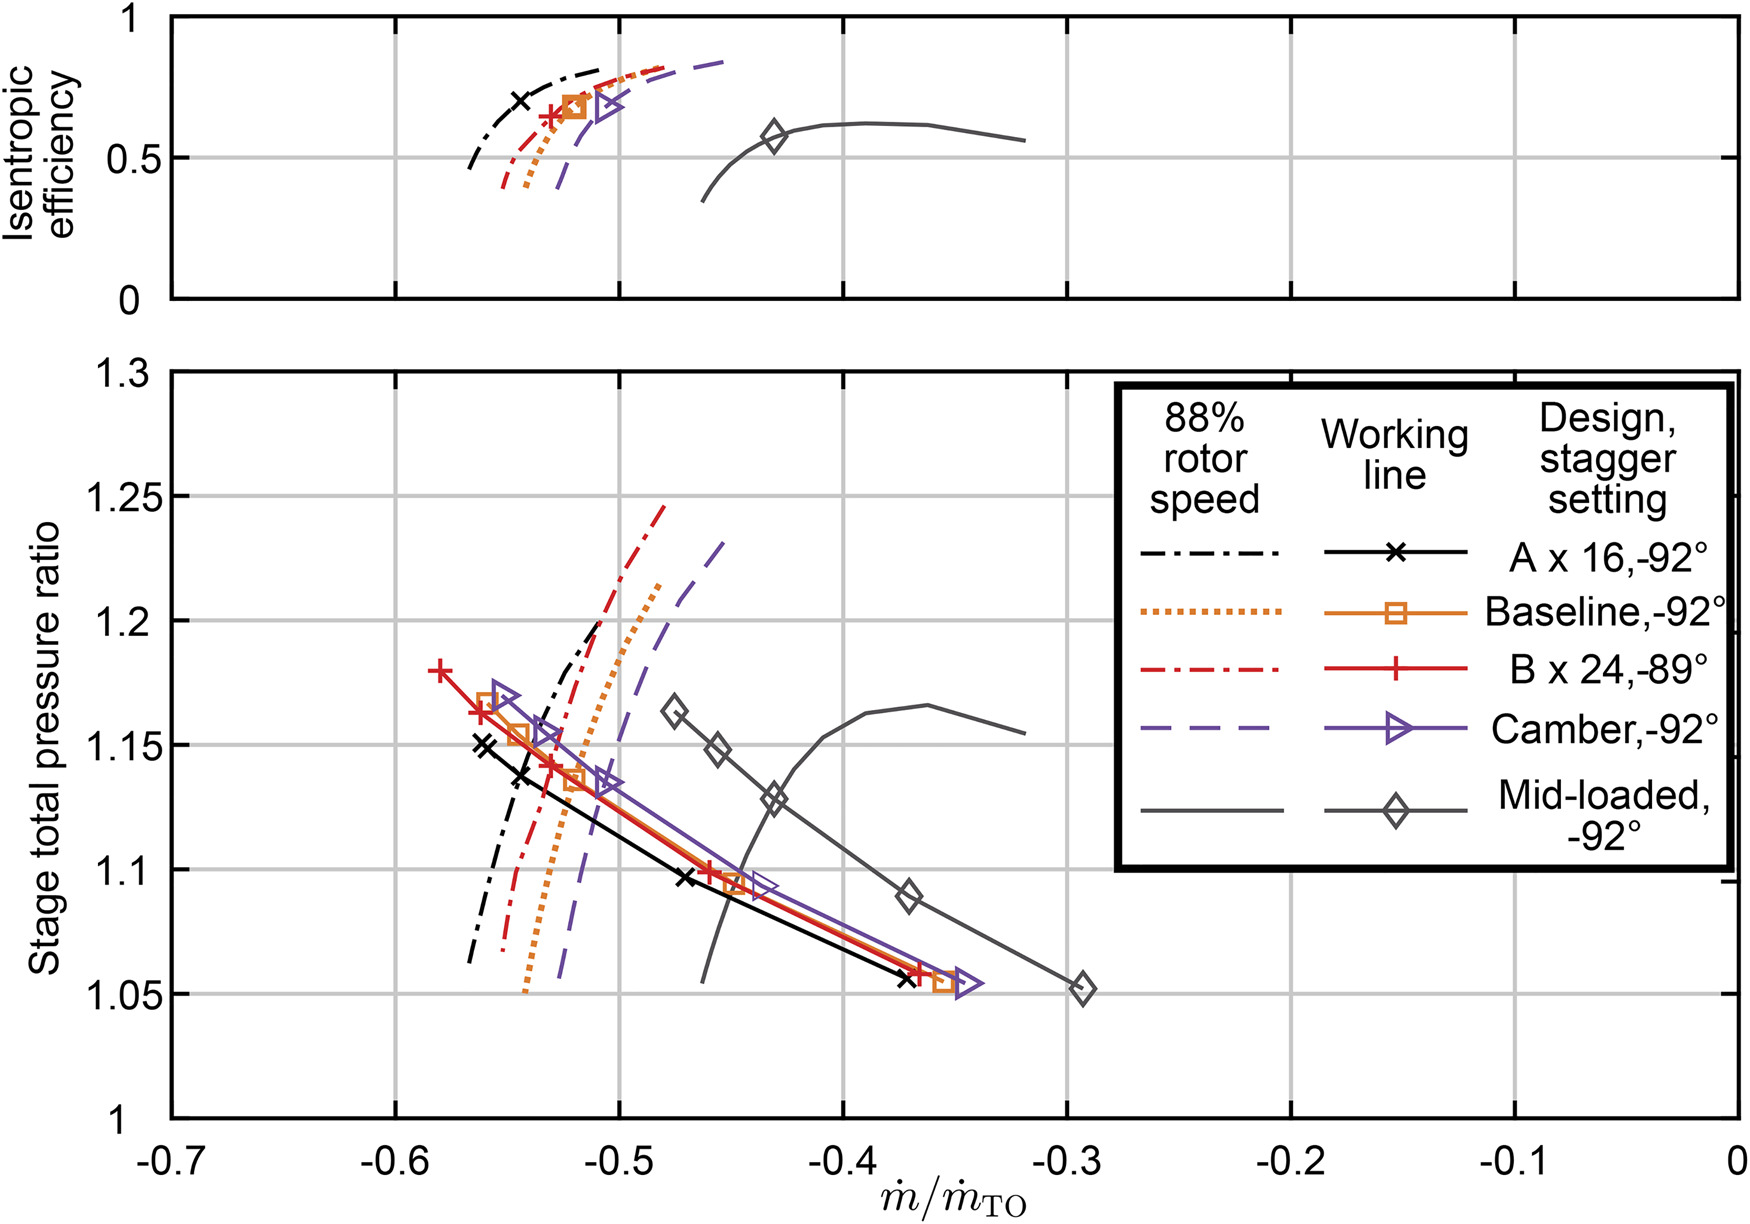
At a matched rotor stagger setting of −92° relative to design, Figure 6 shows a significant drop in working line mass flow rate for the reduced pitch-to-chord blade B. However, opening blade B by 3° to −89° brings blade B’s working line to approximately the flow rate for that of blade A. In contrast to forward operation, reverse thrust working lines vary significantly with stagger setting due to changes in outlet flow angle and effective flow area, as noted by Giffin et al. (1977). 3° corresponds to the difference in design point trailing edge angle between the designs, as the higher pitch-to-chord blade A requires more camber to achieve its forward loading requirement. Blade B at −89° shows increased peak mass flow rate and pressure rise at high rotor speed on the working line, and higher predicted operating range and pressure rise on the 88% rotor speed characteristic than blade A at −92°. This suggests a benefit in stability and peak thrust output to the lower pitch-to-chord ratio design. 88% rotor speed is used subsequently for detailed comparison of designs as a reasonable estimate of the upper limit of attainable engine speed, though the true limit would require assessment of core power mechanical limitations.
Figure 6.
Reverse thrust operation stage total pressure ratio and efficiency working lines and 88% rotor speed characteristics for 3 rotor designs with varied pitch-to-chord ratio.
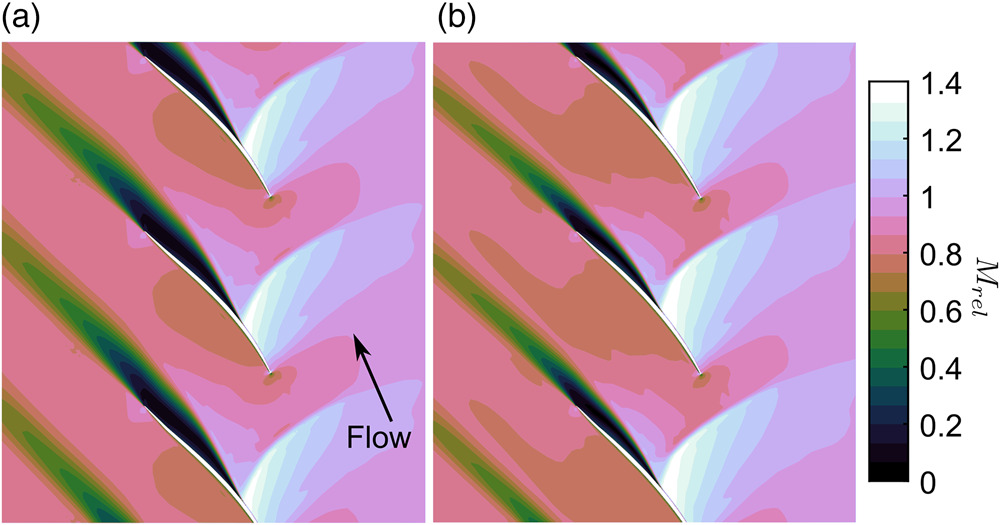
To probe these differences, Figure 7 compares the radial variation in fraction of pitchwise blocked flow area for the 2 pitch-to-chord ratio redesigns, with contours of relative Mach number at 40% and 90% span at 88% rotor speed working line conditions. Blocked flow regions were identified and quantified by the method of Khalid et al. (1999). The hub recirculation region spans to above 50% span at rotor outlet, with blade B at −92° showing near zero flow below that radius. The lower flow working line for this configuration derives from increased blockage caused by the pressure surface separations, as shown by the relative Mach number contours at 40% span. Each of blade A and blade B’s separations are of similar pitchwise extent, but with 50% more blades, blade B has greater blockage across the full annulus. Opening blade B by 3° reduces the severity of negative incidence at lower span fractions to restore total blockage to the level of blade A at −92°.
Figure 7.
Radial profile of fraction of pitchwise blocked flow area at 88% rotor speed working line conditions, for blade A with 16 rotor blades at −92° stagger, and blade B with 24 rotor blades at −92° and −89° stagger, with contours of relative Mach number at 40% and 90% span.
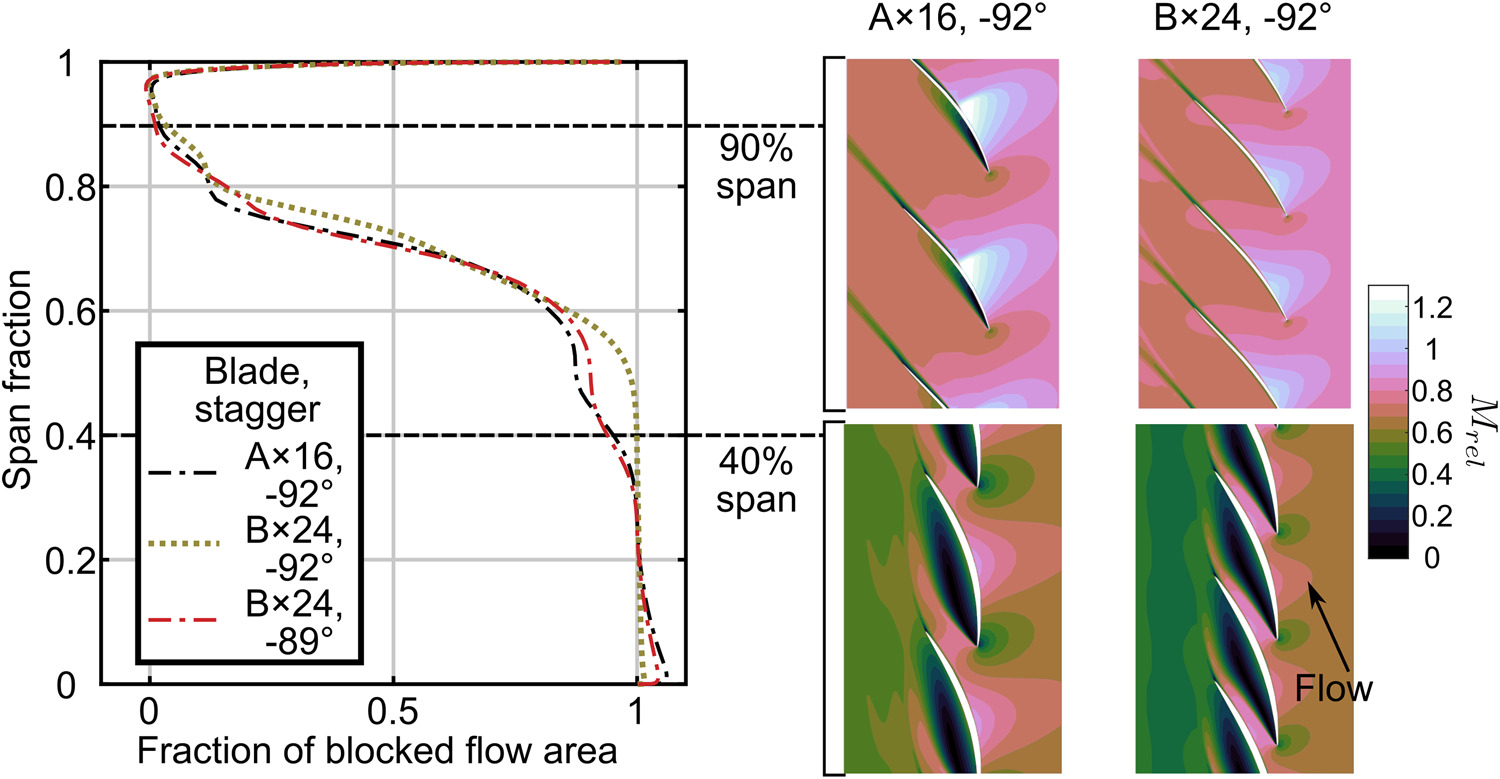
The high rotor speed range and pressure rise benefit for blade B at −89° derive from reduced peak suction-side relative Mach numbers, which are evident from the 90% span contours. In forward operation, reduced pitch-to-chord ratio allows reduced section camber for the same flow turning. In reverse thrust operation, this alleviates the tip high-work region blade loading and upstream rotor surface curvature. Where blade A shows the onset on suction surface separations after the shock, blade B can operate to higher rotor speeds before this occurs.
Reduced rotor pitch-to-chord for the same forward operation design point thus allows greater peak mass flow rate and pressure rise at more open reverse stagger settings.
Rotor section camber distribution
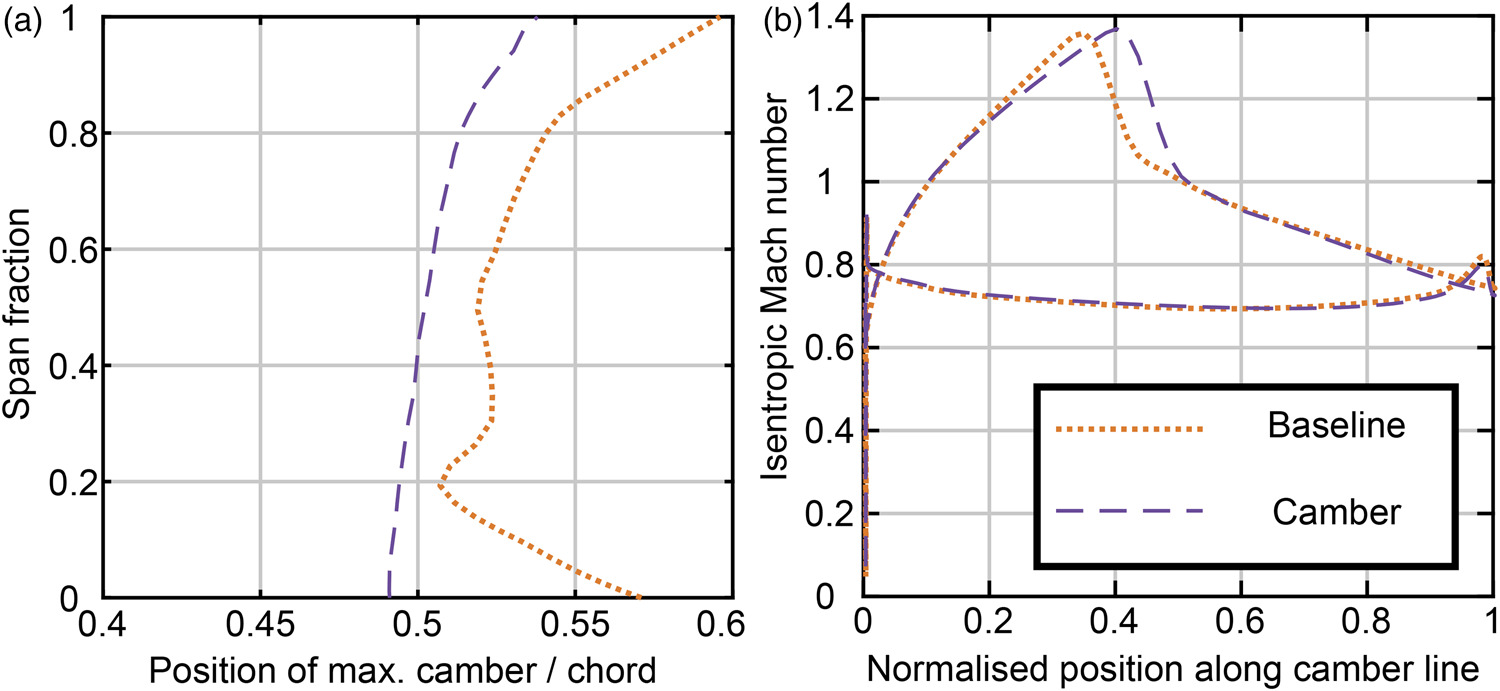
As seen in the tip flow for blade A, high curvature in the upstream portion of the rotor tip sections leads to strong shocks that cause reduced operability and increased loss at high rotor speeds. Moving the position of section maximum camber forward as a fraction of chord reduces the aft section curvature, which becomes that upstream portion in reverse thrust operation. Figure 8a plots the shift in camber applied from the baseline design. The result is a delay in shock position in reverse thrust operation, as shown in Figure 8b at 88% rotor speed. Note that the position of maximum camber is measured from the forward operation leading edge, whereas the position for Figure 8b is measured from the leading edge in reverse thrust operation.
Figure 8.
Forward camber design (a) spanwise distribution of camber position, and (b) rotor surface isentropic Mach number at 80% span for 88% rotor speed working line reverse thrust conditions.
The effect is subtle below 88% rotor speed, but allows higher peak loading at 100% rotor speed due to the lengthened pre-shock, highly loaded portion. Figure 9 compares the relative Mach numbers for baseline and forward camber designs at 90% rotor span and 100% rotor speed. Both display large suction surface post-shock separations, but the forward camber blade shifts these rearward, reducing pitchwise blockage in addition to the enhanced section loading.
Figure 9.
Contours of relative Mach number at 90% rotor span and 100% rotor speed for (a) baseline, and (b) forward camber designs.
The benefit of the forward camber design is limited to maximum rotor speeds, which may not be attainable in reverse operation due to core engine limits. For most optimised rotor designs, any shift in section camber or loading would also come at a cost to design point efficiency.
Radial loading distribution
A mid-loaded fan stage was designed by modifying the baseline radial loading distribution as in Figure 10a. Rotor trailing edge angles were closed significantly at mid-span, and opened towards the tip to achieve the target loading profile and match the design-point pressure ratio and mass flow rate at the baseline rotor speed. These changes at the tip are illustrated by the 90% span rotor section – the corresponding forward camber design section is also compared.
Figure 10.
Mid-loaded rotor (a) radial loading coefficient distribution compared to baseline design, and (b) 90% span sections at 9° stagger rotor take-off setting.

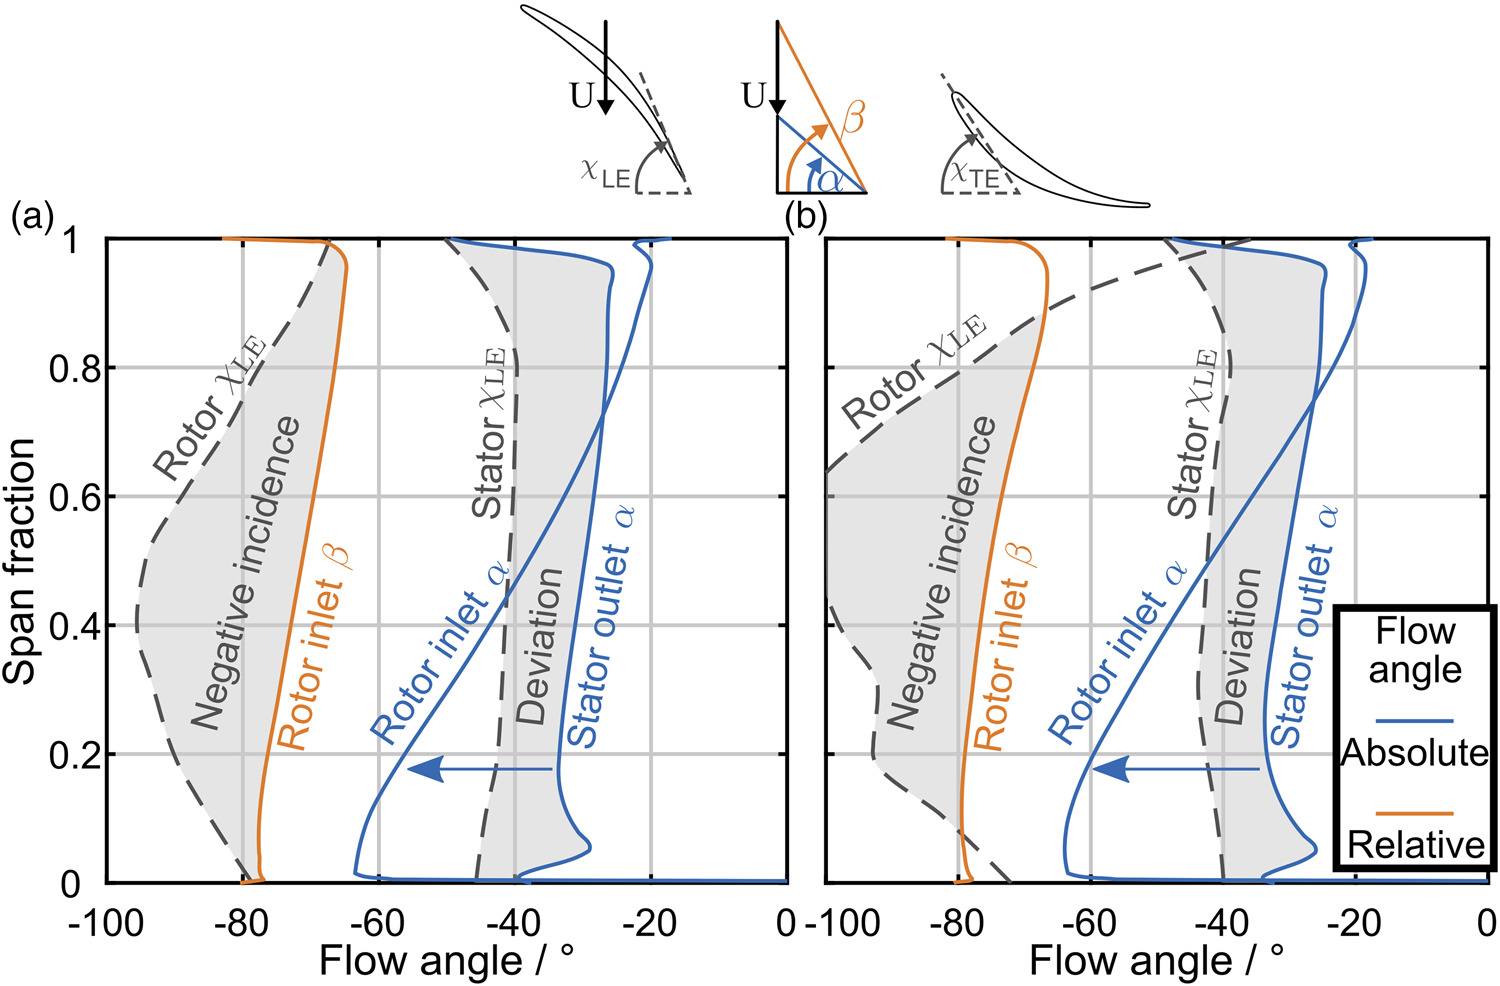
In reverse thrust operation, the mid-loaded design’s closed mid-span trailing edge angles increase the level of negative incidence. Figure 11 shows this shift in incidence, noting that the rotor relative inlet flow angle does not change significantly between designs, despite the bypass stator redesign. The mid-loaded rotor has a greater difference of mid-span to tip section trailing edge angle that leads to significantly worse negative incidence at mid-span – responsible for hub recirculation blockage, and positive incidence at the tip – pushing the high-work region towards stall.
Figure 11.
Progression of reverse thrust fan stage flow angles for the (a) baseline and (b) mid-loaded design at −92° stagger working line conditions, and 88% rotor speed.
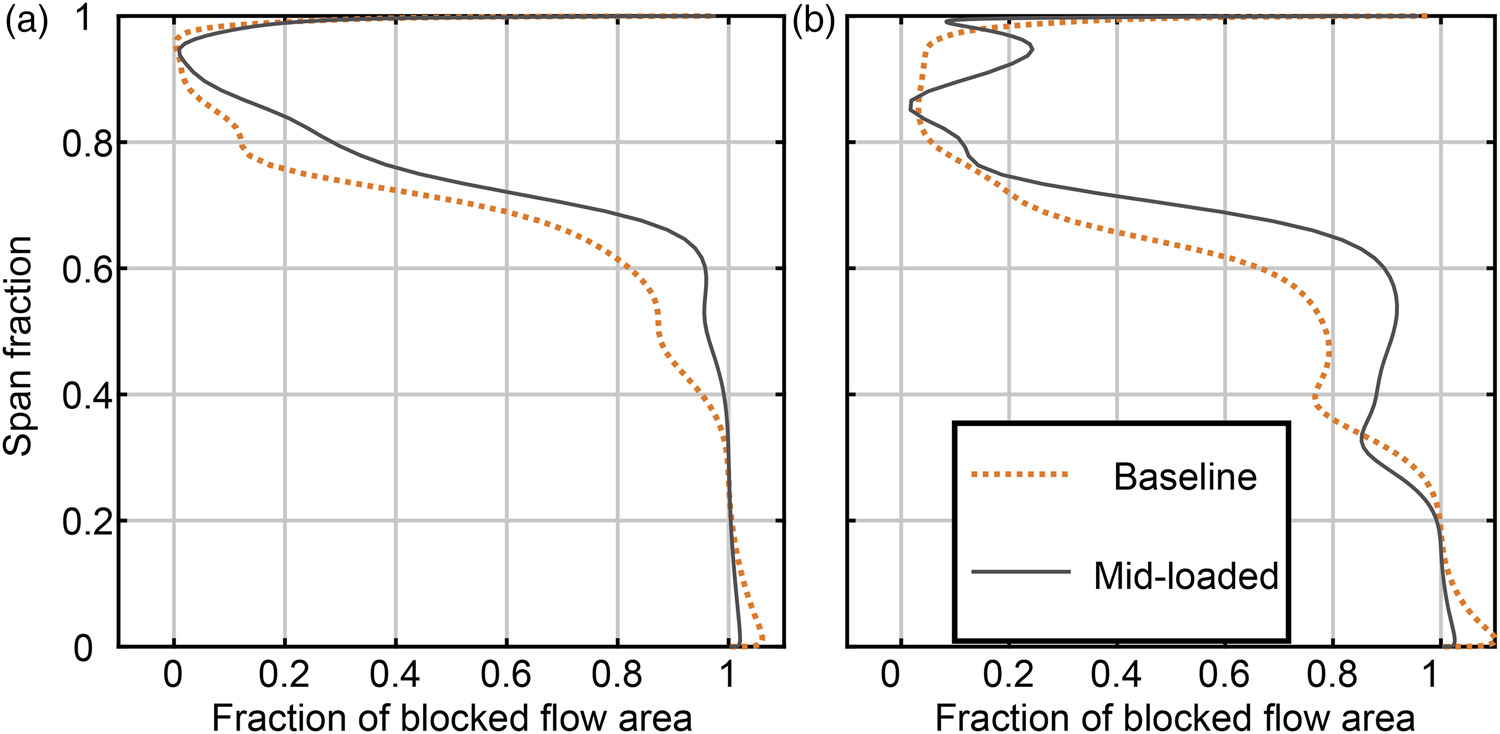
This negative effect applies across rotor stagger settings, with Figure 12 showing the blocked flow area across the span at −92° and −86° stagger for baseline and mid-loaded designs. The extent of hub-recirculation blockage is limited to 60% span for the baseline, but reaches 70% for the mid-loaded blade. Unlike the reduced pitch-to-chord design, restaggering the rotor brings no improvement. The bump in blockage above 90% span for the mid-loaded blade in Figure 12b indicates significant suction surface separations, even on the working line.
Figure 12.
Radial profile of fraction of pitchwise blocked flow area at 88% rotor speed working line conditions, for the baseline and mid-loaded designs, and (a) −92° and (b) −86° stagger settings.
Mid-loading the fan stage resulted in a reduction in thrust output and operating range due to further misaligning the rotor inlet blade angle to the incident flow. A forward operation design that would improve the reverse thrust incidence variation should increase tip loading relative to the mid-span, reducing the trailing edge twist.
Design effect on reverse thrust
The distinct variations in reverse thrust performance for the studied designs are summarised in Figure 13. The mid-loaded design observes reductions in working line mass flow rate, total pressure ratio, and efficiency at all stagger settings. For pitch-to-chord ratio and forward camber designs, the most significance changes are at the highest rotor speeds. Here, blade A (16 blades) sees diminishing gains in throughflow, whereas blade B delays increases in shock-related losses at 100% rotor speed.
Figure 13.
Summary of design study reverse thrust stage total pressure ratio and efficiency at stagger settings of comparable operability.
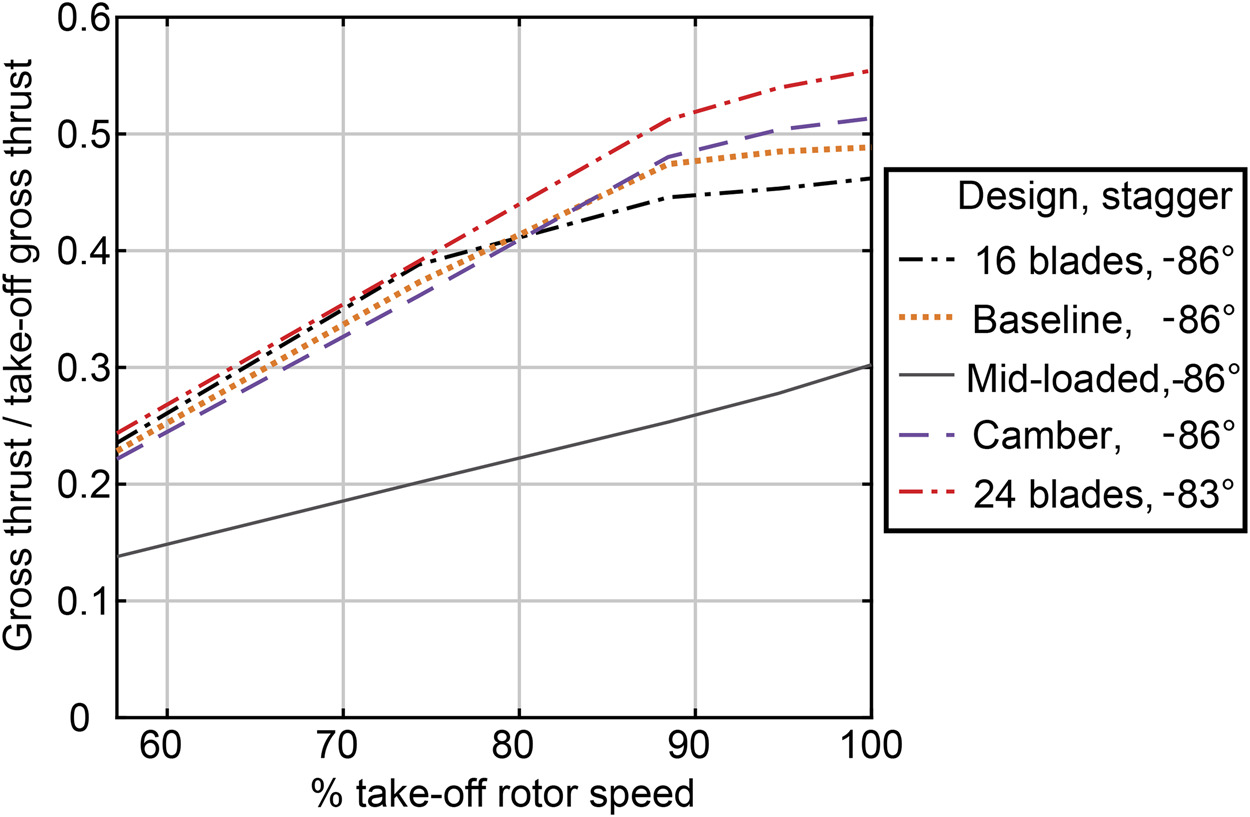
The key metric for the effectiveness of reverse thrust operation is the contribution towards the overall engine braking force on landing. This is quantified by a comparison of the gross thrust produced by fan designs on the working line, which was calculated by integrating the momentum flux across the plane of the engine intake (plane 3 in Figure 1). Figure 14 compares the working line gross thrust for the 5 designs at their peak thrust stagger setting. This was −86° for all cases other than blade B with 24 rotor blades, which was set to −83°. The reduced pitch-to-chord 24 blade stage reached the maximum gross thrust of 55% of take-off gross thrust at 100% rotor speed. The forward camber blade achieved around 3% greater thrust than the baseline design. On landing, rotor speeds above 88% of the take-off rotor speed are unlikely due to power limits of the core engine, so section camber does not present significant enough improvement to justify compromises to the optimum design-point configuration. The observed stable operating range improvement for the 24 blade (B) design suggests that reduced pitch-to-chord should be preferred.
Figure 14.
Gross reverse thrust normalised by take-off gross thrust against fan rotor speed for designs at peak reverse thrust stagger settings.
The most significant outcome is the performance deficit caused mid-loading the fan at the design point. Up to a 50% reduction in gross reverse thrust across rotor speeds was observed while maintaining the 1D design operating condition. Where reverse thrust is required from a variable pitch fan and forward operation efficiency can be maintained, increasing loading at the tip relative to the mid-span will improve reverse incidence to the benefit of operability and thrust.
Conclusions
The effect of rotor pitch-to-chord ratio, rotor section camber distribution, and stage radial loading distribution on variable pitch fan reverse thrust performance was assessed by redesigning the baseline ADP fan while maintaining cruise operating point to within 0.5% of rotor efficiency.
The single-passage RANS method achieved an appropriate match to experimental measurements for NASA Stage 51B where rotor tip flow remained attached. This provided confidence in the approach for the design study, where these separations were absent for ADP working line conditions, except at highest rotor speeds.
Reduced rotor pitch-to-chord increased peak reverse thrust by a maximum of 8%, observing an improvement on predicted operating range. This benefit derived from moderated rotor loading, and reduced shock Mach numbers.
Moving design section camber forward produced around 3% greater reverse thrust at 100% rotor speed due to a later shock position, resulting in greater loading ahead of the shock. This benefit would not be sufficient to justify any penalty to forward operation, particularly as reverse thrust rotor speeds would be limited by core engine limits.
A mid-span loaded design led to greater mid-span negative incidence and increased tip positive incidence in reverse thrust relative to a tip loaded design. This resulted in up to a 50% reduction in gross reverse thrust output.
Further work is needed to quantify the effects of design changes under varied conditions, such as those predicted without modifications to engine installation for reverse thrust operation by Rajendran and Pachidis (2019). This is important in weighing the balance of implementing installation modifications to reduce distortion in recovered bypass flow and recreate fan operation as observed in clean inflow, at the cost of complexity and weight.