
Introduction
The turbine blades in High Pressure Turbine (HPT) rotate at very high speeds, and the high pressure ratio across the tip region often leads to transonic Over-Tip-Leakage (OTL) flow (Zhang and He, 2017). Most of the previous blade tip aerothermal research have been carried out under stationary condition (Azad et al., 2000a, 2000b; Bunker et al., 2000; Bunker, 2001; Jin and Goldstein, 2003), even though it has been recognized that the relative casing motion can significantly change the OTL flow structure and the tip thermal performance.
In the early study by Chyu et al. (1987), it was found that the endwall motion brought additional shear force to the OTL flow, and an extra recirculating region was formed against the recirculating region inside the cavity at strong shroud motion. Yaras et al. (1992) reported that the passage vortex and leakage vortex were pushed closer to the suction side and partly blocked the leakage flow due to the relative motion. Tallman and Lakshminarayana (2000) showed that with the moving casing motion, much of the leakage flow travelled around underneath the leakage vortex, where it developed a strong secondary flow. Previous studies also indicated that the OTL flow was reduced by the casing motion (Krishnababu et al., 2009; Zhou et al., 2012; John and Nicholas, 2014). As the tip clearance continues to be tighter, the influence of the relative casing motion will become stronger, as recently reported by Zhu et al. (2020).
The effect of relative casing motion on tip heat transfer and cooling has been numerically studied. Zhou et al. (2012) suggested that the distribution of Nusselt number on the winglet tip had been greatly changed by endwall motion. Studies for flat tips (Zhang et al., 2011; Zhou, 2014) indicated the relative casing motion significantly reduced the local heat transfer on the frontal tip region, and the leading edge “hot stripe” moved towards the middle blade section. Numerical results for squealer tips (Zhou, 2014; Virdi et al., 2015) showed that endwall motion had increased the middle area of the cavity floor. Virdi et al. (2015) also reported that the HTC difference between the stationary and relative casing motion is larger at small tip gap. For cooled blade tips, Acharya and Moreaux (2014) showed that the pressure side coolant was entrained into the squealer cavity, and the tip coolant was pushed toward the suction side by the relative casing motion.
The experimental methods and facilities to investigate the effect of relative casing motion remains limited. One practical method is the moving belt. Dean (1954) studied the OTL flow rate of wall motion in linear cascade based on this method. Yaras and Sjolander (1992) simulated the rotation using a smooth synthetic rubber belt with the relative speed up to 18 m/s, and the tip clearance was controlled within 0.2 mm. Srinivasan and Goldstein (2003) measured tip mass transfer by using a belt system which can reach 25 m/s relative speed. A large-scale moving belt system was developed by Palafox et al. (2008, 2012) in a 2 m × 4 m suction type wind tunnel. The validity of moving belt design has been examined. It has been demonstrated that the influence of the centrifugal and Coriolis force can be neglected (Yang et al., 2010; Acharya and Moreaux 2014). Another experimental method used by Morphis and Bindon (1988) is to apply a rotating ring outside an annular blade cascade. However, these designs can only achieve a low relative casing speed, and is impossible to match the real engine condition.
Full-scale rotor rigs are able to provide engine-representative Mach number, Reynolds number and rotating speed. Dunn et al. (1989) first developed a large shock-tunnel facility with a full-scale rotating turbine. A series of experiments were conducted based on this facility (Dunn, 1986; Dunn et al., 1992; Dunn and Haldeman, 1995). Dunn and Haldeman (2000) measured the heat flux using heat flux gauge at several points on the tip. Molter et al. (2006) also measured the blade tip heat transfer using the heat transfer gauges.
The existing high-speed experimental rotor rigs used for tip heat transfer are very expensive to maintain. It is very challenging to gain full optical access to the tip region. So far still no truly spatially-resolved tip heat transfer data at high rotating speeds were published in the public domain.
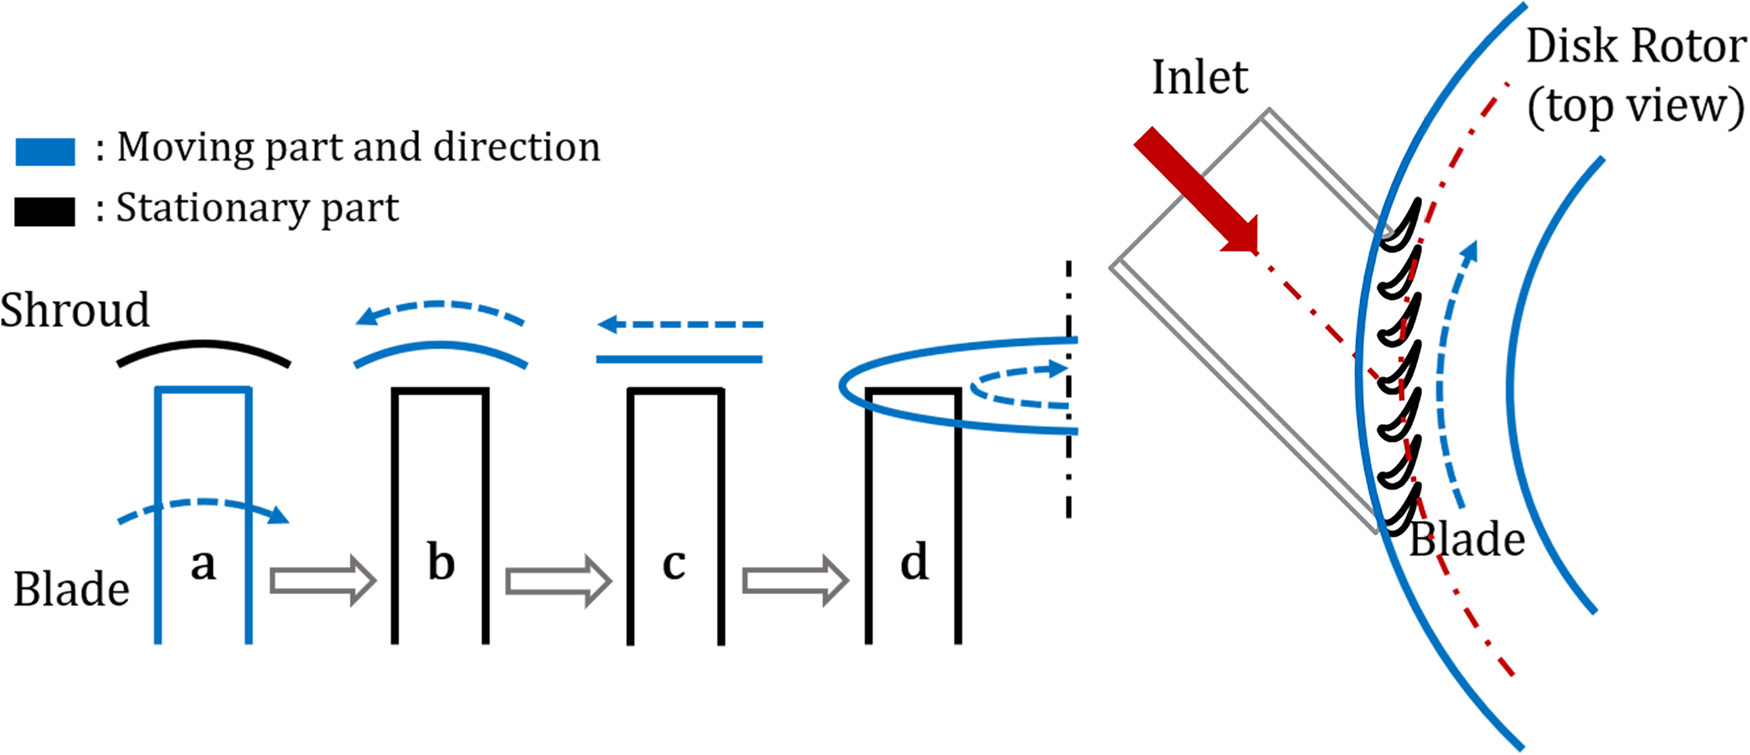
Very recently, Lu et al. (2022) developed a disk rotor rig which can mimic the high-speed casing relative motion while enabling full optical access to the turbine blade tip surface. Figure 1 shows the disk rotor design concept. Basically, it turns the moving belt design (“c”) to a disk rotor (“d”) spinning over a typical high-speed linear cascade test section. When the rotor diameter is sufficiently large (two meters), the difference of the HTC between the condition “c” and “d” becomes negligible. This facility offers the potential for very detailed tip aerothermal measurements at rotating conditions very close to actual operating turbines.
Following the work from Lu et al. (2022), this paper presents detailed squealer tip heat transfer data at engine representative Mach number and Reynolds number, with a relative casing speed of 140 m/s (rotating Mach number 0.4). The relative casing motion effect were assessed by comparisons with stationary data. With closely coupled RANS CFD analysis, the flow physics behind are further discussed.
Methodology
Experimental setup
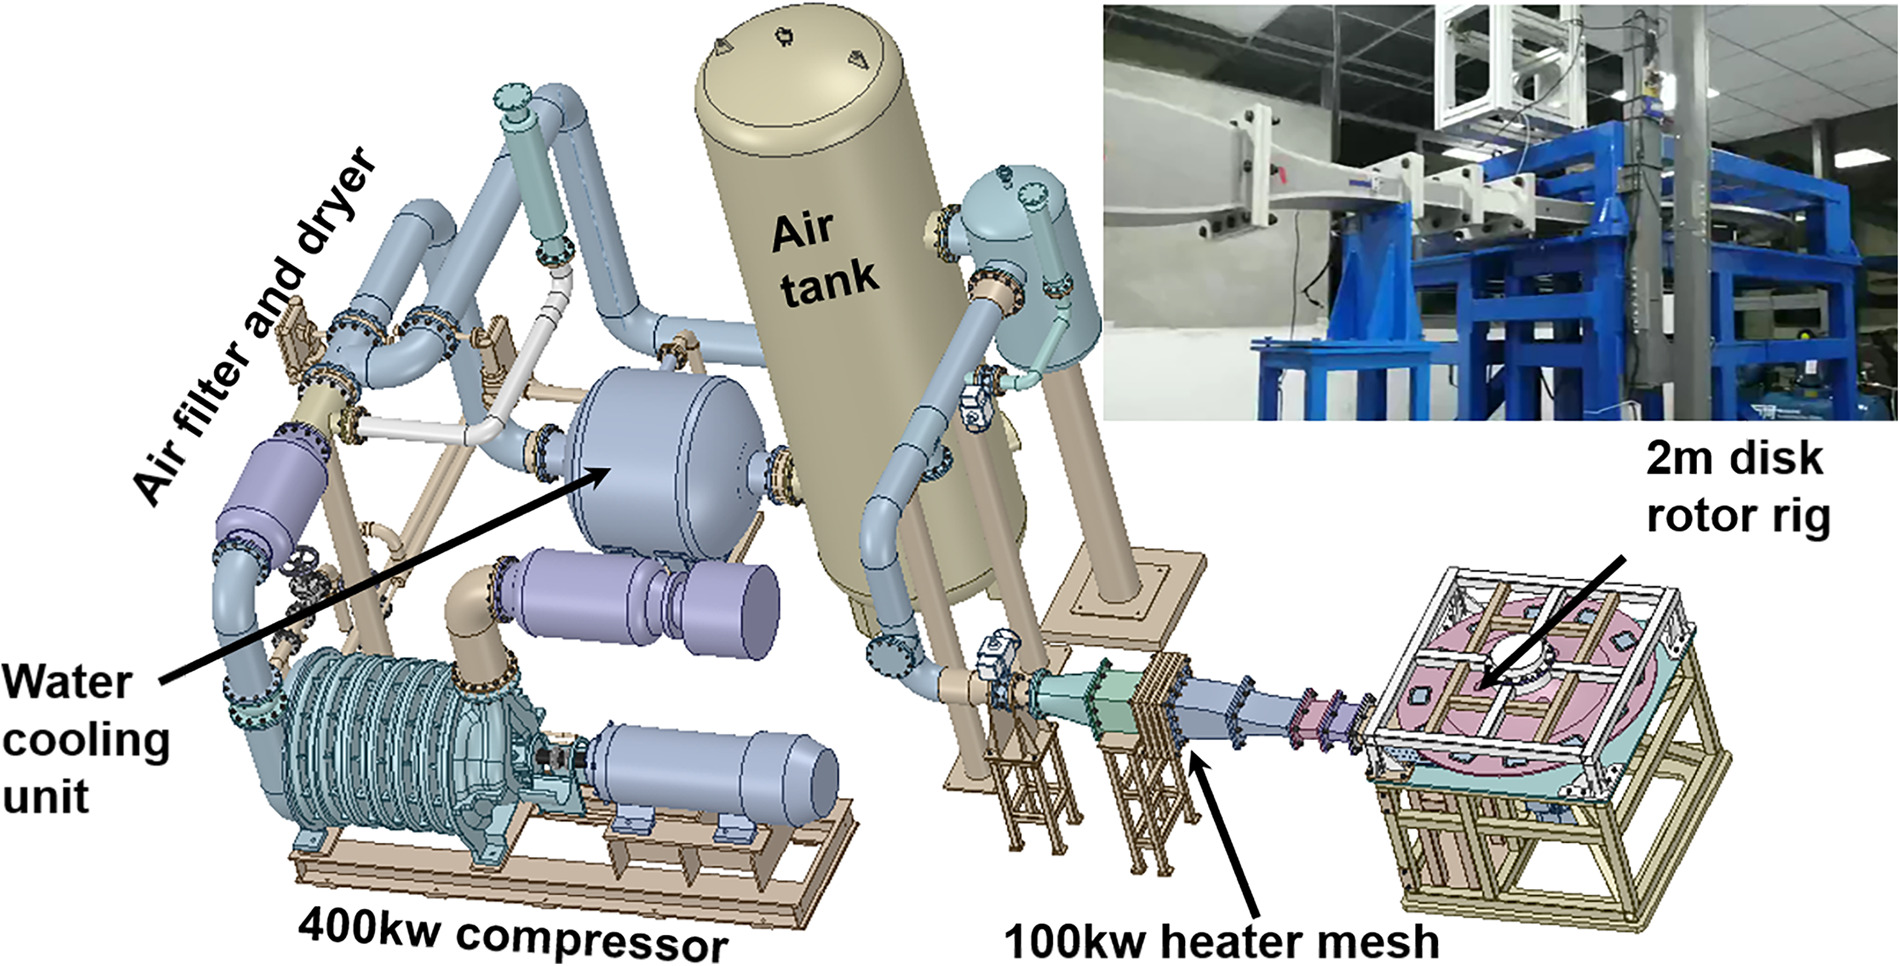
Figure 2 presents an overview of the high-speed continuous wind tunnel system employed in the present experimental study. A 400 kw compressor was used to provide continuous air supply to the test section at a pressure ratio of 1.7. A water cooling unit was located right after the air filter and dryer system to control the inlet temperature. A 10 m3 tank was installed upstream of the disk rotor rig to stabilize the inlet total pressure. For transient thermal measurement, a heater mesh powered by 100 kw DC power supply was used to provide a step temperature rise to the incoming flow.
The bell-shaped disk rotor is shown in Figure 3. Driven by an electrical motor, the rotor with a diameter of 2 meters rotates at 1,600 rpm. The relative casing speed is about 140 m/s, corresponding to a rotating casing Mach number of 0.4.
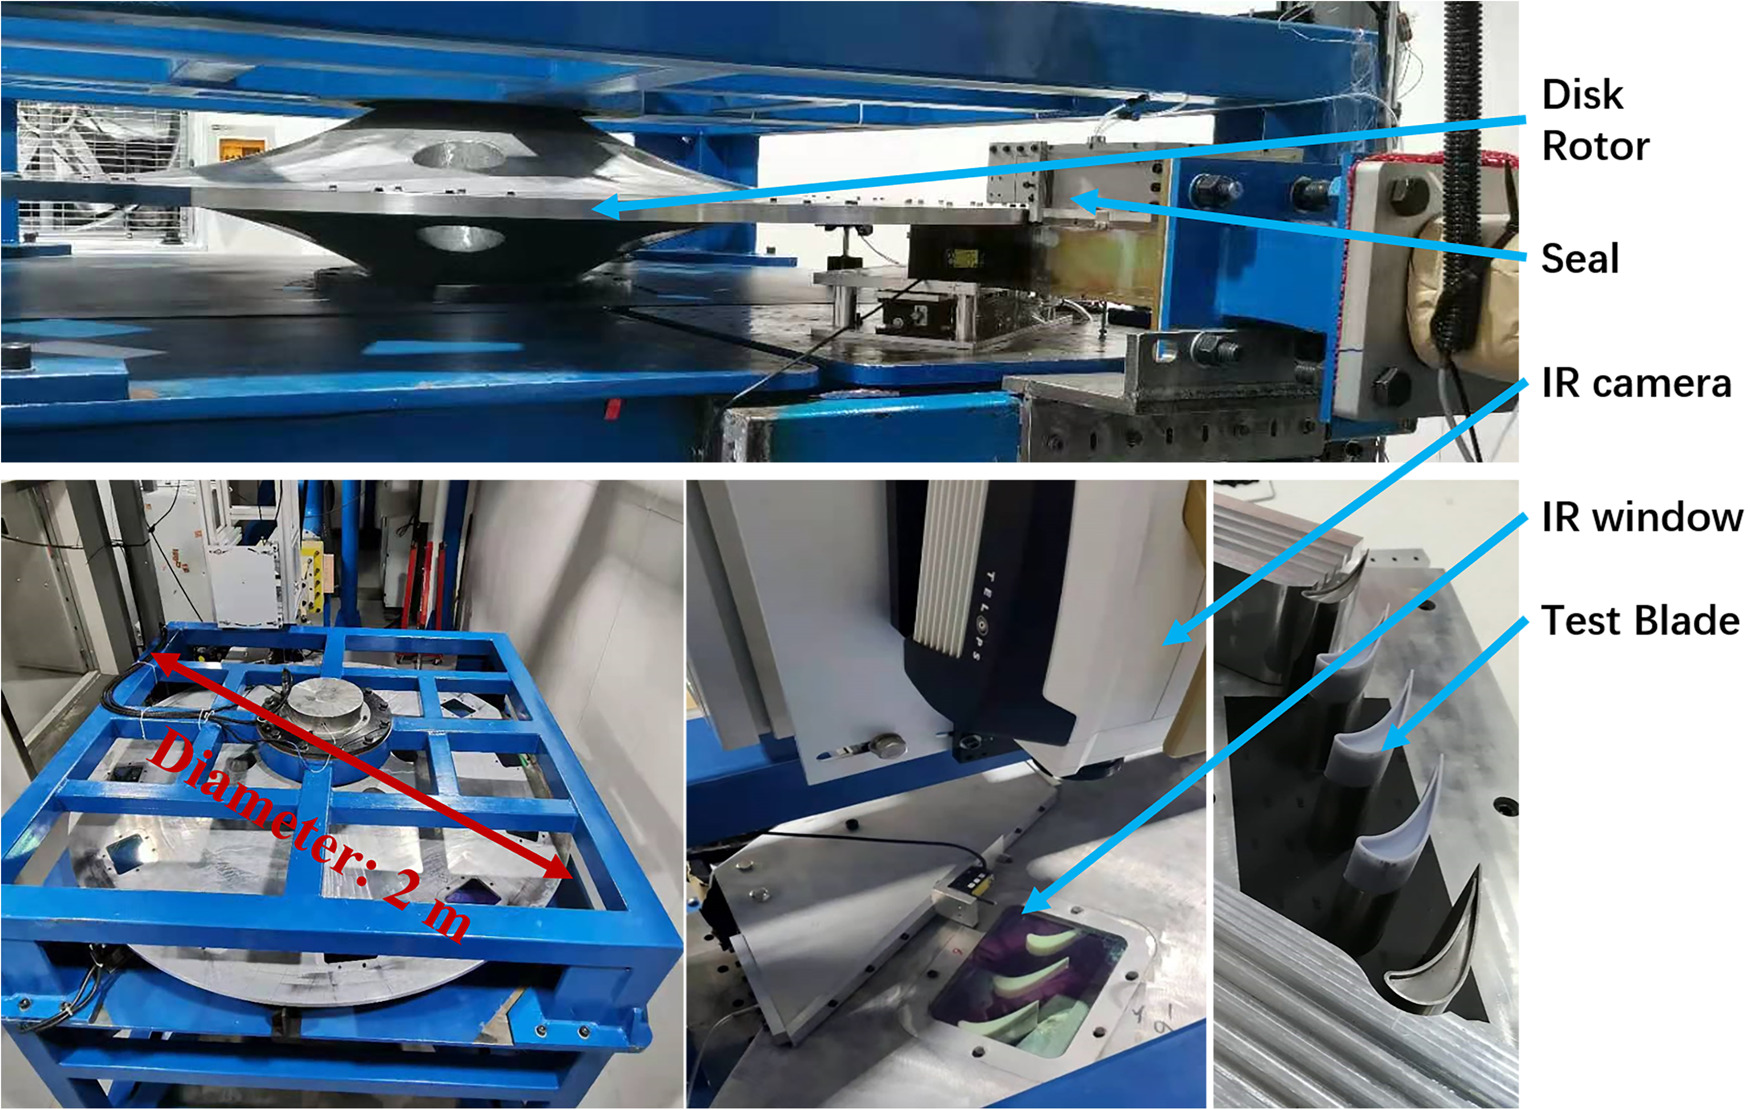
During the rig operation, the disk rotor was closely monitored by several sensors including laser displacement sensors, acceleration transducers and vibration speed sensors. Twelve large IR windows were placed over the large disk rotor for optical access to the blade tip surface. Figure 4 shows the schematic structure of the test section. The test section consists of five blades and four flow passages to achieve the periodicity of the flow field. A seal system was installed above the test section in order to prevent the leakage from the gap between the rotating disk and stationary test section side wall. For the three blades in the middle of the cascade, the upper part was made from epoxy resin with very low thermal conductivity by stereolithography technology, and the lower part was made from steel. The tip gap height is approximately 1% of blade span.

Transient Infrared thermal measurement technique was used in the present study. To obtain the blade tip surface temperature data, a high-speed IR camera (TELOPS FAST 80 hd, frequency 301 Hz @ 720×280, 500 µs exposure time) was used. When the disk is rotating, the IR window will go over the blade one by one at a controlled frequency. Triggered by a laser unit, the IR camera can capture the instantaneous tip surface temperature at each passing event.
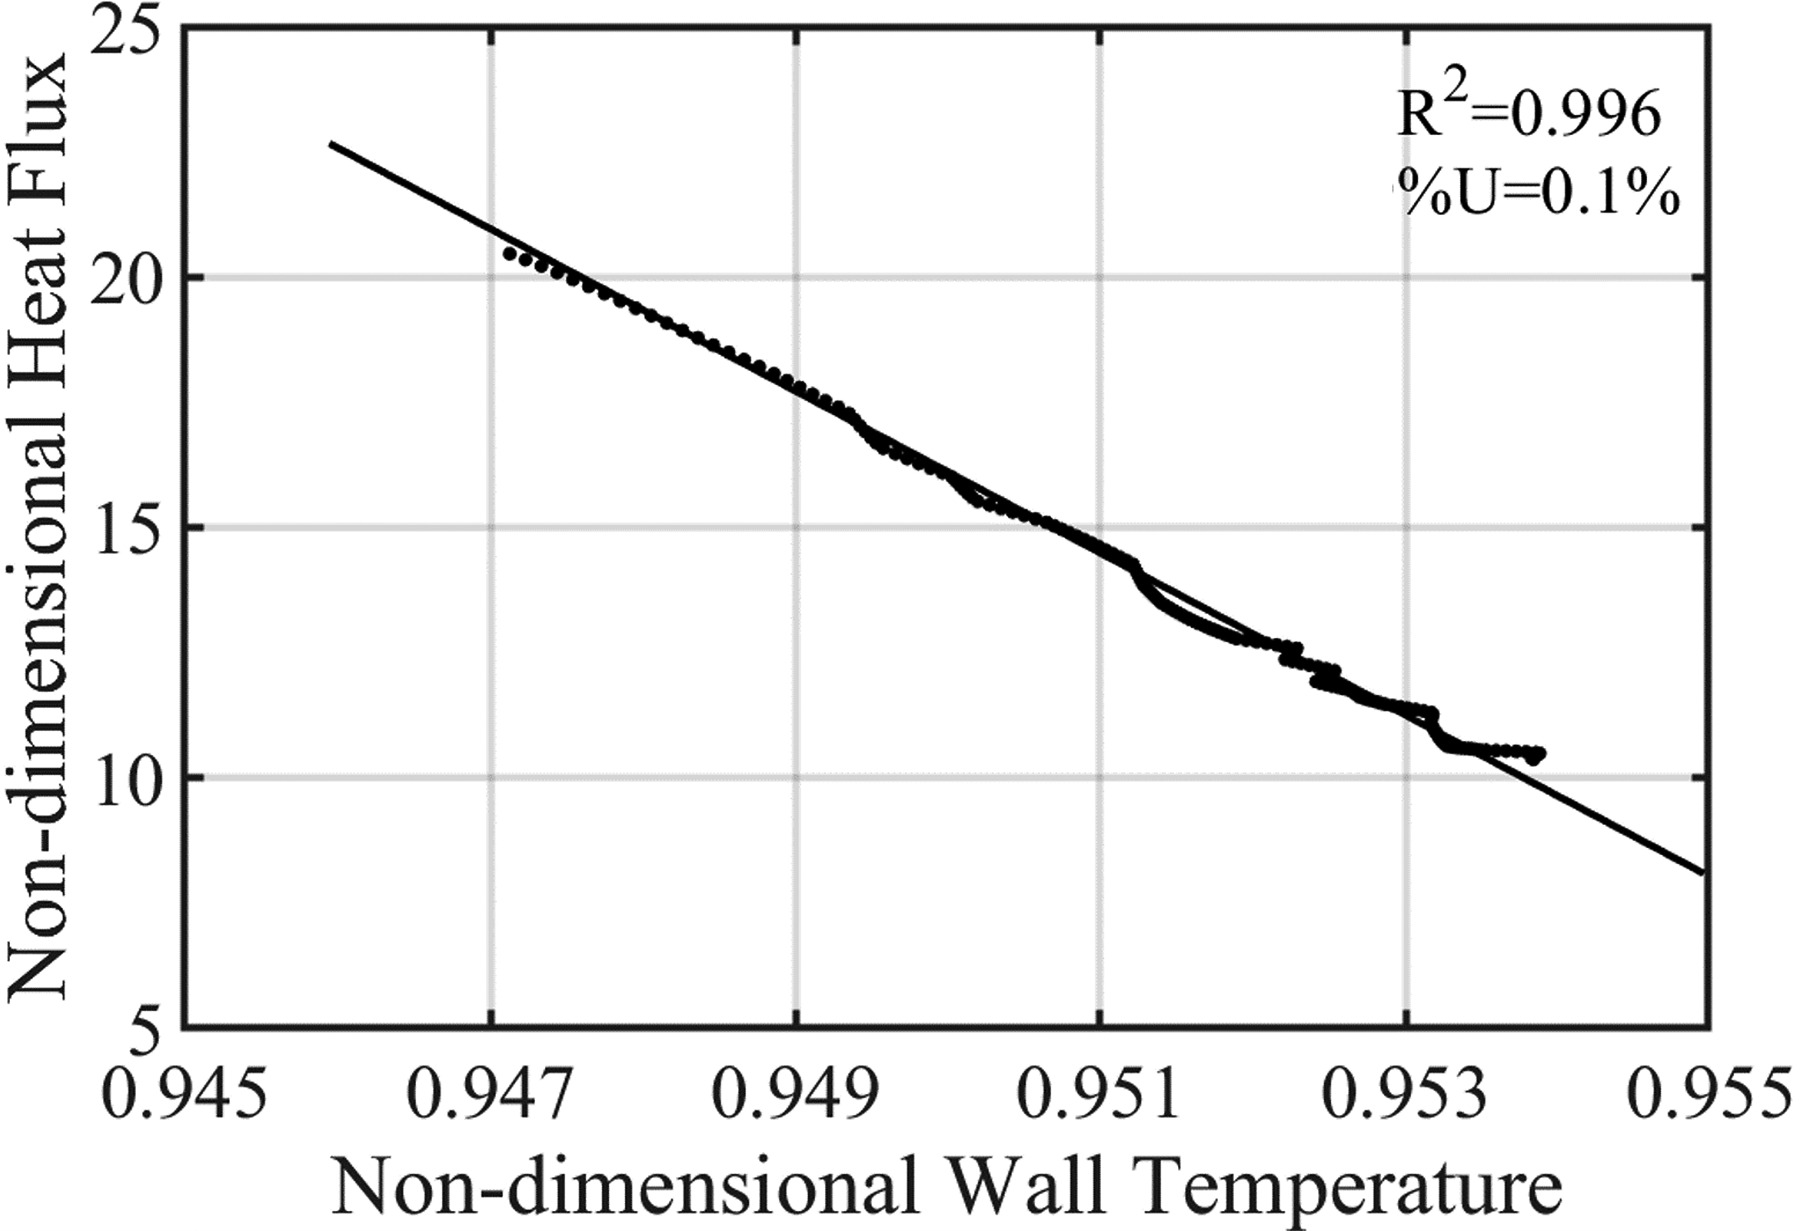
Impulsed method, first introduced by Oldfield (2008) and later adopted by previous thermal measurement for stationary linear cascade experiments (Zhang et al., 2011; Ma et al., 2017), was used to calculate the surface heat flux history based on the IR temperature traces. Figure 5 plots the relation between normalized surface heat flux variation and wall temperature during a transient thermal measurement at a typical tip surface location. The slope of the linear curve is the heat transfer coefficient, which should stay largely constant if the aerodynamics remains unchanged.
Figure 5.
Linear relationship between heat flux and wall temperature for a selected tip surface location during 2 s period of transient measurement.
Surface flow visualization was carried out by an ink trace method. A hollow blade tip was specially designed with four rows of ink holes with 0.3 mm diameter located on the suction side surface. After the mainstream flow was settled at the design condition, black ink was inserted to the blade inner chamber by an injection syringe and then left a series of clear traces over the suction side surface.
In this experiment, a typical HPT blade with fully squealer design is employed. The flow conditions and basic geometry information are provided in Table 1.
Numerical setup
Commercial CFD code ANSYS CFX was employed in the present study for numerical simulations. The k-ω Shear Stress Transport (SST) model was implemented. The computational domain consists of one blade with periodic boundary conditions. The squealer blade profile, inlet and outlet boundary conditions and freestream turbulence intensities were set the same as the experiment setup. The wall velocity of the casing was set to be 0 and 140 m/s to match the experimental conditions.
Figure 6 shows the computational domain and meshes employed in present study. The mesh was generated by the commercial software Pointwise with structured grids. The overall grid number is 19 million, which is sufficient compared to present industrial CFD standard. Figure 6 also shows the
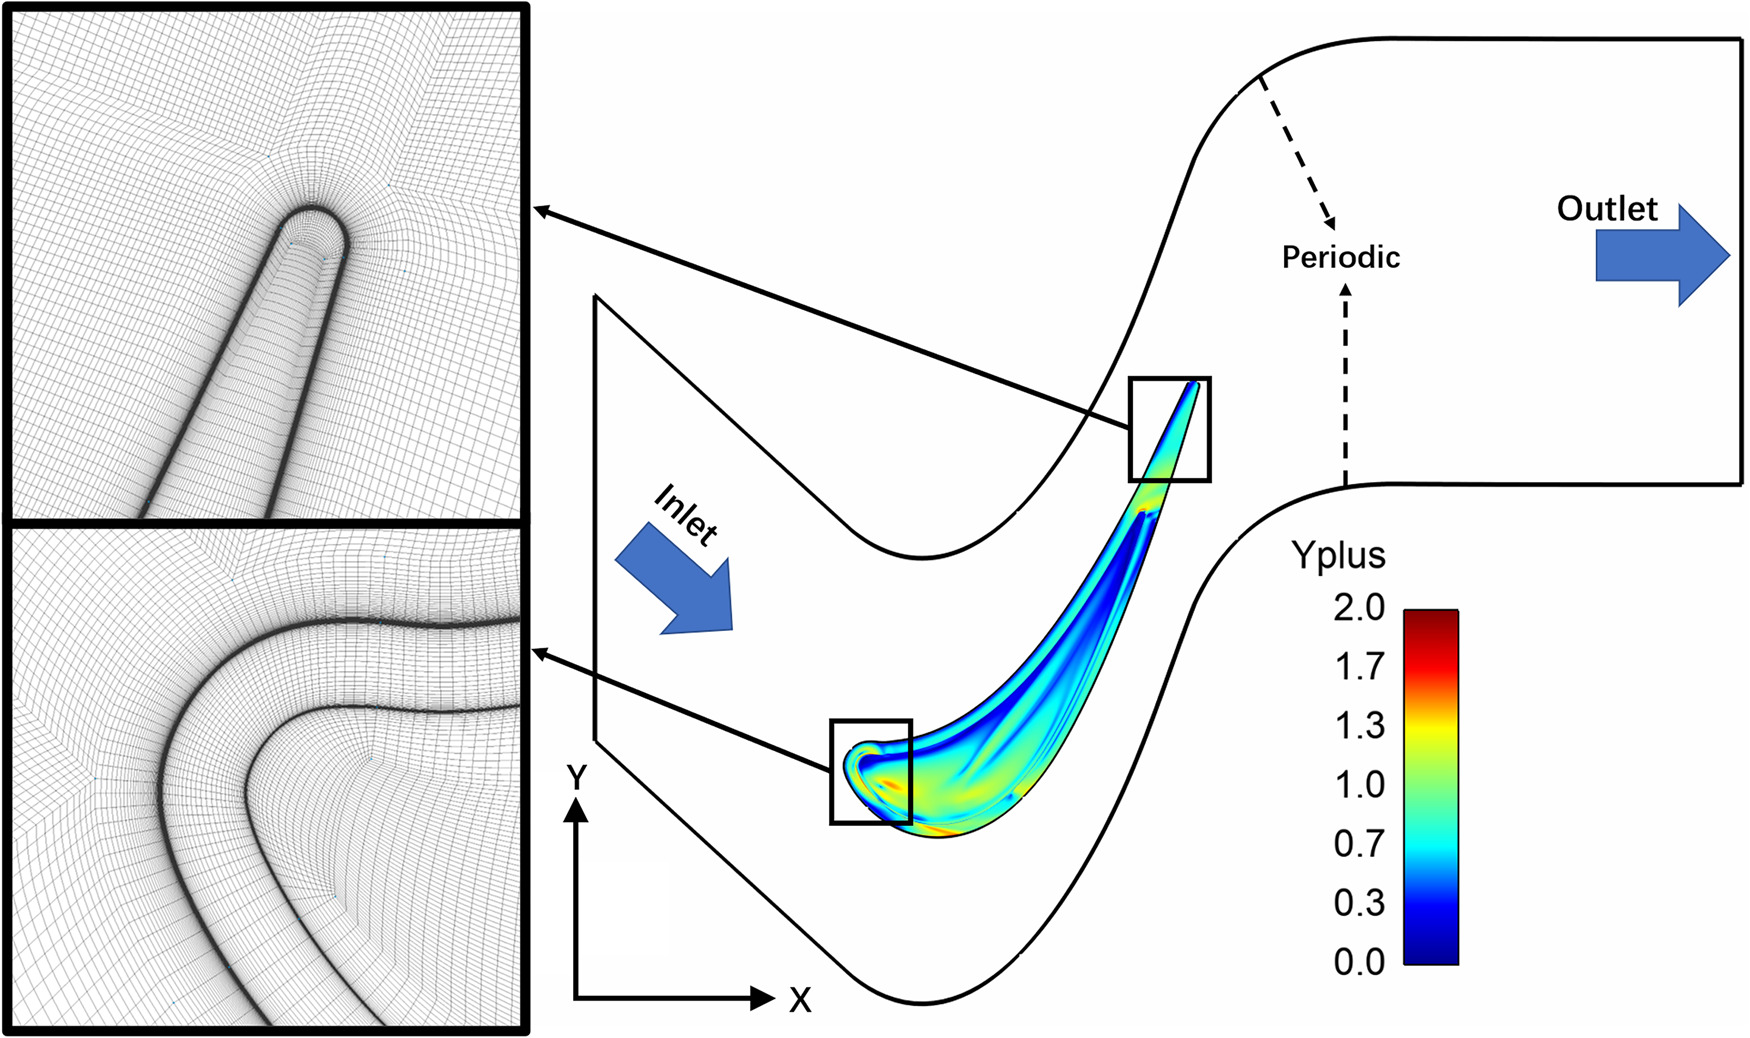
The local HTC of blade surface is defined according to the Newton's law of cooling:
where
Note that the main focus of present CFD study was to reveal the qualitative flow physics behind the experimental data, rather than to quantitatively validate the existing turbulent model. Comparing with the previous work done by Ma et al. (2017), the present numerical work used the same turbulent model, and similar numerical setup with a much higher grid number.
Results and discussion
Figure 7 presents experimental results of tip HTC distributions for both stationary and rotating cases. The excellent HTC spatial resolution reveals distinctly different thermal performance between two cases. A hot spot (labelled as “A”) can be observed near the leading edge region of the cavity floor with and without casing motion. For the stationary case, a second high HTC region (labelled as “B”) is located near the central cavity region close to the suction side. Different from the stationary results, the high HTC region “B” in the rotating case moves away from the suction side rim. The HTC values then reduce, and increase again with a new hot spot “C”. Some other differences in HTC distribution can also be observed over the squealer rims and near trailing edge region.
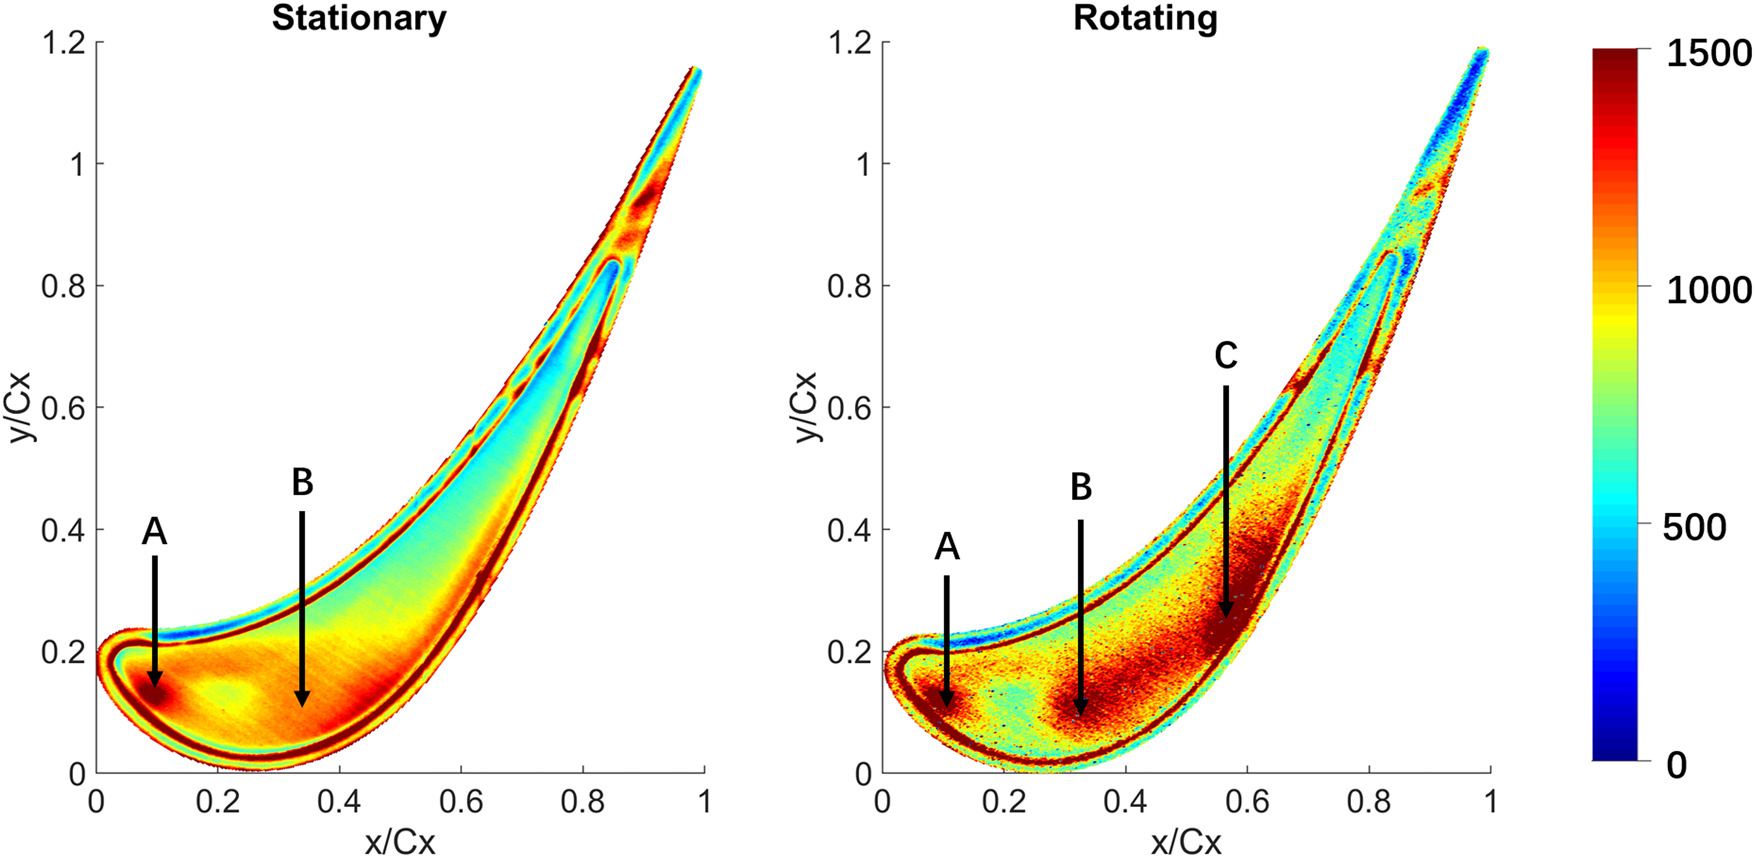
Figure 8 shows CFD simulation results of tip HTC distributions. The quantitative comparison between experimental data and CFD results is not as satisfactory. It is expected for the current RANS CFD simulation to underpredict the diffusion of OTL cavity flow. On the other hand, the stationary and rotating cases do share very similar qualitative trends. The two distinct hot spots “B” and “C” are evident from both contours.
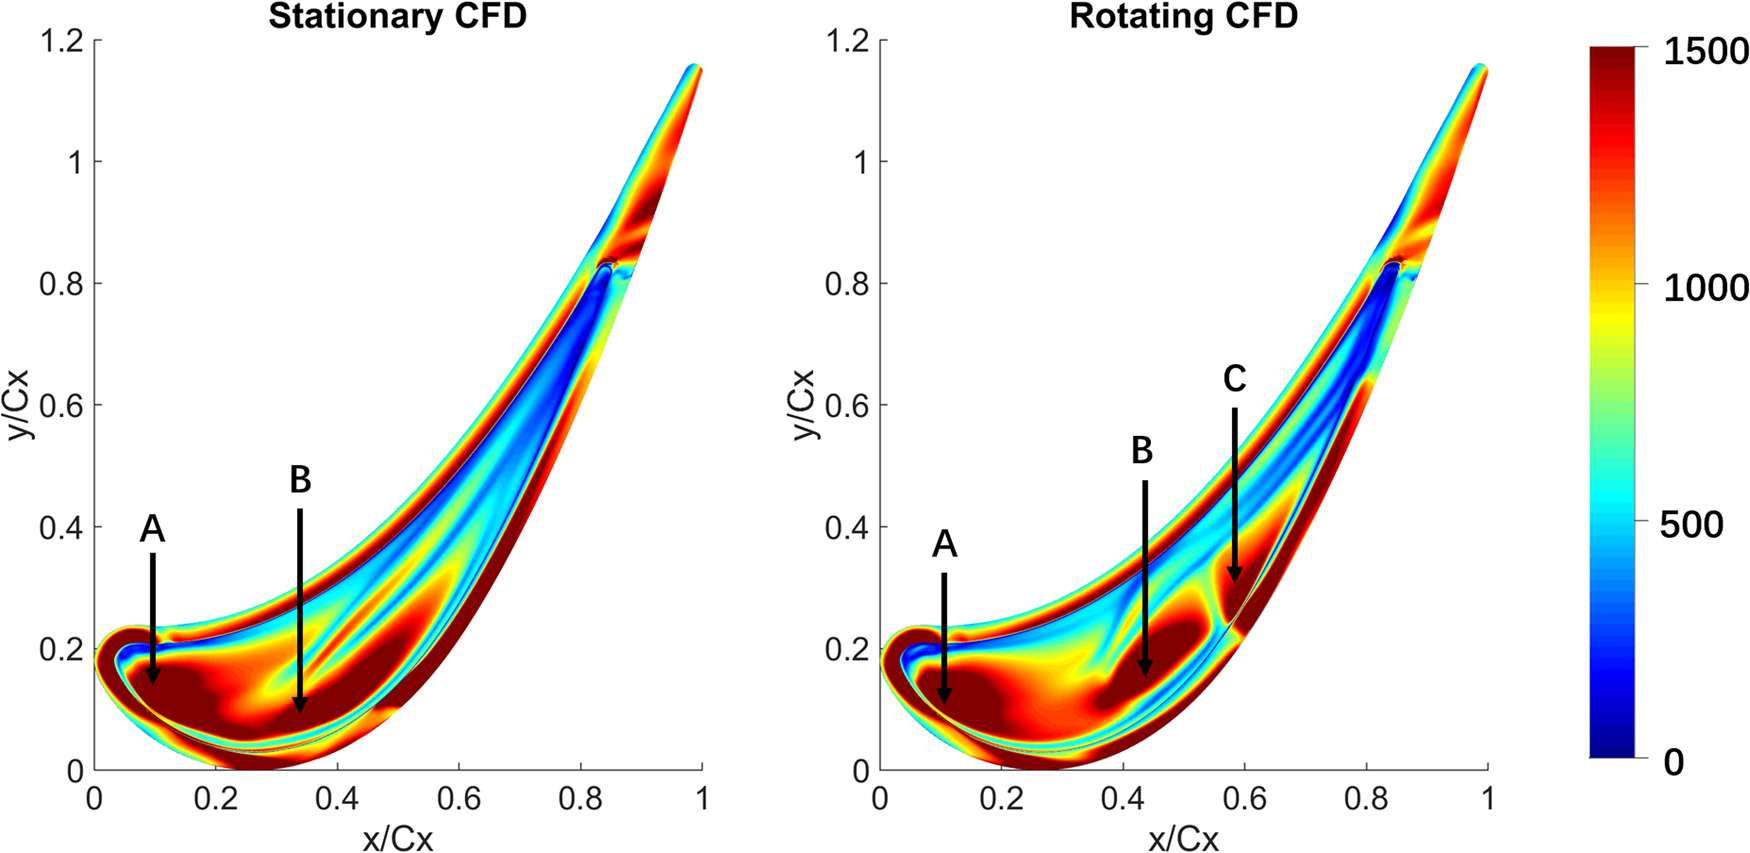
Based on the CFD prediction performance shown in Figure 8, it is reasonable to conduct further numerical analysis on the qualitative flow physics. The influences of relative casing motion on OTL vortical flow structure and leakage flow rate are discussed next.
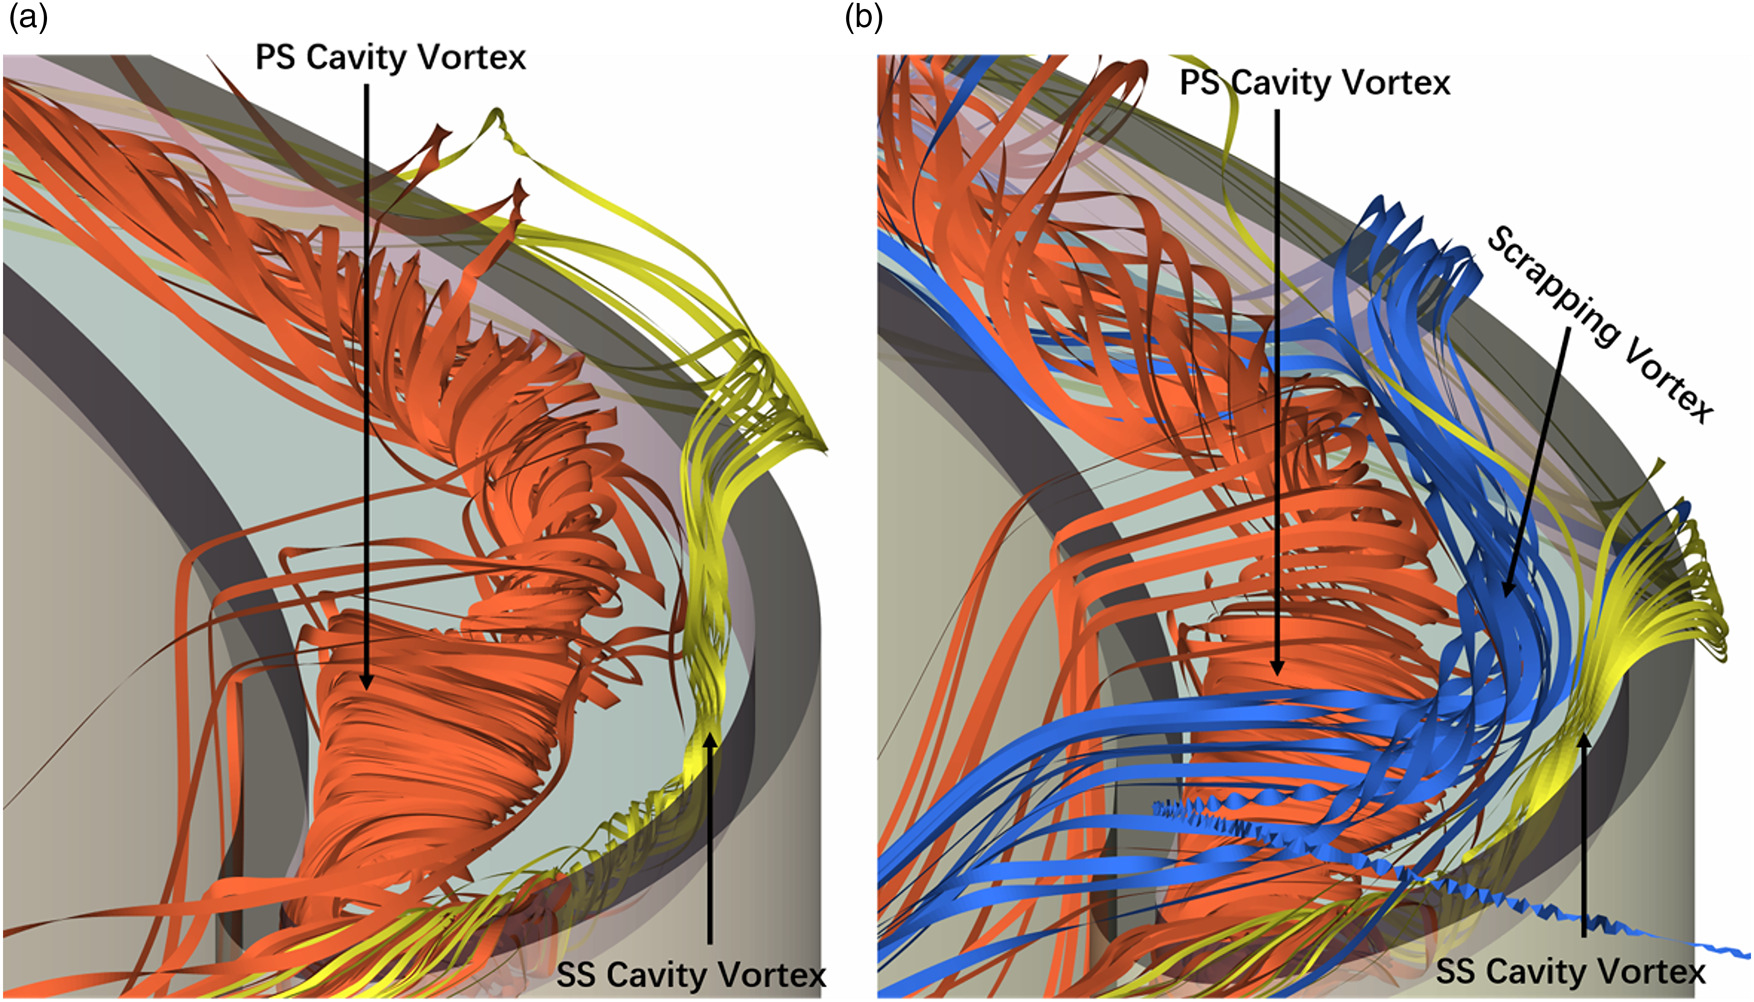
Figure 9 presents normalized vorticity distributions on a few cut planes for both stationary and rotating conditions. The vorticity is nondimensionalized by the mass-averaged velocity at the inlet and the axial chord. The lines of vortex core are also plotted to illustrate the evolution of vortical structures within the tip cavity. For the stationary case, the incoming OTL flow enters the squealer cavity near the leading edge region and impinges onto the cavity floor, resulting in two counter rotating cavity vortices. The direct impingement of OTL flow at this position leads to the first hot spot “A”. In Figure 9, the trace of PS cavity vortex is colored in magenta, the trace of SS cavity vortex is colored in orange. Driven by the pressure gradient, the PS cavity vortex is stronger compared to the SS cavity vortex, and it grows within the cavity floor.
Figure 9.
Normalized vorticity distributions on different cut planes with and without relative casing motion (CFD results). (a) Stationary (b) Rotating.
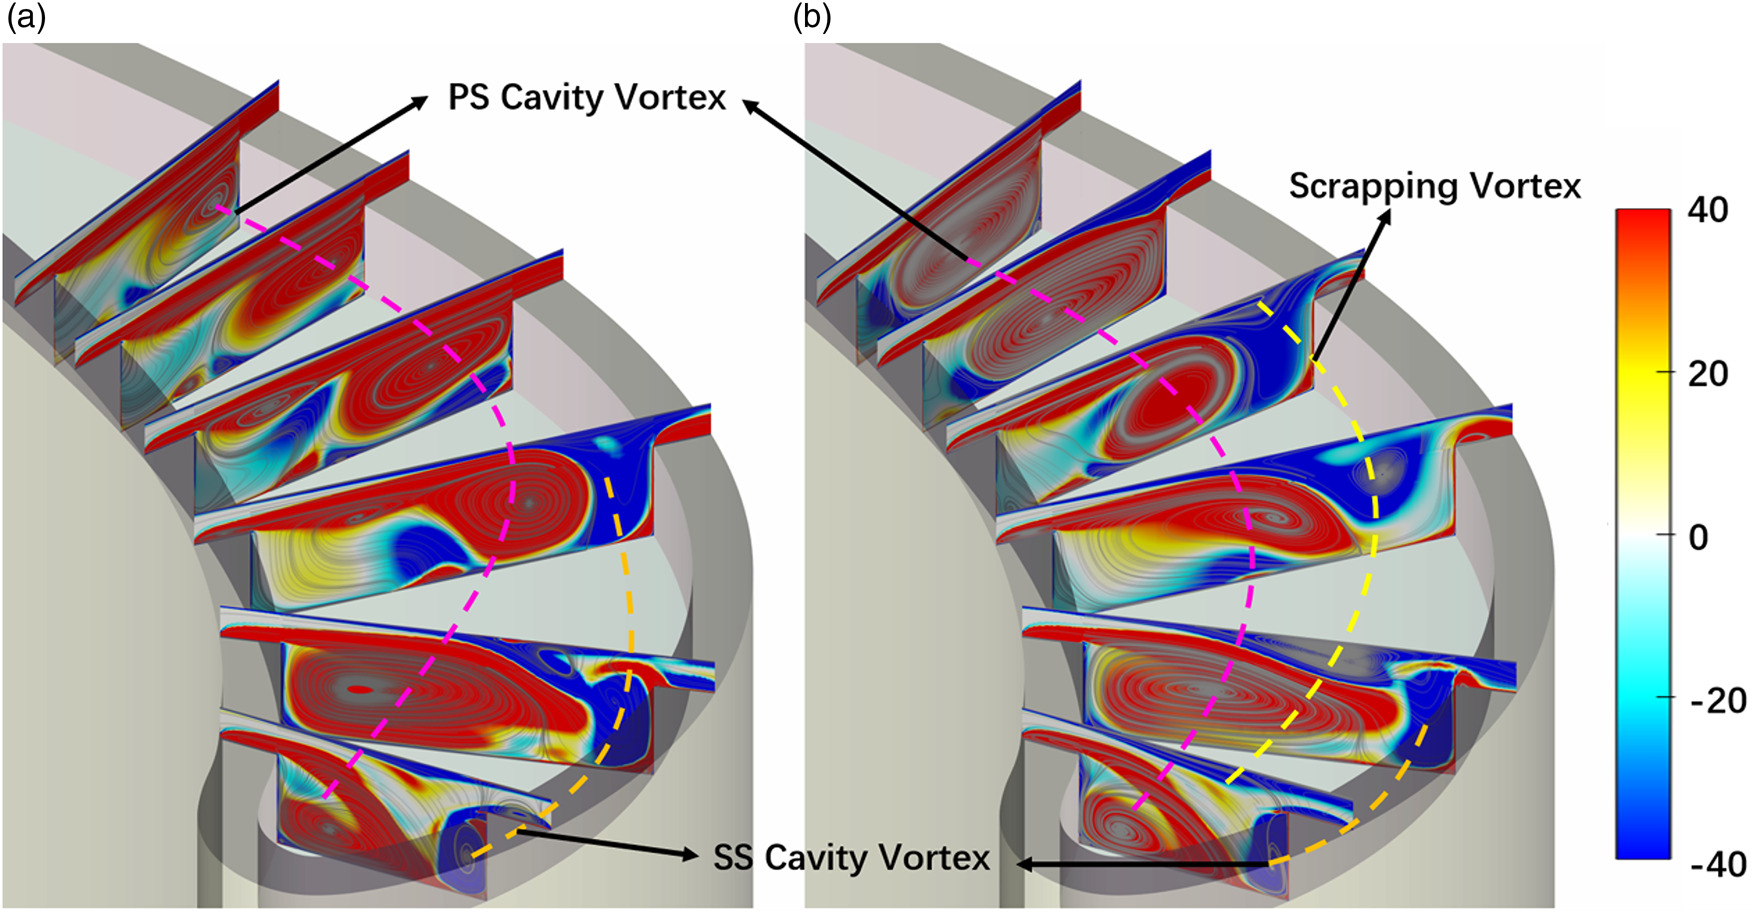
For the rotating condition, a “scrapping vortex” is introduced by the relative casing motion. Near the tip frontal region, the OTL flow has a relatively lower momentum and is subject to separation by the shear force between the leakage flow and the casing. The scrapping vortex is formed due to this separation. It has a counter rotational direction with PS cavity vortex, as shown in Figure 9. These two vortexes counteract with each other when they develop along the streamwise direction. The scrapping vortex also interacts with the SS cavity vortex and push it out of the cavity. On the third cut plane shown in Figure 9, the scrapping vortex nearly dominate one third of the cut plane. The development of both PS cavity vortex and SS cavity vortex are suppressed.
Figure 10 demonstrates the 3D streamlines for these vortices. The streamlines colored in red indicate PS cavity vortex, the yellow lines indicate SS cavity vortex and the blue lines indicate scrapping vortex. Without the influence of scrapping vortex, the PS cavity vortex has enough developing space and eventually touch the suction side rim side wall. For the rotating case, the scrapping vortex pushes the SS cavity vortex out of the cavity, and squeezes the PS cavity vortex towards the PS side rim.
The vortical flow physics revealed in Figures 9 and 10 can help to explain the different HTC distribution pattern observed in experiments. The scrapping vortex is initiated at locations where the OTL flow has low momentum. It further reduces the amount of leakage flow, leading to lower HTC region between hot spots “A” and “B” on the cavity floor. For the stationary case, the heat load of hot spot “B” is dominated by PS cavity vortex. However for the rotating case, it is the combined effect of both PS cavity vortex and scrapping vortex. Part of fluid from scrapping vortex is deflected by PS cavity vortex and leads to the disconnection between hot spots “B” and “C”. With the change of local pressure gradient, and further interactions between PS cavity vortex and scrapping vortex, the strength of scrapping vortex greatly reduces along the axial direction. The local heat load at hot spot “C” becomes to be dominated again by the PS cavity vortex. The scrapping vortex nearly disappears around the location of the fourth cut plane.
Figure 11 illustrates the Mach number contours of OTL flow on a curved cut plane over the suction side rim. The location of the contour is indicated on the right in blue. It illustrates the OTL flow pattern when it exits from the tip gap region. It can be observed that a small supersonic flow region occurs, labelled by a sonic speed line shown in Figure 11.
Figure 11.
Mach number contour over the tip suction side rim with and without relative casing motion.
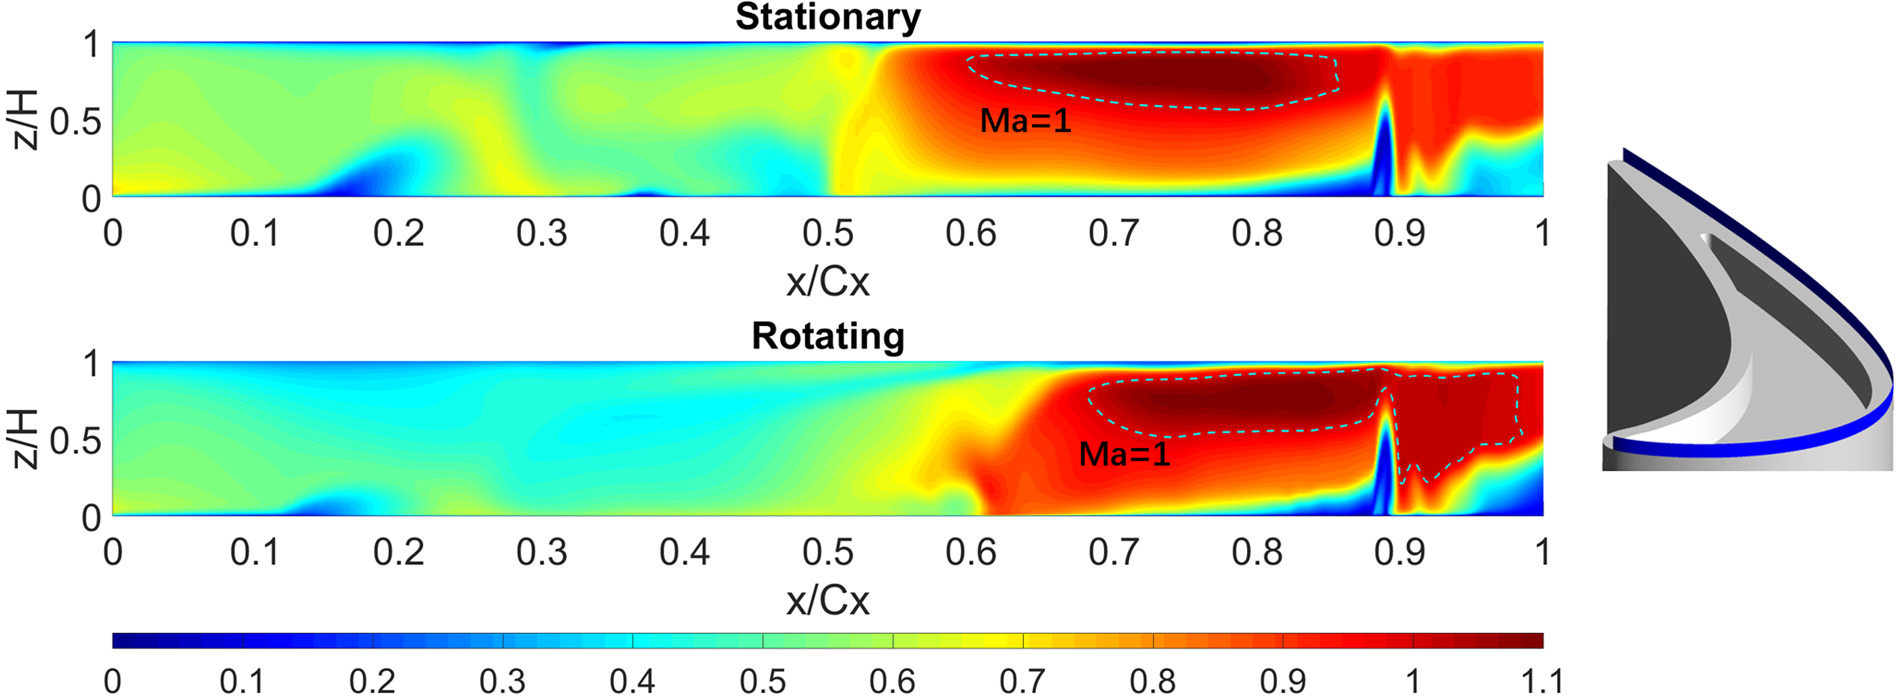
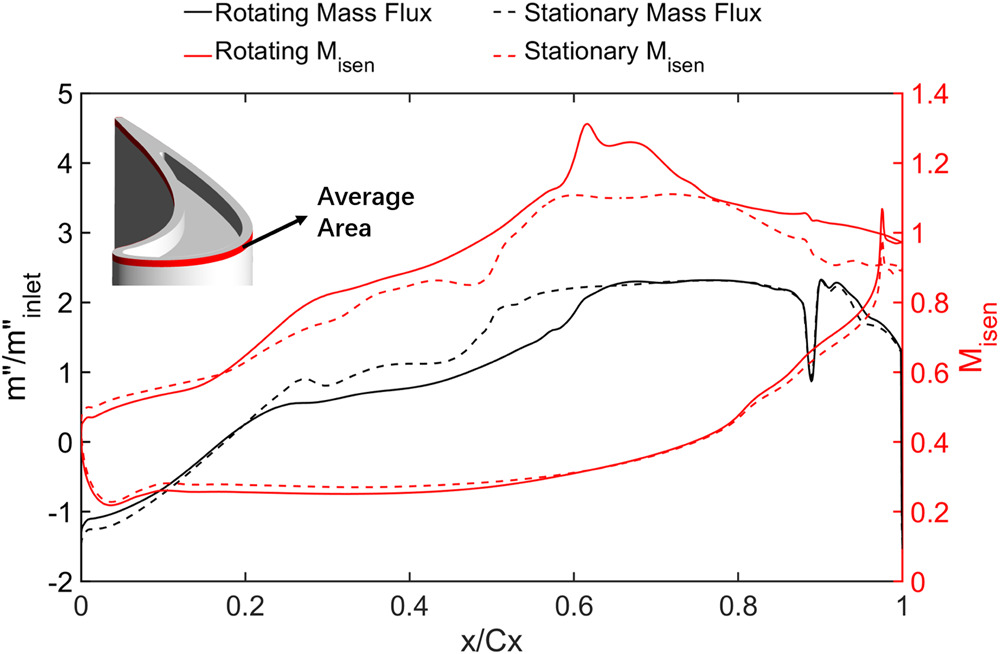
Figure 12 presents the span-wise averaged OTL mass flux distribution and an averaged isentropic Mach number distribution over the blade near-tip surface. The average mass flux is nondimensionalized by the average inlet mass flux. At 0.3–0.6 axial chord, the leakage flow rate is significantly reduced by the relative casing motion. Both the stationary and rotational cases show a chocking region near the latter part the labelled blade tip. The averaged isentropic Mach number was calculated by averaging the surface pressure data over a band of 1% span on the blade near-tip surface. The near-tip surface isentropic Mach number shown in Figure 12 demonstrates a major reduction of local loading between 0.2 and 0.6 axial chord length.
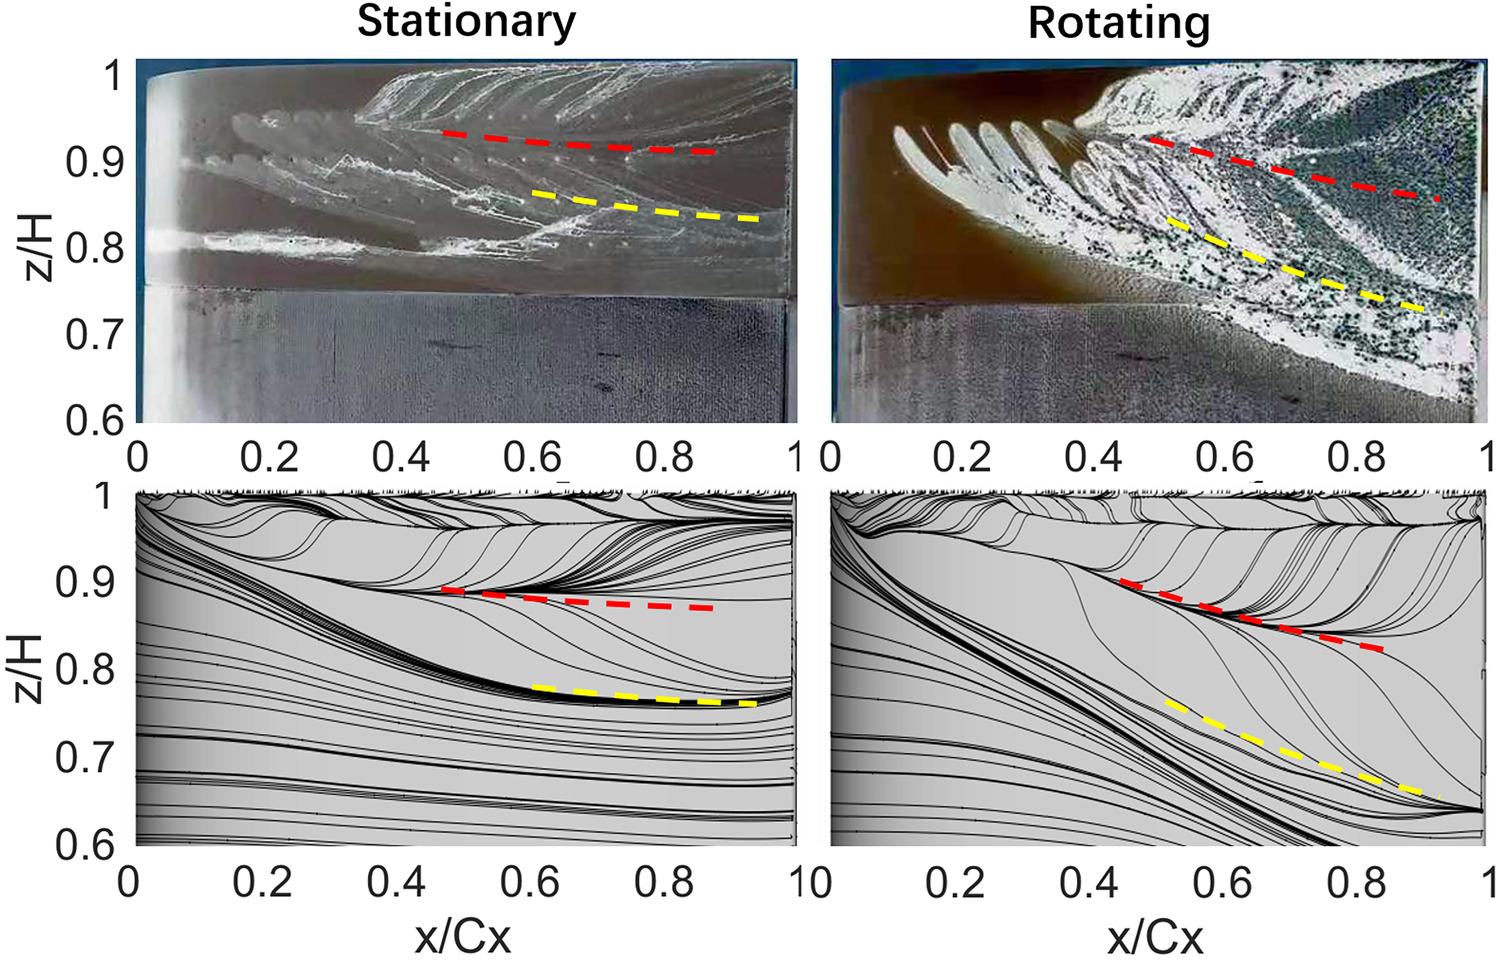
The limiting streamlines on the suction side blade surface are presented in Figure 13. The corresponding ink trace experimental results are also presented. The separation lines which are indicated by yellow dash line show same pattern in experimental and CFD case. The relative motion will push this separation line downward. The trace of the vortexes can roughly show the location of reattachment regions, which are indicated by red dash lines. Compare to the stationary case, the trace of reattachment region is slightly lower with the relative casing motion. But this reattachment regions are not as clear in the experimental cases mainly due to the resolution of the oil flow traces.
The HTC distributions on blade suction side surface are also presented in Figure 14. The high HTC region moves downward in rotating case. The reattachment region should have the highest HTC values, which is confirmed in Figure 14. The different of limiting streamlines and HTC on suction side reveal the significant influence of the relative casing motion.
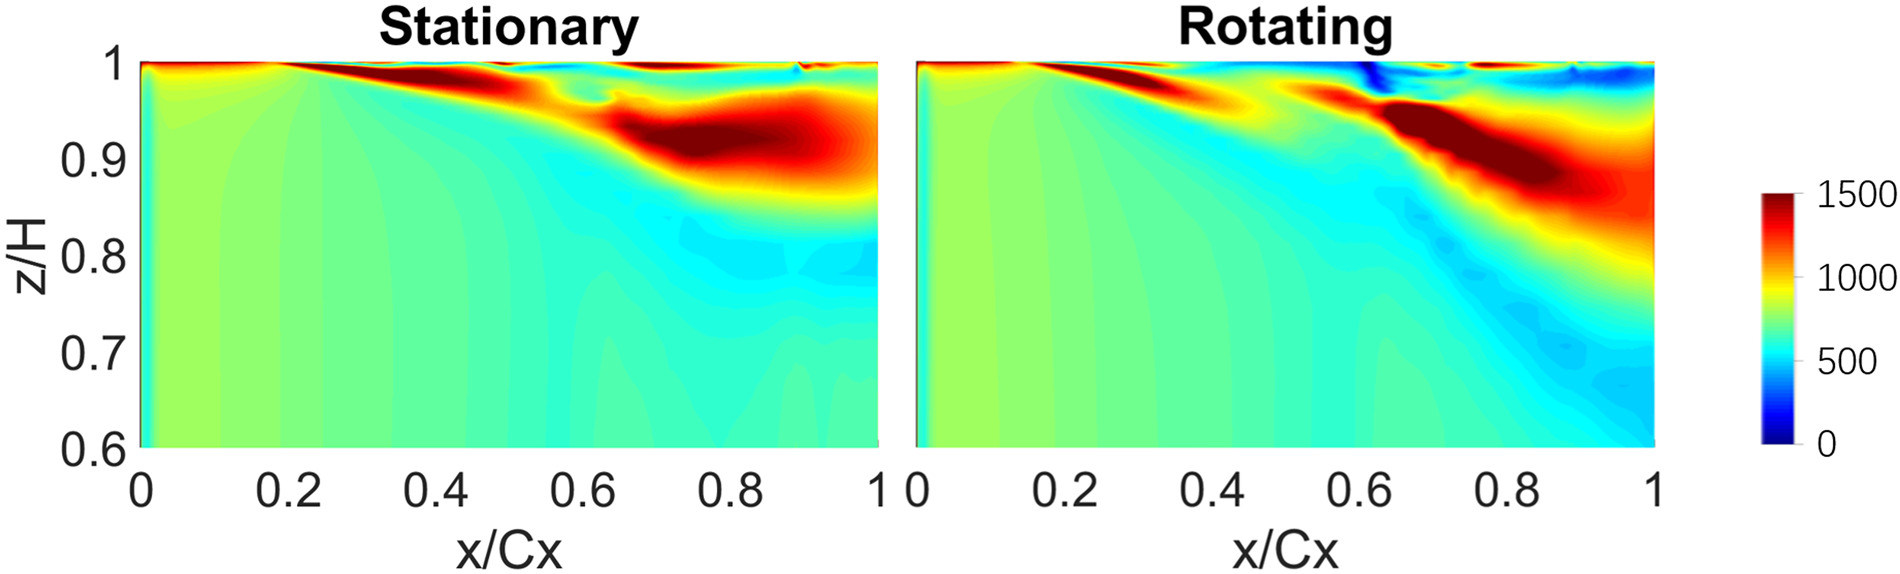
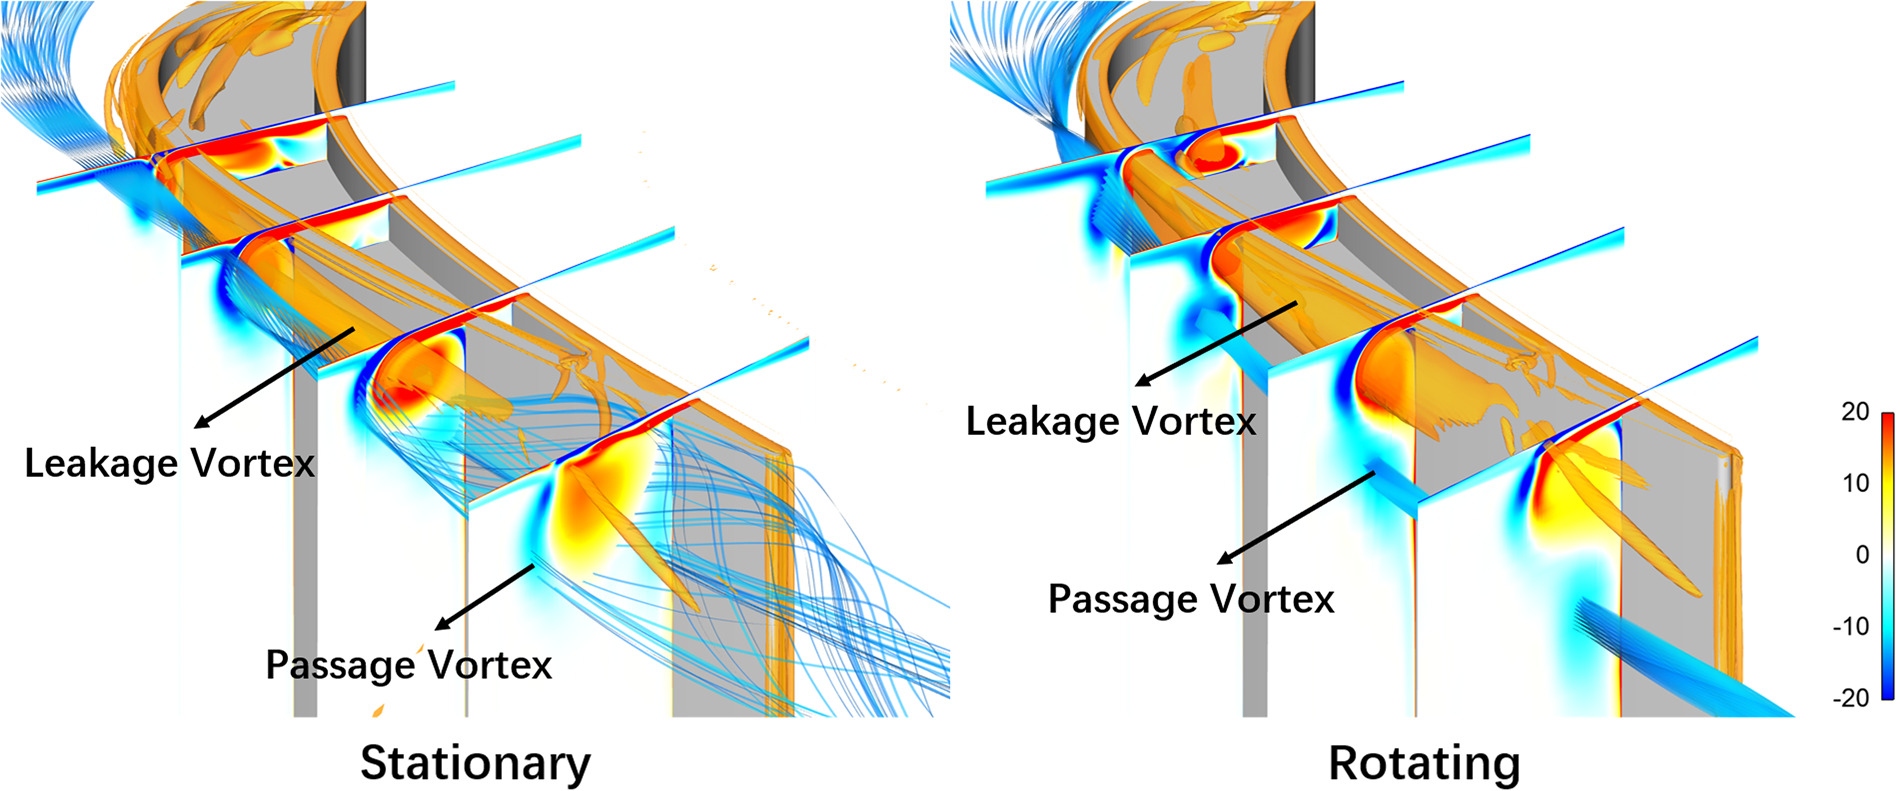
Figure 15 shows the passage vortex and OTL vortex near the blade suction side. The vortical flow structure of the OTL flow is illustrated by the iso-surface of Q-criteria. Normalized vorticity distributions are shown on a few cut planes. For the rotating case, the OTL vortex moves closer to the suction side surface due to a stronger passage vortex and early interactions between the passage vortex and the OTL flow.
Conclusions
By using a novel high-speed disk rotor rig, detailed heat transfer coefficient distributions over a HPT squealer tip was measured by transient Infrared thermography technique. The effect of high speed relative casing motion was experimentally evaluated and further studied by closely coupled CFD analysis.
Significant influence of the relative motion on the tip heat transfer was observed, especially on the first half of the squealer cavity floor. For the rotating case, an additional hot spot was discovered consecutive to the high HTC region near the leading edge with a clear intermittent in between. The tip high HTC region moves towards the pressure side rim and the trailing edge. Numerical analysis reveals the development of scrapping vortex due to relative casing motion. The interaction between scrapping vortex and PS cavity vortex leads to the distinct discontinuities in HTC distribution.
The heat transfer and flow behaviors near the tip blade suction side surface are also markedly influenced by relative casing motion. The oil film experiment results show the reattachment region of leakage vortex is pushed downwards by casing motion. Similar trend was observed from the CFD analysis. For rotating case, the leakage vortex is weakened due to interactions with the stronger passage vortex.
Based on the evidence presented in this paper, it can be expected that the relative casing motion will also have significant effect on tip cooling performance. It would be debatable whether or not tip cooling design strategy validated with stationary experimental rig can still be applied in real rotating turbines.