Introduction

The increasing global energy demand and the push for sustainable energy sources present significant challenges across the energy sector. Renewable energy options like solar and wind power are gaining traction, displacing conventional power generation equipment like coal-fired plants. Yet, their inherent volatility calls for flexible power generation technologies for compensation. Gas turbines (GT) and gas-based reciprocating internal combustion engines (RICE) show promise due to their efficiency and flexibility. The cumulative installed electrical power of single-cycle (SC) and combined-cycle (CC) gas turbine power plants in Germany is projected to reach 148–210 GWel in 2050. At the same time, full-load hours of GT plants are expected to decrease due to the shift towards peaking. (Sterchele et al., 2021) Gas engines are currently one of the most common technologies for district heating or industrial applications due to their flexibility, efficiency and longevity (Andrey, 2020). The installed capacity of RICE is projected to increase by 2030, e.g., by a factor of 2 in a high renewables scenario for North-West-European countries compared to 2020 (de Buck et al., 2014) and by a factor of 5 for the UK compared to 2022 (Chadwick, 2022).

The increasing number of start-ups and operation in part-load affect the emission footprint of gas-based power plants, resulting in increased formation of emissions associated with incomplete combustion (e.g., CH4, CO, CH2O) and other local pollutants (e.g.,NOx). This requires the use of exhaust aftertreatment (EAT) technologies such as oxidation catalysts (OC) and selective catalytic reduction (SCR) catalysts. The state-of-the-art is to use medium-temperature SCR in CC-GT, specifically in the heat recovery steam generator (Stephenson, 2017). To overcome low conversion rates and serious ammonia slip that may occur due to the limitation of installation space, however, high-temperature SCR is expected to be the viable solution for SC-GT (Stephenson, 2017; Sheng et al., 2022). Various studies are currently focusing on associated problems such as very high temperatures and occasional ultra-high temperature shocks during start-up, shutdown or load cycling (Sheng et al., 2022). Exhaust gas oxidation catalysts for SC- and CC-GT power plants (e.g., BASF Camet) are commercially available (Hizny et al., 2022). RICE with comparable power are commonly equipped with Cu-zeolite, Fe-zeolite or vanadium catalysts for NOx reduction with ammonia (NH3) (Haga, 2011). The choice of material affects NOx conversion rates, NH3 storage capacities and the formation of secondary emissions such as nitrous oxide (N2O). Current research projects are targeting methane conversion rates of up to 70% by developing and integrating pre-turbo OC (Søholt, 2023).

This study aims to comprehensively analyse the environmental impact of GT and RICE in the future energy system. It considers various operational scenarios for plants with an electrical power output of 57MWel. Load-dependent emissions are calculated based on available performance and emission data for both technologies, including measurement data and models of emission reduction technologies like OC and SCR based on existing literature. Emissions are cumulated using a standardised metric (grams of emitted species per kilowatt-hour of electricity produced) and compared across different operation scenarios and technologies. The final section examines the environmental impact of the gas-based power generation technologies, emphasising how technology choice and operational scenarios affect overall emission footprint.

Modeling approach

The subsequent sections elucidate the methodology employed to simulate the emission generation during plant operation. Publicly accessible data are gathered to represent the operational characteristics of state-of-the-art GT and RICE, facilitating the derivation of emission generation upon varying loads. This approach draws upon a spectrum of data sources including field measurements, testbed information, and manufacturer publications. In addition, the modelling approach for OC and SCR and the derivation of sophisticated load profiles for future scenarios are presented. All these models are ultimately taken into account in the derivation of the environmental impact factors used to study the ecological footprint of the power plants.

Gas-based power generation technologies

The GT assessment integrates two validated modeling frameworks: a chemical reactor network and a gas turbine performance model. In this study, these models have been tailored to represent a state-of-the-art 57MWel industrial SC-GT, specifically the Siemens Energy SGT-800. Detailed insights into the methods used, and the validation can be found in Goßrau et al. (2023). The RICE assessment is based on publicly available data from comparable engines with speeds <1,200 rpm and bore diameters ≥200 mm, as presented in (Sieker et al., 2022). State-of-the-art medium-speed engines, typically equipped with exhaust gas turbochargers, are used to realise the nominal output of 9.5MWel per engine. Measurements were taken at the turbocharger inlet, so the exhaust temperature must be corrected for the corresponding temperature reduction for the EAT performance estimate. Polytropic expansion has been assumed using a constant efficiency of 80% over the entire load range. This serves as a conservative estimate of the turbocharger outlet temperature. To achieve a comparable overall power output as the GT, six engines are used for power generation. By operating only one engine at a time at partial load, this approach enables a high average efficiency, particularly in the partial load range of the power plant.

Emission aftertreatment technologies

Raw emissions comprise CO2, CO, CH4, CH2O, PM and NOx for both technologies. The EAT strategy selected in this study consists of a combination of an OC and a SCR catalyst. In suitable operating conditions, the OC enables the oxidative conversion of carbon monoxide (CO) (1) due to incomplete combustion, unburned methane (CH4) (2), and formaldehyde (CH2O) (3) due to partial oxidation of CH4.

(1)
2CO+O22CO2
(2)
CH4+2O2CO2+2H2O
(3)
CH2O+O2CO2+H2O

In the SCR process, nitrogen oxides (NO, NO2) are selectively converted to nitrogen (N2) and water (H2O) on a catalytic converter. Ammonia (NH3) is often used as a reducing agent, which reacts in several ways: the “standard SCR” reaction with NO (4), the “fast SCR” reaction with both NO and NO2 (5), and the reaction with NO2 alone (6).

(4)
4NH3+4NO+O24N2+6H2O
(5)
2NH3+NO+NO22N2+3H2O
(6)
8NH3+6NO27N2+12H2O

The conversion of NOx is strongly dependent on share of NO2. The molar ratio of two species is calculated as the ratio of the two molar fractions, defined as:

(7)
ri/j=xixj

Since reaction (5) is the fastest, most of the NOx conversion will occur via this reaction until either NO or NO2 is completely reduced. As a result, the best conversion efficiency is found for stoichiometric parity of both species. For rNO2/NOx<0.5, i.e., more NO in the exhaust gas, the remaining NOx conversion takes place via (4). For rNO2/NOx>0.5, i.e., NO2 excess, the remaining NOx conversion takes place via (6). As reaction (6) is comparatively slow, the conversion of NOx with high proportions of NO2 is significantly hindered, especially at low temperatures.

The main influencing parameters for the OC are the exhaust gas temperature T and the residence time t. For the SCR, the exhaust gas temperature T, residence time t,
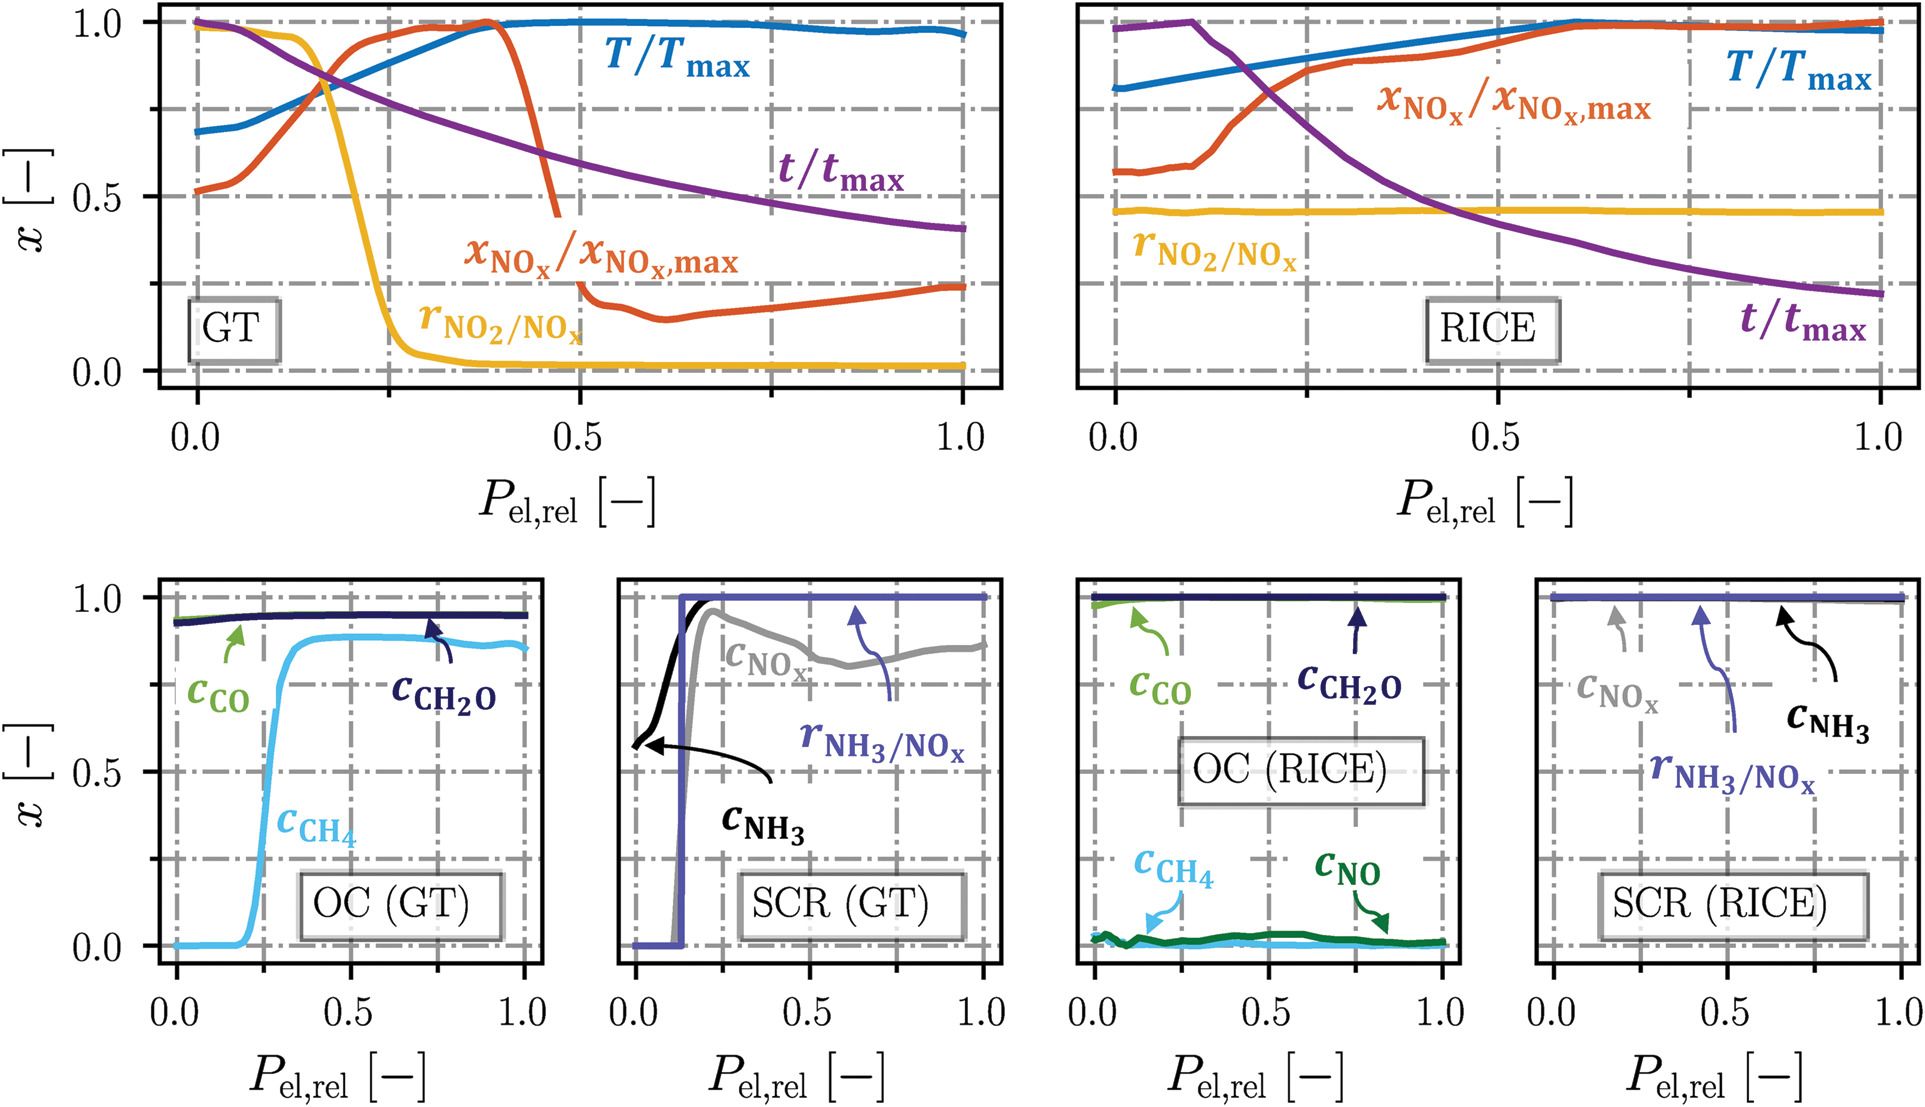
 NOx concentration and the ratio of NO2 to NOx (rNO2/NOx) are decisive for the conversion efficiency. The respective values at the outlet of GT and RICE, respectively the turbocharger, are shown in Figure 1. The exhaust gas of both technologies differs in various ways, with the major difference in the exhaust gas temperature. While the GT temperature ranges between 587–857 K, the exhaust temperature after the turbocharger of the RICE is between 493–593 K. This necessitates the application of low-temperature and high-temperature EAT systems for RICE and GT. Due to the decrease of density and mass flow with reduced load, the residence time increases by a factor of about 4.5 and 2.5 for RICE and GT. For the GT, the NOx emissions first decrease from 152 mg/kWhel, then increase by a factor of about 2.4 and than decreases again for loads below 25%. The difference in NOx emission behaviour is mainly due to the switch of combustion mode (see Emission Behaviour). For the RICE, NOx emissions decrease due to the reduction in flame temperature. For RICE, the fraction of NO2 of the total NOx remains almost constant at about 46% due to the hindered NO oxidation at the present low temperatures. The GT exhaust gas, however, shows a transition from high NO to high NO2 shares at 10–30% relative load.

Figure 1.

Exhaust gas characteristics and conversion behaviour in OC and SCR over variable power for GT and RICE.

https://journal.gpps.global/f/fulltexts/202258/JGPPS-00251-2024-01.01_min.jpg

The reference OC for RICE consists of a cordierite ceramic substrate with 400 channels per square inch. The support material is coated with a washcoat comprising 5wt% palladium on aluminum oxide Pd/Al2O3. Similar washcoats have demonstrated their effectiveness in the oxidation of exhaust gases from power plants for an extended period of time (Liu et al., 2013; Ottinger et al., 2015; Hizny et al., 2022). The catalytic oxidation of CH2O on platinum group metal (PGM) catalysts is the most efficient method for removing formaldehyde (Park et al., 2012). The oxidation is efficient already at room temperature (Park et al., 2012), so that the emission of CH2O occur only with aged OCs or at very low concentrations where the mass transport-limited process of CH2O oxidation does not proceed adequately (Torkashvand et al., 2019b, 2019c; Lott and Deutschmann, 2021; Schönberger Alvarez et al., 2023). Under the conditions considered in this study, in particular the low gas hourly space velocity (GHSV) that can be realised in steady-state operation, a complete conversion of CH2O can be assumed as a good approximation. The experimental data of a series catalytic converter system with a Cu-CHA zeolite coating from a mobile application was used for the design of the NOx reduction. Further information on the SCR catalytic converter is published in Schoenberger et al. (Schönberger Alvarez et al., 2023). The operation of both SCRs for GT and RICE is modelled as stationary. The injected NH3 is either used for NOx reduction, oxidised or emitted as ammonia slip at the SCR outlet. Loading and unloading of the NH3 storage of the SCR during transient load changes is assumed to be covered by an appropriate control strategy and is therefore not considered in detail in this study.

For the GT, available performance data as a function of exhaust gas temperature of a representative GT oxidation catalyst (BASF, 2019) has been used and the relative trend of the CO conversion curve was extracted. The relative conversion has been assumed to be comparable for all considered carbon based emissions. The actual conversion curves have been achieved to meet 50% conversion at the light-off temperatures for CO (Jung and Becker, 1987), CH4 (BASF, 2019) and CH2O (BASF, 2019). For the application in a GT, temperature-dependent NOx and NH3 conversion data were derived from a SCR coated with Ce-Zr/X-ZSM-5 containing 0.2wt% iron, investigated in a temperature range of 400–875 K (Salazar et al., 2016). The dependence of nitrogen oxide conversion on inlet NOx concentration is derived from a cerium mixed washcoat catalyst with a cerium loading of 19g/L, operating from 573–953 K (Malyala et al., 2014). The dependence of NOx conversion on rNO2/NOx and on the residence time is less related to the coating material. In the absence of suitable measurements for the selected high-temperature SCR, model data for a medium-temperature Cu catalyst (475–725 K) using the Langmuire-Hinshelwood mechanism (Ligang et al., 2019) were taken and re-designated for the purposes of the study.

A map-based simulation approach is used to implement the OC and SCR catalyst, incorporating light-off curves with a variety of typical space velocities and inlet concentrations. This approach represents a good compromise of simulation accuracy and computational speed over a 1D or 2D kinetic simulation model. In general, conversion is described by the difference in the molar fractions between the inlet and the outlet of the catalyst, relative to the inlet concentration, defined as:

(8)
ci=xi,inxi,outxi,in

The OC catalyst for the GT is characterised by high conversion rates over the entire load for CO (>93%) and CH2O (>92%), as the exhaust gas temperature of the GT (>573 K) is well above the light-off temperatures of CO at 423K (Jung and Becker, 1987) and CH2O at 422K (BASF, 2019). For CH4, however, the light-off temperature at which 50% conversion is present is about 767K (BASF, 2019). As the exhaust temperature of the GT is above this temperature for Pel,rel>25%, high conversion rates (80–88%) are evident in most operating conditions. At lower loads, conversion is severely inhibited, resulting in little to no conversion at idle. The SCR temperature for maximum NOx conversion is at 750K, corresponding to the exhaust gas state at Pel,rel=25%. At higher loads, NH3 is completely consumed, either by oxidation or in NOx reduction. At lower loads, i.e., lower temperatures, NH3 slip is present due to its reduced consumption via both paths. NOx conversion is high for GT operation above 20% relative load. While the increasing relative residence time consistently enhances conversion as load decreases, the effect of the other dependencies is more variable. Down to 60%, the decrease in NOx and the increase in temperature lower the conversion rate. With both NOx generally increasing and T decreasing towards 20% load, the conversion rate increases. In addition, the increasing ratio of NO2 to NOx further improves the NOx conversion with rNO2/NOx=0.5 at 20% load. However, at lower loads, temperature decreases significantly and NO2 becomes the major contributor to NOx, significantly hindering the NOx conversion. Below 10% load, NOx conversion is suppressed. While the molar ratio of NH3 to NOx (rNH3/NOx) is unity for loads above 10%, it is set to zero below this threshold to prevent high ammonia slip.

The OC of the RICE is characterised by very high conversion rates over the entire load for CO (>98%) and CH2O (100%), as the exhaust temperature of the RICE turbocharger (493–610 K) is well above the light-off temperatures of both species. However, as the light-off temperature of CH4 and the oxidation temperature of NO is above the exhaust temperature throughout the load range, there is insignificant CH4 and NO oxidation, so the conversion efficiencies for both are close to zero. Due to the narrow temperature range at the turbocharger outlet (493–610 K), the SCR is well chosen to be effective over the entire load range. As the conversion rates of NOx and NH3 are very high (>98%), a stoichiometric admixture of NH3 to NOx (rNH3/NOx=1) is applied for all load conditions. Due to the simplified approach, the NH3 storage capacity is not considered further. Thus, NH3, which is not used for NOx reduction due to the conversion efficiency of the SCR catalyst, is regarded as ammonia slip.

Load profiles

In order to assess the emissions of gas-based power generation technologies in future scenarios, four representative one-day load profiles were constructed as shown in Figure 2. The first distinction is made between a single-peaker scenario (OS1|2) and a double-peaker scenario (OS3|4) with one or two ramp-ups and ramp-downs per day. The single-peaker scenario represents operation to meet daytime heat and electricity demand during a general shortage of renewable sources. The double-peaker scenario represents operation to meet heat and electricity demand in the morning and evening, with all demand around midday being met by renewable sources. The second distinction is made for the baseload of the load demand. With baseload at 0% (OS1|3), the gas-based power plant is either shut down or running at full-load, which is equivalent to daytime operation for general heat and power supply only. With baseload at 30% (OS2|4), heat and electricity supply, e.g., for the industrial sector, is also considered during the night. Setting the baseload at 30% relative load is considered to be a conservative estimate for the lowest possible operation, as power plants, especially SC-GTs, are not operated below this margin to avoid excessive emissions in part-load operation.

Figure 2.

Load profiles for different one-day operation scenarios (OS1: single-peaker (0% baseload), OS2: single-peaker (30% baseload), OS3: double-peaker (0% baseload), OS4: double-peaker (30% baseload)).

https://journal.gpps.global/f/fulltexts/202258/JGPPS-00251-2024-01.02_min.jpg

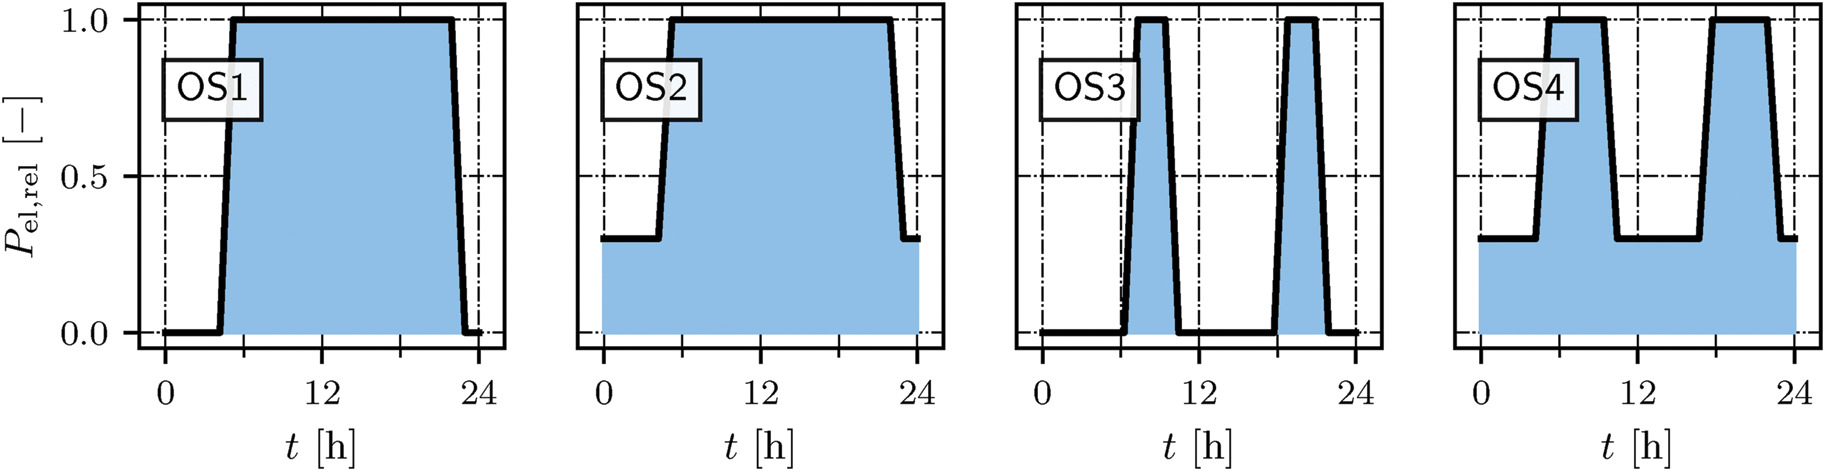
For the GT, the load profiles were adjusted to match the power output of approximately 57MWel. For RICE, the load profile was scaled using six engines with a nominal power of 9.5MWel, to avoid exhaustive operation at part-load. To take into account the required fast response capabilities of gas-based power plants in a future volatile energy system, the hourly discretised load profiles in Figure 2 have been further modified to match the respective load gradients. As gas engines exceed the transient capabilities of conventional gas turbines, a higher relative load gradient is applied for RICE with 50%/min (Santoiannian, 2015) compared to GT with 17.2%/min (Lörstad et al., 2013).

Emission footprint

The emission calculation tool used in the present study is an extension of the tool presented by the authors in (Sieker et al., 2022). RICE and GT emission assessments are based on part-load dependent curves for the electrical efficiency and the emission species under consideration. For a given time-resolved load profile, the emissions are evaluated assuming a steady-state operation for a one-minute period. Thereby, the time-resolved emission mass flows are calculated. Exhaust gas aftertreatment systems are also taken into account for the reduction of the emission species CO, CH4 and CH2O via an OC or NOx via a SCR catalyst. A performance-based metric, i.e., g/kWhel is used to better compare the results, which refers the emitted mass of emissions to the electrical output in accordance with (Sieker et al., 2022).

This metric accounts for the mass-based emission release, essential for environmental impact considerations. However, there is no uniform metric for determining the environmental footprint as a single score. Instead, relevant literature suggests various damage pathways and impact categories with strongly varying confidence levels, for example, the JRC (Joint Research Centre) recommendations of the European Commission on life cycle impact assessments (Fazio et al., 2018). Furthermore, even for a specific environmental damage pathway, the proposed metrics and their characterisation factors vary greatly. Therefore, this study's parameters are mainly based on the JRC-recommended impact categories and characterisation factors. The impact categories considered, and the corresponding units are:

  • Global Warming Potential (GWP100) in kg CO2-equivalents

  • Respiratory Inorganics (RI) in disease incidence

  • Photochemical Ozone Formation (POF) in kg NMVOC-equivalents (non-methane volatile organic compounds)

  • Human Toxicity Potential (HTP) in kg toluene-equivalents

The commonly used GWP100 is presented to quantify the impact on climate change of the results. In addition, the HTP as well as the impact on RI and on the POF are analysed to consider the local impact of pollutants. The corresponding characterisation factors of the emission species are shown in Table 1.

Table 1.

Characterisation factors for the environmental impact categories per kg of the emission species.

CO2NOxCOCH4PMCH2ONH3Ref.
GWP100129.8Foster and Storelvmo (2021)
RI (106)1.654.921.0Fantke et al. (2016)
POF (102)1004.561.0187.7van Zelm et al. (2008)
HTP4.30.272.9167.5Hertwich et al. (2006)

Results

This section shows the gas-based power generation technologies performance results, the corresponding emission behaviour, and the subsequent emission analysis for the given load profiles. Finally, the environmental impact of the gas-based power generation technologies' raw and stack emissions are analysed.

Emission behaviour

In this study, different emission species are considered to analyse the emission footprint of gas-based power generation technologies. The focus is on carbon-containing species such as CO2 and emission species associated with incomplete combustion. The formation of particulate matter (PM) and NOx is also considered. Assessing emissions in a performance-based metric has been shown to provide a fair and comprehensive assessment of emissions for different fuel types (Douglas et al., 2022; Goßrau et al., 2023). However, using this metric makes it difficult to evaluate emissions at low loads, since emissions approach infinity as the load approaches zero. Consequently, the authors propose a new emission metric suitable for a comprehensive emission assessment along load changes: The emission mass flow is related to the electrical power at full load (i.e., g/h/kWel,fl), defined as follows:

(9)
EIfl=m˙Pel,fl=m˙PelPel,rel=EIPel,rel

The emission profiles over the relative load are shown in Figure 3 for both GT and RICE. The actual emission value, i.e., the mass per electrical work produced (EI: g/kWhel), can be derived by dividing the newly proposed emission value (EIfl: g/h/kWel,fl) by the relative electrical load Pel,rel, shown on the abscissa of Figure 3. In that way, emission formation trends, i.e., increased formation of species associated with incomplete combustion towards lower loads, can still be adequately represented.

Figure 3.

Load dependent emissions referenced to full load power EIfl [g/h/kWel,fl] for GT and RICE without EAT.

https://journal.gpps.global/f/fulltexts/202258/JGPPS-00251-2024-01.03_min.jpg

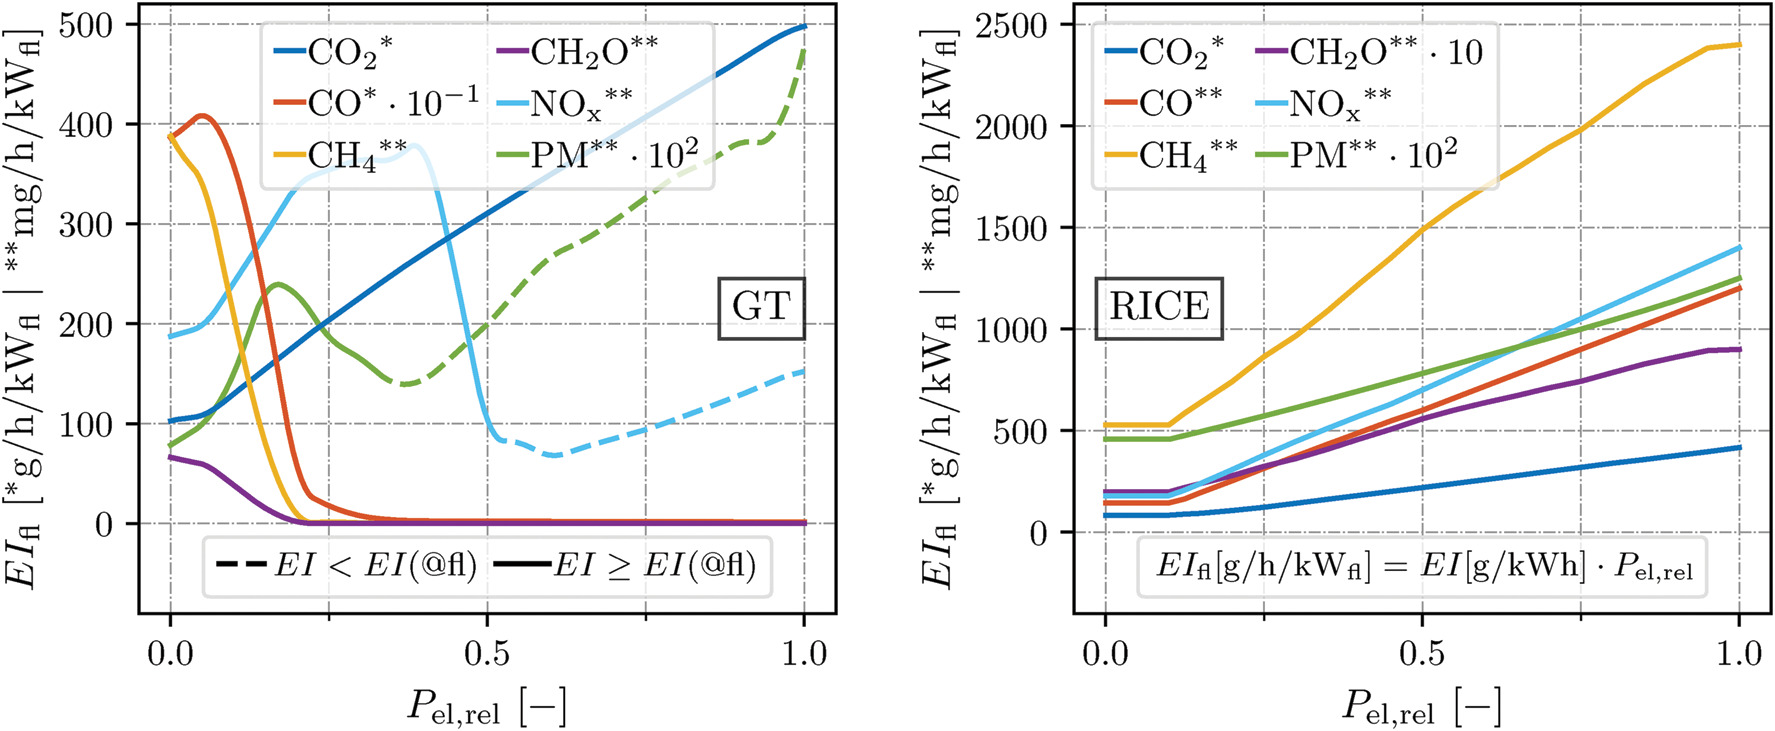
For the GT, combustion system's operation strategy and emission behaviour strongly depend on the relative load, which entails altered mass flows as well as temperature and pressure at the combustor inlet. The distribution of fuel between the main and pilot flame zone is adjusted accordingly to ensure stable combustion. Carbon-containing species are moderately changing for load reduction down to 20% due to the high chemical conversion rate. At lower partial loads, reduced combustion temperatures and thus hindered chemical conversion, especially in the main flame, lead to an enhanced output of unburnt CH4 and intermittent species (i.e., CO and CH2O) (Carlos et al., 2022). Formaldehyde is additionally formed as the fuel breakdown via the CH2 route is impeded, and the conversion via the CH2O route is enhanced (Carlos et al., 2022). However, since the combustion efficiency is still high even at low load, CH4 and CH2O emissions are one to two orders of magnitude lower compared to the CO emissions, which is in line with measured data (Lörstad et al., 2013; Carlos et al., 2022). The change of PM is coupled to the concentration of C2H2, the combustion temperature, pressure and residence time (Brookes and Moss, 1999). For decreasing load, the significant increase of C2H2 and the moderate increase of residence times are compensated by the lowered combustion temperature and pressure. For relative loads down to 50%, a reduction in load entails a reduced combustor inlet temperature and pressure, hence reduced combustion temperature and reduced NOx formation. The amount of bypass air is reduced for lower loads, and significantly more fuel is guided to the pilot flame. Consequently, significant NOx production takes place in the non-premixed pilot flame due to the inherent high temperatures and long residence times. For partial loads below 20%, NOx emission is reduced due to the increased share of air in the pilot flame zone. Consequently, the local equivalence ratio and combustion temperature are reduced.

For the RICE, emissions are directly related to the engine's load point, so operating at low efficiency and with high emissions in part-load. When RICE are operated in lean burn mode due to the increase in thermal efficiency compared to stoichiometric operation, unburned CH4 emissions increase due to the reduction in flame speed (Khan et al., 2015). In addition to CH4 emissions from quenching near the wall, unburned CH4 emissions from the crevice area also occur because of the high surface-to-volume ratio (CIMAC WG 17, 2014). Engines with increasing bore diameters offer the advantage of improved quenching behaviour regarding CH4 emissions by reducing temperature losses in the combustion chamber near the cylinder wall due to the smaller surface-to-volume ratio. Cold zones in the combustion chamber during lean operation lead to increased CH4 emissions at lower engine loads due to bulk quenching (Heywood, 2018). An approach to minimise unburned CH4 emissions is to reduce the air-to-fuel ratio, which increases flame speed (Amirante et al., 2017) and temperature. At the same time, NOx emissions increase due to the Zeldovich reaction pathway, which is sensitive to increasing local temperatures (Heywood, 2018), requiring the appropriate setting of an air-fuel ratio to balance the CH4NOx trade-off. Furthermore, the combustion process forms formaldehyde, which is known to be carcinogenic. CH2O is assumed to be produced by partial oxidation in the quenching zones and in the crevice area (Mitchell and Olsen, 1999) and by partial oxidation in the exhaust gas upstream of the turbocharger (Torkashvand et al., 2019a). The increase in CH2O at low load is partly due to an increase in quenching zones. Due to the low combustion chamber temperature and the resulting low reaction rate, the CO formed during incomplete combustion oxidises at a very slow rate to CO2. Therefore, CO emissions increasingly occur at low loads. Local fuel-rich areas, caused by an insufficient mixture formation, lead to the formation of PM as the fuel cannot be oxidised. However, a significant proportion of the soot formed will be oxidised with sufficient O2 and high combustion chamber temperatures.

Emission analysis

The cumulated emissions for all four system designs (GT and RICE without and with EAT) are shown in Figure 4 for the double-peaker scenario with 0% baseload (OS3). Without EAT application, all emission species except for CO2 are lower for the GT than for the RICE. The higher performance-related CO2 emissions are owing to a lower average efficiency of the GT (39.7%) compared to the RICE (47.4%). Moderate amounts of carbon-based emissions associated with incomplete combustion are found for the GT due to the two starts and stops in OS3, hence increased formation at low load conditions. For the RICE, these emissions are evident throughout the whole operation range, thus overall higher levels of cumulated emissions are present. While NOx formation is evident throughout operation for both technologies, NOx emissions are generally higher for RICE operation due to the higher inhomogeneity of combustion and thus locally higher flame temperatures. Moreover, the higher degree of unmixedness leads to locally richer fuel conditions in the combustion chamber compared to the GT, thus an enhanced PM formation. The formation of NH3 in the combustion system is negligible, so no significant amounts are found for either technology. The application of EAT results in a significant reduction of most emission species for both technologies. While all carbon-based emissions associated with incomplete combustion are significantly reduced for GT operation with EAT, only CO and CH2O are strongly reduced for RICE. As the temperatures in the OC for the RICE application are insufficient for CH4 oxidation, CH4 emissions are not affected. As the oxidation of the carbon-based emission species is comparatively small, there is only a small increase in CO2 emissions (<0.5%). For both system configurations, NOx emissions are significantly reduced, although more for RICE due to the higher conversion rates. PM emissions are not affected by the EAT systems, as particulate filters are not considered in this study. The NH3 slip in the SCR of the RICE is higher by a factor of 17 compared to the GT power plant.

Figure 4.

Cumulated emissions of GT and RICE with and without EAT for OS3 and relative deviations for OS1|2|4.

https://journal.gpps.global/f/fulltexts/202258/JGPPS-00251-2024-01.04_min.jpg

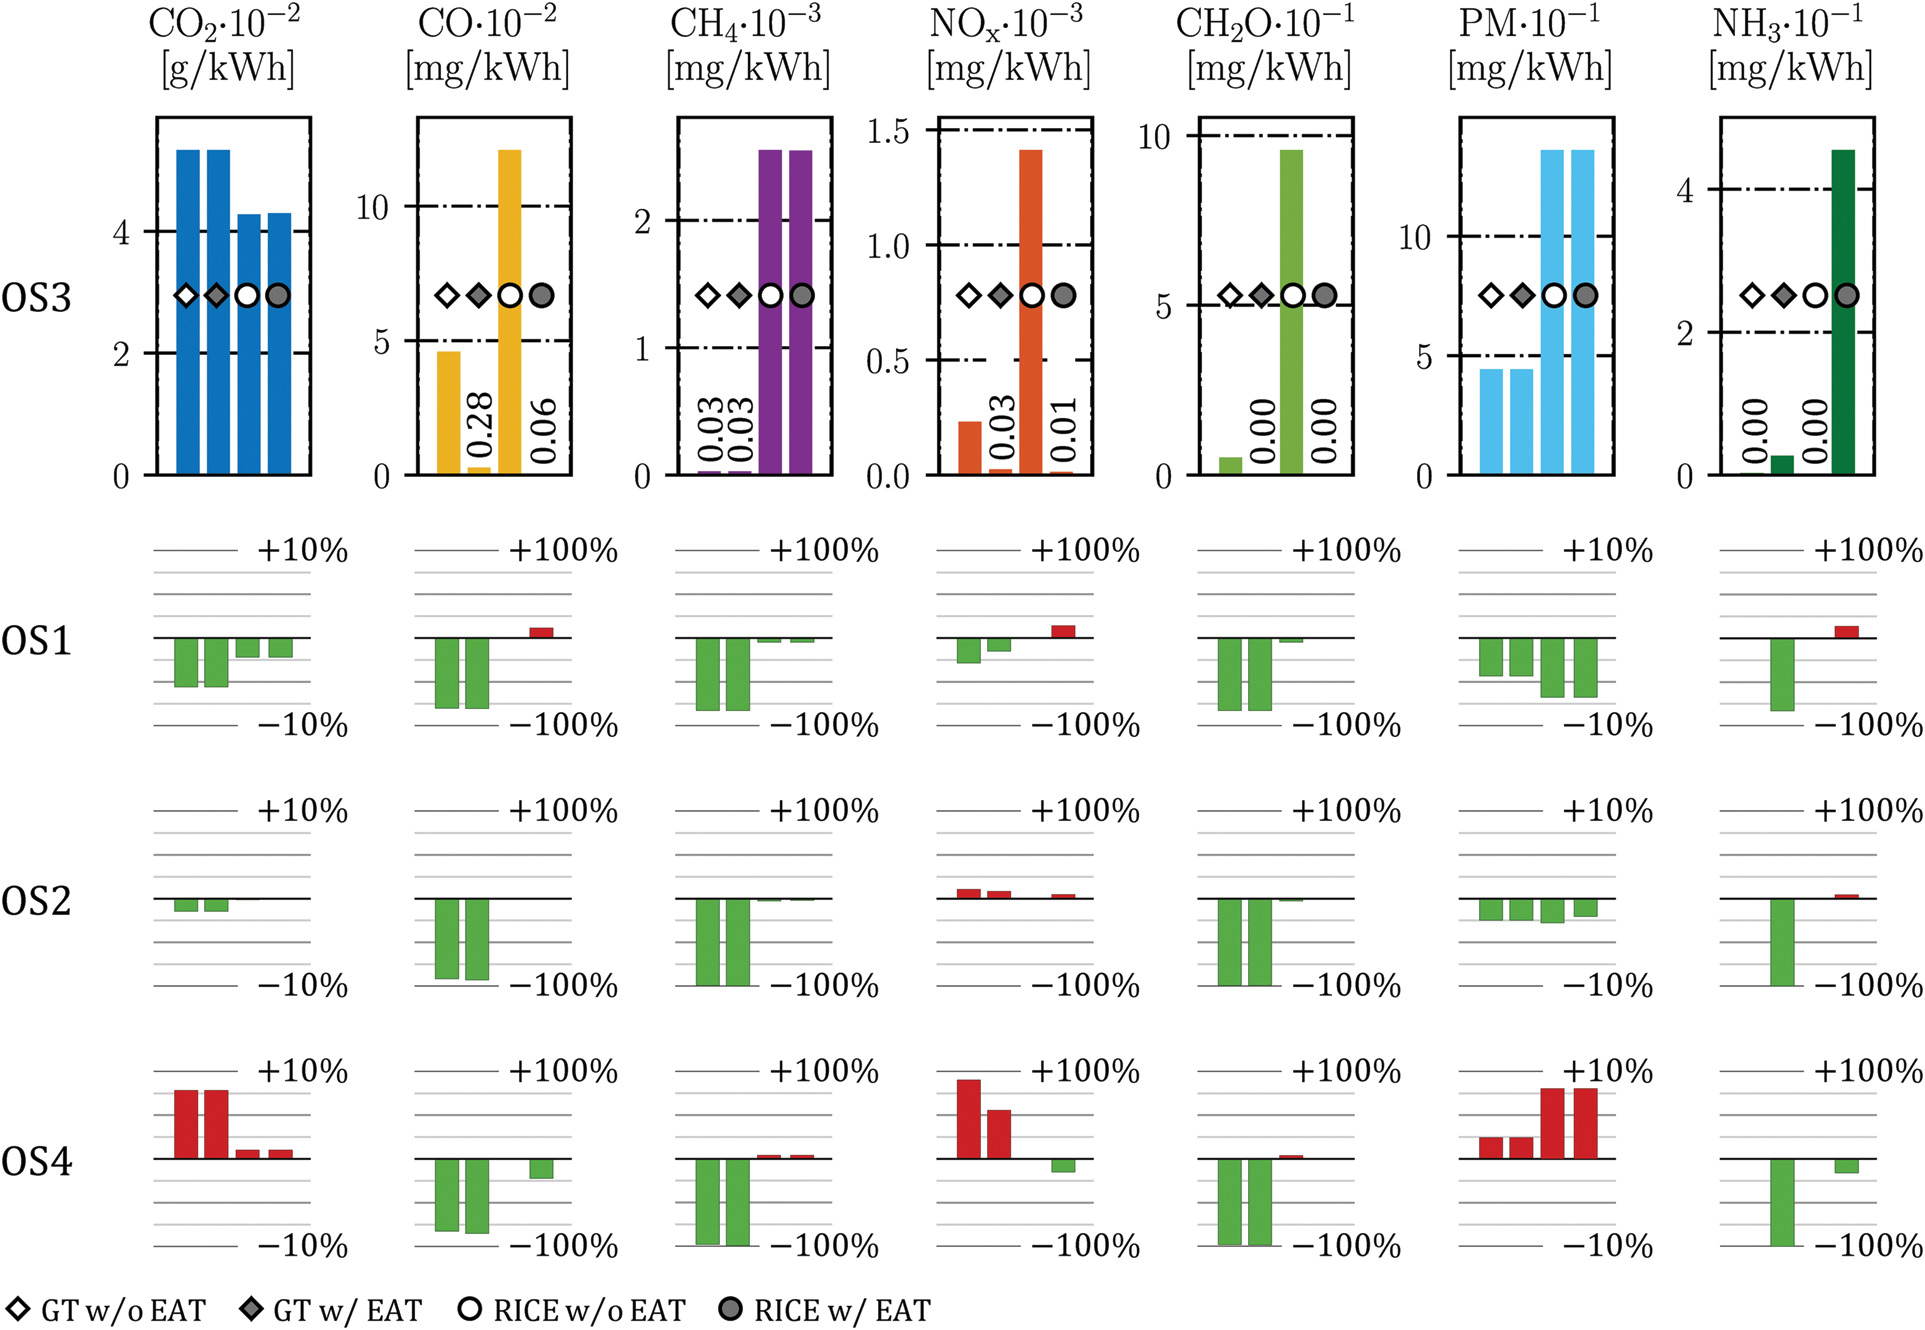
The emission profile of all four power plant configurations (GT and RICE without and with EAT) in the three other load profile scenarios (OS1|2|4) is qualitatively comparable to the results for operation in OS3. The changes in emission species for the other system designs in relation to OS3 are shown in the lower part of Figure 4. In general, emissions from RICE power plant configurations are less affected by varying load conditions due to the more favorable load changes by de-/activating individual engines. As a result, only one engine is running at part-load at any given time, while the other engines are operating at highest efficiency and lowest emissions. Therefore, the changes in emissions of RICE configurations range from 22% to 14% for other load profile scenarios compared to OS3. In contrast, the operation of a single GT is much more sensitive to changes in operating conditions, e.g., low load, starts and stops.

For the single-peaker scenario with 0% baseload (OS1), the proportion of full-load operation increases and the number of starts and stops is halved. As a result of the higher average GT efficiency, CO2 emissions are reduced by 5.6%. Due to the reduced time at very low (<10%) and low (10–50%) load conditions, other carbon-based emissions (e.g., CO, CH4, CH2O) as well as NOx and PM are significantly reduced by up to 83%. By operating less at low load conditions, thus operating the EAT closer to the design point with high NH3 conversion rates (see Figure 1), the NH3 slip is significantly reduced by about 83%. For the double-peaker scenario with 30% baseload (OS4), there is more GT operation at low load conditions (10–50%) with no starts and stops at all. The increased share of operation at 30% load reduces the average efficiency, resulting in an increase in performance-related CO2 emissions of around 7.8%. In addition, NOx and PM emissions are formed to a greater extent at these load conditions, leading to an increase of up to 90% and 2.4%. As the GT is not operated at very low load conditions (<10%), the formation of emissions associated with incomplete combustion is significantly reduced by 83–100%. In addition, by shifting SCR operation closer to the design regime (Pel,rel>25%), i.e., operating at high conversion rates, NH3 slip is completely inhibited. The single-peaker scenario with 30% baseload (OS2) combines the effect of reduced starts and stops, i.e., less operation at very low loads (<10%), with the effect of increased operation at low loads (30%), i.e., lower average efficiency. Due to an average efficiency comparable to OS3, the performance-related emissions of CO2 are nearly unchanged. By compensating for the longer operating time at 30% with a higher share of full-load operation, NOx and PM emissions change only moderately with +10.4% and 2.5%. By not operating at very low loads (<10%), the formation of emissions associated with incomplete combustion is eliminated to a similar extent as for OS4. In addition, by shifting the EAT operation further into the design regime, NH3 slip is completely prevented.

Environmental impact analysis

Based on the cumulated emissions of the species considered, the environmental impact is quantified as a final step of this study. Table 1 shows the characterisation factors for the damage categories used. The results of the environmental impact analysis are shown for the double peaker-scenario with 0% baseload (OS3) with and without EAT for both technologies in the upper part of Figure 5. Moreover, the relative differences of the other scenarios are shown in the lower part of the figure.

Figure 5.

Environmental impact of GT and RICE with and without EAT for OS3 and relative deviations for OS1|2|4.

https://journal.gpps.global/f/fulltexts/202258/JGPPS-00251-2024-01.05_min.jpg

The CH4 emissions contribute only marginally to the CO2-eq emissions of the GT power plant. Even though start-ups and low load operation enhance the total CH4 emissions, its GWP100 contribution is low compared to the CO2 emissions. However, for the RICE power plant, CH4 emissions contribute considerably to the GWP100 (15.1%) for both without and with EAT. In the latter case, CH4 is only marginally reduced in the OC due to insufficient temperatures. The reduced performance-based CO2 emission offsets the additional CH4 contribution for the RICE power plant, resulting in a 6% lower GWP100 compared to the GT power plant. The human health impact of respiratory inorganics (RI) is only assigned to NOx, PM and NH3 emissions (Table 1). For both technologies without EAT, NOx contributes the most to RI (73–74%). With both NOx and PM generated notably higher for RICE compared to GT (Figure 4), the RI is 4.9 times higher for the RICE. By applying EAT systems, NOx emissions are significantly reduced for both technologies, while PM remains unchanged as no particulate filter is considered. Due to the increasing ammonia slip for the RICE, NH3 also contributes moderately to RI with 11.1%. As the PM emissions of the RICE are higher, RI is three times higher than for the GT. The NOx emissions have the highest characterisation factor for POF (Table 1) and occur in much larger quantities than CH2O. Thus, the POF results show that NOx has a prevalent impact in this damage category, with a relative share of more than around 90.0% for GT and RICE without EAT. Since all relevant emission species for POF are formed more at high relative power for RICE operation, the POF of the RICE without EAT is about 6.1 times higher than that of the GT. For the GT with EAT, NOx emissions are significantly reduced, resulting in a decrease in POF of about 90%. For the RICE with EAT, all relevant emission species except CH4 are greatly reduced, resulting in a significant reduction in POF of about 98%. In this case, however, CH4 emissions become more important for the POF (64.3%) due to very high quantities at the stack (Figure 4). Overall, the POF for RICE power plants with EAT application is higher than that of the GT by 47.7%. The emission species NOx, CO, PM, CH2O and NH3 have an impact on HTP (Table 1). Although CH2O is assigned the highest characterisation factor, NOx has the highest impact due to absolute higher emissions for the GT (82.0%) and the RICE (76.2%) without EAT. Due to the overall higher emission formation in the RICE, the HTP is greater by a factor of 6.5 compared to the GT without EAT. Since the main contributing emission species (e.g., NOx, CO, CH2O) are significantly reduced by applying EAT, the HTP can be reduced for both technologies (GT: −89%, RICE: −98%) with an EAT system. Due to the higher conversion rates of the EAT in the RICE power plant application, HTP is reduced to a greater extend than for the GT. As result, the HTP is comparable for the RICE and the GT.

The environmental impact of both power generation technologies in the three other load profile scenario (OS1|2|4) is qualitatively comparable to the results of the double-peaker scenario with 0% baseload (OS3). In general, the environmental impact for RICE power plants is less affected by different load conditions due to the flexible operation of the engines. To meet a fixed demand, only one engine runs at part-load at any time, thus limiting exhaustive part-load operation. As a result, the changes in environmental impact range between −8.7% and +7.7% for RICE with and without EAT in all load scenarios considered. For the GT in the single-peaker scenario with baseload at 0% (OS1), the GWP100 follows the same trend as the CO2 emissions. As CO2 is only slightly affected by oxidation in the OC, the GWP100 decreases by 5.7% due to the increased average efficiency of the GT. With NOx being the main contributor to RI, POF and HTP, the trend of these environmental impacts follows the trend of NOx emissions. Consequently, these impact factors are reduced by 7.4–37.3% for GT operation with and without EAT. For the double-peaker with baseload at 30% (OS4), there is more operation at low loads without starts and stops. As a result, the GWP100 of the GT increases by 7.6% due to the lower average plant efficiency. In addition, the environmental impact factors RI, POF and HTP are all increased for this load profile scenario due to the large contribution of NOx. Although all carbon-containing emission species associated with incomplete combustion are reduced in this scenario, the impact categories are majorly influenced by higher NOx emissions due to its increased formation at low loads. As a result, all environmental impact factors increase by 7.8–72.4% for GT operation with and without EAT. The single-peaker scenario with baseload at 30% (OS2) combines the effect observed for reduced starts and stops with the effect of increased operation at 30% load. As consequence of an average efficiency comparable with OS3, the GWP100 follows the trend of reduced performance-related CO2 emissions with only a minor reduction of 1.6%. For the other environmental impact factors (e.g., RI, POF, HTP), the significant reduction in carbon-based emissions associated with incomplete combustion compensates for the moderate increase in NOx emissions. Consequently, all these environmental impact factors change only moderately from 7.5% to +5.3% for GT operation with and without EAT.

Discussion

Accurate modelling of emissions associated with incomplete combustion as well as local pollutants over the full load range is crucial in determining the environmental impact of a wide range of load profile scenarios. However, detailed performance and emission data for both technologies and their respective EAT systems at different load conditions are rare. Therefore, to validate the numerical results presented, measurement data for all components in various part-load operation points is required, including start-up, shutdown and transient load changes.

The operation of gas-based power generation technologies in future scenarios is difficult to predict as it depends on demand profiles and operator strategy. As a result, future load profiles may be less or more volatile than those considered in this study. In addition, the load profiles studied take into account technology-specific maximum load gradients, representing operation at maximum response. The effect of the thermal cycling (i.e., rapid load changes, frequent starts and stops) on the lifetime and maintenance intervals of the technologies, and ultimately on the actual operating behaviour, must be carefully considered. CC-GT will also play an important role in the future energy system, offering gas turbine power generation with higher average plant efficiency and thus lower performance-based emissions than SC-GT. However, the potentially lower emissions compared to RICE with EAT must be assessed against the reduced responsiveness and flexibility of CC-GT.

Unfortunately, there is no uniform approach for quantifying the effects of the before-mentioned damage categories to endpoints, i.e., damage to human health, the ecosystem, and resource availability. However, some life cycle impact assessment models, for example ReCiPe (Huijbregts et al., 2022), propose endpoint indicators, stating a prevailing contribution of the GWP to human health. Therefore, the results presented should not be misinterpreted to underestimate the impact of CO2, even though NOx emissions are numerically represented in more damage categories. The green house gas (GHG) limit is proposed with 100gCO2eq/kWhel in the EU Taxonomy (EU Technical Expert Group on Sustainable Finance, 2020) for power generation in line with GHG reduction targets. However, as both RICE and GT are well above the threshold, only an energetic substitution of CH4 by alternative fuels will provide a sufficient GWP reduction.

Although other pollutants (i.e., CO, CH2O, CH4, PM) contribute comparatively low to the damage categories considered, local authorities can also restrict their emission. Thus, the implementation of OC and SCR, as well as particulate filters to reduce RI, is a great lever that allows operators to deploy gas-based power generation technologies more flexibly due to the significantly reduced emissions. While EAT systems for RICE are standard in power plants, OC and SCR equipment is rare in the high-temperature application for gas turbines. For SC-GT power plants operation in an emissions competitive manner, measures for retrofitting existing plants and implementation of EAT in new plants need to be considered.

Conclusion

In this study, gas-based power generation technologies (i.e., RICE and GT) are investigated with regard to their emission behaviour in multiple operation scenarios with special focus on emission aftertreatment technologies. The methodology applied in the present study employs a holistic comparison between both technologies under the same boundary conditions. Moreover, the study not only focuses on thermodynamic performance, but also leverages a detailed analysis of the emissions associated with the electricity supply through both technologies. Hereby, emission aftertreament technologies (i.e., OC and SCR) have been considered in detail. Going one step further, the emissions are aggregated into different damage pathways (i.e., GWP100, RI, POF and HTP) that summarise the environmental impact. This allows a comprehensive thermodynamic and ecologic analysis of both technologies in different operating scenarios, including the use of exhaust aftertreatment.

The most important findings can be summarised as follows:

  • High operational flexibility imposes enhanced emissions and environmental impact, highlighting the overall need for EAT systems to meet regulatory limits in the future.

  • RICE have a lower GWP100 than GT for all load scenarios (−2.6 to −11.4%) due to the higher average plant efficiency.

  • The deployment of RICE is generally only feasible in terms of environmental impact with EAT due to significant emission reduction (RI: 71%, POF: 97%, HTP: 98%), which is already state-of-the-art for most RICE power plants.

  • GT are only comparable to RICE in terms of environmental impact with exhaust aftertreatment due to high emission reduction (RI: 46–67%, POF: 87–91%, HTP: 86–91%), which is not yet state-of-the-art for GT power plants.

  • RICE can be operated more flexibly due to their modularity. With only one engine running at part-load, RICE power plants are less affected by part-loads in terms of emissions and can therefore operate over most of the load range without excessive emissions. In contrast, the single GT power plant is more sensitive to load changes and is therefore limited to operation above 30% for emissions reasons.

Outlook

In further studies, the methodology can be improved by using more detailed transient and part-load characteristics for the emissions of the considered SC-GT and RICE. Moreover, full-load emission values of new state-of-the-art technologies and “technologies in operation” need to be distinguished. Additionally, the heat-up phase and degradation of the EAT systems should also be modeled in more detail to account for the conversion efficiency of the catalysts during plant start and transient operation more precisely. Ammonia emissions can be significantly reduced by implementing an appropriate dosing strategy and using an ammonia slip catalyst. Furthermore, a more comprehensive range of damage metrics needs to be applied to the emission values to sharpen the environmental footprint analysis. Life cycle emissions should also be taken into account, as these are commonly used as a reference, for example in the EU taxonomy regulation. Moreover, the utilisation of alternative, CO2-neutral fuels should also be investigated with regard to their ecological impact using the shown methodology.

Nomenclature

Abbreviations

CC

Combined cycle

EAT

Exhaust aftertreatment

GT

Gas turbine

GHG

Green house gas

GWP

Global warming potential

HTP

Human toxicity potential

JRC

Joint Research Centre

NOx

Nitrogen oxides

NMVOC

Non-methane volatile organic compounds

OC

Oxidation catalyst

OS

Operation scenario

PGM

Platinum group metal

PM

Particulate matter

POF

Photochemical ozone formation

RI

Respiratory inorganics

RICE

Reciprocating internal combustion engine

SC

Single cycle

SCR

Selective catalytic reduction

Roman letters

c

Conversion rate (−)

EI

Emission index (g/kWhel)

EIfl

Emission index referenced to full-load (g/h/kWel,fl)

GHSV

Gas hourly space velocity (h1)

m˙

Mass flow (kg/s)

P

Power (W)

r

Molar ratio (−)

T

Temperature (K)

t

Residence time (s)

x

Molar fraction (−)

Superscripts and subscripts

el

Electrical

eq

Equivalent

fl

Full-load

rel

Relative