
Introduction
The mitigation of carbon-based fuel use in flights is a major requirement to achieve the target of 75% reduction in Landing and Take-Off NOx emissions and 70% reduction in fuel burn set by the International Air Transport Association (IATA) (Krein and Williams, 2012; IATA, 2019). Moreover, aircraft operators have increasingly pressing goals of reduced operating costs, while aiming to extend the flight envelop and flexibility of their fleet. Towards these objectives, the scientific community and aviation industry have launched several disruptive technology studies and demonstrators on electrification, hydrogen, and sustainable aviation fuels, acting as the energy sources of novel aircraft architectures. Direct combustion of hydrogen into the gas turbines may yield up to 50% reduction in climate impact during flight, while fuel-cell propulsion can reach up to 75–90% reduction (Fuel Cells and Hydrogen 2 Joint Undertaking, 2020). However, many quantitative claims are based on the selected aircraft configuration and operational scheme studied. Hydrogen storage capabilities, fuel cell efficiency, hydrogen combustion stability, treatment of pollutant emissions and noise, and overall passenger safety are necessary aspects. Hence, assessment of the novel power systems and their integration in aircraft configurations requires multi-disciplinary and robust computational frameworks which follow a system-level evaluation approach.
H2-powered aviation shows potential to achieve the fuel efficiency and emissions targets, while also demonstrating operational flexibility (Del Rosario, 2014; Jansen et al., 2017). Evaluation of the fuel delivery system and the properties of injected hydrogen quantified the potential of hydrogen combustion (Tacconi and Grech, 2023). Hydrogen-powered long-range aircraft concepts with the tube-and-wing architecture lead to reduction of on-board energy utilization of up to 11% (Verstraete, 2013). Nevertheless, cryogenic fuel storage tanks and the associated thermal management systems call for a well thought design that captures both mechanical and thermal requirements (Verstraete et al., 2010). Blended-wing-body architectures may improve lift-to-drag ratios and are more versatile with respect to the hydrogen tank location and fuel distribution. Therefore, improved fuel efficiency and reduced ground noise impact is possible (Guynn et al., 2004). Small-scale demonstrators of fuel-cell powered aircraft have revealed the feasibility aspects of this technology (Bradley et al., 2007; Kim and Kwon, 2012). Nevertheless, more work is needed for larger scale demonstrations and for the quantification of environmental benefits at transportation network level (Yilmaz et al., 2012). Cryogenic storage of hydrogen is necessary in order to facilitate direct hydrogen combustion. An assessment of the storing and filling methods, possible tank technologies, dormancy as a design parameter and aircraft-level implications revealed the importance of vapor to liquid hydrogen ratio in the final volume of the carried hydrogen tank and highlighted the challenges and degrees of freedom in its design (Sielemann et al., 2023).
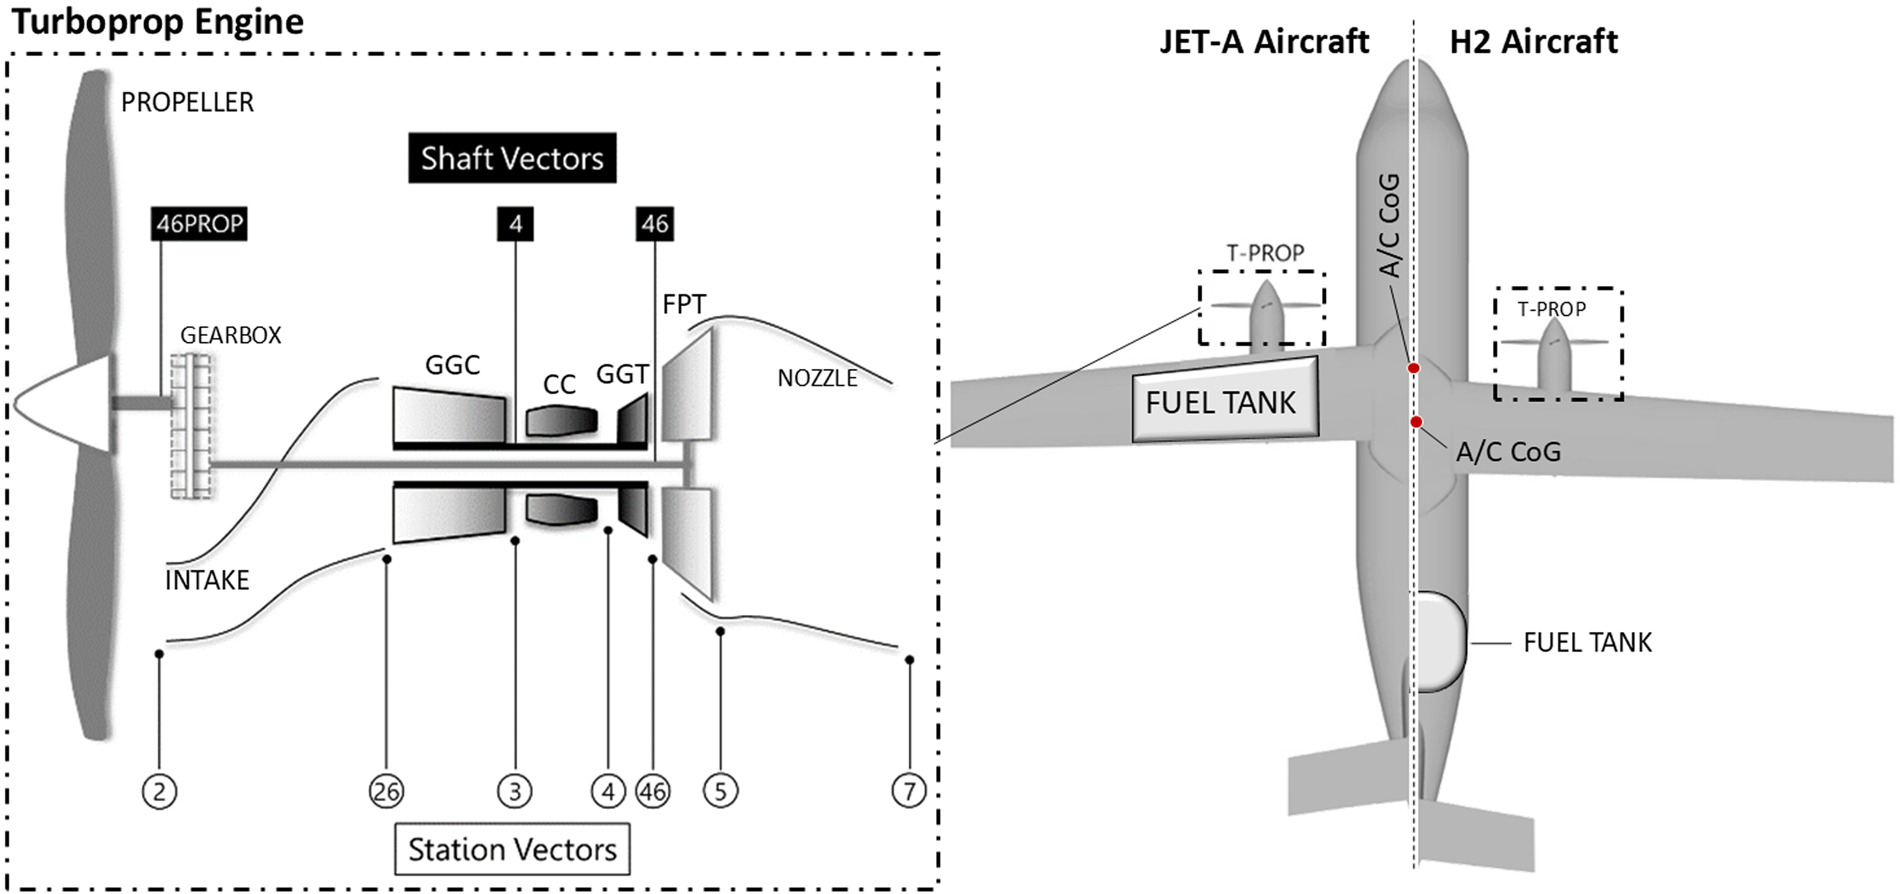
Scope of this work is the comparative assessment of direct hydrogen combustion with the conventional Jet-A concept. During the evaluation, the cycle design of the thermal powerplant is investigated with the aim of revealing trends for the design of an H2-fired turboprop, while taking into consideration the aircraft-level environmental impact. A system-level approach is followed, and an integrated engine multipoint synthesis scheme and aircraft design framework are employed. A 19-passenger commuter under CS-23 is investigated. H2 firing and its impact on engine design and aircraft performance is assessed. The conventional Jet-A burning and H2-fired aircraft carry two wing-mounted turboshaft engines coupled with respective propellers. The aircraft and engine configuration are depicted in Figure 1.
Methodology
A two-and-a-half spool geared turboprop engine is selected, comprising an all-axial gas generator compressor (GGC), an axial cooled gas generator turbine (GGT), and an axial uncooled free power turbine (FPT), connected to the propeller through a two-stage reduction gearbox shown in Figure 1. The aircraft and engine have been verified with in-service counterparts through several works (Romano et al., 2020; HECARRUS consortium, 2021, 2022a,b,c; Nasoulis et al., 2022a, b).
Engine and aircraft model
Performance of the gas turbine propulsion system is assessed within the environmental assessment engine conceptual design tool (Kyprianidis, 2017; Sielemann et al., 2022), using a multipoint synthesis approach. This is combined with the aircraft design and constitutes the novelty of this work with respect to the H2 evaluation. A single-speed propeller methodology deploying the momentum theory approach has been implemented. The performance matching scheme for the Jet-A and H2 turboprop engines includes seven pairs of state and target variables and is shown in Table 1. The pairs of equation-variables are solved in a Newton Raphson scheme where partial derivatives are considered for all of them.
Table 1.
Multipoint synthesis scheme for Jet-A and H2 burning engines.
The purpose of the multipoint synthesis scheme is to connect the design point with the off-design performance, by iterating engine design parameters in order to achieve certain targets at on- and off-design. The required GGT metal temperatures at end-of-runway Take-Off are achieved through GGT rotor and stator cooling at Top of Climb. Cycle overall pressure ratio (OPR) and combustor outlet temperature (T4) at cruise are kept at desired levels by iterating GGC pressure ratio and combustor outlet temperature at Top of Climb. The propeller rotational speed at Top of Climb is iterated to achieve a propeller tip speed at Take-Off, subject to established noise regulations. Regarding the reference point of Top of Climb, GG (Gas Generator) compressor inlet mass flow, and propeller tip diameter are iterated to satisfy propeller loading, as well as acceptable nozzle pressure ratio levels. Performance maps are scaled in the on-design condition to ensure the assigned on-design component performance. A map reference point is pre-selected and scaling factors are calculated to ensure good off-design behaviour. A base off-design matching scheme iterates fuel consumption to achieve the requested power settings, and is combined with the over-arching multipoint synthesis scheme (Samuelsson et al., 2015; Kyprianidis, 2017).
Designed engines refer to Entry-Into-Service (EIS) year of 2035 and assumed technology levels are produced based on an EIS-driven approach, accounting for technology and material improvements over the years based on data from the open literature (Kyprianidis, 2011). Sizing and weight estimation of the gas turbine propulsion system are also carried out within the environmental assessment conceptual design tool, which is based on the object-oriented Weight Analysis of Turbine Engines (WATE++) tool developed by NASA (Tong and Naylor, 2008). Hot-day Top of Climb serves as design point of turbomachinery components. Sizing and performance of the gas turbine are interconnected. The overall pressure ratio and T4 at cruise are selected as the cycle design variables and their variation is investigated in the Results section. Major assumptions and boundary conditions for the engine design and sizing are presented in Table 2.
Table 2.
Assumptions and boundary conditions.
Aircraft design and mission calculations are made withing the EVA tool (Kyprianidis, 2017). A predefined nominal aircraft dataset is used for dimension modelling of any derived aircraft configuration (Jenkinson et al., 1999). Parameters of the dataset change to account for the fuel type and its impact on the engine and aircraft. To reach an initial aircraft weight estimation, sizing of each airframe component is performed (Roksam, 1985; Torenbeek 2013). Modelling of aircraft aerodynamics is based on principles described by Jenkinson et al. (1999). Aircraft drag polar is estimated during mission calculation for individual components based on aircraft geometry and high lift device settings. A rubberized aircraft wing model is used to connect the impact of different powertrain designs with aircraft weight via wing design (Kyprianidis, 2010). Wing and tail areas are scaled according to the change of lift and stability requirement. A variation of required lift may be generated by a change of aircraft mass, which is invoked by the engine redesign and its effect on fuel burn. Wing loading is fixed during the evaluation of all configurations and acts as the wing sizing condition. A CLMAX value is also fixed and the capability of the wings to achieve it is verified (Nasoulis et al, 2022a,b).
Modelling of aircraft performance follows methods described by Jenkinson et al. (1999) and Roskam (1985). The simulated mission profile includes take-off, climb, cruise, descent, approach, landing and taxi. Both main and diversion mission are calculated. All following results refer to main mission outcomes, however, reserves and diversion mission impact the overall requirements, hence are incorporated in the aircraft design loop. Cruise performance is calculated in a discretized manner to account for fuel consumption, gradual reduction of carried weight, and therefore variation in thrust requirement. The mission analysis and rubberized wing model are coupled with the aircraft sizing and weight estimation in an iterative manner to ensure convergence of the fuel requirement, aircraft aerodynamics and final aircraft weight calculation. Hence, first order effects on the aircraft weight and wing design are accounted for in the final outcome. Major assumptions and boundary conditions for the aircraft design and mission profile are shown in Table 2.
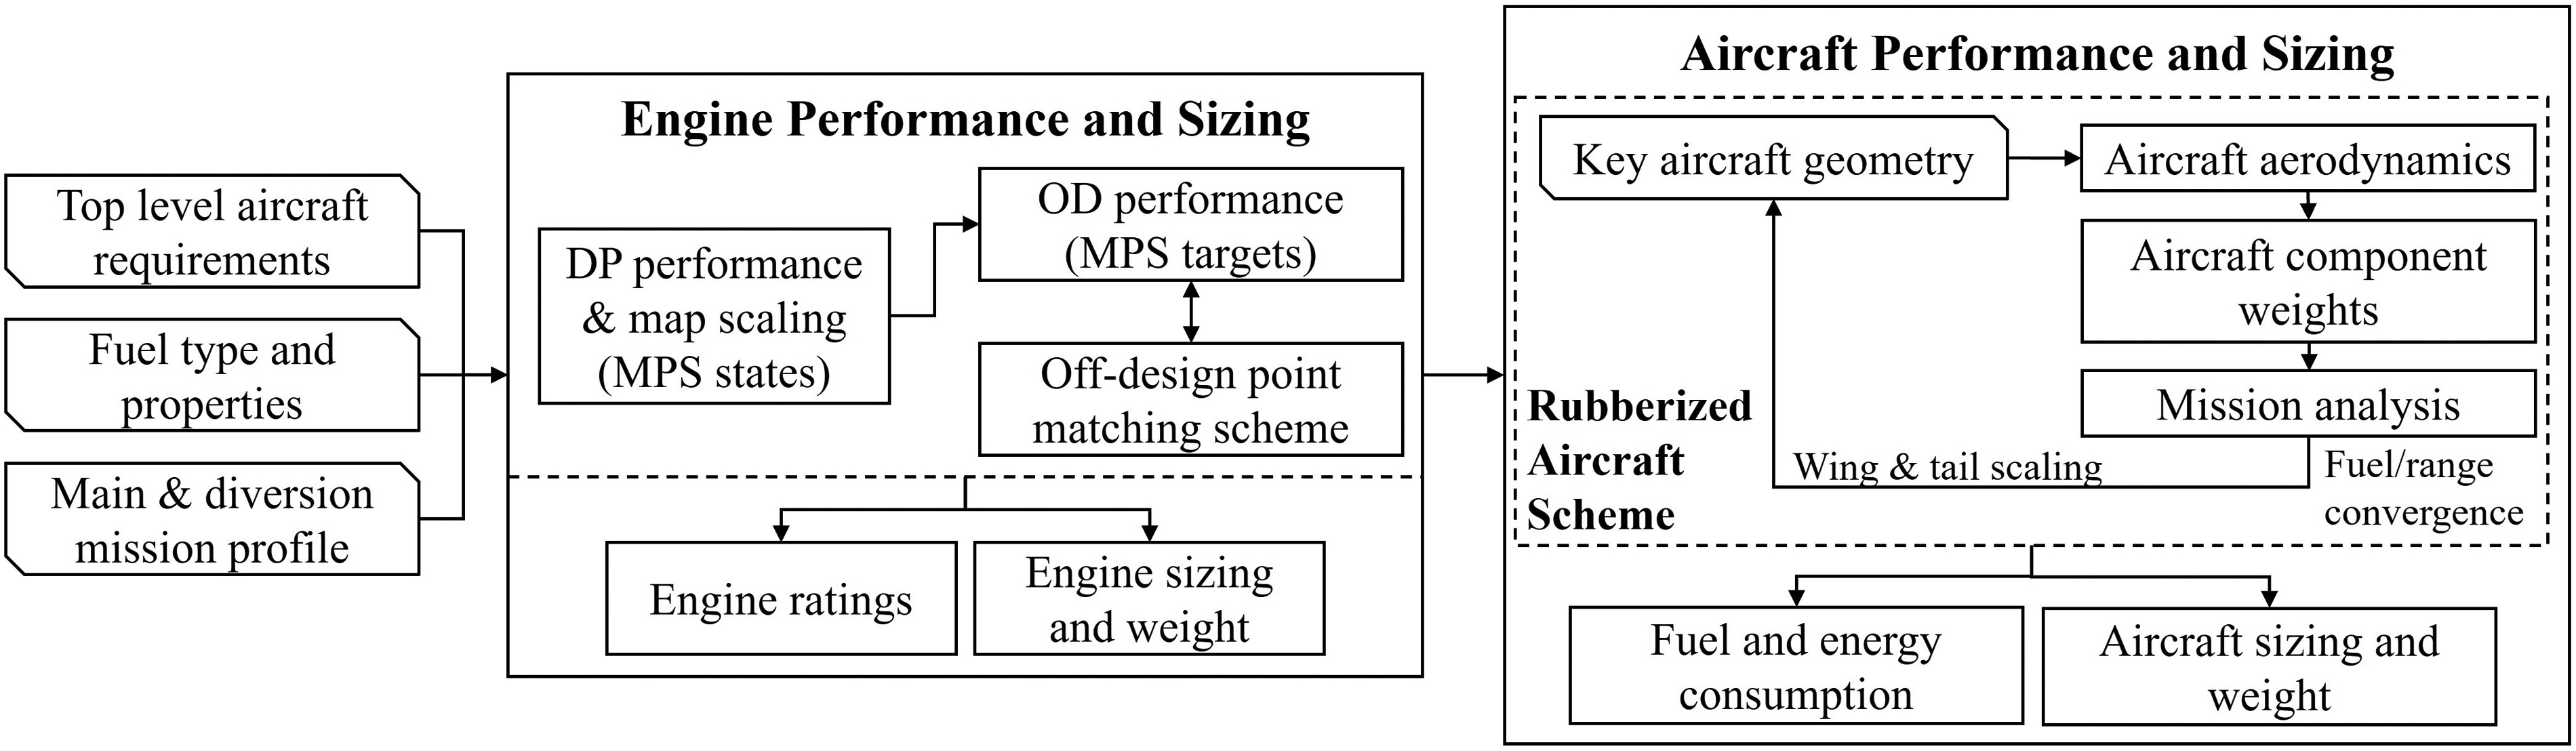
The engine performance and design are coupled with the aircraft design and mission calculation in an integrated interdisciplinary modelling framework. The workflow of calculations within the framework is presented in Figure 2. The overall modelling approach, containing a multipoint synthesis scheme and rubberised aircraft wing model, is also applicable to other configurations, such as turbofans. Appropriate changes in the assumptions, boundary conditions, and TLARs can facilitate the simulation of different aircraft and propulsion systems (Zhao et al., 2019; Sahoo et al., 2023).
High pressure compressor efficiency correction
A closer look on the last stage high pressure compressor reveals that blade height lies in such a range that efficiency penalties may be accrued due to increased tip leakage generated losses. Kyprianidis et al. derived a correction for the polytropic efficiency of such compressors, shown in Equation 1 (Kyprianidis and Rolt, 2015).
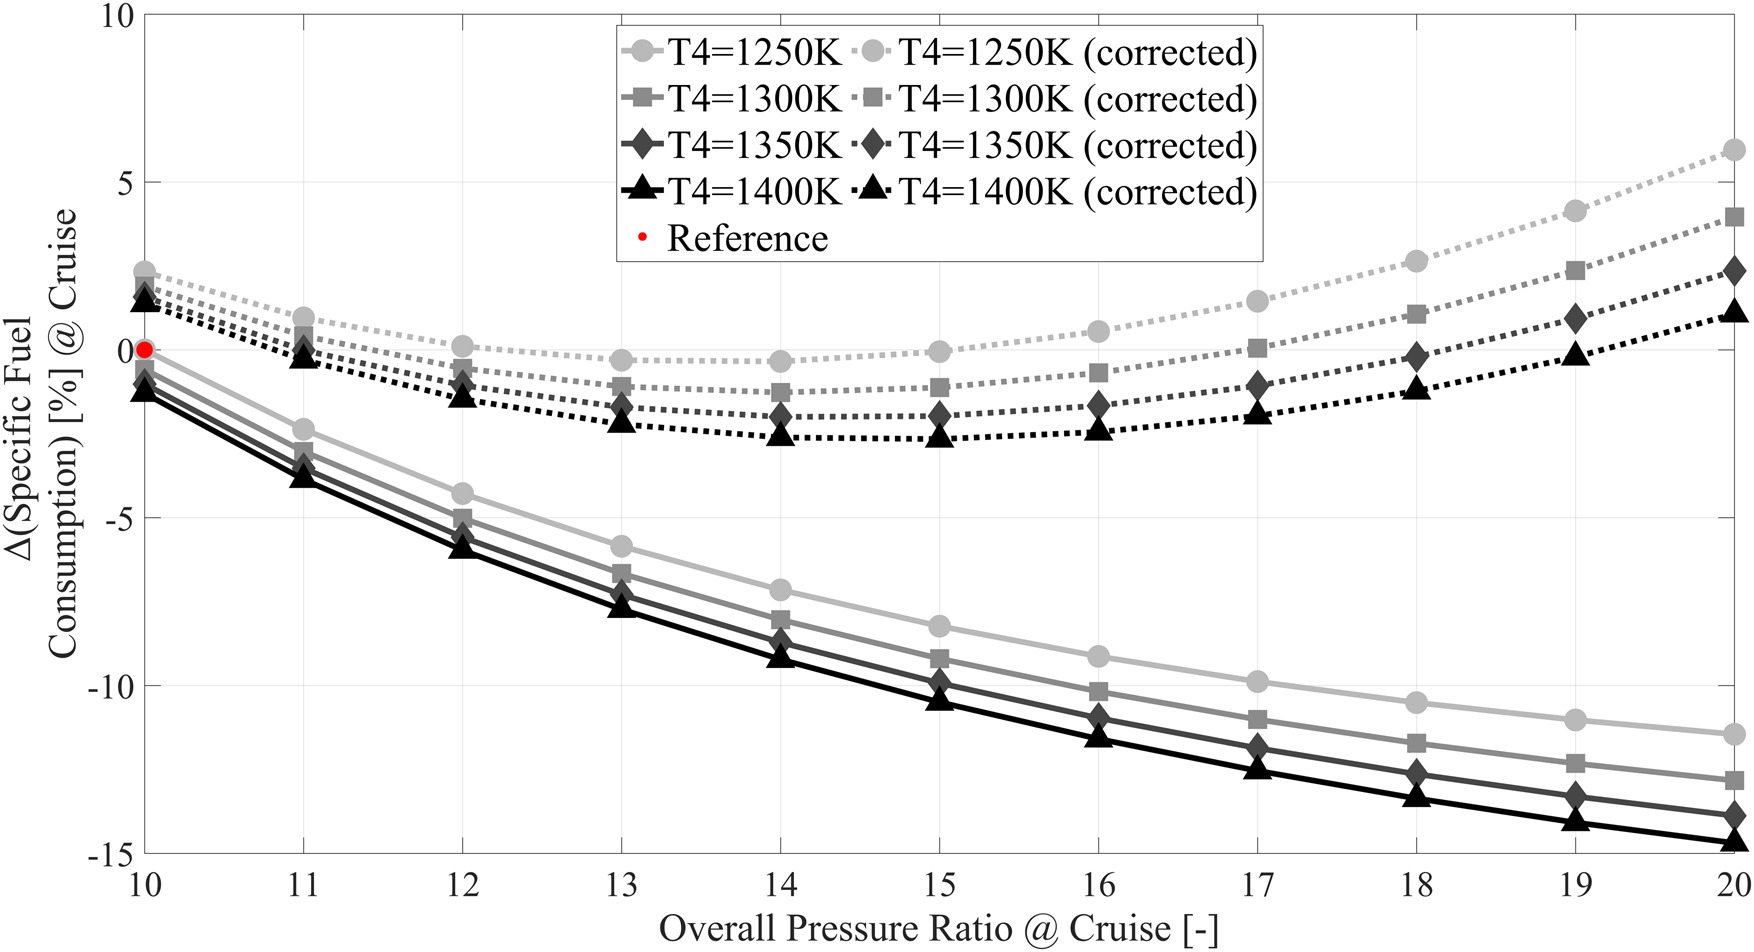
The correction is integrated within the modelling scheme and the resulting SFC penalty with respect to OPR and T4 at cruise is presented in Figure 3. While increased pressure ratio improves performance, it also results in smaller last blade heights, which in turn are penalized more in terms of efficiency by the employed correction. For the reference Jet-A engine exploration of Figure 3, these driving factors lead to an optimum OPR at cruise in the 13–15 range. Results are relativized with the OPR = 10 and T4 = 1,250 K case. The SFC deviation, when the HPC correction is accounted for, amounts to 2.5% between the OPR 10 designs and increases up to 18% between OPR 20 designs. Combustor outlet temperature has consistent impact on the examined OPR range. The compressor polytropic efficiency correction has been implemented in all following simulations and results presented for both the Jet-A and H2 designs.
H2-fired configuration
Jet-A has been swapped with H2 and is burnt directly in the engine. The H2 fuel is assumed to be in gaseous form at the time of injection. The effect of the gaseous H2 injection temperature and pressure is not explored in this study and fixed values are assumed for following calculations. The lower heating value of H2 is fixed at 120 MJ/kg with a constant specific heat capacity of 14.55 kJ/(kg.K). It is noted that the specific heat capacity of combustion products depends on fuel-to-air ratios for all configurations. While the combustor architecture remains the same both for Jet-A and H2 firing, the difference in combustion products is accounted for and impacts gas turbine design and performance.
It is assumed that H2 is stored in the aircraft in liquid form on cryogenic tanks. Srinath et al. presented a high-level investigation of hydrogen tanks and the associated thermal management systems (TMS) that are necessary for fuel conditioning (Srinath et al., 2022). Winnefeld et al. conducted a detailed analysis for the estimation of tank geometry, wall characteristics, and overall design (Winnefeld et al., 2018). In this study, the gravimetric performance of the cryogenic hydrogen tank and the associated conditioning system are represented by the Gravimetric Index (GI) and Mass Factor (MF), described with Equations 2 and 3, respectively (Mukhopadhaya and Rutherford, 2022). The detailed calculation of H2 fuel mass by the computational framework is used to estimate the mass of the tank and TMS. For the LH2 tank dimensions, fuel volume, wall thickness and tank filling factor are accounted. For the size of aircraft investigated herein, a single tank with diameter slightly less than of the fuselage is sufficient. The tank is selected to be cylindrical so that minimum additional space is required for fuel storage. The tank is assumed to be installed in the rear part of the aircraft. While all possible H2 tank locations need to be critically examined for safety, the proposed one carries some airworthiness potential if accompanied by the proper safety measures (Silberhorn et al., 2019; Spencer, 2023).
The H2 and Jet-A aircraft are designed to have equal take-off and climb performance (with a ±2% deviation). To achieve that, wing loading and climb-out engine power have been modified. The H2 aircraft are designed with 10.5% reduced wing loading and 22.5% higher power during climb-out. All other power settings, and data used by the multipoint synthesis scheme for the gas turbine performance and sizing calculation are same for both the Jet-A and H2 burning engines, ensuring a fair comparison between engines and aircraft.
For the conventional configuration, the Jet-A tanks are placed in the wing. The hydrogen tanks and fuel conditioning system are placed in the rear part of the aircraft, behind the passengers’ cabin. The H2 aircraft fuselage is extended by approximately 10% so that H2 equipment fits without any cargo space being sacrificed. The addition of significant mass in the rear calls for a new centre of gravity and stability estimation. For both the Jet-A and H2 configurations, the centre of gravity is selected at the same point with respect to their mean aerodynamic chords. To achieve this, the wing of the H2 configuration needs to be moved about 8% farther from the nose of the aircraft, which results to the H2 aircraft centre of gravity lying 3.5% farther from the aircraft nose compared to the Jet-A design. These changes are also shown in Figure 1. For both architectures, the centre of gravity has the same distance from the aerodynamic centre. Static stability is evaluated and lies within acceptable limits for commuter aircraft (Jenkinson et al., 1999).
Results and discussion
The analysis that follows compares the H2 configuration, meaning one that has an H2-burning engine, increased fuselage length and mass due to the complete H2 fuel system, with the conventional Jet-A burning configuration. The design space is represented by a variation of cruise OPR between 10 and 20 with an increment of 1, and T4 between 1,250 K and 1,400 K with an increment of 50 K. The design space is generated taking into consideration existing designs, turbomachinery component limits and expected improvements for the class of engines examined (Kurzke and Halliwell, 2018). Ultimate goal of the study is to derive the cycle design of an H2-firing gas turbine and evaluate its competitiveness compared to traditional Jet-A designs. For the differential analysis presented, results are relativized with the Jet-A OPR 10 and T4 1,250 K case, except if stated otherwise.
Impact of H2 integration
Integration of hydrogen in the aircraft configuration has been broken down into different steps in an effort to quantify the impact of each and showcase the importance of accounting for all new aspects. Hence, the first level of integration is sole combustion of H2 without considering the needed fuselage extension to accommodate the additional tank and conditioning system, nor the impact of this system’s mass. The second step still neglects the added mass of the systems but now investigates an aircraft with prolonged fuselage and different wing placement. Finally, the hydrogen system mass impact is added in the evaluation. A differential analysis is presented in Figure 4 with cumulative effect showcased by the respective increase of block fuel consumption and maximum take-off weight (MTOW).
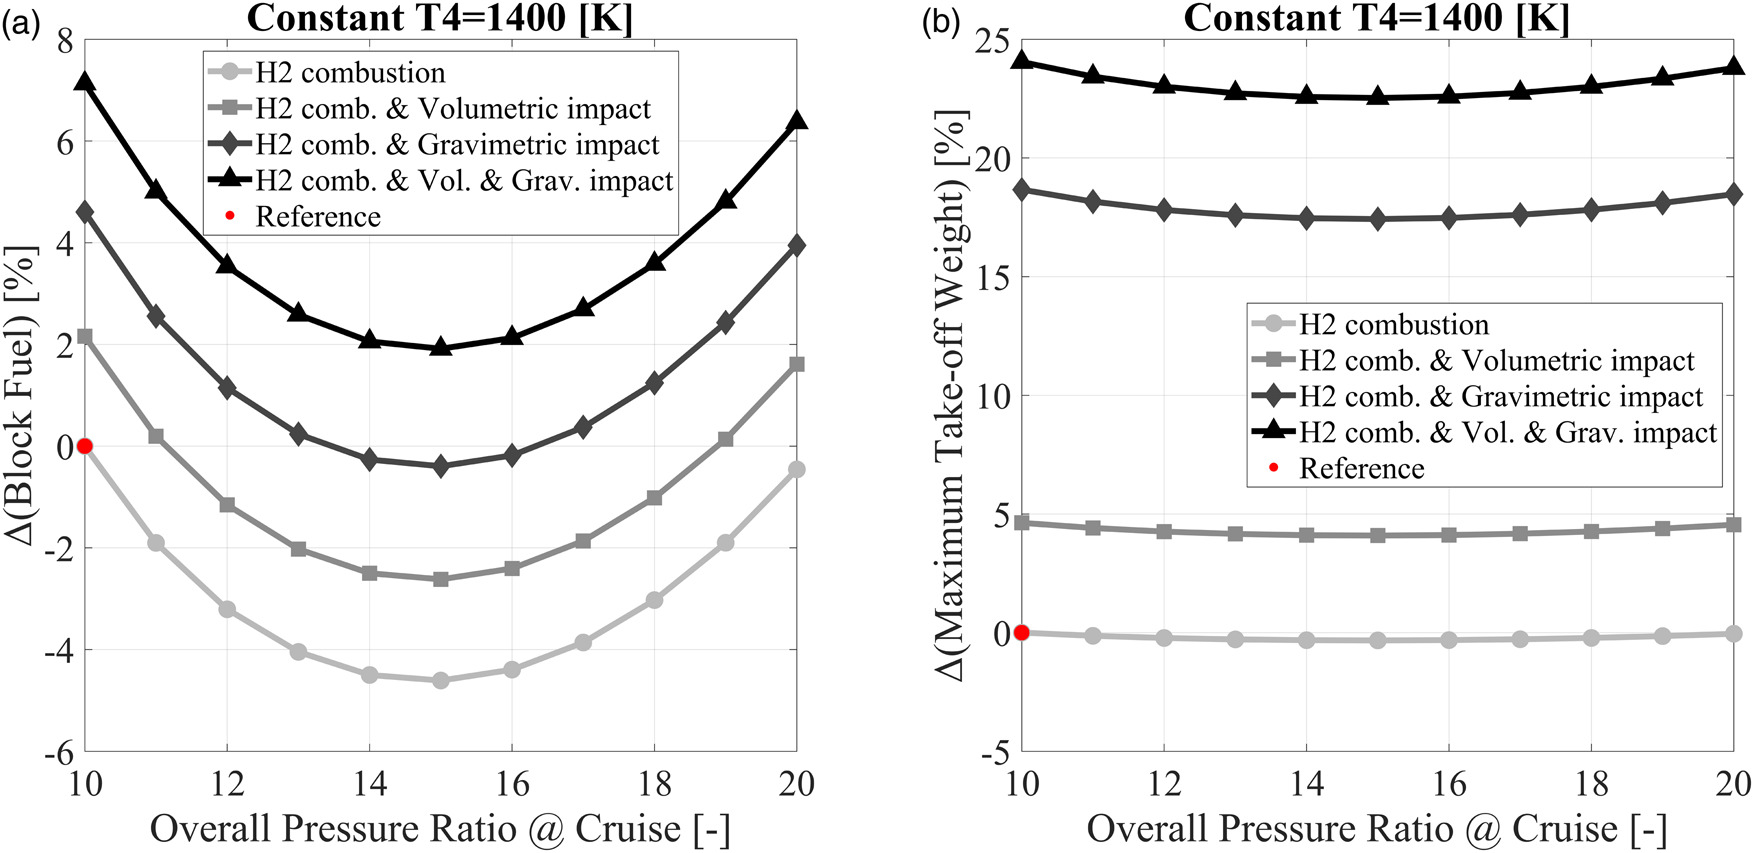
Only H2 configurations are presented in Figure 4, and they have all been relativized with the OPR = 10 and T4 = 1,400 K H2 case. The fundamental trendline of block fuel is heavily impacted by the imposed compressor efficiency correction. The volumetric impact refers to the extension of the fuselage due to the volume of hydrogen tank and fuelling system. A longer fuselage corresponds to greater structural weight and affects aerodynamic performance, which is translated to a 2% increase of block fuel and 5% increase in MTOW. Considering only the gravimetric impact of the H2 system without the fuselage extension leads to 4.5% increase of block fuel and a significant 18.5% increase of MTOW. The cumulative impact of all integration levels is the aggregate of the individual ones and results in block fuel consumption increase of 7% and MTOW increase of 24%. The deterioration of mission and aircraft performance is significant compared to the case where the Jet-A fuel is simply swapped with H2, and the presented aspects are critical in the conclusion of whether H2 combustion holds true potential for the aircraft class examined.
Comparative cycle and engine design
All following results that address the H2 cycle design take into consideration a fully integrated H2 system. To assess the optimal overall pressure ratio and combustor outlet temperature for the hydrogen cycle, its impact on gas turbine performance and sizing is examined.
The gas generator of the turboprop engine comprises a high-pressure compressor, combustor, high pressure turbine, free power turbine, and several miscellaneous components, such as shafts, nozzles, ducts, accessories, and bearings. No explicit change in combustor weight due to the change from conventional combustor design is calculated. Impact is considered negligible due to the low mass contribution of the component. Cruise OPR is varied and T4 remains constant at 1,400 K for Figure 5.
Figure 5.
Gas generator component mass breakdown for Jet-A and H2 cases of constant T4 = 1,400 K (a). Relative change of whole engine mass (b).
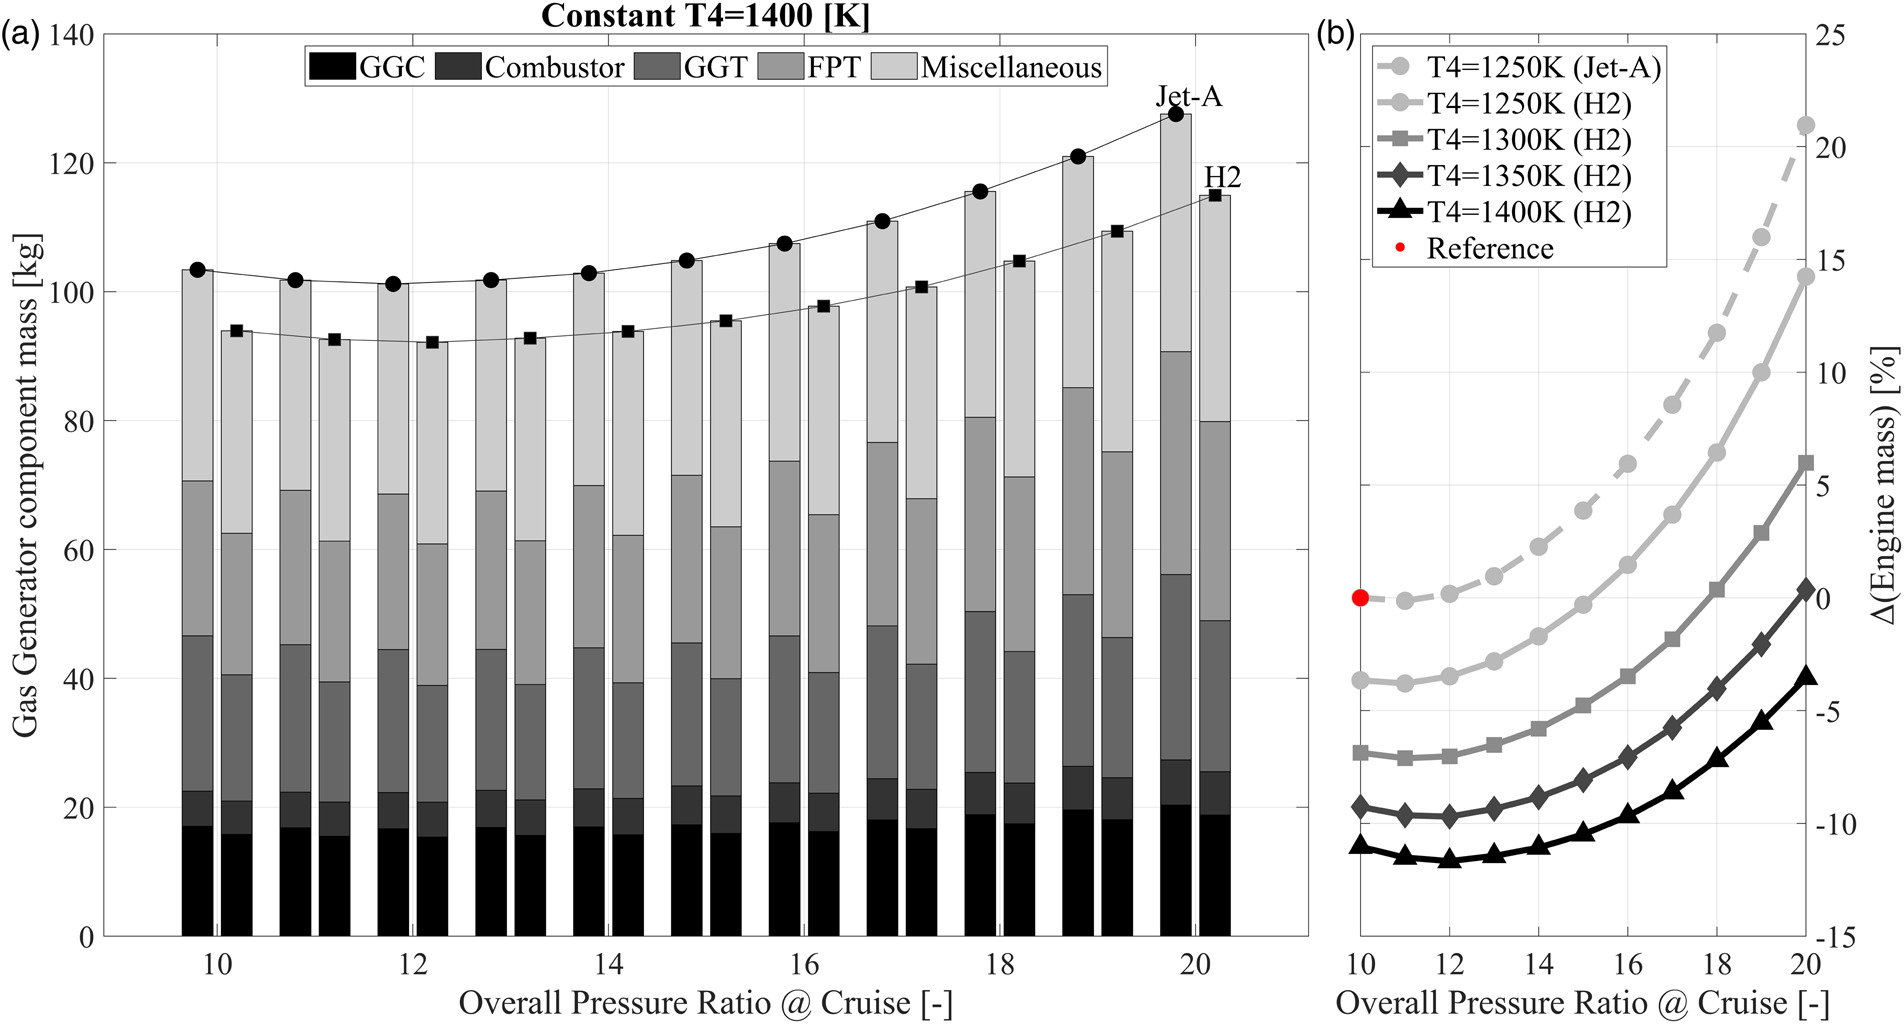
The Jet-A engine is analysed on the left-side bars and the H2 engine on the right-side bars of Figure 5a. The aforementioned impact of the last blade height correction on the polytropic efficiency of the high-pressure compressor also affects the temperature and pressure ratios throughout the machine. Hence, mass of individual components follows a parabolic trend for both the Jet-A and H2 engines. As OPR increases, the penalty does too, leading to heavier designs, counteracting the expected mass reduction benefit due to increased pressure ratio. It is also shown that the H2 gas generator is designed lighter for the same cycle conditions, multipoint synthesis parameters, and power settings. This is a direct effect of the H2 combustion products which have higher specific heat capacity, therefore a different ratio of constant pressure to constant volume heat capacity, gamma, is used for all cycle calculations. Greater heat capacity translates to a need for lower temperature ratio or less mass flow, and lighter components after the combustor. Overall, the H2 gas generator is designed about 10% lighter compared to the Jet-A one.
Nevertheless, whole engine mass is of interest at the powerplant level. The whole engine comprises the gas generator, propeller, and propeller gearbox. The two latter components do not have any mass variation between the configurations, given that power requirements, and tip speed limits stay fixed throughout the study. Therefore, a relative GG mass reduction of about 10% for the H2 designs, corresponds to a roughly 5% reduction in terms of whole engine mass. This is indicated in Figure 5b, via the comparison of T4 = 1,250 K designs. As T4 increases, the engine designs become lighter with a diminishing rate. The lightest H2-burning engine is designed for T4 = 1,400 K and an OPR around 12.
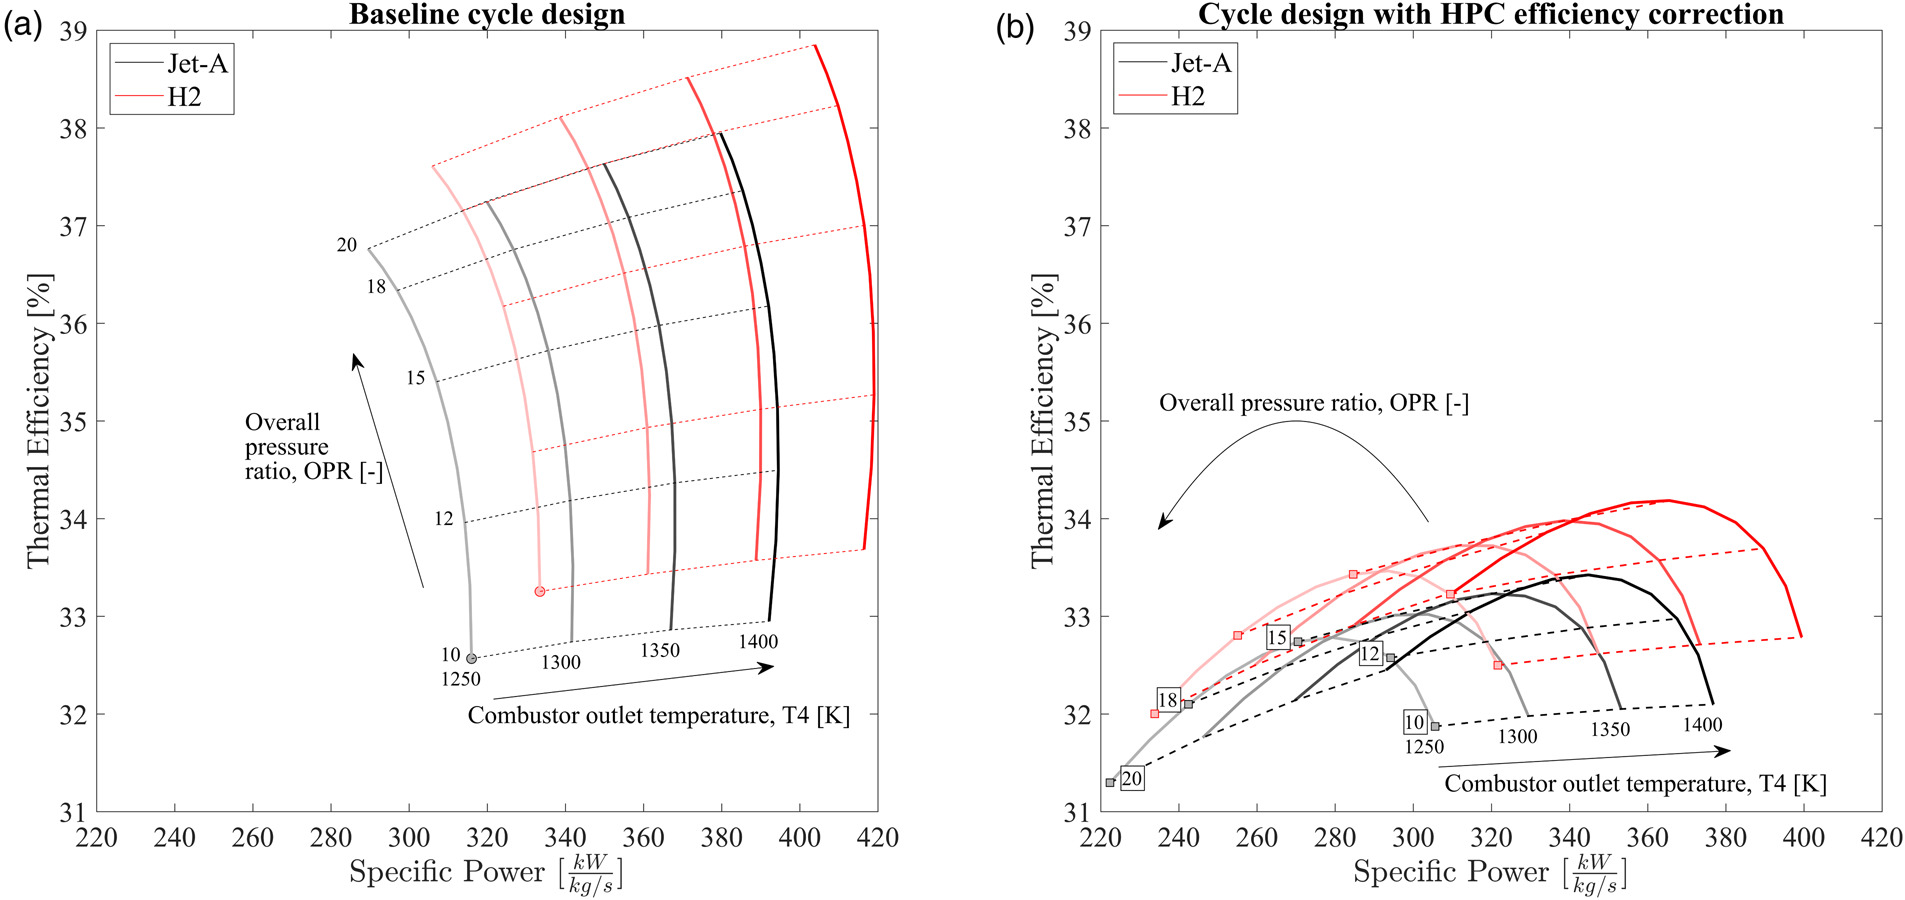
The performance and size of the designed engines are also evaluated in Figure 6. The baseline impact of fuel type change is given in Figure 6a, where the HPC polytropic efficiency correction is not implemented. Specific power and thermal efficiency increase for the H2 engine. The H2 combustion products have higher specific heat capacity than the Jet-A combustion products, therefore, for the same change in temperature through the turbine and the fixed Top of Climb power requirement, less mass flow is required. Thermal efficiency for the turboshaft engine is defined as the ratio of change in kinetic energy through the engine over the provided chemical power. Thermal efficiency improvement is a direct effect of the increased specific heat capacity in the H2 combustion products which generates a higher gamma value for the thermodynamic cycle. While not displayed in Figure 6, the overall efficiency of the engine follows the trend of thermal efficiency closely and lies about 4% lower. Overall efficiency is the product of core, propulsive, transfer and installation efficiency and amounts to the ratio of installed propulsive power over the provided chemical power. The implementation of the HPC efficiency correction changes the trendlines for each fuel type significantly and is shown in Figure 6b. The parabolic trend is more pronounced and leads to an optimal thermal efficiency in the range of 12–15 cruise OPR. Increasing the combustor outlet temperature is always beneficial. Nevertheless, the change of fuel type leads to a consistent benefit of specific power and efficiency, which amounts to 6% and 1%, respectively, for all cases of the design space.
Figure 6.
Thermal efficiency and specific power of the Jet-A and H2 engines for the baseline assumptions (a) and with the HPC efficiency correction (b).
Along with the efficiency of the engines, the specific fuel consumption during cruise is monitored and presented in Figure 7. To be able to compare the specific fuel consumption of the H2 and Jet-A burning engines, a closely related metric is introduced, called equivalent specific fuel consumption (ESFC) (Tacconi and Grech, 2023). The increased lower heating value of the H2 fuel relative to Jet-A is accounted for with the specific fuel consumption of the H2 engine. The resulting equivalent specific fuel consumption is presented in Equation 4.
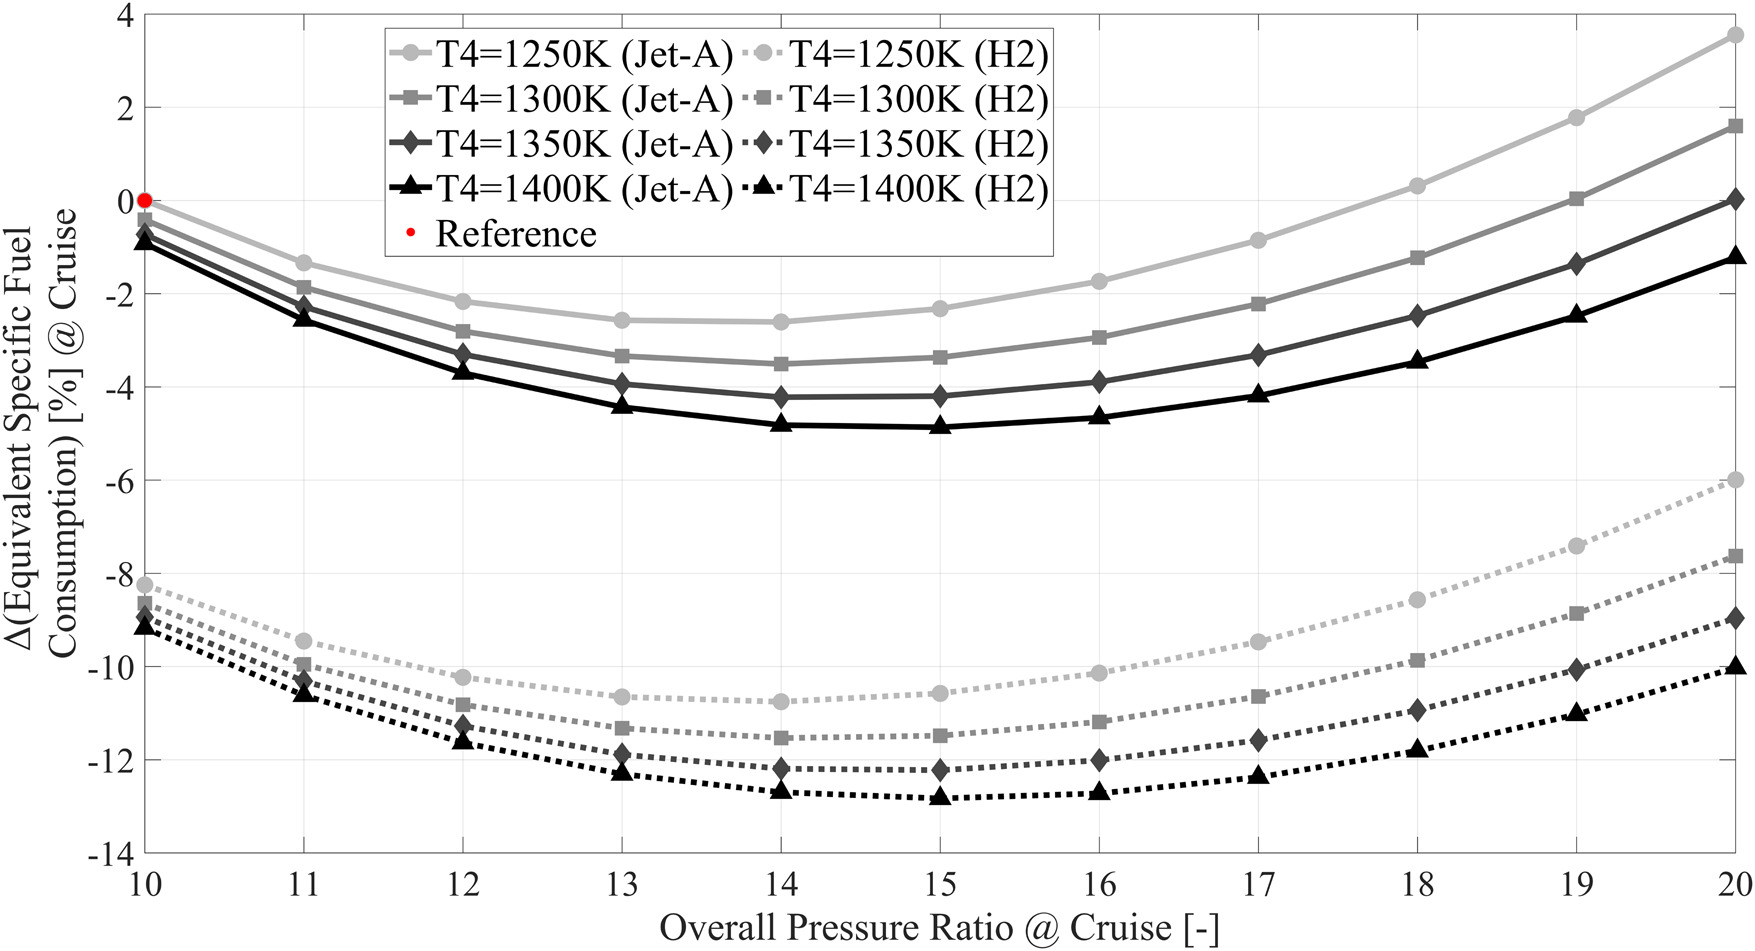
For the same fuel mass, hydrogen carries roughly 3 times more energy compared to Jet-A. Nevertheless, the equivalent SFC metric allows for a fair comparison which showcases the impact of improved engine performance on SFC. The interaction of the two competing factors - increased thermodynamic performance and increased compressor efficiency penalty for higher OPR designs - is still at play and generates the parabolic trendline. The aforementioned improved engine performance due to the change in fuel type and consequent increase of heat capacity in the combustion products was in the order of 1%. Along with the higher thrust requirement for the H2 configuration, the ESFC of the H2 burning engine improves by about 8–10% through the examined cycle design range, as shown in Figure 7. The design with the most optimal specific fuel consumption is in the range of 15 overall pressure ratio and 1,400 K combustor outlet temperature.
Aircraft and mission-level analysis
Having discussed the engine sizing and performance for the cycle design, the outcomes can be taken to the mission and aircraft performance level to assess the actual potential of the H2 burning configuration. For this study the reference GI value is set to 0.3 according to (Mukhopadhaya and Rutherford, 2022) for the examined aircraft class.
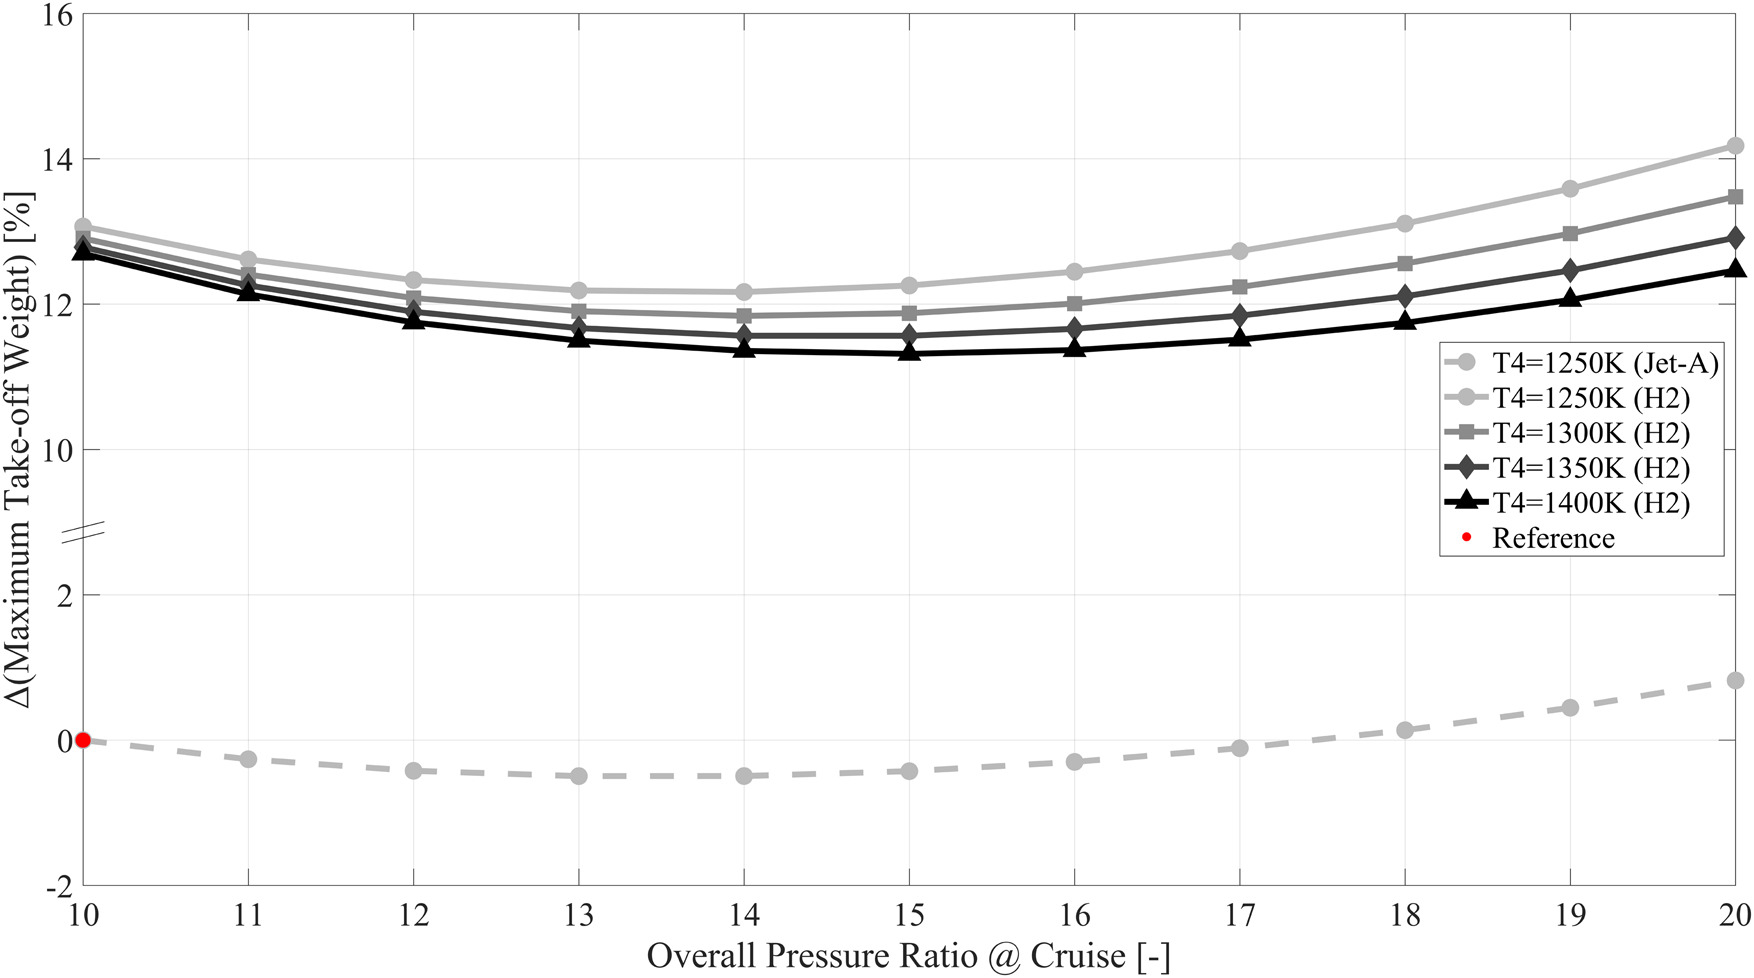
Firstly, the maximum take-off weight is examined and compared with the conventional configuration in Figure 8. MTOW increases by 13% for the reference OPR 10 and T4 1,250 K design. This is an outcome of reduced aerodynamic performance due to the prolonged fuselage, added mass due to the H2 system, and the heavier wings. The latter results from the equal take-off field length and rate of climb requirements for the two concept configurations. A relatively consistent increase in MTOW is observed for all H2 designs of the examined cycle design space. Despite that, all reported MTOW values are within the CS-23 aircraft class certification limit of 8,618 kg.
Finally, block energy requirement for the H2 configurations is compared to Jet-A ones. Given that block fuel mass for the H2 aircraft is roughly 3 times less than of the Jet-A aircraft due to its energy density, block energy is selected as the metric of consumption for the comparison and evaluation. The H2 and Jet-A block energy demand values relative to the Jet-A case of OPR = 10 and T4 = 1,400 K are shown in Figure 9a. Block energy demand is directly proportional to the block fuel consumption. The latter is dependent on aircraft mass which generates the thrust requirement for fixed aerodynamic performance. For the assumed level of technology, the Jet-A configurations demand less energy over the main mission. For the reference case of Figure 9a, the H2 design leads to 4% higher energy demand. Figure 9b shows values of H2 relativized with their respective cycle design case of Jet-A, according to Equation 5.
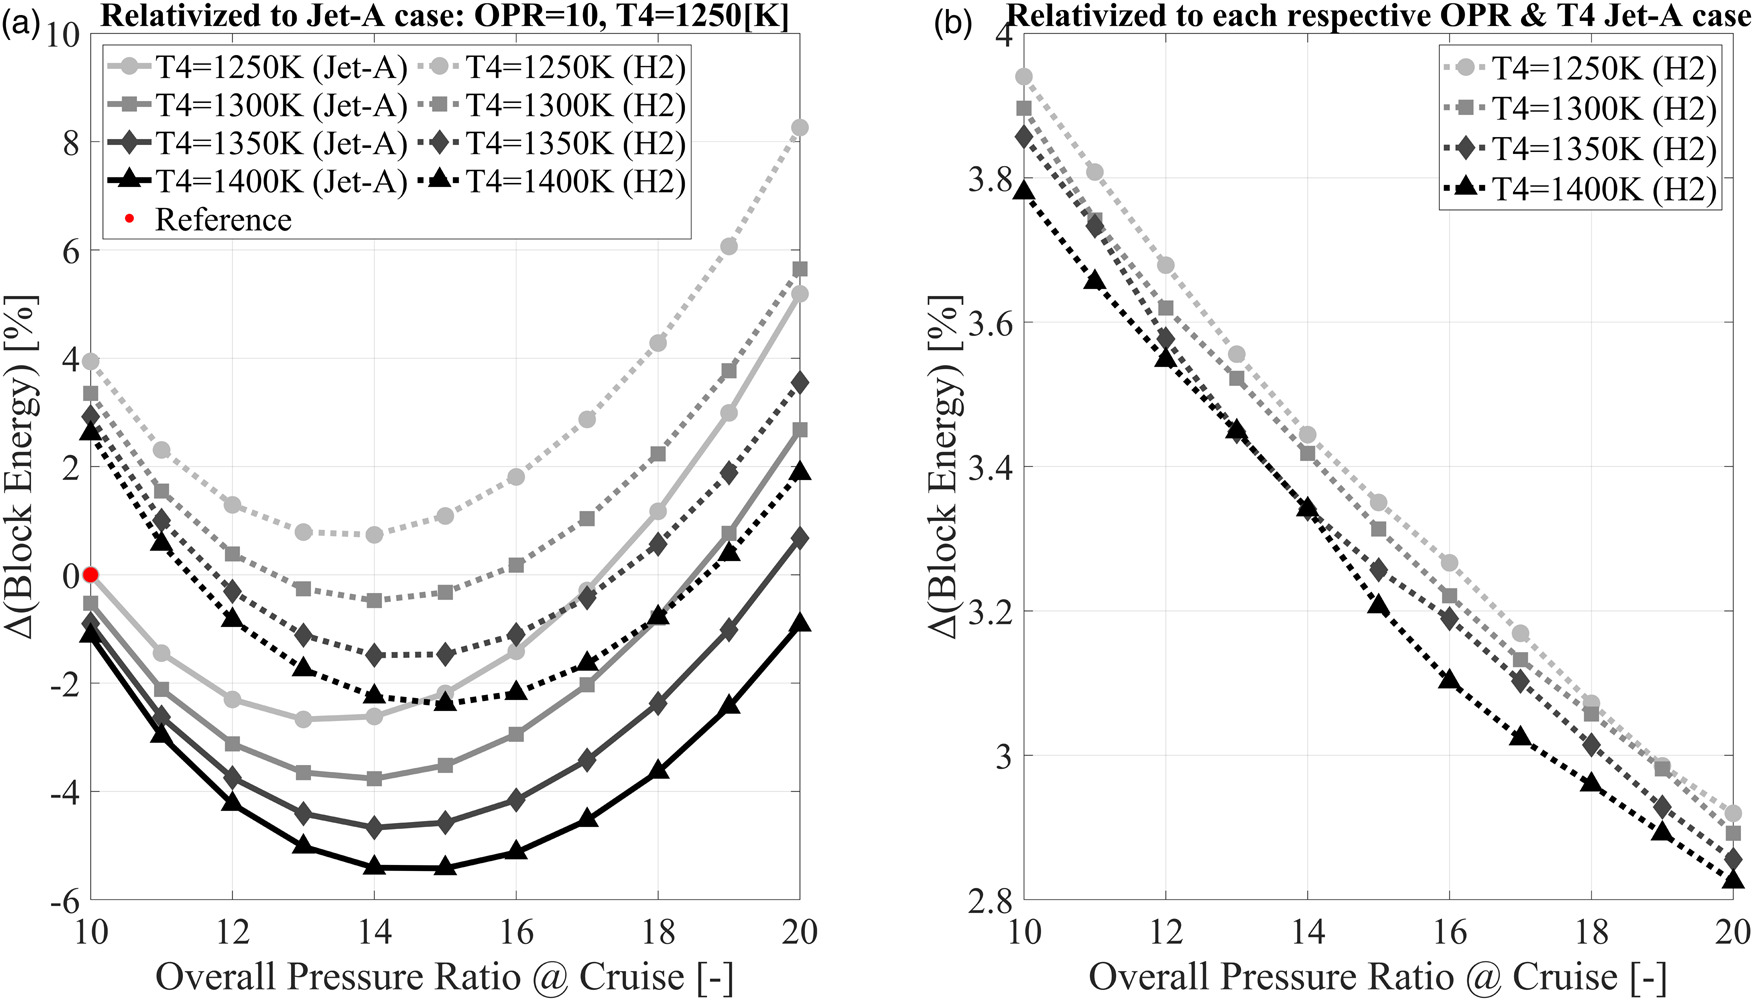
(5)
This highlights the impact of fuel type change. The energy consumption deviation of Figure 9b ranges from 4% to 3%. Also, for increased OPR at cruise, the deviation in energy demand between the H2 and Jet-A configurations reduces, indicating greater impact of the HPC efficiency correction for the Jet-A engine. Moreover, high OPR H2 designs are more efficient overall compared to their conventional Jet-A counterparts. Nevertheless, the optimal cycle design in terms of block energy consumption is for OPR of 15 and T4 of 1,400 K. The aircraft mass for this design is slightly suboptimal but close enough to the best performing case to result in the overall lowest block energy demand.
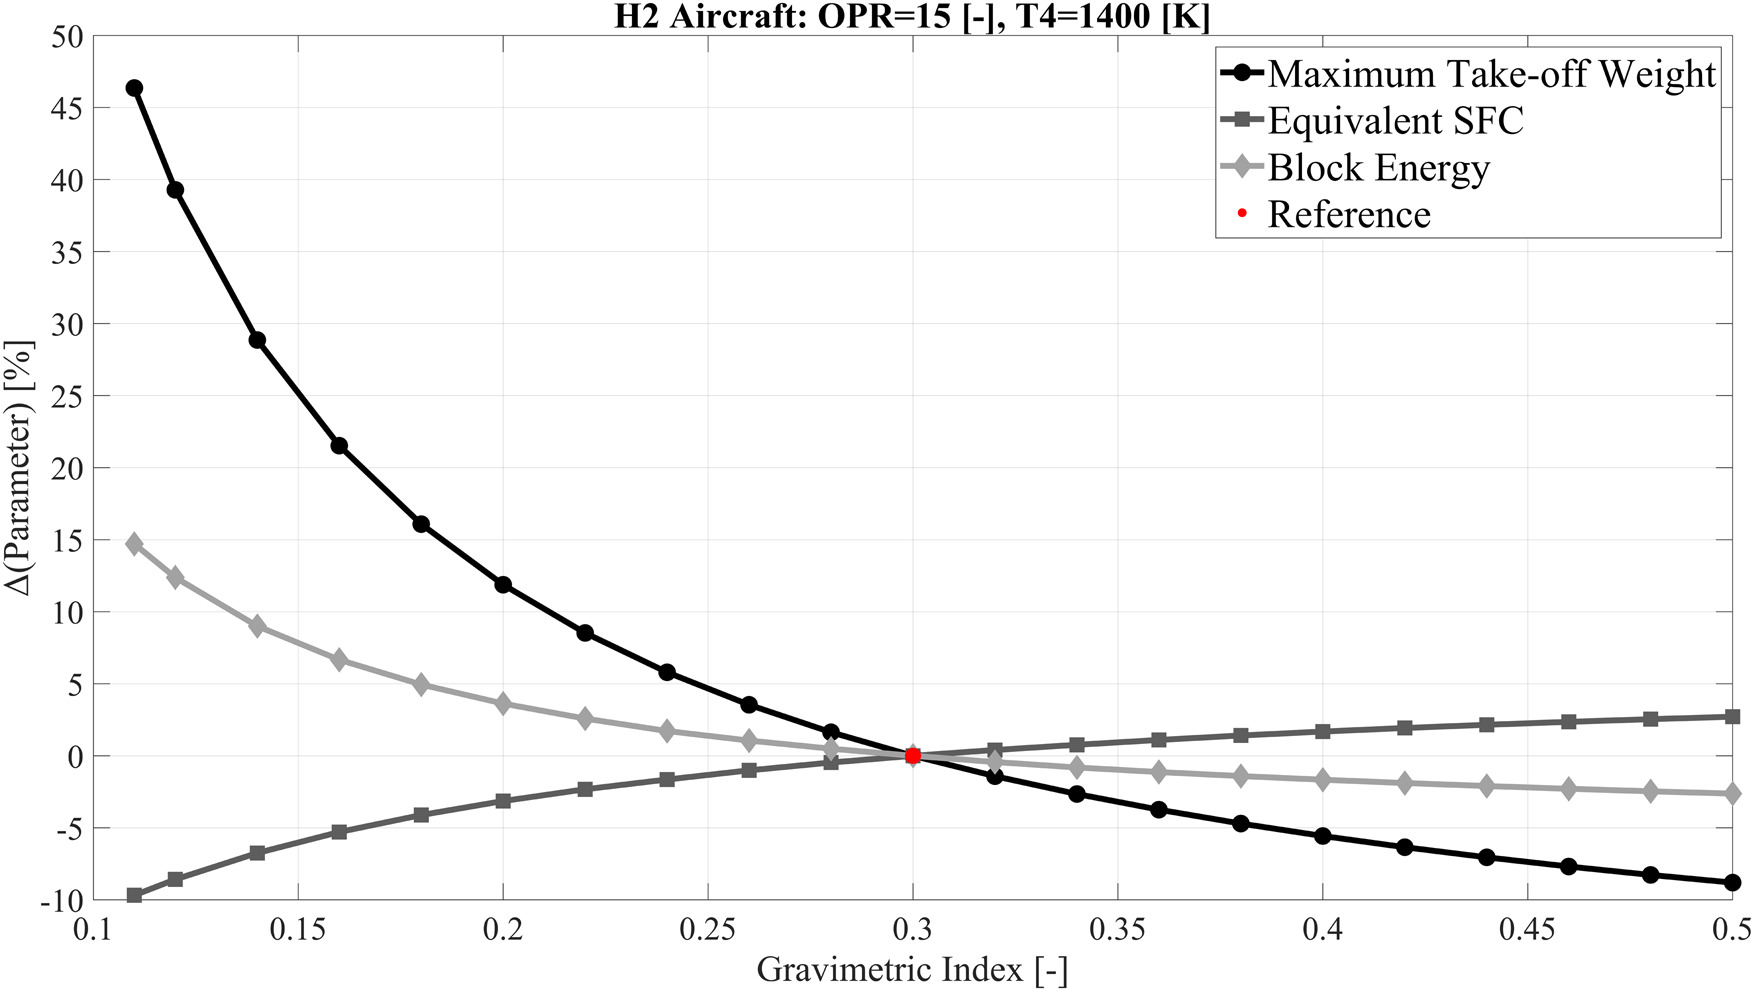
Sensitivity analysis of gravimetric index
Despite the H2 configuration having an engine that performs better and is lighter compared to the Jet-A configuration, the roughly 13% increase of MTOW results in greater block energy demand for the H2 aircraft. This conclusion depends heavily on aircraft mass. Hence, a parametric study on the gravimetric index of the H2 aircraft is presented in Figure 10. The reference case corresponds to the optimal H2 design of OPR = 15, T4 = 1,400 K, and GI = 0.3. The non-linear effect of the gravimetric index in all metrics of interest is clear and showcases the “snowball” effect that is active when aircraft mass is increased in an unconstrained manner. The assessment of Figure 10 indicates that a gravimetric index of 0.23 is the lower bound of acceptable H2 aircraft designs due to MTOW. This lower bound case results in a 2% increase of block energy demand with respect the reference GI case. With constant cycle design, thermodynamic gas turbine performance remains constant. However, for reduced GI and increased aircraft mass the thrust requirement increases. At cruise, the gas turbine operates at elevated part load, which improves core efficiency and consequently ESFC. Although, SFC may improve by up to 10% in the allowed and examined lower part of the GI range, the increase of thrust requirement is disproportionally larger reaching up to 30% for the same GI assumption. This leads to the increase of block energy demand for reducing GI. Finally, values of GI above 0.3 showcase limited interest in terms of block energy reduction with benefits of about 2.5% at the end of the examined range. The outcome of Figure 10 solidifies the GI range of interest for the commuter aircraft class, showcases the technology level in LH2 storage and fuel conditioning systems that needs to be achieved, and quantifies the benefits that direct hydrogen combustion can yield at the mission and aircraft performance level.
Conclusions
A multidisciplinary framework has been utilized to evaluate the potential of direct hydrogen combustion for a turboprop commuter aircraft. A multipoint synthesis scheme has been employed for gas turbine design. Powerplant modelling has been coupled with aircraft sizing and performance estimation for the evaluation of hydrogen. Hydrogen modelling has assumed direct combustion and accounted for the additional mass and volume needed for the complete LH2 fuel and storage system. Cycle design of the H2 burning engine has been compared to conventional Jet-A configurations to conclude on the potential of the novel H2 case.
Two competing factors have been identified in the cycle design of both the conventional and H2 engines. While increased overall pressure ratio at cruise leads to better thermodynamically performing engines, it also results in smaller last stage blade heights. In turn, this negatively impacts the compressor efficiency. Engine performance and sizing was optimal for the highest examined combustor outlet temperature and an OPR of 15 at cruise. The change of fuel type and the consequent increase of the H2 combustion products specific heat capacity has resulted in relative efficiency and weight benefits for the H2 engines compared to the conventional. Whole engine has been designed lighter by 5%, thermal and overall efficiency improved by 1% with an overall impact on equivalent specific fuel consumption, which was reduced by 8% for the H2 configuration. Nevertheless, the maximum take-off weight of the H2 aircraft increases by about 13% with a direct impact on thrust requirement and block energy demand. For the reference assumption of gravimetric index of 0.3, the optimal H2 aircraft has 3.3% greater energy demand. The parametric analysis on gravimetric index, the primary driver of the complete H2 fuel system mass, highlighted the importance of carried aircraft mass. A lower bound for GI at 0.23 was revealed due to the maximum take-off weight certification limit. The upper bound of the GI examined range offers minimum benefits in block energy demand. The combined engine cycle and aircraft design approach has revealed that the H2 configuration underperforms its Jet-A counterpart by a small margin. Nevertheless, H2 results in no CO2 emissions.
Nomenclature
abs.
Absolute
A/C
Aircraft
CLMAX
Maximum Lift Coefficient
CoG
Centre of Gravity
CR
Cruise
EIS
Entry Into Service
ESFC
Equivalent Specific Fuel Consumption
EVA
Environmental Assessment tool
FPT
Free Power Turbine
GG
Gas Generator
GGC
Gas Generator Compressor
GGT
Gas Generator Turbine
GI
Gravimetric Index
H2
Hydrogen
DP
Design Point
OD
Off-Design
IATA
International Air Transport Association
LH2
Liquid Hydrogen
LHV
Lower Heating Value
MF
Mass Factor
MTOW
Maximum Take-off Weight
NGV
Nozzle Guide Vane
NMI
Nautical Miles
OPR
Overall Pressure Ratio
PR
Pressure Ratio
SFC
Specific Fuel Consumption
T4
Combustor Outlet Temperature
TOC
Top of Climb
TMS
Thermal Management System
MPS
Multi-point synthesis