
Introduction
Over the last few decades, the rising demand for greater fuel efficiency and performance in civil aviation has continuously shaped the design of aero engines. This shift is particularly marked by a trend toward higher bypass ratios, together with the integration of larger and more flexible fan blades. While these improvements promise enhanced efficiency and reduced environmental impact, they also introduce new challenges. One such challenge is the risk of vibrations induced by transonic buffet. Transonic buffet is a complex aerodynamic phenomenon where a strong shock wave interacts with the viscous boundary layer around the blade surface, inducing large flow separations and periodic self-sustained shock movement. The resulting time-varying pressure fluctuations on the fan blades lead to unsteady aerodynamic loads which, when coupling with the inherent vibration modes of the blades, can potentially lead to mechanical failure. Thus, understanding and mitigating transonic buffet and interactions with the structure are critical in ensuring the reliability, safety, and performance of modern civil aero engines.
From early to mid-2000s, transonic buffet on aerofoils has been investigated intensively using both numerical simulations and experiments. Various numerical methods have been used to this end, ranging from large eddy simulation (LES) (Pazner et al., 2019) and detached eddy simulation (DES) (Deck, 2004) to the most widely used unsteady Reynolds-averaged Navier-Stokes method (URANS) (Brunet et al., 2005; Thiery and Coustols, 2006). Two main explanations for the mechanism have been proposed. The first explanation involves a self sustained feedback loop between pressure waves and the unsteady shock movement (Lee, 1990). In this model, unsteady shock-movement-generated pressure waves propagate downstream from the shock foot towards the trailing edge inside the separated flow area downstream of the shock. Once these disturbances reach the trailing edge, they generate upstream propagating pressure waves. These upstream travelling waves will interact with the shock and sustain the shock wave oscillation by imparting energy. However, the path of the closed loop has not been understood and verified completely. The upstream-travelling pressure waves may propagate along not only the suction side of the aerofoil, but also the pressure side (Deck, 2004; Jacquin et al., 2009) and this may also play a role. The other explanation is based on the global stability theory, such that the unsteady shock movement is triggered by an unstable global mode (Crouch et al., 2009). Although the feedback mechanism and the global instability explanation are often viewed as competing models, in several aspects, the feedback model serves as a physical mechanism through which the global instability is developed.
Transonic buffet has been extensively studied in external aerodynamics. However, there are only very few reports and investigation of the phenomenon in turbomachinery (Majhi and Venkatraman, 2023). Recent experimental investigations, with observed shock oscillations, have contributed to understanding shockwave-boundary layer interaction (SWBLI) in compressor cascades (Klinner et al., 2021). Here, a feedback loop between the disturbances, generated immediately downstream of the shock foot, and a plane upstream of the shock has been proposed as the explanation. A feedback loop between upstream and downstream propagation pressure waves was also identified as the driving mechanism of self-sustained shock oscillations on NASA Rotor 67 (Majhi and Venkatraman, 2023). BR710 fan blade was also studied numerically on its unsteady SWBLI behaviours, at a high-altitude low-Reynolds number operating condition with transition model. Becker and Reyer (2007) Similarly, in numerical studies on a transonic fan operating at high altitude by di Mare et al. (2009), shock-induced laminar-turbulent transition and unsteady shock movement were investigated. The first three of these studies (Becker and Reyer, 2007; Klinner et al., 2021; Majhi and Venkatraman, 2023) were purely aerodynamic, while the last one (di Mare et al., 2009) also evaluated the forcing in the 1F mode but did not include blade vibration.
The aeroelastic interaction between an unsteady aerodynamic instability and the natural vibration modes of a rigid body can lead to non-synchronised vibration (NSV), and it has been studied both experimentally and numerically on simple configurations, such as a cylinder (Hollenbach III, 2022). When the vortex shedding frequency is near to the frequency of the enforced transverse oscillation of the cylinder, the former frequency locks-in to the latter one, the lift coefficient oscillates at a single frequency, this is known as the frequency lock-in phenomenon. The lock-in phenomenon has not been fully studied on fan blades. The ability of the SWBLI to interfere with compressor blade vibration was shown numerically in Heners et al. (2022). A self-induced unsteadiness was predicted on a compressor stator vane, operating in the transonic regime. It was driven by the interaction between the passage blocking shock and the boundary layer at the stator suction side. Although the numerical results showed coupling with blade vibration, this was not investigated further.
Despite the potential importance of shock-induced blade vibrations to safe operation and engine development, there is a lack of public investigations into the phenomenon. The present paper aims to address this by studying transonic buffet and its coupling with blade vibration on a civil fan blade. The research was motivated by vibrations in the 1F mode which were observed during engine development programs at a high-speed operating point. In addition, strain gauge and unsteady pressure data recorded during the event were untypical for flutter, such that flutter was excluded as the root cause for the vibrations. The high-speed operating point and associated high pre-shock Mach number (
Methodology
All computations presented in this work were conducted using the in-house steady and unsteady Reynolds-averaged Navier-Stokes solver AU3D, developed and validated by Imperial College in collaboration with Rolls-Royce over the past 25 years. Its ability to correctly predict transonic separated flows and associated fluid-structure coupling on fans and compressors was demonstrated in the past, for example in Vahdati et al. (2000), Dodds and Vahdati (2015), and Stapelfeldt and Brandstetter (2020).
Aerodynamic modelling approach
AU3D is a finite volume solver, which solves the three-dimensional compressible Reynolds-averaged Navier-Stokes (RANS) equations. Within the solver, all flow variables are discretised on the nodes of a generic unstructured grid. To evaluate numerical fluxes along the grid edges, Roe’s flux vector difference splitting together with the Jameson Schmidt-Turkel scheme (Jameson, 1993) are employed. The solution method is implicit, with second order accuracy in both spatial and temporal domains. No turbulence is injected at inflow. In all simulations presented in this work, the one-equation Spalart-Allmaras (SA) turbulence model (Spalart and Allmaras, 1992) is used to close the equations. The effects of turbulence models are particularly important for simulating transonic buffet, due to the presence of SWBLI and a large separation region. Based on past literature, the SA model is deemed suitable for the phenomenon investigated in the present study (Thiery and Coustols, 2006; Iovnovich and Raveh, 2012).
Aeroelastic modelling approach
The aeroelastic analysis employs a weakly coupled energy method. A fixed amplitude vibration in a given mode shape is prescribed and the aerodynamic damping is determined from the energy input on the blade. In this study, vibrations are prescribed at frequencies near the buffet frequency, then the blade forcing and unsteady pressure amplitude are assessed to identify different scenarios.
The vibration mode shape is computed using an in-house finite element solver and then interpolated onto the CFD meshes. The relationship between the physical displacement
The weakly coupled energy method is considered valid for high mass ratio structures, such as fan blades, and more computationally efficient than a fully coupled approach since the finite element analysis is not carried out at every time step. In addition, the energy methods allows a detailed analysis of the local work input over the blade surface and investigation of the fluid-structure lock-in mechanism. The computational domain (described in more detail later) is a single passage with periodic boundaries, and hence only the 0 Nodal Diameter (ND) mode is modelled in the unsteady simulations. It will be seen that the CFD predicts unsteadiness in a relevant frequency and hence this is not considered a significant constraint.
Validation
Before the solver is used to study transonic buffet on a state-of-the-art fan blade, it is validated on the supercritical OAT15 aerofoil. This test case has thorough experimental data from wind-tunnel tests carried out in the S3Ch test facility (Jacquin et al., 2009). The aerofoil has a chord length of
CFD setups
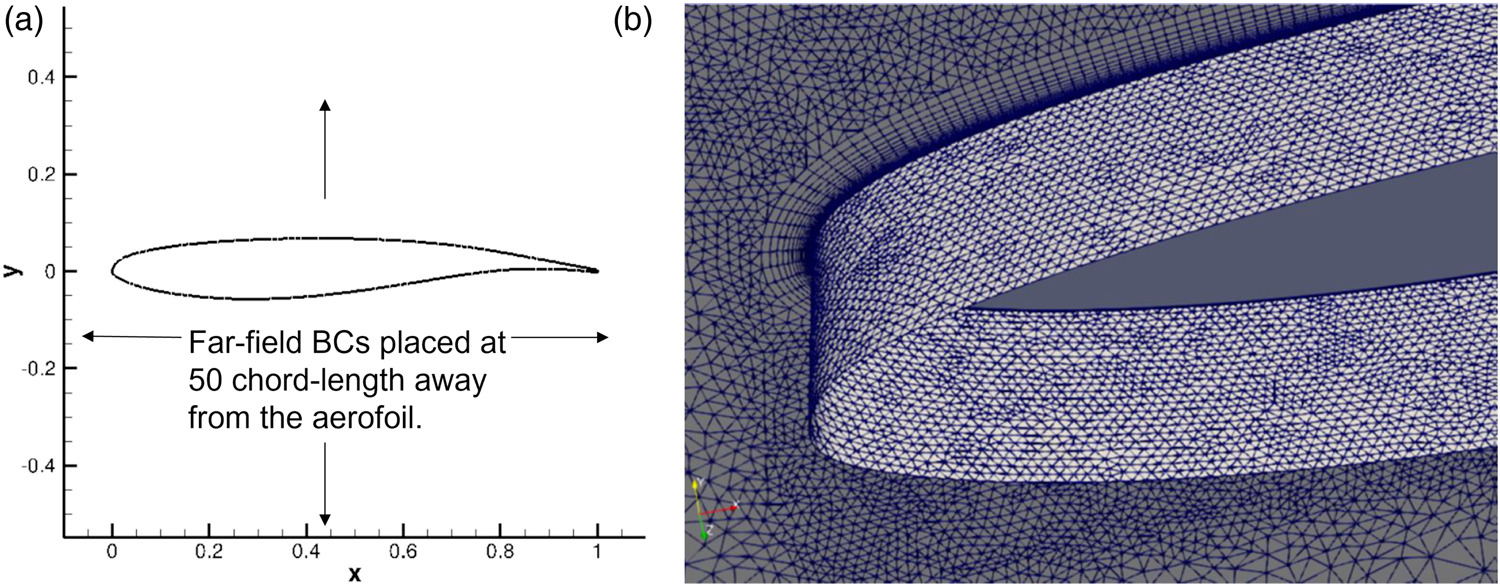
A C-H type flow domain is used in this validation case, the boundaries are placed around 50c away from the aerofoil in all directions to avoid reflections, as shown below in Figure 1. The two-dimensional aerofoil is extruded in z-direction with a span width of
Results
At this experimental buffet onset condition, sustained large-scale periodic shock movement is observed. Figure 2 shows the change in near-wall velocity at the trailing edge
Figure 2.
(a) The near-wall velocity at different time within one buffet period along the OAT15 aerofoil surface, compared to experimental data. (b) The time history of lift coefficient on the aerofoil at incidence angle 3.5∘ with Mach number 0.73.
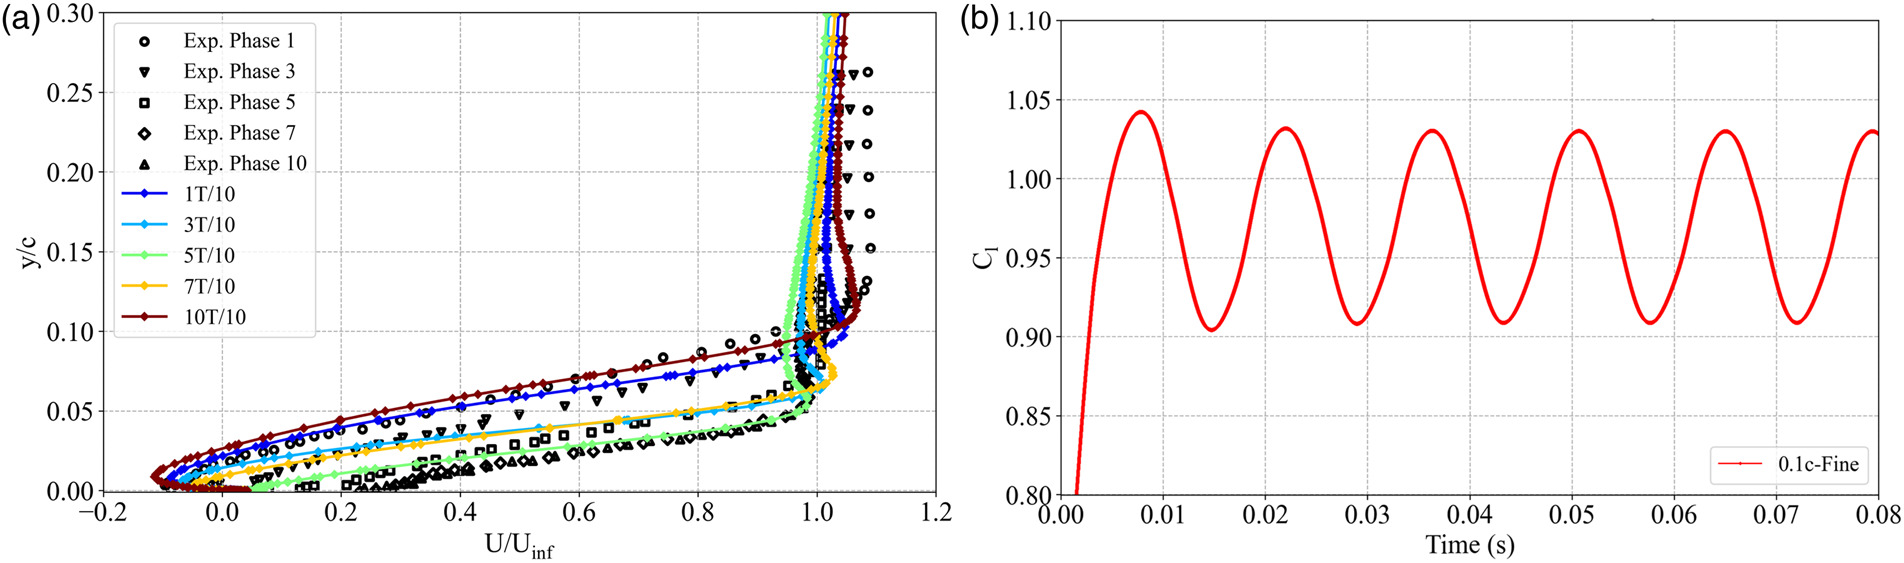
From these OAT15 aerofoil numerical results, it can be concluded that the current flow solver and computational model can predict transonic buffet from SWBLI accurately. Hence, the same turbulence model and similar mesh and time resolution will be employed for the fan blade.
Analysis on transonic fan blade
Test case
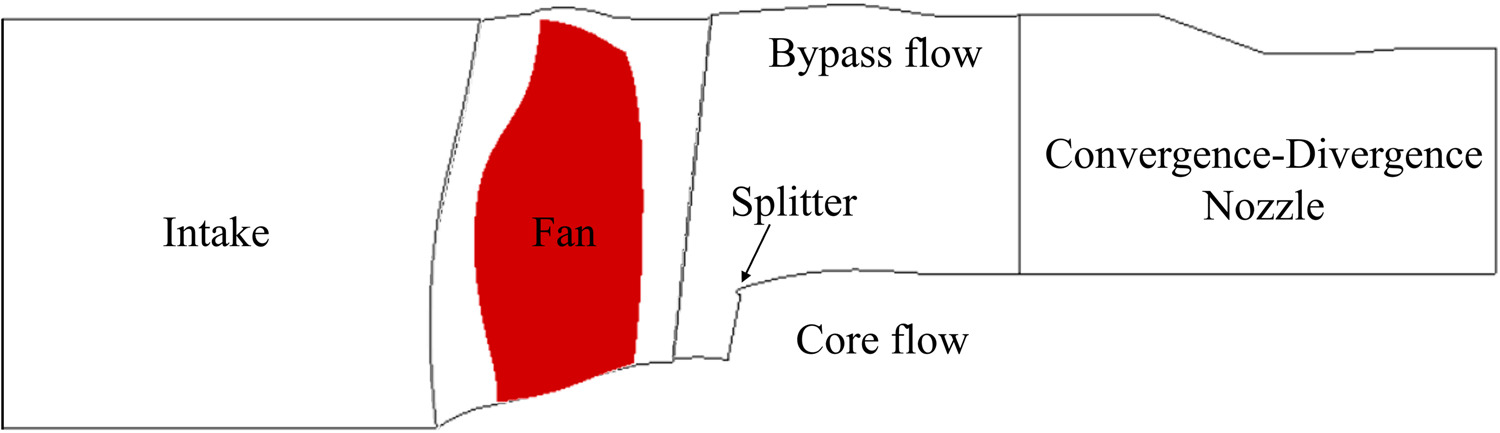
The test case used in this study is a transonic fan blade at high-speed off-design conditions. As shown in Figure 3, the CFD domain includes an inlet duct, a fan blade, a splitter section to split the core and bypass flow, and a bypass duct. A constant tip gap of 0.2% span between the fan blade and its casing is included. A convergent-divergent nozzle is placed downstream of the bypass duct and is modelled as a choked nozzle, hence the exit boundary is independent of the condition imposed at the outlet. The meshes at intake and exit are coarsened to avoid reflections from boundary conditions. To reduce the complexity of the system and computational effort, Engine Section Stators (ESS) and Outlet Guide Vanes (OGV) are not included in the domain, the fan intake is modelled as a generic straight inlet duct.
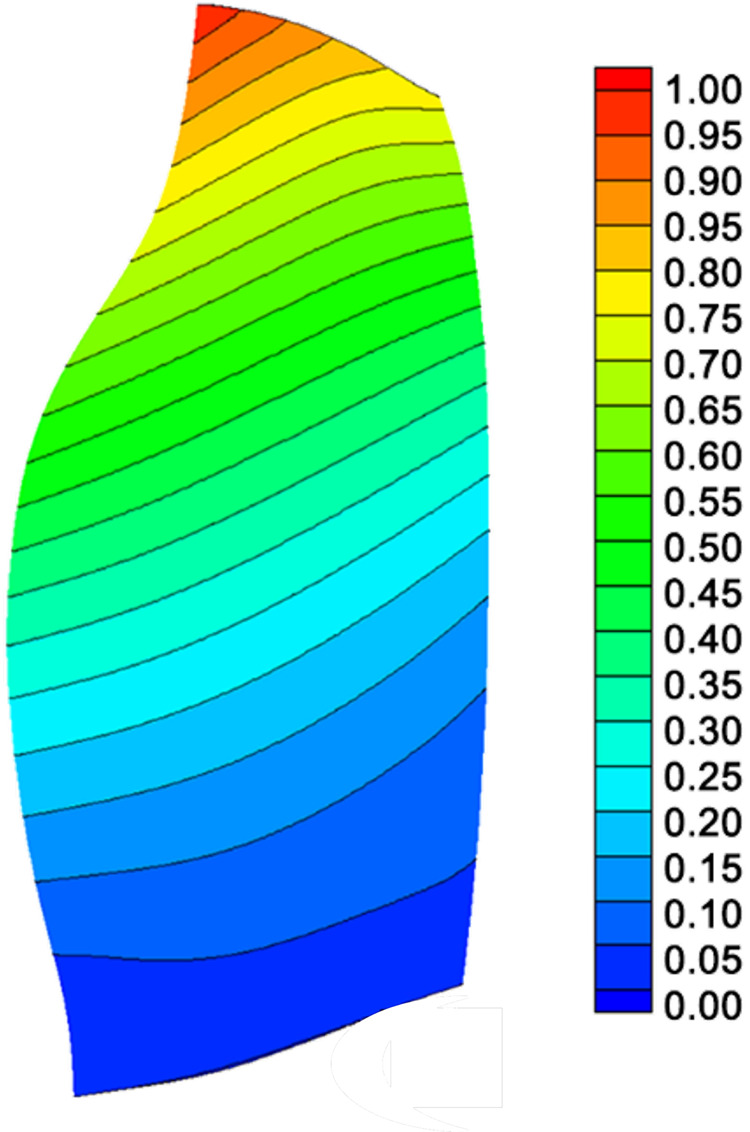
The first flapwise bending mode (1F) of the fan is used when investigating the coupling between fluid and structure, shown in Figure 4. The reduced frequency
The computational domain is a single passage with periodic boundaries for both steady-state and unsteady-state respectively. The boundary conditions at the inlet are assumed as a constant radial profile with a total temperature of 292 Kelvin and a total pressure of 100813 Pascal. A mass flow boundary condition is prescribed at the inlet to the core compressor to control the bypass ratio (BPR), a large off-design BPR is used. The CFD setups, including the blade shape, mode shape, vibration frequency and the boundary conditions, all correspond to the hot geometry at design speed.
Steady-state results
Figure 5a shows the fan operating map, including the characteristics of three constant speed lines and the experimental loci of peak efficiency. Normalisation of the total bypass pressure ratio and the inlet mass flow rate is based on their values at the design point with peak efficiency. Specifically, part of the fan performance map at design speed is compared against the characteristic from literature (Lu, 2020), illustrating a good agreement between the two, such that this alignment validates the current numerical model.
Figure 5.
(a) Fan characteristic map at various speeds, validated against literature. (b) Relative Mach number contour at 90% span, normalised by its maximum value.
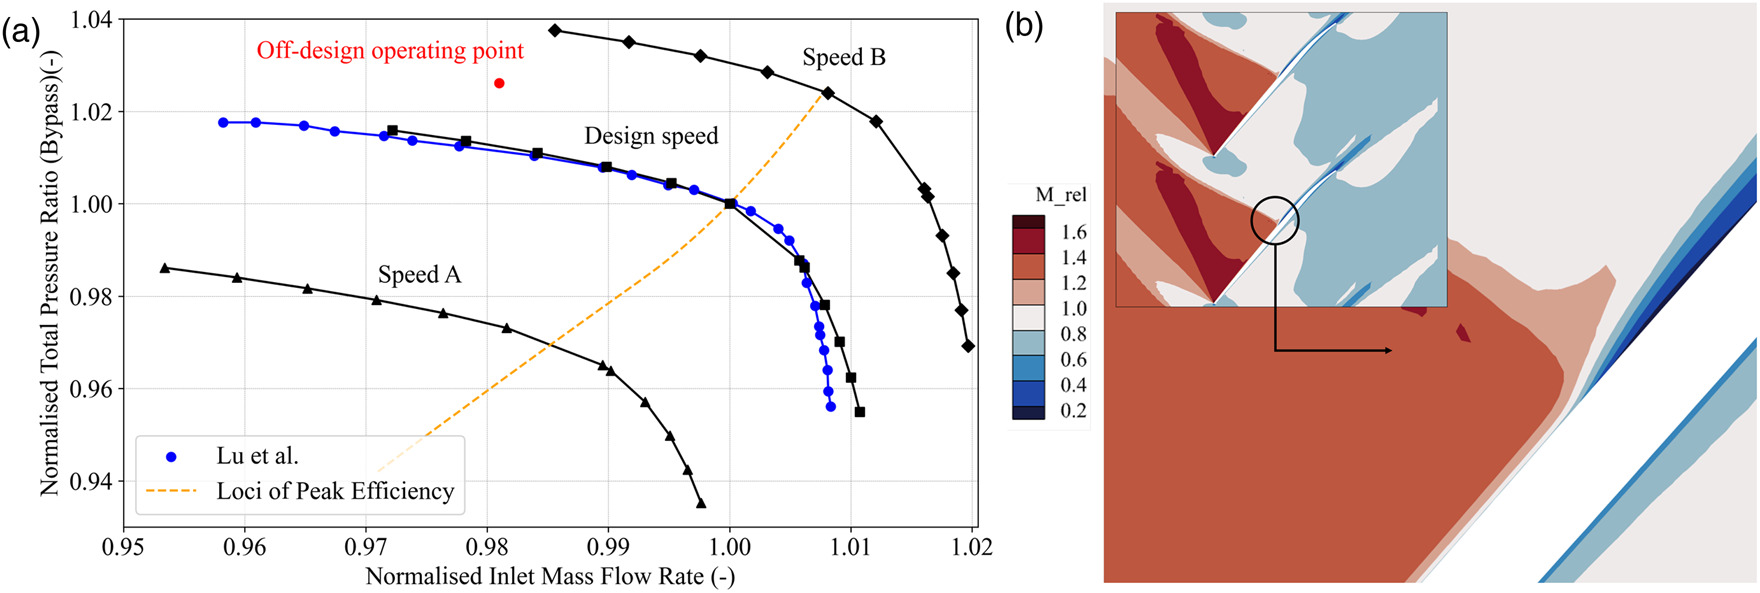
After validating the model against previous literature, the steady-state analysis focuses on the design speed line. Initially, steady RANS simulations are carried out to identify interesting operating regions. Significant periodic fluctuations in flow variables and residuals, and the presence of high Mach numbers are taken as an indicator for transonic shock buffet. These signs were observed near stall with a bypass ratio (BPR) of 12, which is higher than the test operating condition of BPR
Unsteady results
To investigate the characteristics of the shock buffet and its fluid-structure coupling mechanism, an aerodynamic analysis is firstly performed on the shockwave boundary layer interaction without applying any vibration. An aeroelastic analysis is then performed at the same off-design operating condition by including the first flap blade vibration mode.
Aerodynamic analysis
A physical time step corresponding to 900 steps per buffet cycle is used to capture periodicity of the unsteadiness accurately, together with 12 inner iterations per physical time step. Unsteady simulations are initialised with the steady-state solutions. Transonic buffet is seen from the transient solution at design speed with the aforementioned large bypass ratio (BPR
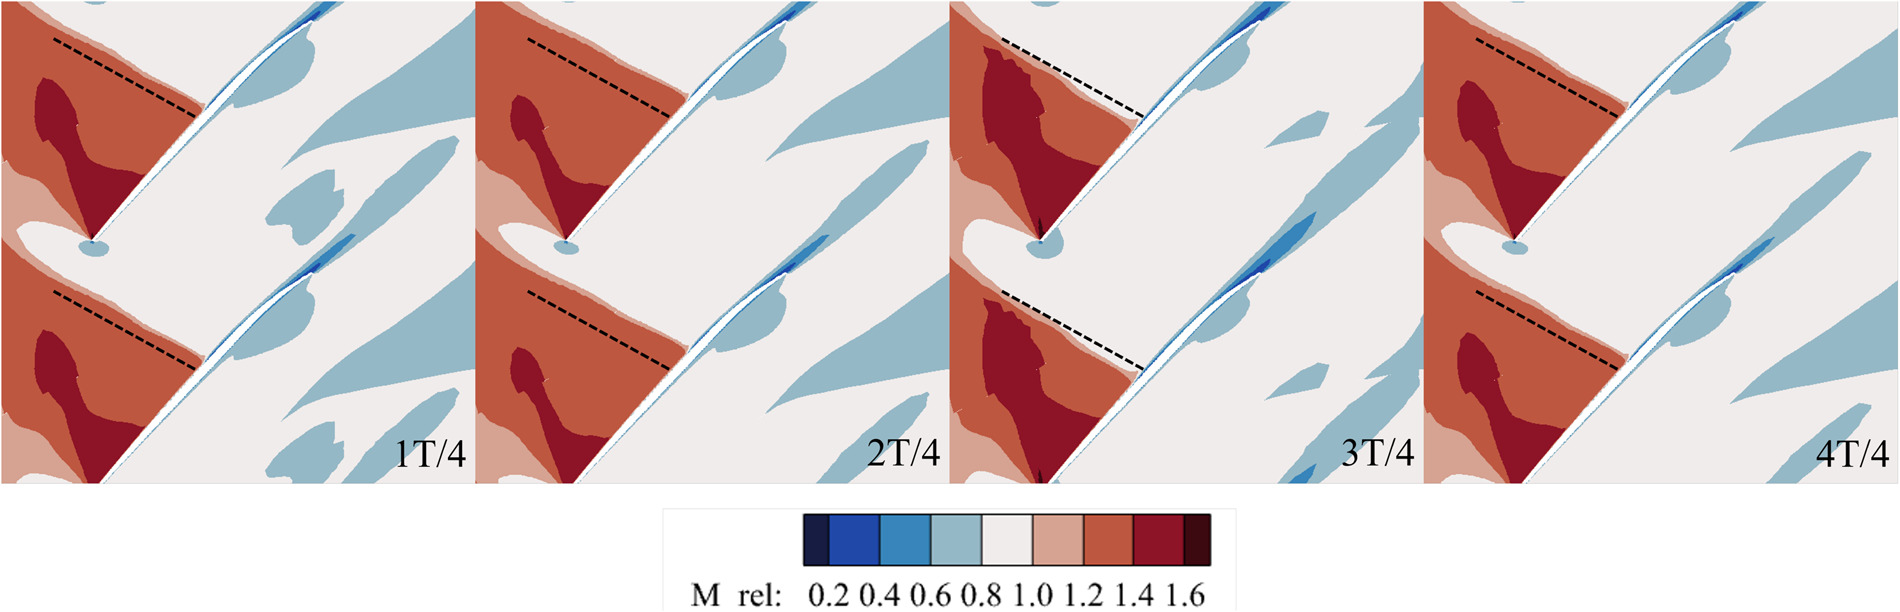
Figure 6.
Snapshots of the flow field over a period of buffet, in terms of relative Mach number at 90% span. The black dashed lines represent the time-averaged shock position.
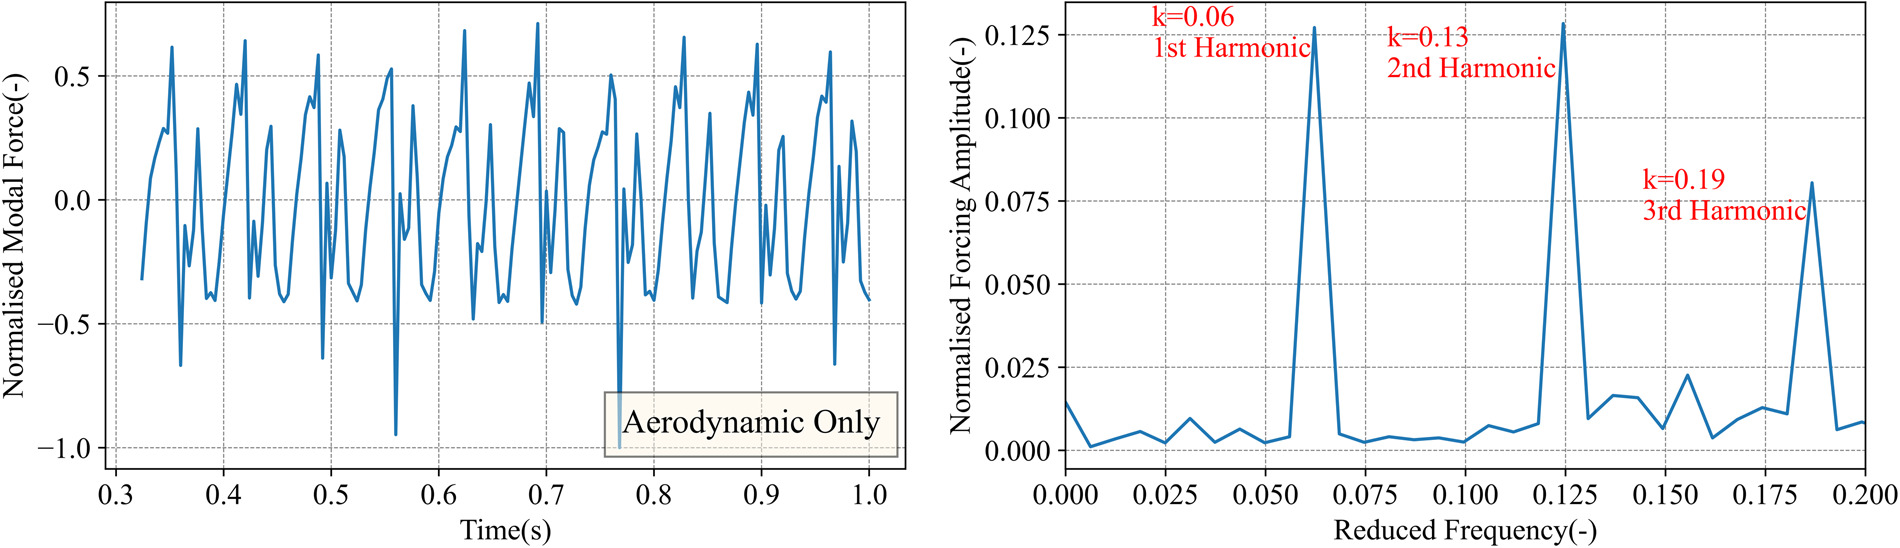
To investigate the forcing on the fan blade, the modal force in the 1F mode is recorded, and the time domain signal is then transformed through a Fast Fourier Transform process. To achieve reliable results, the initial transient part of the signal is removed. Figure 7 shows the time history of the modal force and frequency spectrum. There are three peaks at reduced frequency 0.06, 0.13 and 0.19, corresponding to a fundamental (first harmonic) frequency and its harmonics. Notably, the third harmonic is the same as the natural frequency of the blade’s 1F mode. This shows that there is an aerodynamic unsteadiness which is in resonance with the 1F mode and the likely cause of the vibrations detected in the experiment.
Figure 7.
Time domain modal force response and frequency spectrum from Fast Fourier Transformation for the case with no vibration. Both plots are normalised with the largest absolute modal force value.
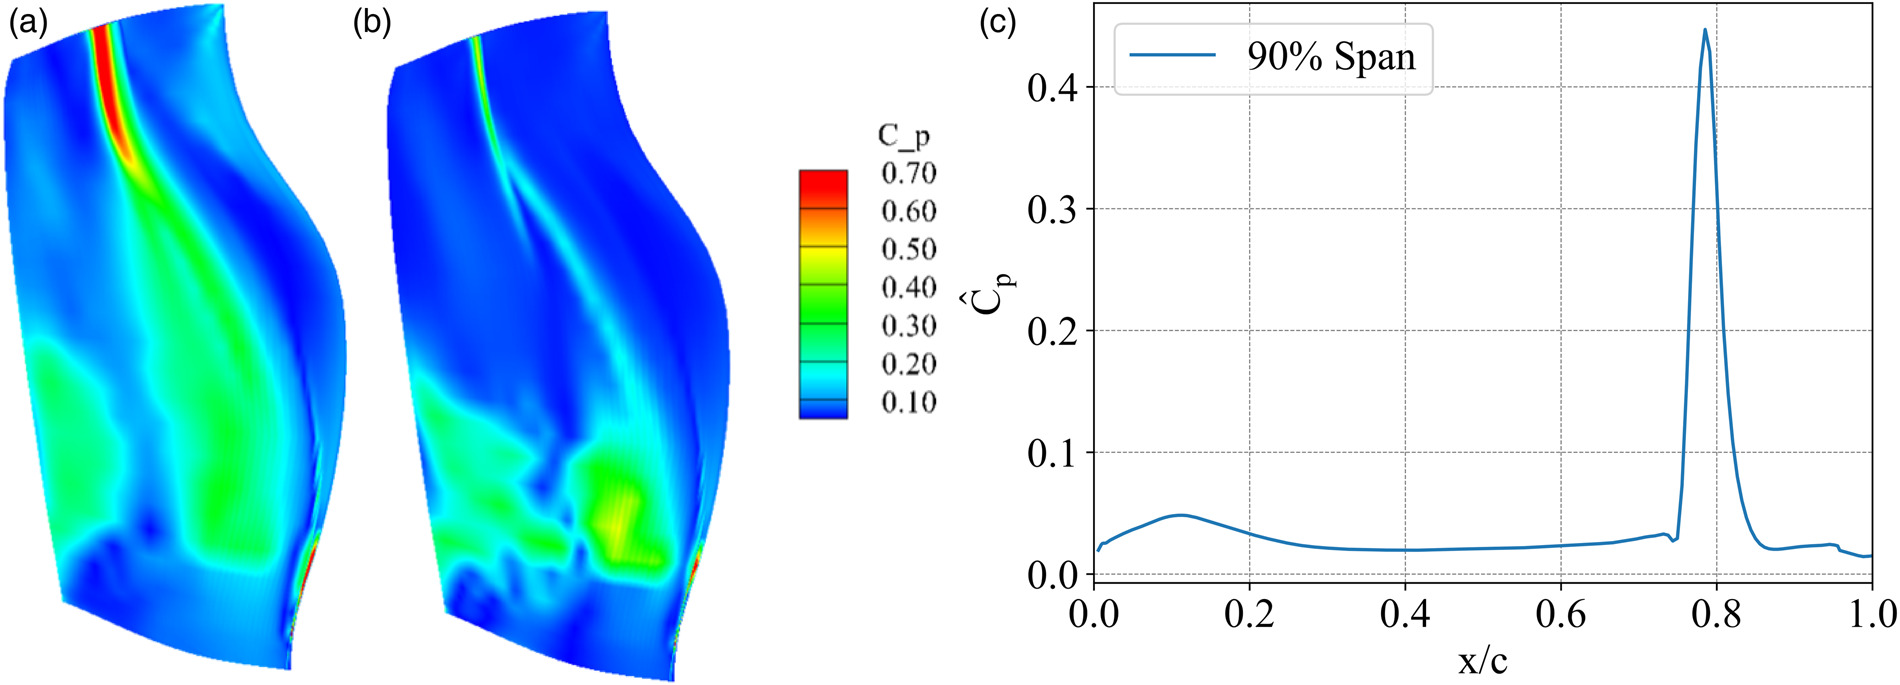
To confirm that this force is caused by the shock motion, the unsteady pressure signal on the blade is Fourier-transformed and the amplitude of the component at the fundamental frequency and third harmonic are shown in Figure 8a and 8b respectively. The unsteady pressure amplitude,
Figure 8.
(a) Normalised blade unsteady pressure coefficient contour of the component at fundamental buffet frequency (k = 0.06 k = 0.19 k = 0.19
Aeroelastic analysis
To investigate how the shock movement interacts with the blade vibration, harmonic mesh movement in the 1F mode is imposed. A tip leading edge displacement amplitude corresponding to 1% chord is prescribed. The blade has a natural vibration frequency of
Figure 9.
Time domain modal force response and frequency spectrum from Fast Fourier Transformation for prescribed blade vibration at k = 0.15 0.19
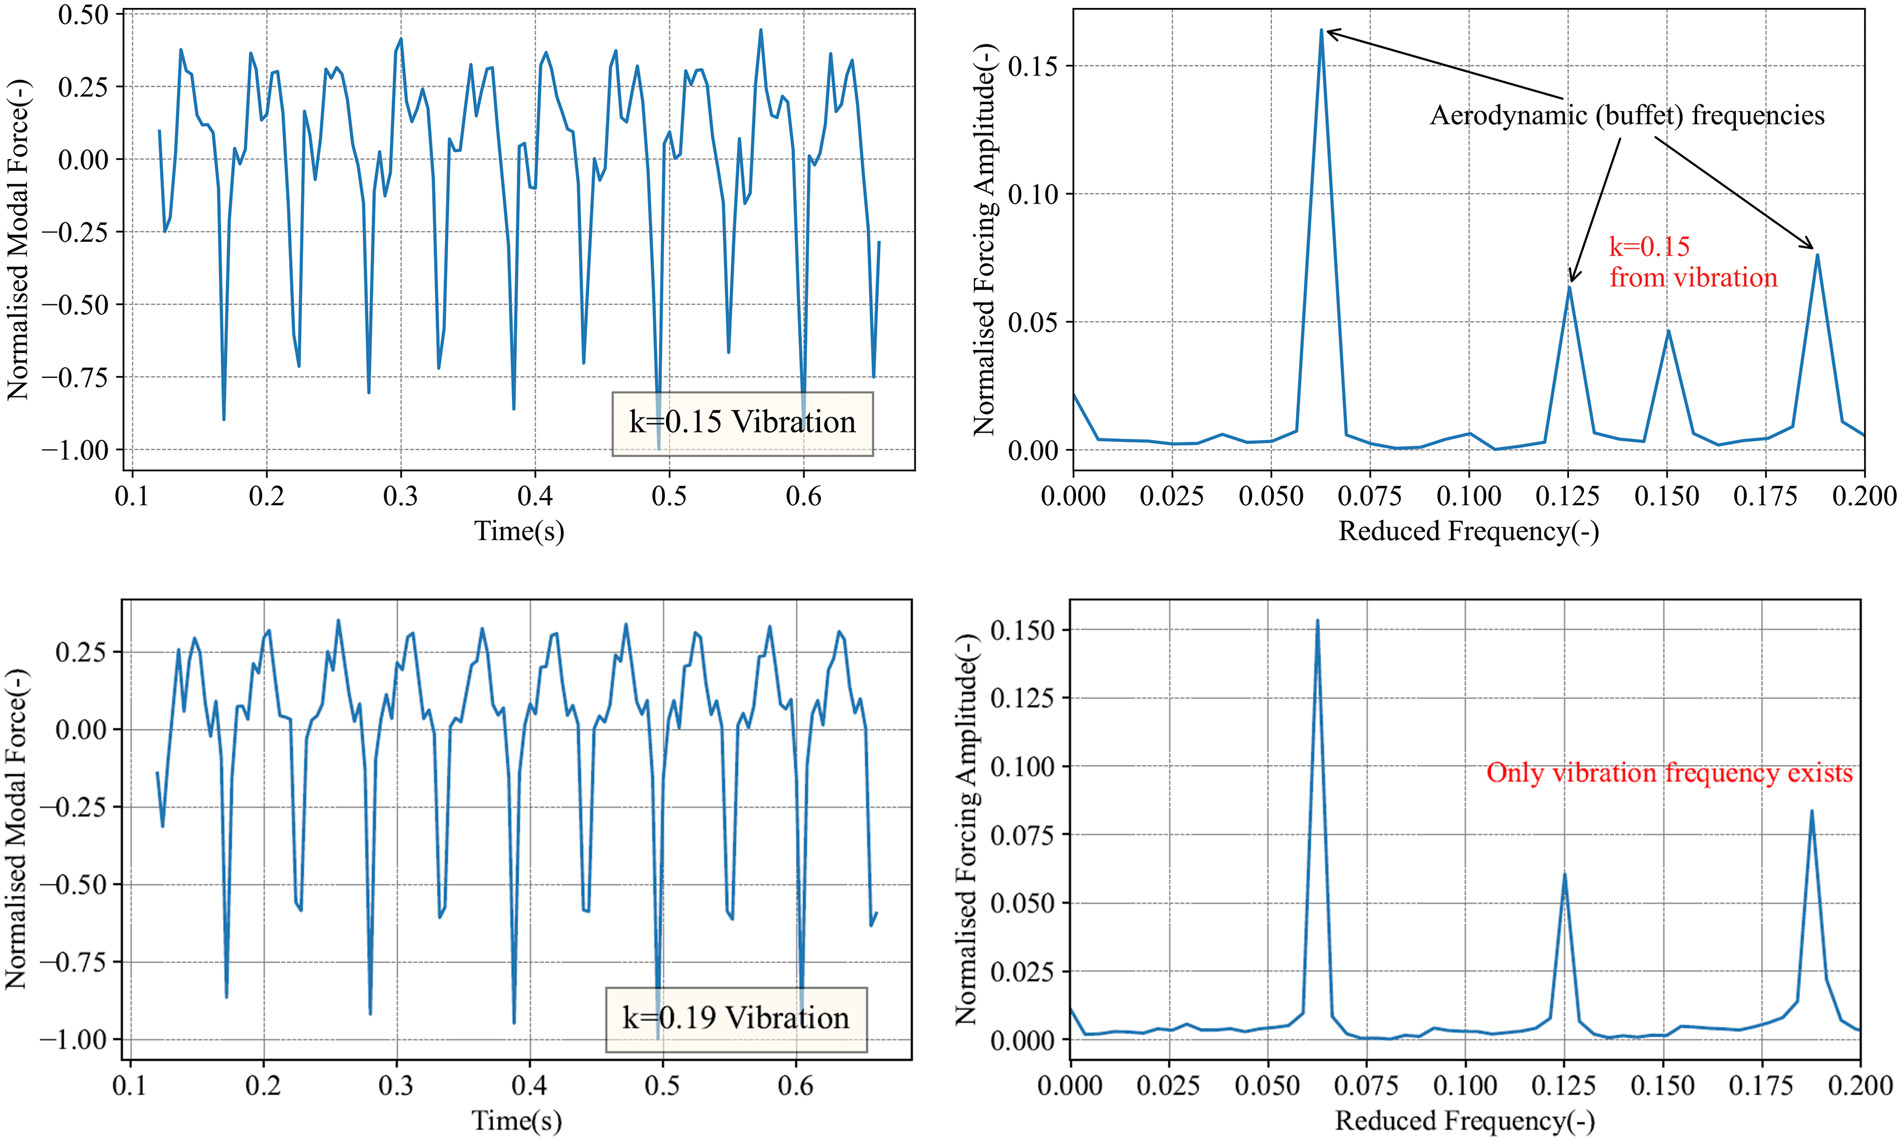
At
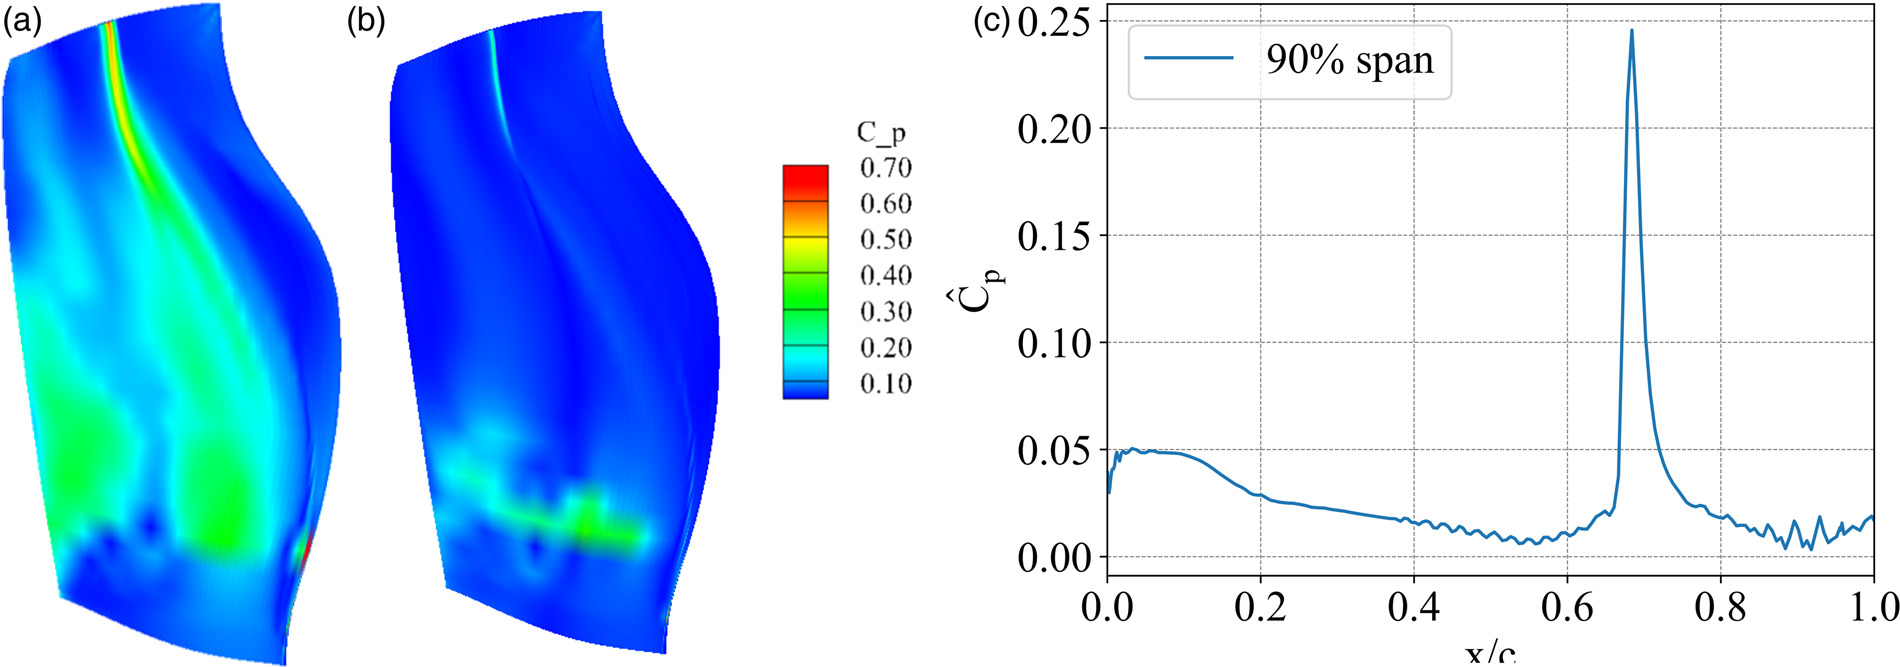
To investigate how the vibration affects the unsteady pressure on the blade, the two cases (
Figure 10.
Prescribed blade vibration at k = 0.19 k = 0.06 k = 0.19
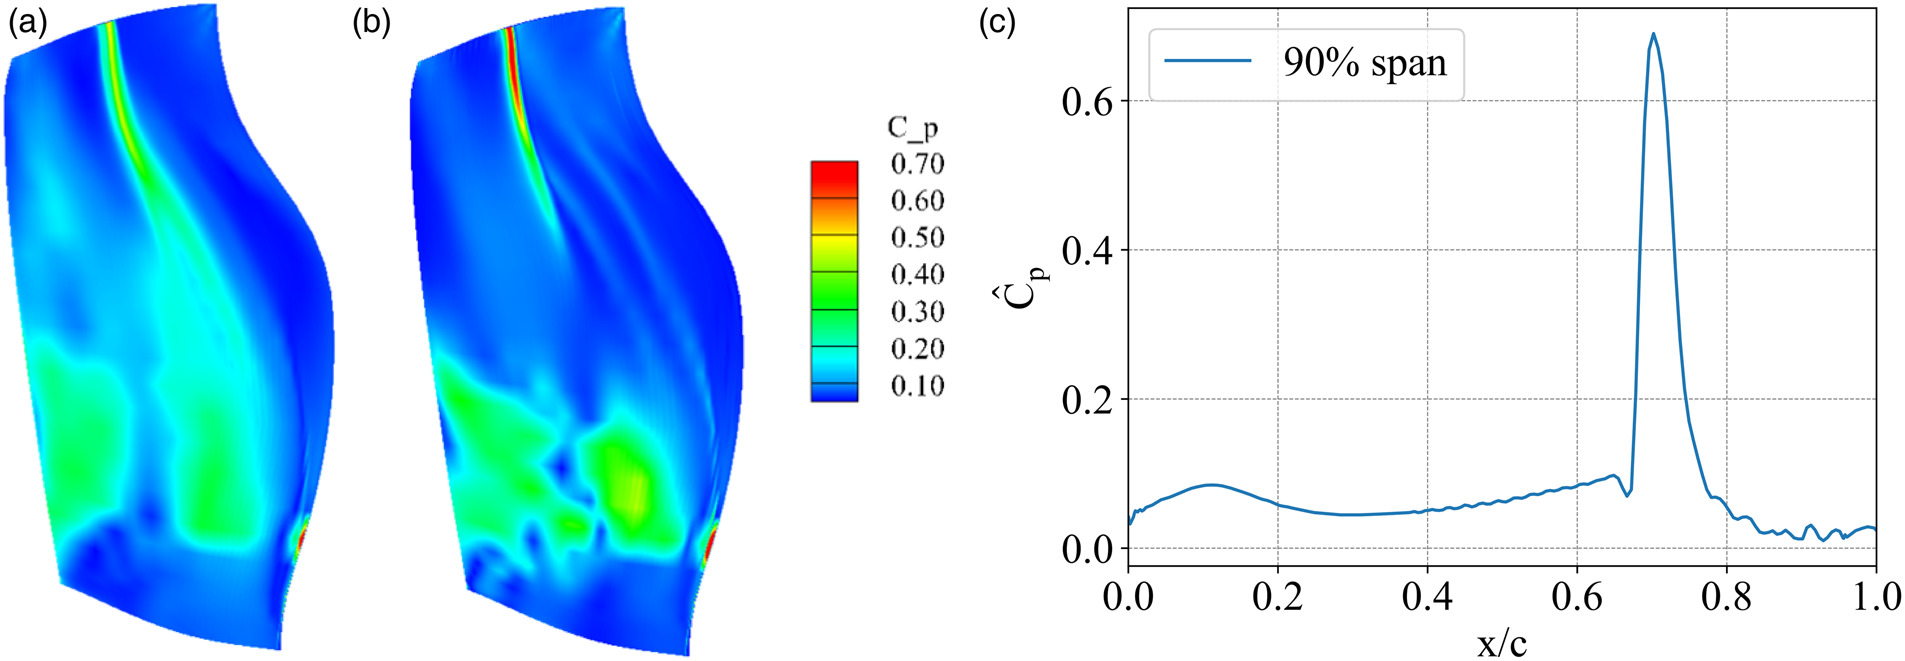
Similar to the aerodynamic-only scenario, the strongest pressure fluctuation occurs near the shock foot at 70% or higher span. However, contrary to previous observations, the unsteady pressure amplitude is significantly greater at the lock-in vibration frequency (
Figure 11 presents the analysis of the unsteady pressure signal on the blade for the unlocked case, following a similar methodology as the other two cases. The normalised pressure amplitude coefficient are taken at the fundamental buffet frequency and its third harmonic frequency. Shock behaviours are compared across three cases: without vibration, with vibration in resonance, and vibration out of resonance. Firstly, by comparing Figures 8c, 10c and 11c, the extent of shock movement is compared. The aerodynamic-only case has a relatively larger shock movement of about 16% chord, whereas the shock moves around 12% chord when in resonance with vibration, and a smaller shock movement of 10% chord when out of resonance, all evaluated at 90% span. Secondly, the strength of the unsteadiness generated at the shock foot is analysed. The in-resonance case demonstrates a 55% increase in unsteady pressure amplitude compared to the no-vibration case, while the out-of-resonance case exhibits the least unsteady pressure amplitude, representing a reduction of 47% of the original no-vibration amplitude
Figure 11.
Prescribed blade vibration at k = 0.15 k = 0.06 k = 0.19 k = 0.19
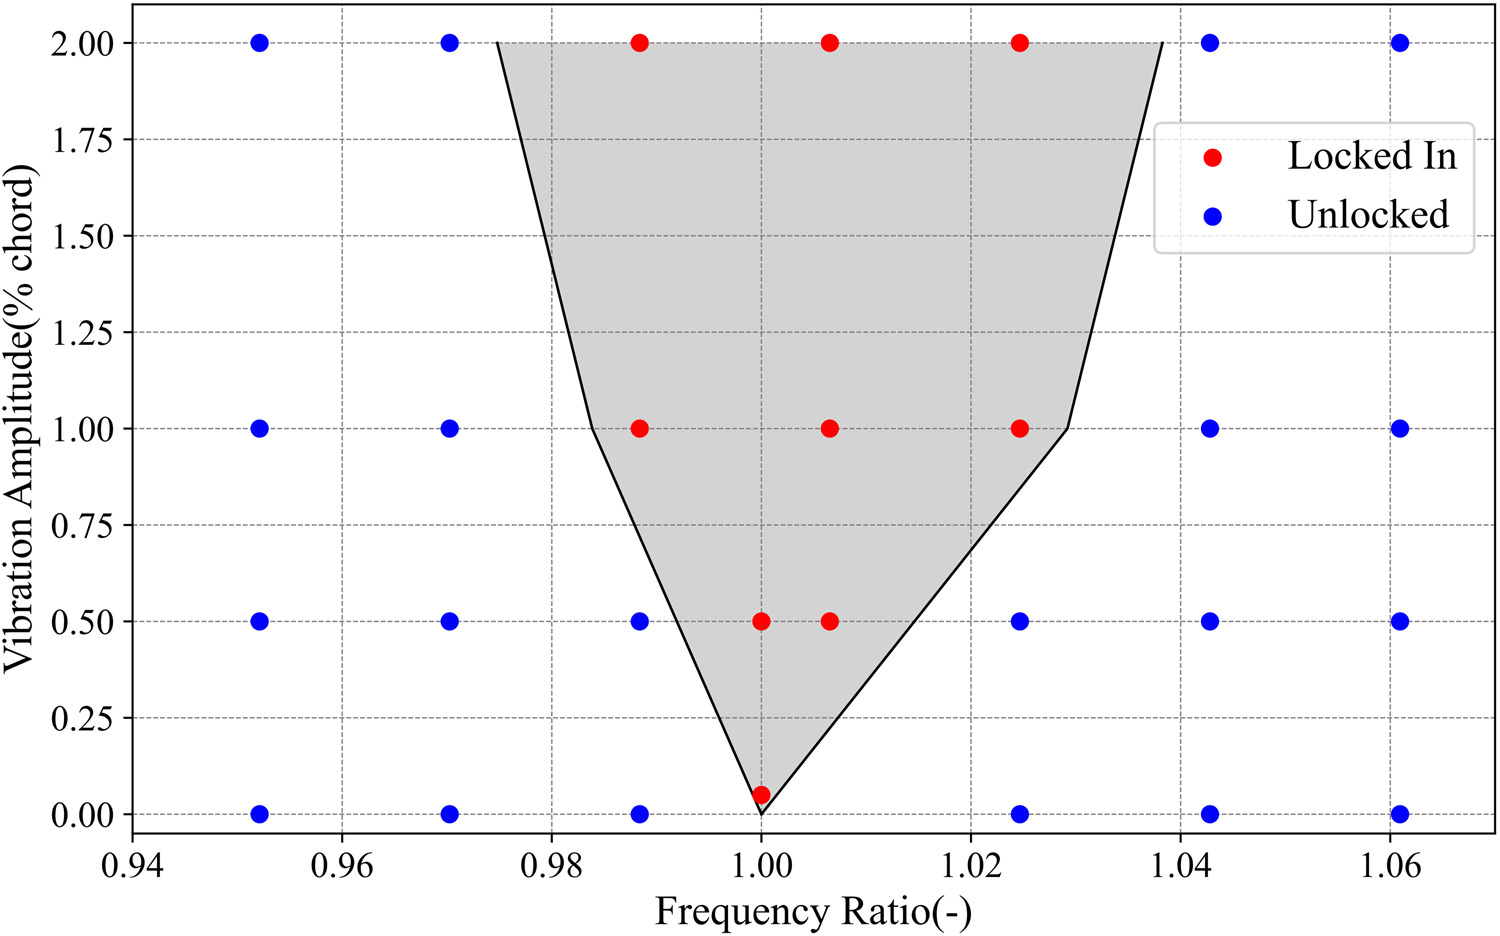
This comparison showed that the vibration changes the shock movement: When the aerodynamic and structural frequencies are close, the dominant aerodynamic frequency shifts to that of the vibration and the associated unsteady pressure amplitude grows. When they are far apart, the vibration restrains the natural unsteadiness of the shock. The coupling between the unsteady shock motion and the vibration is non-linear. A critical vibration amplitude is necessary to influence the shock aerodynamics when their frequency separation is high (Clark et al., 2012). The non-linearity is characteristic of buffeting and differentiates it from aeroelastic instabilities such as flutter, where there is a linear dependency between the vibration amplitudes and resulting aerodynamic forces. Because of this non-linearity and the presence of multiple frequencies in the un-locked state, it is also difficult to define aerodynamic damping.
The potential for the aerodynamic frequency to lock-in with the blade vibration frequency depends on both the frequency separation and the prescribed vibration amplitude (Clark et al., 2012). To explore the lock-in range, a number of vibration frequencies from
Conclusion
An in-house aeroelastic URANS solver was first validated on a benchmark case and then used to investigate transonic buffet on a modern fan blade at an off-design condition with large bypass ratio. The interaction with the first flap vibration mode was investigated by comparing a purely aerodynamic simulation (without blade movement) and aeroelastic simulations with different blade vibration frequencies. The key results are summarised below:
The aerodynamic simulation predicts a lambda shock structure, which is located around 60% chord at 90% span. The shock is unsteady, and large scale shock movement (16% chord) at a fundamental reduced frequency
Fluid-structure coupled simulations show that blade vibration changes the aerodynamic unsteadiness. This is characteristic of the aeroelastic phenomenon known as “buffeting.” When the blade vibration frequency and aerodynamic frequency are locked-in, the unsteady pressure amplitude in the vibration frequency associated with movement of the shock is amplified by 55%. At the same time, the amplitude in the fundamental frequency decreases. Out of resonance, the extent of the shock movement reduces to approximately 10% chord and its amplitude decreases significantly (47% of the aerodynamic-only case).
A sweep of vibration amplitudes and frequencies around the natural aerodynamic frequency produced a lock-in triangle, which is also characteristic of buffeting.
Nomenclature
shockwave boundary layer interaction
unsteady Reynolds-averaged Navier-Stokes
bypass ratio
Spalart-Allmaras turbulence model
engine section stator
outlet guide vane
non-synchronised vibration
chord length
reduced frequency
aerodynamic buffet frequency
blade vibration frequency
Mach number
modal displacement
physical displacement
mode shape vector
pressure
lift coefficient
vibration frequency
reduced aerodynamic buffet frequency
reduced blade vibration frequency