
Introduction
Considering the predictions for 2040 by the European Aviation Safety Agency – EASA for an increase in air transportation in Europe by 42%, compared to 2017, this will lead in a total increase of the operational carbon-dioxide emissions footprint of aircraft by 21% (European Aviation Safety Agency, 2019). Furthermore, according to the European aviation vision for 2050, one of the main goals is to protect the environment and establish the use of sustainable, alternative energy sources (European Commission, 2011). Towards this direction, the electrification of aircraft is one possible and promising alternative. In view of the technological maturity of today and by estimating the technological progress in the next decade, neither are, nor will be batteries capable to provide power for long-haul distances (Epstein and O’Flarity, 2019). Benefits of hybrid-electric propulsion in Unmanned Aerial Vehicles - UAVs and General Aviation - GA classes have already shown 50% and 40% fuel consumption reduction (Friedrich and Robertson, 2014), pointing that the next class to be hybridized should be the commuter class (Wall and Meyer, 2017), since it operates short-haul missions and requires substantially less power than long-haul. Nevertheless, space limitations arise considering the housing of the additional electrical power system. This means that electrical components must be positioned in a way that practicality is ensured, stability is preserved, and structural integrity is not compromised. It is evident that this transition requires significant changes in the full aircraft design process, affecting multiple disciplines.
Multidisciplinary design and optimization processes have been well-established in the field of aerospace for over twenty years. The two most coupled disciplines are the aerodynamic and structural evaluation of the wing. In the work of (Röhl et al., 1995), the scope of the coupling was to find the required structural rigidity of the wing to have the optimum deflection at cruise conditions, using lower-fidelity, code-based tools. Although this lower fidelity framework provides adequate information in the initial design phase, as propulsion system and aircraft design get more complex, higher fidelity tools are necessary to capture phenomena that are neglected in the conceptual design phase.
As technology evolves, more and more high aspect ratio aircraft wings appear, leading to non-linear structural behavior. Classic linear structural analysis methods fail to capture the non-linear phenomena, leading to an under-estimation of the induced stresses at the wing box by 10% (Gray and Martins, 2021). However, non-linear solutions require a substantial amount of time to complete, compared to the simpler, static linear structural analyses, making them impossible to integrate in a multidisciplinary conceptual design and optimization framework. To overcome this impediment (Gray and Martins, 2021) developed a new non-linear structural solver with increased efficiency, increasing the solution time only by 15%.
A different approach in minimizing the solution time is the use of reduced order modeling (Hermanutz and Hornung, 2018), where both static and aeroelastic behavior of a flexible wing are investigated using reduced order methods. By comparing three different methods, i.e., Guyan-Reduction Method, Dynamic-Model-Reduction and Improved-Reduced-System, the latter appears to deliver the most accurate results, but requires the highest amount of time as well. In a similar manner, in the work of (Klimmek et al., 2019), in order to reduce the computational time in their multidisciplinary approach, they integrate a simplified point pass model with panel-method aerodynamics and a condensed structural model, in a common framework called cpacs-MONA that is developed by DLR German Aerospace Center. The reduction of the model size is crucial, as over 1,000 load cases are examined in each iteration of the wing box mass minimization optimization scheme and is achieved by replacing 2-D Finite Elements – FE with 1-D where possible. In more detail, the authors expand their work to examine the structural optimization of the wing box along with the impact of the spanwise position of the engine and the stiffness of the pylon, for an aircraft resembling the Airbus A330 - 200 (Schulze et al., 2021). In that case, the initial model is condensed down from 42.000 to 352 FE entities, using point mass elements to substitute non-structural components. Beam and rod elements are used to model the reference axis of the wing box, the stiffness of the spars and ribs and finally, the engine’s pylon. In addition, interpolation elements are used to transfer all loads to the reference axis. The coupling of the structural and aerodynamic models is achieved with rigid elements. Once again, the reduction of the initial model is necessary, as a design space exploration of over 300 design variables takes place, meaning that it would require months of computational time to complete otherwise.
On the other hand, when less design variables need to be explored, as in the work of (Park et al., 2009), where the total number of variables is 5, there is no need for reduced-order modeling, thus increasing the fidelity of the simulation. In their work, an automated high-fidelity, Multidisciplinary Design Optimization – MDO framework is presented, where both aerodynamics and non-linear structural models are of higher order and exchange data via volume spline interpolation. In that case, the design variables include the aspect ratio, sweep angle, taper ratio, skin thickness and spar flange area. However, the higher-fidelity models are computationally expensive, so to reduce the computational time, the authors use the response surface method (Myers et al., 2002) to substitute the coupled aerodynamic-structural model with a surrogate model. This surrogate model is then connected to the optimizer for fitness evaluation.
In the hybrid-electric domain, the structural evaluation of the wing design gets more complex, as additional components affect the structural integrity of the system. For the case of a large passenger, hybrid-electric boosted turbofan aircraft, the effect of the positioning of batteries on the structural mass of the wing box is examined in (Scheunemann et al., 2020), using the enhanced wing structure mass calculation proposed in (Torenbeek, 2013). It is observed that the structural mass of the wing is reduced as batteries are positioned closer to the tip, as they provide lift relief, when placed far from the root. However, the additional piping and cable weight for the thermal and electrical systems respectively, results in an increase in the total weight, that counteracts on the previous mass reduction. Furthermore, the structural evaluation gets more complex when Distributed Electric Propulsion – DEP is considered. The effect of the spanwise DEP system positioning on the wing bending is examined for a large passenger, transonic hybrid-electric aircraft in the work of (Schmollgruber et al., 2020).
It is evident that many efforts have been made to evaluate the structural integrity of the wing box and that the coupling of aerodynamics and structural evaluation is compulsory. However, since hybrid-electric configurations add complexity to the overall design process, the aero-structural evaluation must be revisited. In addition, each aircraft class has its own certification, which directly affects the design evaluation. Focusing on the 19-seater commuter aircraft class, storage availability for fuel and batteries is an additional constraint, since the wing’s volume is significantly smaller, compared to that of a large transport aircraft. Moreover, design parameters of a commuter aircraft’s wing are different from those examined in the literature review, meaning that the whole model must be revisited. The scope of this work aims to determine the impact of batteries, fuel and hybrid-electric propulsion components positioning inside the wing box, on the structural integrity of a commuter aircraft. An automated computational pipeline is defined to evaluate the design, the envelope of the aircraft’s loads is calculated to control the load cases, and Design of Experiment - DoE, along with optimization methodologies are applied to evaluate the impact of the positioning of spars and propulsion components on the induced stresses. Finally, a mass minimization problem is solved, to find the spanwise thickness distribution of the structure, that satisfies the criteria for a hybrid-electric design, using the well-established Particle Swarm Optimization - PSO approach (Kennedy and Eberhart, 1995).
Methodology
Connection with the in-house sizing tool
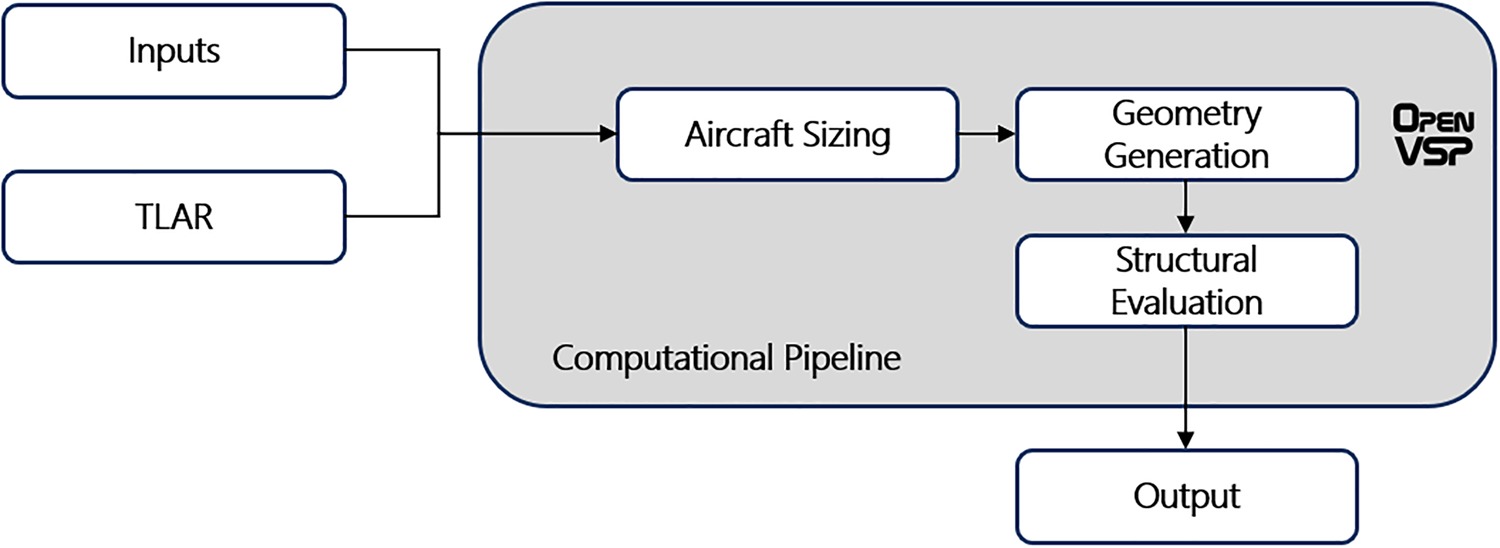
Structural evaluation of the wing box requires an initial geometry for the aircraft. For that reason, an in-house, Python-based aircraft sizing tool is used, that follows the guidelines for conceptual design proposed by (Raymer, 2018). It is a weight-based sizing methodology, that has been modified appropriately to be applicable to configurations that have more than one energy sources, such as hybrid-electric powertrains, and is described in detail in (Nasoulis et al., 2022). It receives an input file containing the Top-Level Aircraft Requirements for the design and performs the aircraft sizing up to a
Structural modeling and process automation
The pre-processing of the structural model is completed in ANSA, a multidisciplinary pre-processing platform from BETA CAE SYSTEMS (BETA CAE Systems AG, 2018). The structural solver used in this work is EPILYSIS, also part of the suite of BETA CAE, that shares a lot of modeling entities with MSc NASTRAN, thus the terminology when describing these modeling entities remains the same. The whole pre-processing of the model is done automatically since ANSA offers a Python API. Common pre-processing actions, along with design variables handling and boundary conditions application are some of the actions executed within this automated computational pipeline via Python scripts. Once the main model is set up correctly, all pre-processing actions are repeated via script in each iteration.
In detail, the structural model of the wing, as shown in Figure 2, is an assembly of parts, consisting of exterior skin, spars, ribs, engine pylon and volume tanks for fuel and batteries. It includes 1-D, 2-D and 3-D elements, but also 0-D elements wherever concentrated masses are applied in the model, i.e., the Center of Gravity – CoG of the engine. The concentrated mass is modeled with a CONM2 element, that requires the mass and inertia tensor as inputs. For that reason, the core of the GT is considered as a solid cylinder with specified length and diameter. The connection of the CONM2 to the rest of the structure is achieved with line elements. An RBAR element is used to account for the rigidity of the core, and PBEAM and PBAR elements, with rectangular cross-sectional area, are used to model the engine’s pylon and the connection to the wing box. The type of mesh selected for the baseline model and the total number of shell and solid elements used, are presented in Table 1. The solid elements are used to represent the volume tanks for fuel and batteries storage, to quantify the available storage volume inside the wing box. According to Figure 2, the purple volume elements represent the batteries storage compartment, placed at the root, whereas the orange volume elements are the fuel volume tank, that is placed between the gas turbine and the tip electric motor.
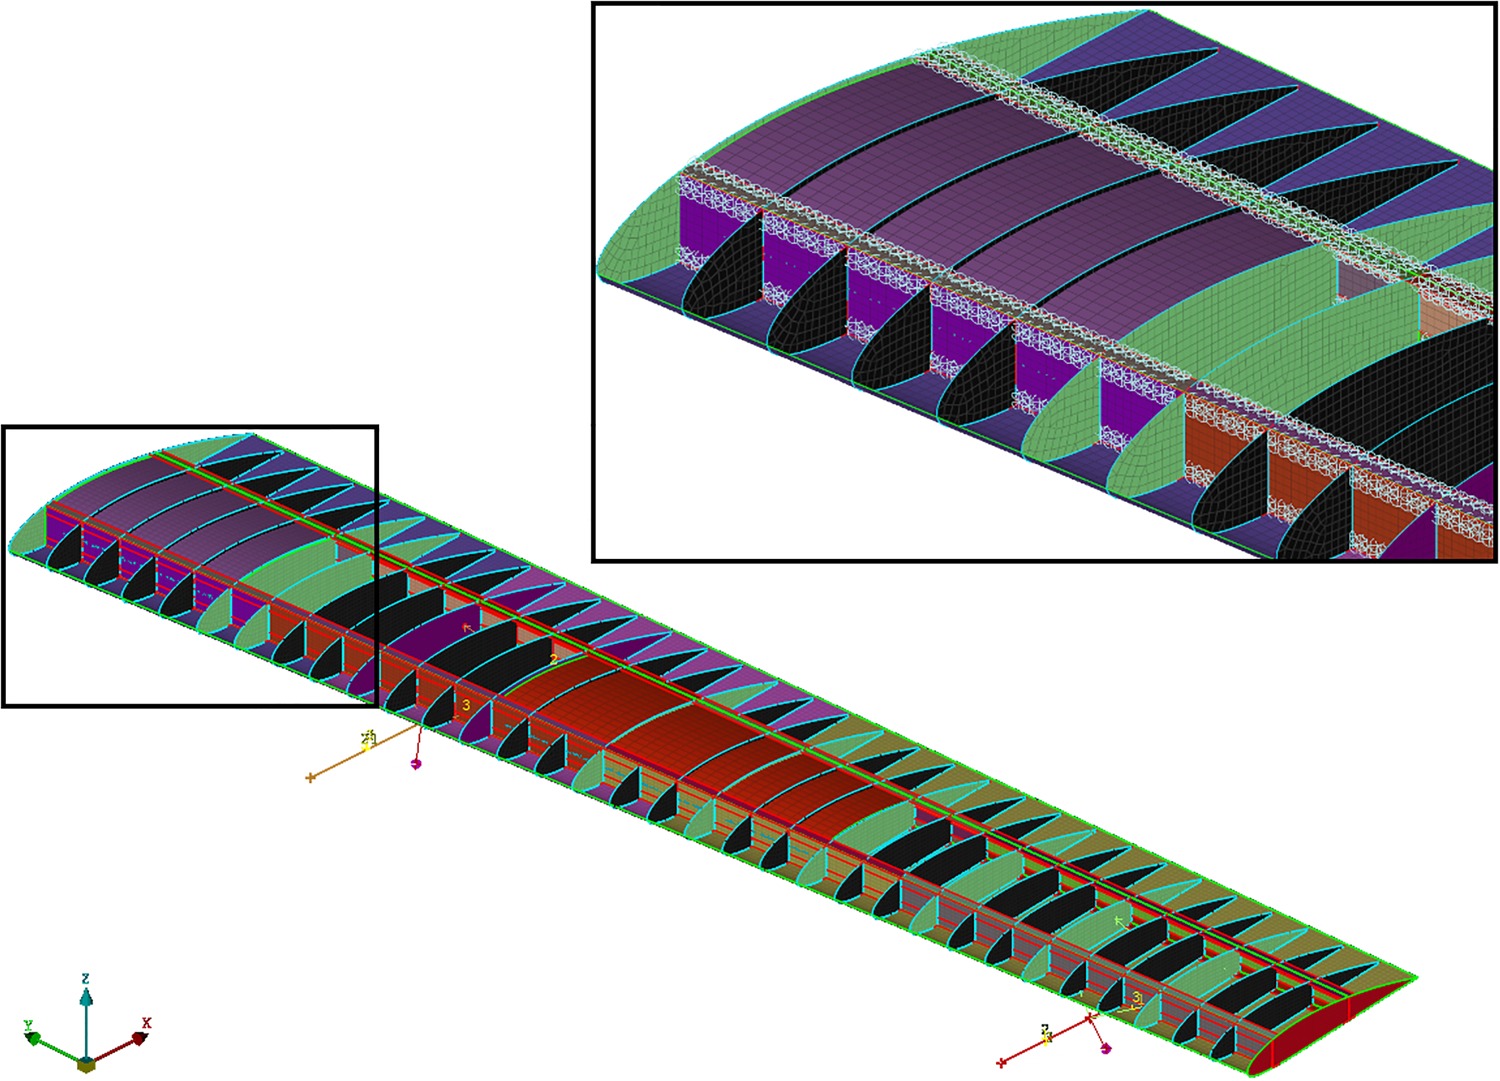
Table 1.
Baseline model mesh information.
| Total shell elements | CTRIA3 shell elements | CQUAD4 shell elements | CHEXA solid elements |
|---|---|---|---|
| 124,806 | 4,229 | 120,577 | 24,000 |
The exterior skin of the wing is connected to the spars with rivets, modeled as NASTRAN CWELD elements. For that reason, spars have flanges, to properly define the connection, which are also connected to the main spar elements with NASTRAN CWELD connection entities. For the sake of simplicity, ribs are connected to spars and exterior skin with pasted nodes, as they do not significantly affect the structural integrity of the model. In a similar manner, 1-D elements representing the pylon assembly, are also connected with pasted nodes to the main structure. Finally, the volume elements of the fuel and batteries connect to the spars with interpolation RBE3 elements, to transfer their inertial load to them.
The acting forces on the wing box are the aerodynamic and inertial loads; the latter exist due to the mass of the structure and its components. The weight of the engine, fuel and batteries stored inside the wing, is calculated in the aircraft sizing tool and provided to the structural model as input. The lift force acting on the wing is distributed spanwise using the approximation proposed by (Schrenk, 1940). The exterior skin is equidistantly split to 66 segments for a more accurate lift distribution. The simplicity of this approximation allows for instantaneous lift calculation, even with the variation of the wing load factor or the dimensions of the wing, in a multidisciplinary design optimization case. For the inertia loads and the weight of the structure to be considered, gravity boundary condition is applied, whereas the distributed lift is applied as force boundary condition. Finally, the spars are clamped at the root, using Single Point Constraints – SPC, constraining the translational Degrees of Freedom – DOF, since the whole model is solved, and applying zero initial displacement.
To calculate the lift force acting on the aircraft, the load factor must be known, which is defined as the ratio of lift over weight, as shown in Equation 1.
This factor varies throughout the mission depending on pilot actions and external parameters, e.g., wind gust loads. The load factor for cruise condition is equal to 1, meaning steady level flight. However, for each aircraft there is a unique envelope dictating the loading limits, according to the design and mission requirements selection. As a result, it is necessary to draw this envelope and define the loading limits the design can withstand. As stated in the CS-23/FAR-23 certification (European Aviation Safety Agency - EASA, 2015; Federal Aviation Administration (FAA), 2016) the structural design envelope of the aircraft must be provided and proof of strength for limit and ultimate loads must be shown. Following the guidelines presented in the
Figure 3.
Combined V-n diagram for a commuter aircraft (VA: Design Manoeuvring Speed, VB: Maximum Gust Intensity Design Speed, VC: Design Cruise Speed, VD: Design Dive Speed).
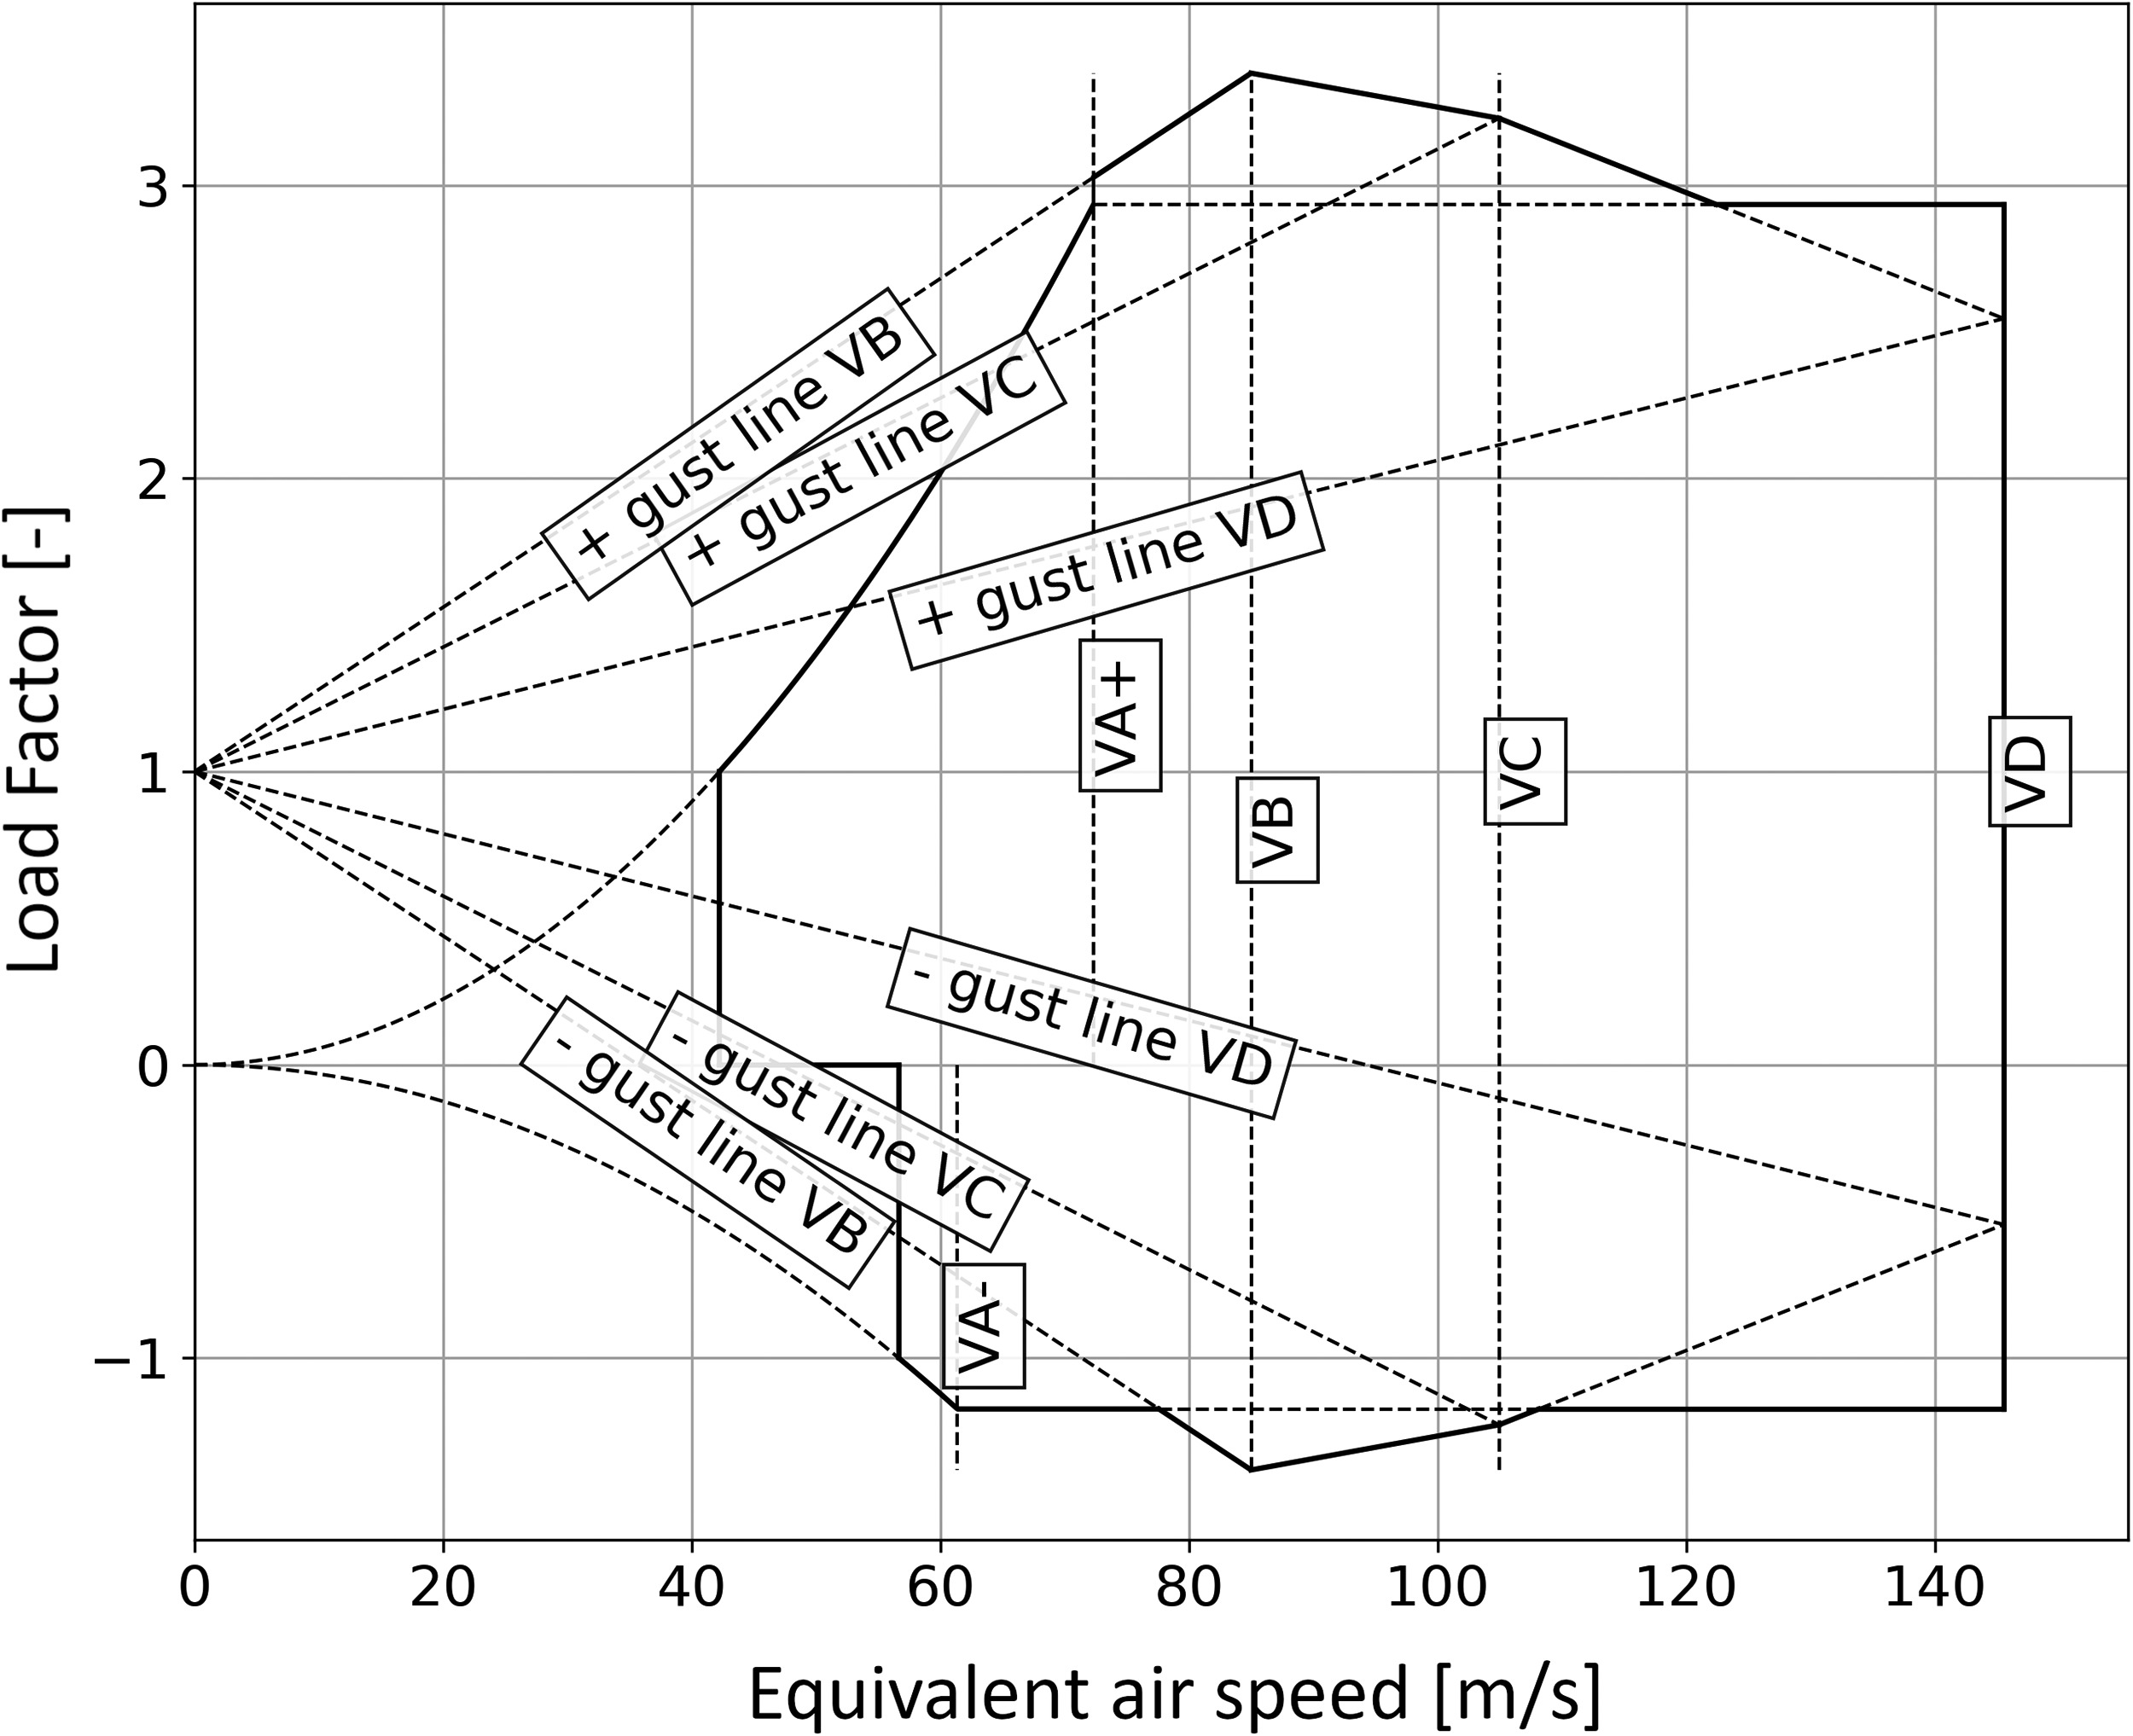
Table 2.
Mechanical properties of widely used aluminum alloys in aviation.
| Alloy | Type | Young’s modulus (GPa) | Tensile stress (MPa) | Yield stress (MPa) |
|---|---|---|---|---|
| 2024 - T3 | Sheet | 73 | 450 | 310 |
| 7075 - T6 | Sheet | 71.7 | 570 | 505 |
| 7150 - T6 | Sheet | 70–71 | 600 | 560 |
| Extrusion | 650 | 615 | ||
| 7055 - T7 | Sheet | 70–71 | 640 | 615 |
| Extrusion | 670 | 655 |
The design variables of this model are divided into positioning variables and thickness variables. Two positioning design variables control the chordwise movement of the front and aft spars -one for each spar-, whereas another two positioning variables control the spanwise location of the propulsion system, that consists of two gas turbines and two electrically driven tip propellers. The translational movement of these components is achieved with the aid of morph boxes, that preserve the connectivity and quality of the mesh and scale the spars accordingly to fit inside the wing, at each time. Other than that, the volume elements that represent the fuel and batteries tanks, are morphed to fit in the resultant space after each translational movement of the spars and propulsion system. Additionally, four thickness design variables for each spar are defined in the model, to control the spanwise thickness distribution, adding up to a total of eight spar thickness design variables. Furthermore, since the spars connect with flanges to the exterior wing skin, their thickness is also a design variable. Different flange thickness is considered for the top and the bottom connection points, leading to a total of 8 flange thickness design variables for each spar. Finally, the exterior skin is divided into three spanwise regions, with different thickness at the top and the bottom surface, increasing by 6 the number of thickness design variables. The total number of design variables is 34, consisting of 4 positional and 30 thickness variables.
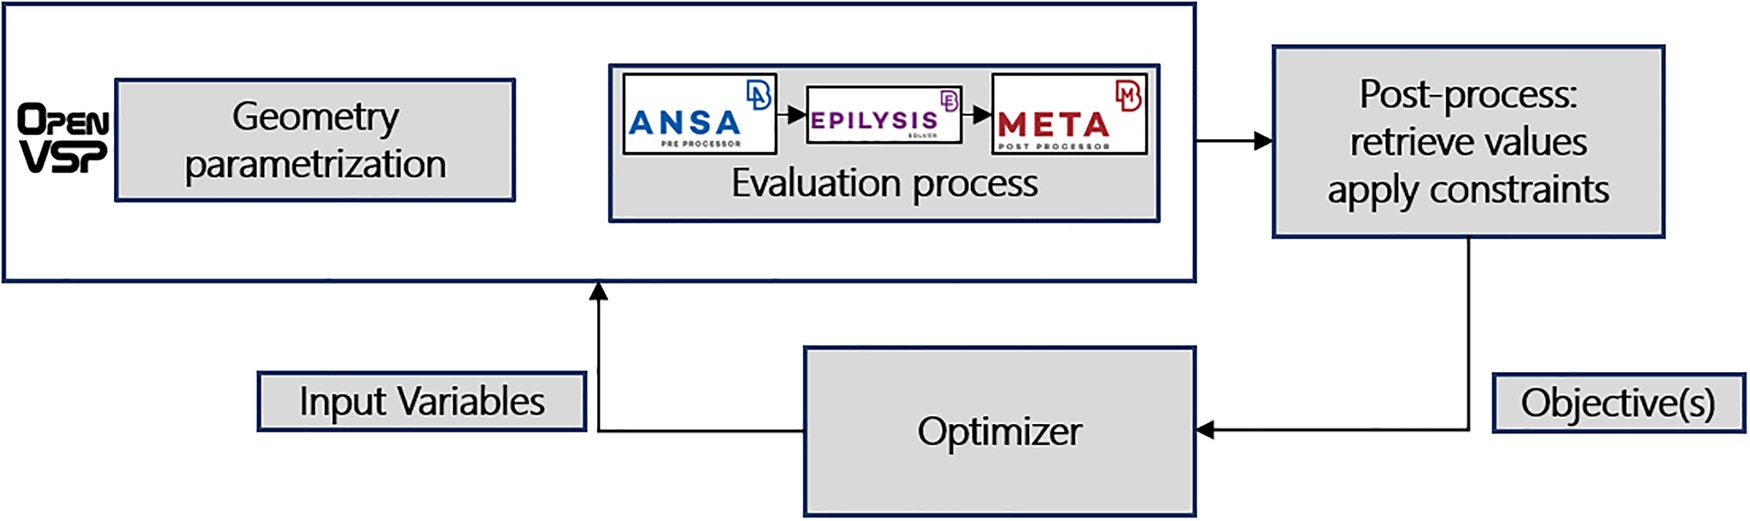
The pre-processing, the evaluation and the post-processing of the structural model, are part of a fully automated computational pipeline, that can be used for Design of Experiment and optimization evaluation, as shown in Figure 4. The Python API in ANSA is used to set up all pre-processing actions, including the update of the design variables at each evaluation iteration. A task manager list is set, that applies the morphing on the positional design variables and then, re-applies the boundary conditions. Subsequently, additional information such as the mass properties of the model, the available volume for fuel and batteries, etc. is exported. Finally, the pre-processing output is passed to the solver. The solution of the problem is a static structural SOL 101 (MSC Software, 2001), completed within EPILYSIS. The produced results are evaluated in META -also part of the BETA CAE suite-, where the post-processing of the model occurs and the required responses of the model, i.e., maximum wing displacement and stresses, are extracted. The only input requirement in this autonomous model evaluation process is the values of the design variables at each iteration, thus it can be used as is in DoE and optimization simulations.
Optimization case
The scope of the optimization of the wing box is to minimize the structural mass. The model consists of 34 design variables, including 4 positioning variables and 30 thickness variables. The constraints applied are mainly stress constraints, considering the ultimate load case condition and the tensile stress limits of the materials. In addition, fatigue constraints are present for the lower skin panels, that must endure tensile cyclic loads, for the 1-g flight condition. Furthermore, the total wing displacement is constrained to be less than 15% of half the wingspan, for the ultimate load condition case. Moreover, the required volume for fuel and batteries storage inside the wing box is an additional constraint of the model.
The optimizer selected in this work is a Particle Swarm Optimizer, that was first proposed by (Kennedy and Eberhart, 1995). It is a simple, gradient-free algorithm that can be applied to a variety of problems effectively. The swarm size selected for this case consists of 20 particles, to reduce the computational cost. The specific implementation of (Bratton and Kennedy, 2007) is followed, as it provides a complete set of information for applying and configuring the optimizer. Furthermore, according to the authors, no swarm size between 20–100 particles produced results under testing, that were superior or inferior to any other value, which validates the previous selection. Moreover, the constriction method is used to balance the global and local searches of the swarm, while the weighting parameters for global exploration and local exploitation of the algorithm, are selected according to the suggestion of (Clerc and Kennedy, 2002), as they are proven to ensure the stability of the algorithm. Finally, the initial swarm for the problem is generated with a Uniform Latin Hypercube – ULH sampling. On the other hand, for the DoE exploration of the design space, ULH sampling method is implemented again, as the algorithm ensures that the set of random numbers produced is representative of the real variability, compared to other random sampling methods. The DoE is essential to determine correlations between the design variables and the model’s responses, information that cannot be provided by the optimizer. These correlations are thoroughly discussed in the Results section.
Results and discussion
Design space exploration
To determine the correlations between the design variables and the responses of the model and gain insights on the model considered later on for optimization, a DoE of 300 samples is explored. The variables under consideration are the 34 ones that were explained in the Structural modeling and process automation section, with 4 of them controlling the positioning of components and the other 30 altering the thickness of the structure. Since 34 variables are a lot to visualize in a single correlation matrix, only the positioning ones are included in the correlation calculation. This selection is because it is essential to focus on the positioning of components, and determine their impact on deformation, available storage volume and induced stress, for a hybrid-electric commuter aircraft. Two correlation matrices are shown in Figures 5 and 6, that show the relationship of the 4 positioning design variables with some basic model responses, i.e., wing deformation, fuel and batteries storage volume, and maximum stress on spars and lower exterior skin.
Prior to examining the correlation matrices, the definitions of the positional design variables must be provided, to understand the relationship of the variables with the responses. The two spar positioning variables allow movement in the chord-wise direction, while the two propulsion positioning variables allow movement in the span-wise direction, according to Table 3. When the spar variables increase in value, the spars move towards the leading edge of the wing, whereas when they decrease in value, spars move towards the trailing edge. In addition, when the gas turbine positioning variable increases, the system moves towards the wing tip, whereas when it decreases, the system moves towards the wing root. The electrical tip fan design variable has the exact opposite behavior from the gas turbine system variable.
Table 3.
Explanation of the positioning design variables movement.
The bounds for allowable movement for the positioning design variables are presented in Table 4. The selection is made with respect to the case topology and is subject to constraints, e.g., the aft spar movement towards the trailing edge allows for adequate control surface area for flaps and ailerons. Regarding upper and lower bounds of the thickness variables, these are not included in Table 4 for the sake of brevity. Thickness can vary from 1 mm to 30 mm, according to the relative position of each structural member in the spanwise direction, with higher thickness values applied towards the root, and lower values towards the tip. In addition, the bounds are modified accordingly, e.g., a structural member closer to the root has lower and upper bounds of 5- and 30-mm respectively, whereas a member closer to the tip has 1- and 5-mm bounds, respectively.
Table 4.
Lower and upper bounds for the positioning design variables.
| Design variable | Lower bound (mm) | Upper bound (mm) |
|---|---|---|
| Forward Spar | −200 | 100 |
| Aft Spar | −200 | 300 |
| GT Position | −200 | 200 |
| EM Position | −150 | 150 |
In Figure 5 the correlation of the positioning design variables with maximum wing deflection and available volume is presented, using the Pearson standard correlation coefficient. By examining the table, it is evident that when the aft spar moves towards the leading edge of the wing, the available volume for fuel and batteries storage strongly decreases, whereas when the forward spar moves towards the leading edge, the volume increases. That is because the aft spar can move up to three times more towards the leading edge, than the forward spar (see Table 4), thus confining the available space. Furthermore, when the gas turbine moves towards to the tip, the volume available for fuel storage decreases, as it is positioned between the electric tip motor and the gas turbine. However, the impact of spars positioning on total wing deflection is not as strong as expected, mainly because the thickness of the structural members poses a higher impact on the total deflection than the positioning, as shown in Figure 6. It can be observed that as the thicknesses of upper and lower exterior skins near the root increase, as well as the thickness of the middle upper skin increase, the total wing deflection decreases, and the correlation value is of the same strength in all three cases. In addition, when the upper exterior skin, closer to the root, increases in thickness, it provides a great stress relief on the aft spar, whereas the same result occurs with the lower skin in the same region and the forward spar. On the other hand, the aft spar thickness, does not affect the total wing deformation, however it affects the induced stresses on both forward and aft spars.
Since the impact of the positioning of the structural members on the total wing deflection remains unanswered, it is necessary to perform another DoE exploration, considering only the positioning variables and assuming a constant thickness for each structural member. A ULH sampling of 100 samples is generated and this time, the impact of spars positioning on the total wing deflection is visible, as shown in Figure 7. The aft spar positioning has the strongest impact on total wing displacement, that when the spar moves towards the leading edge, the total deflection decreases. The second highest correlation value appears on the forward spar, yet it is significantly lower than that of the aft spar. When the forward spar moves towards the leading edge, the total wing deformation increases. On the other hand, the tip electric motor has the lowest. That is because the overall electrical powertrain assembly weighs approximately 100 kg, a total mass unable to relieve the wing bending. Moreover, both storage volumes are strongly related to the total deformation, with the increase of the former leading to an almost linear increase of the latter. This behavior is also present in Figure 5, but the correlation value is almost one third of the value herein, as thicknesses have a grater impact on deformation in the former model. Other than that, the rest of the correlation values of the table are in harmony with those presented in Figure 5, meaning that when both thickness and positioning design variables are present in the model, the thickness variables are the dominant ones.
Figure 7.
Correlation table of positioning design variables with wing deflection and storage volume for the constant thickness DoE.

The impact of the positioning of the structural members and the propulsion components on the induced stresses is presented in Figure 8. When the aft spar moves towards the leading edge of the wing, the stresses of the forward spar and lower exterior skin at the root decrease significantly, whereas the stresses on the spar itself strongly increase, as indicated by the respective correlation values. The same behavior is observed for the forward spar too, but with lower correlation values, compared to the aft spar. All things considered, it is clear that the aft spar is the most important structural member of the wing box, as it has the greatest impact on stress, deflection and storage availability of all other structural components.

Structural model optimization
The structural model of the wing box is optimized to minimize the overall mass of the structure, using an in-house particle swarm optimizer, developed for the purposes of this work. The design variables used in this optimization case are the 34 variables presented in the Structural modeling and process automation section. The number of particles for this 34-dimension problem is set to 20 and the total iterations are set to 300. The constraints of the case are mainly stress constraints, considering both maximum allowable stress values and fatigue. For the maximum allowable stress constraints, the tensile stresses of the materials used in the model are reduced by 5%, since the Von Mises criterion, that is used herein, is less conservative. On the other hand, fatigue constraints apply only on the bottom exterior skin panels, because they withstand cyclic tensile loads. Conventional materials are capable to withstand higher compression loads than tensile, even at cyclic load conditions, thus fatigue damage is more likely to appear under tension. The maximum allowable stress for tension fatigue is 85 MPa, for the 1-g loading condition.
Moreover, volume constraints apply as well, to ensure enough storage capacity inside the wing box. The total fuel and battery masses are known from the in-house sizing tool, and their volume is calculated based on their densities. For Jet-A fuel, the average density is 0.804 kg/l, whereas for the batteries, an assumption must be made. According to the extensive review of (Gkoutzamanis et al., 2021), most batteries technologies have a volumetric specific energy ranging from 250–700 Wh/l, thus a value of 500 Wh/l is selected herein, that is typical for all solid state Li-ion batteries. With the energy specific density in Wh/kg and the mass of batteries known from the sizing tool, the total batteries volume inside the wing box is calculated. For both fuel and batteries volumes, an additional 10% of the calculated volume is considered to account for sloshing barriers for the former and stacking efficiency for the latter. Finally, the maximum allowable wing deformation is imposed, that is 15% of the half wing span, for the 3.35-g loading condition.
The valid cases in the optimization process are 202 of the 300. The constraints are monitored and the frequency that each constraint is violated is recorded. In Figure 9, it is shown that in the 98 violating cases, the constraints that are most frequently not met are the fatigue constraints of the three lower exterior skins. The root has the highest stress concentration of the structure, therefore the violation frequency of the constraint presented in the bar chart is expected. On the other hand, the lower exterior skin at the tip appears to be failing under fatigue more times than the root. That is because, as the objective of the optimization is to minimize the structure’s mass, the tip thickness tends to have values lower than 1 mm, leading to a weaker sheet metal, that fails under fatigue. Furthermore, the fuel volume constraint is violated some of the times, but not as frequently as the fatigue constraints, whereas the battery volume is violated only once. This means that the selected volumetric specific energy of the batteries of 500 Wh/l is adequate for a hybrid-electric commuter aircraft.
The optimization process leads to a 29% weight reduction of the structural mass, as the initial mass of the assembly is calculated to be 1,463 kg, whereas the global best value obtained by the particle swarm optimization is 1,037 kg. According to (Torenbeek, 2013), the wing mass estimated from historical data is described in Equation 2. This equation results in a wing mass estimation of 1,315 kg for the examined case, which is 10% less than the mass estimation of the structural model, before the mass minimization optimization. Compared to the optimized mass, the estimation of Torenbeek is 26.8% greater. However, it should be noted that the lower fidelity mass estimation models, like the one selected herein, do not have the same fit for all wing designs. Furthermore, the higher fidelity structural model does not include the hydraulics for the high-lifting surfaces, the piping for the fuel and heat exchange system and other secondary components, that will increase the overall weight of the wing. The thickness distribution of the structural members of the model are shown in Figure 10. The forward spar has the highest thickness value of 15 mm at the root, the lower thickness of 1 mm is located on the exterior skin at the tip and all other structural members have thickness values within this range.
Conclusions
An automated computational pipeline for the structural optimization of the wing box was presented and applied to a hybrid-electric commuter aircraft. The structural model of the wing had 34 design variables and 124,806 finite shell elements including spars, ribs, flanges, and the exterior skin of the wing. Moreover, the pylons of the propulsion system were considered, as well as solid elements for the fuel and batteries storage compartments. The V-n diagram was calculated to define the maximum loading case scenario for the structural analysis. The pre-processing, the evaluation, and the post-processing of the results -all being parts of a fully automated procedure- were executed via Python script. This procedure was used in both in Design of Experiment exploration, with Uniform Latin Hypercube Sampling, and optimization, using an in-house Particle Swarm Optimization algorithm. It was observed that the aft spar had the greatest impact on stresses, wing deformation and storage volume constraints, especially in the case where the thickness of the structural members remained constant. When both thickness and positioning design variables existed in the structural model, the former were the dominant ones and had a greater impact on stresses and total wing displacement. In addition, the increase of the storage volume inside the wing box led to an increase of the total wing deformation, meaning that a compromise between available storage and maximum deflection had to be made. Total deflection was also controlled by the thickness of the exterior skin and decreased with the increase of thickness. On the other hand, an increase in spar’s thickness had a greater impact on stress relief, than in the reduction of the overall deformation of the wing box. However, this led to a direct relationship between total structural mass and deformation, as increased thickness means more mass. Finally, by solving the total mass minimization problem, the overall weight of the structure was reduced by 29%, compared to the initial model.
Nomenclature
Variables
Aspect Ratio (−)
Span (m)
Wing deflection (mm)
Lift (N)
Maximum Take-Off Mass (kg)
Maximum Zero Fuel Mass (kg)
Load factor (−)
Reference Area
Thickness
W
Chord-wise spar relative position
Span-wise relative position
Taper ratio
Von Mises stress
Structural Parameter