
Introduction
Experimental investigations on turbine and compressor cascades are essential for the validation of numerical setups and to develop improved numerical models to enhance the prediction accuracy of flow phenomena. Measurements on cascades in particular are necessary to give information about real profile losses and performance of new blade designs. Recently, numerous research projects are focusing on high-speed turbomachinery profiles because of the benefit arising from increasing the spool speed especially in low pressure turbines of aircraft engines. Therefore, five-hole-probes (5HP) are in general well-suited to determine the desired flow quantities. But a major challenge of using such intrusive measurement techniques is the sensitivity of the flow to a change in static pressure, especially in transonic flow regimes (Fransson et al., 1988). Hancock (1988) showed theoretically that the sensitivity measuring the true static pressure has to be zero at Ma = 1. This constraint was affirmed in several experimental investigations, e.g. (Langford et al., 1982; Fransson et al., 1988; Kost, 2009). On the contrary, non-intrusive measurement methods, e.g. particle image velocimetry (PIV), feature the benefit of causing less flow perturbations. In fact, the use of PIV in high-speed flows has been successfully demonstrated in many cases. For example, Sartor et al. (2012) investigated a shock-induced separation over a bump and achieved good agreement with other investigations from literature. From 300 µm above the wall up to the free stream region the measuring field covers the whole subsonic and low supersonic flow regime up to 420 m/s in one camera frame. Another example is given by Klinner and Willert (2013) for the use of PIV in a cascade wind tunnel with a transonic compressor profile featuring a detached passage entry shock wave at the leading edge. Therein, the relaxation time of the tracer particle in the flow was small enough to determine the shock wave position in accordance to Schlieren images. However, one drawback of most optical measuring techniques is the lack of high accuracy information about the thermodynamic state of the flow field, which is why measurements with pneumatic multi-hole-probes are common practice and still beneficial for turbomachinery applications (Raffel et al., 2007).
The experimental investigations presented here focus on a two-dimensional midspan wake flow of a transonic turbine profile with high subsonic exit flow Mach numbers close to unity. In order to evaluate the comparability between intrusive probe and non-intrusive optical measurement methods in this highly sensitive flow regime, pneumatic wake traverses with a five-hole-probe were compared to planar (2D2C-)PIV measurements focusing on the potential interactions between the measurement setup (i.e. the probe and its support) and the exit flow field of the turbine cascade. Most investigations lack this information about the influence of the probe on the flow field and comparisons of intrusive and non-intrusive measurement techniques are rare. Veerman et al. (2004), for example, investigated the wake vortex system downstream of an aircraft wing with a high lift device by the use of stereoscopic PIV and a traversable rake consisting of ten five-hole-probes. The change of the flow field by the introduction of the probe rake including its support was well recognizable in the PIV velocity field at a free stream velocity of about 60 m/s. However, the quantitative velocity results for this low-speed case were still in good accordance to each other. It has to be investigated, if the same agreement can be demonstrated in high-speed flows close to Ma = 1, which is the objective of the work presented here.
Experimental setup
High-speed cascade wind tunnel
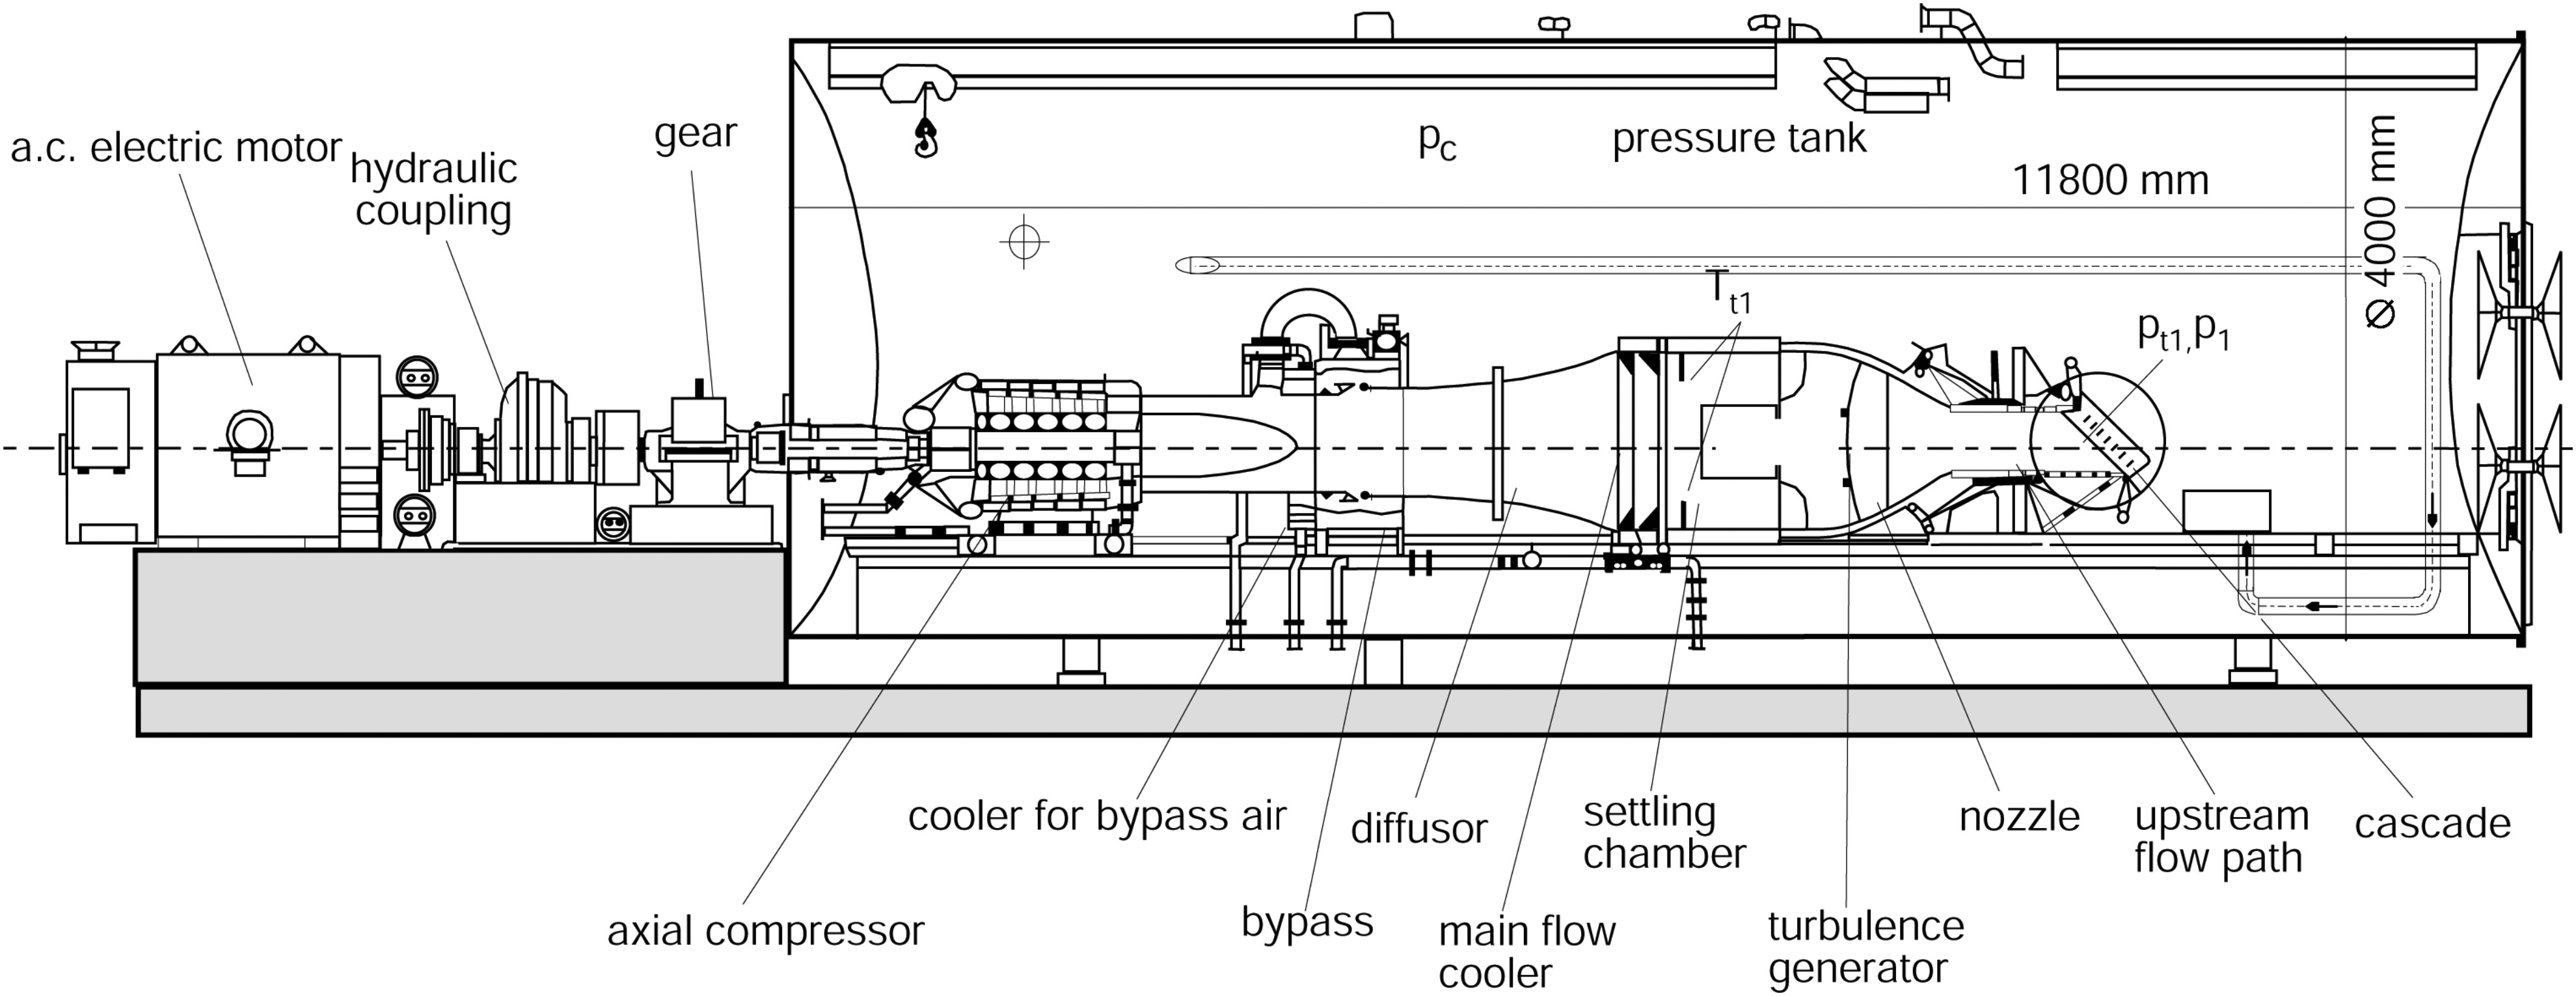
The experimental investigations presented in this paper were carried out in the High-Speed Cascade Wind Tunnel (HGK) at the Institute of Jet Propulsion (ISA) of the Bundeswehr University Munich. The test facility shown in Figure 1 is an open loop, continuously operating wind tunnel with an open test section optimized for linear cascades. The wind tunnel is placed inside a pressure tank of 11.8 m length and a diameter of 4 m. The wind tunnel flow is supplied by a six stage axial compressor with an adjustable bypass for stall prevention enabling a compression ratio up to 2.14. The driving unit for the compressor is placed outside the tank and consisting of a 1.3 MW a.c. electric motor, a hydraulic coupling and a gear box. Finned coolers downstream of the compressor outlet compensate the heat of compression and regulate the desired ambient temperature. Flow straighteners and a settling chamber follow the cooler to obtain uniform flow conditions before the flow is re-accelerated within a nozzle towards the flow path upstream of the outlet where the cascade is placed. The rectangular flow path downstream the nozzle is 300 mm wide and the height can be adjusted from 250 to 500 mm. Furthermore, different turbulence generators can be inserted into the nozzle to vary the turbulence level. Since the ambient pressure in the vessel can be reduced down to approximately 3.5 kPa by two vacuum pumps, the Reynolds and Mach number can be varied independently to achieve realistic turbomachinery conditions, which makes the facility unique among very few comparable facilities world wide. Important parameters of the operating range of the wind tunnel facility are given in Table 1. For more detailed information the reader is referred to Sturm and Fottner (1985).
Table 1.
Operating range of the High-Speed Cascade Wind Tunnel test facility.
| Reynolds number | 2·105 m−1 ≤ Re/l ≤ 1.6·107 m−1 |
| Mach number | 0.2 ≤ Ma ≤ 1.05 |
| ambient pressure inside the tank | 3.5 kPa ≤ pc ≤ 1.2 MPa |
| free stream turbulence level at the inlet plane | 0.4% ≤ Tu1 ≤ 7.5% |
The operating point of the turbine cascade is defined by the theoretical exit flow Mach and Reynolds number (Ma2,th, Re2,th) assuming an isentropic flow through the cascade. The theoretical exit flow Mach number is derived by
with the total pressure pt1 upstream and the static pressure pc downstream of the cascade. Combined with the total temperature Tt1 at the cascade inlet and the chord length l the theoretical exit flow Reynolds number can be calculated by
with the Sutherland constants C1 and C2. In this investigation, a Reynolds number based on the dimensions of five-hole-probe Re2,th is more suitable. This can be calculated analogous to Equation 2 by using the probe head diameter dp instead of the profile chord length l.
The experimental results presented in this paper were carried out for three different turbine exit flow Mach numbers at probe Reynolds numbers of 6,500 and 13,000 and at constant total temperature Tt1 = 303.15 K. The investigated turbine exit flow Mach numbers are given in Table 2. The highest investigated exit flow Mach number Ma2,th,high was close to Mach unity and served as reference. From now on the term in the first column will be used as notation to distinguish between these cases.
Transonic turbine cascade
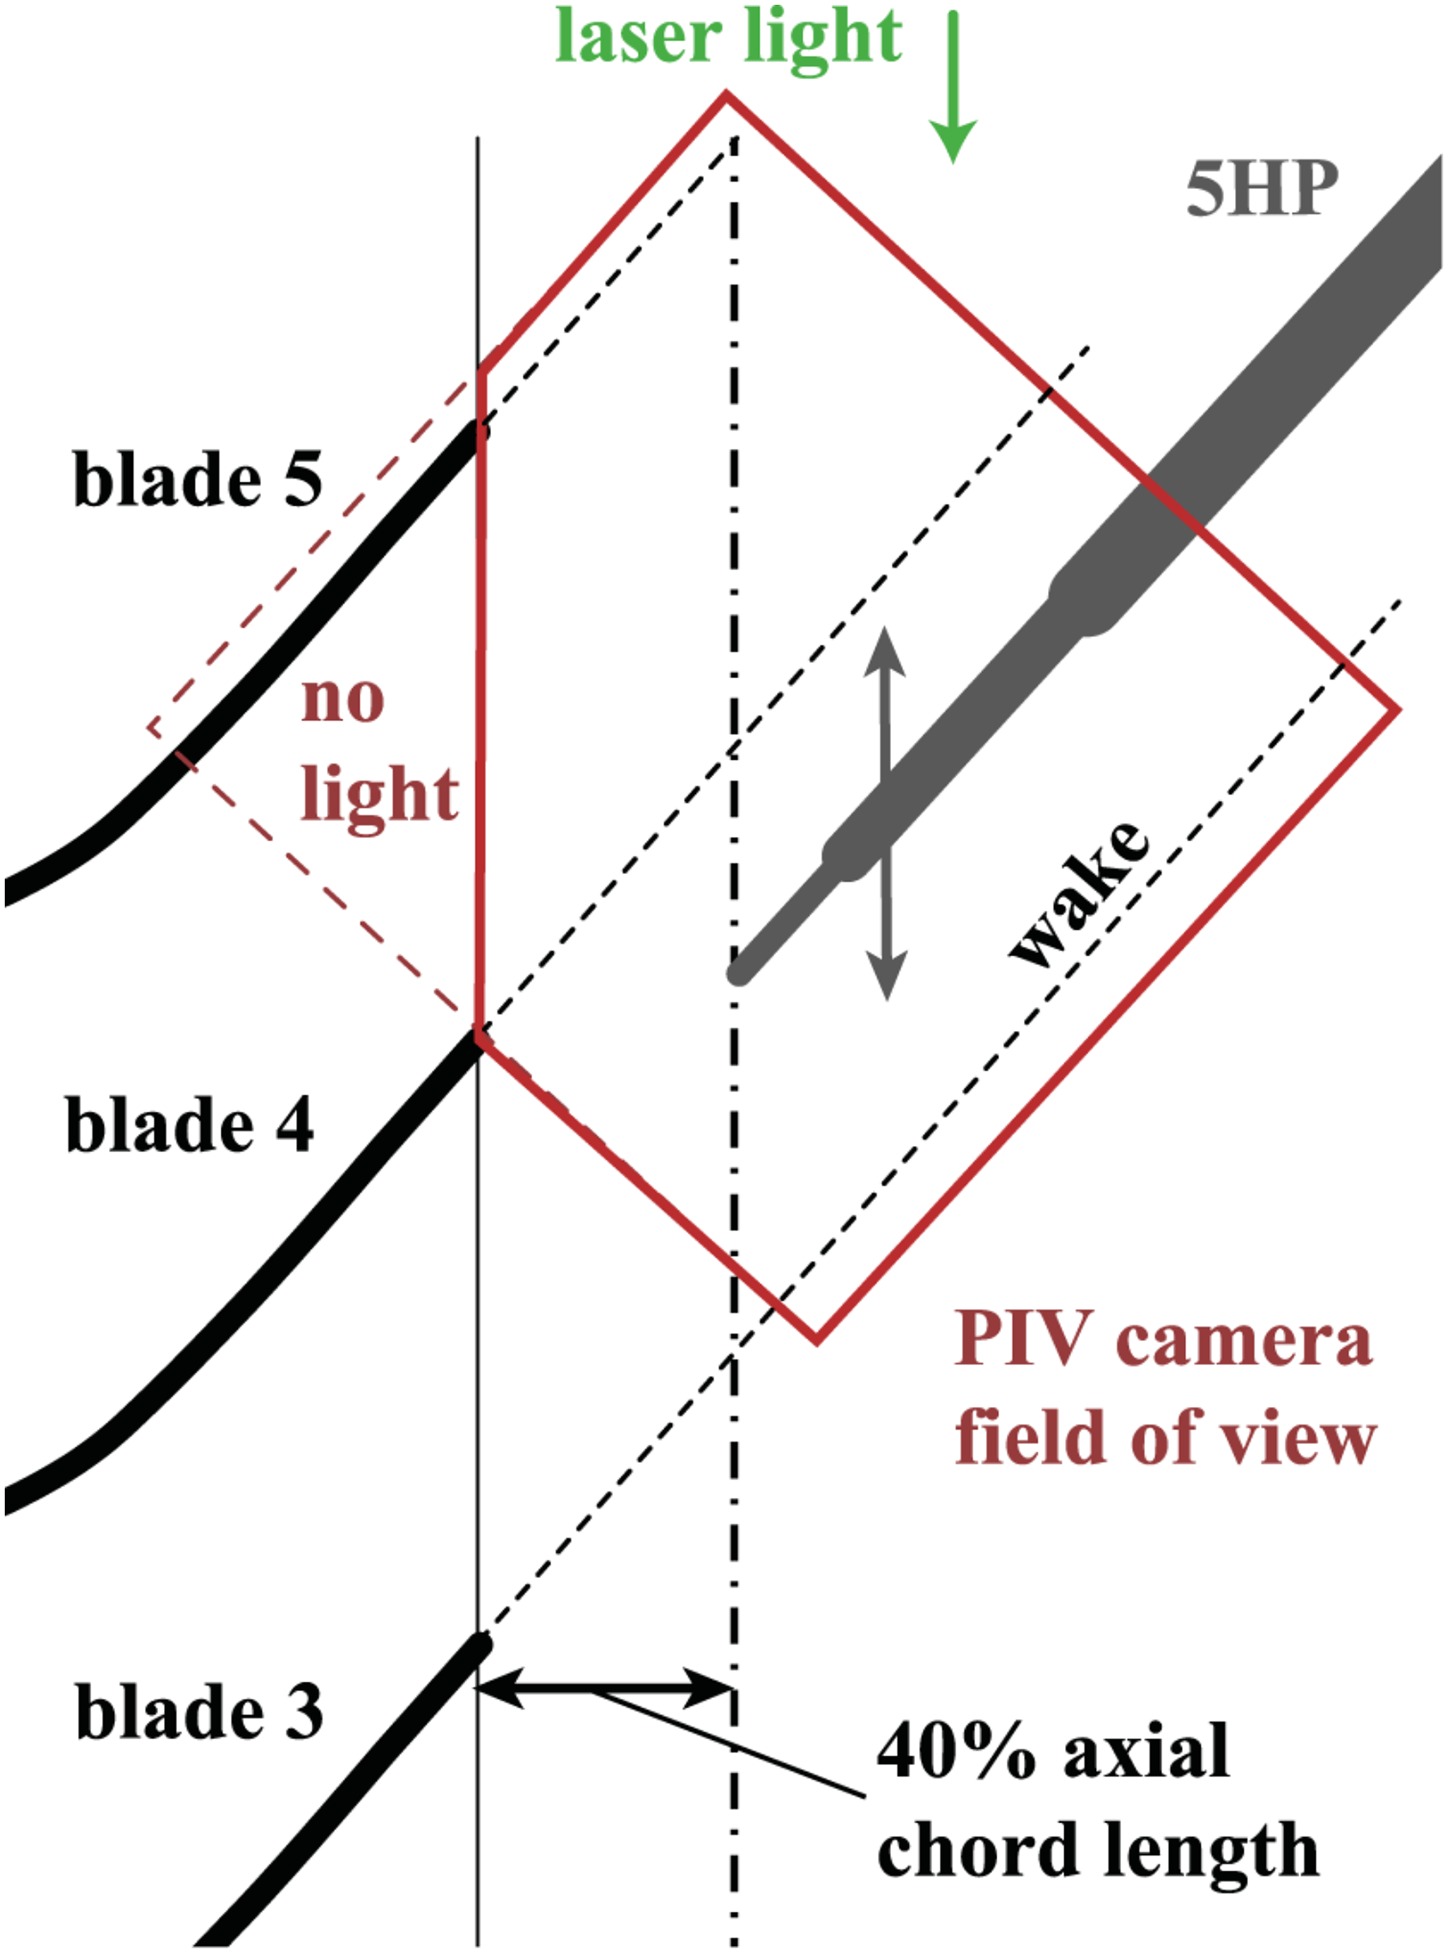
The high subsonic wake flow used for this investigation is generated by a transonic turbine cascade designed by MTU Aero Engines AG. It consists of eight blades with 300 mm span. The cascade was designed for transonic exit flow Mach numbers with a maximum isentropic surface Mach number Mais < 1.3 at the highest investigated exit flow Mach number Ma2,th,high. The flow downstream of blade number four, as one of the center blades, was in focus for all investigations (cf. Figure 3). Around this blade, acrylic glass windows were placed in each sidewall of the cascade for Schlieren flow visualization. The windows were also used as optical access for the PIV measurements. Pre-investigations showed a normal shock wave on the suction side for exit flow Mach numbers above 0.85. For the investigated cases, the shock wave propagates to the trailing edge of the neighboring blade but not further into the flow field downstream of the cascade exit plane. Furthermore, separation was detected neither on the suction side nor on the pressure side of the blade. The static pressure distribution on the blade surface was measured by 40 pressure taps at midspan at adjacent blades to avoid disturbances on the center blade four, where the wake is measured.
Five-hole-probe measurements
A long shafted five-hole-probe with a spherical head of dp = 2.6 mm diameter (Figure 2) was used for the pneumatic wake traverse over one blade pitch. The probe was placed downstream of the fourth blade with its tip at 40% axial chord length downstream of the cascade exit plane as shown in Figure 3. The shaft of the probe was orientated into exit flow direction causing minimal flow disturbance. The cylindrical probe support with a diameter of 17.5 mm was connected to a traversing system. The probe was calibrated in an open-jet of a closed-loop wind tunnel at the Institute of Jet Propulsion. The calibration was carried out at atmospheric ambient pressure for pitch angles of ±24° and yaw angles of ±21° at Mach numbers between 0.1 and 0.998. The total temperature during the calibration was 303.15 K. Therefore, the probe Reynolds number was within the range of Rep = 5·105 … 6.8·105 for Mach numbers between Ma = 0.8 and 1. Since the experimental investigations were carried out at lower ambient pressure, the probe Reynolds numbers differs from the calibrated ones. Nevertheless, the influence of the Reynolds number can be neglected for five-hole-probes with spherical head down to Rep = 1·103 according to Bohn (1977).
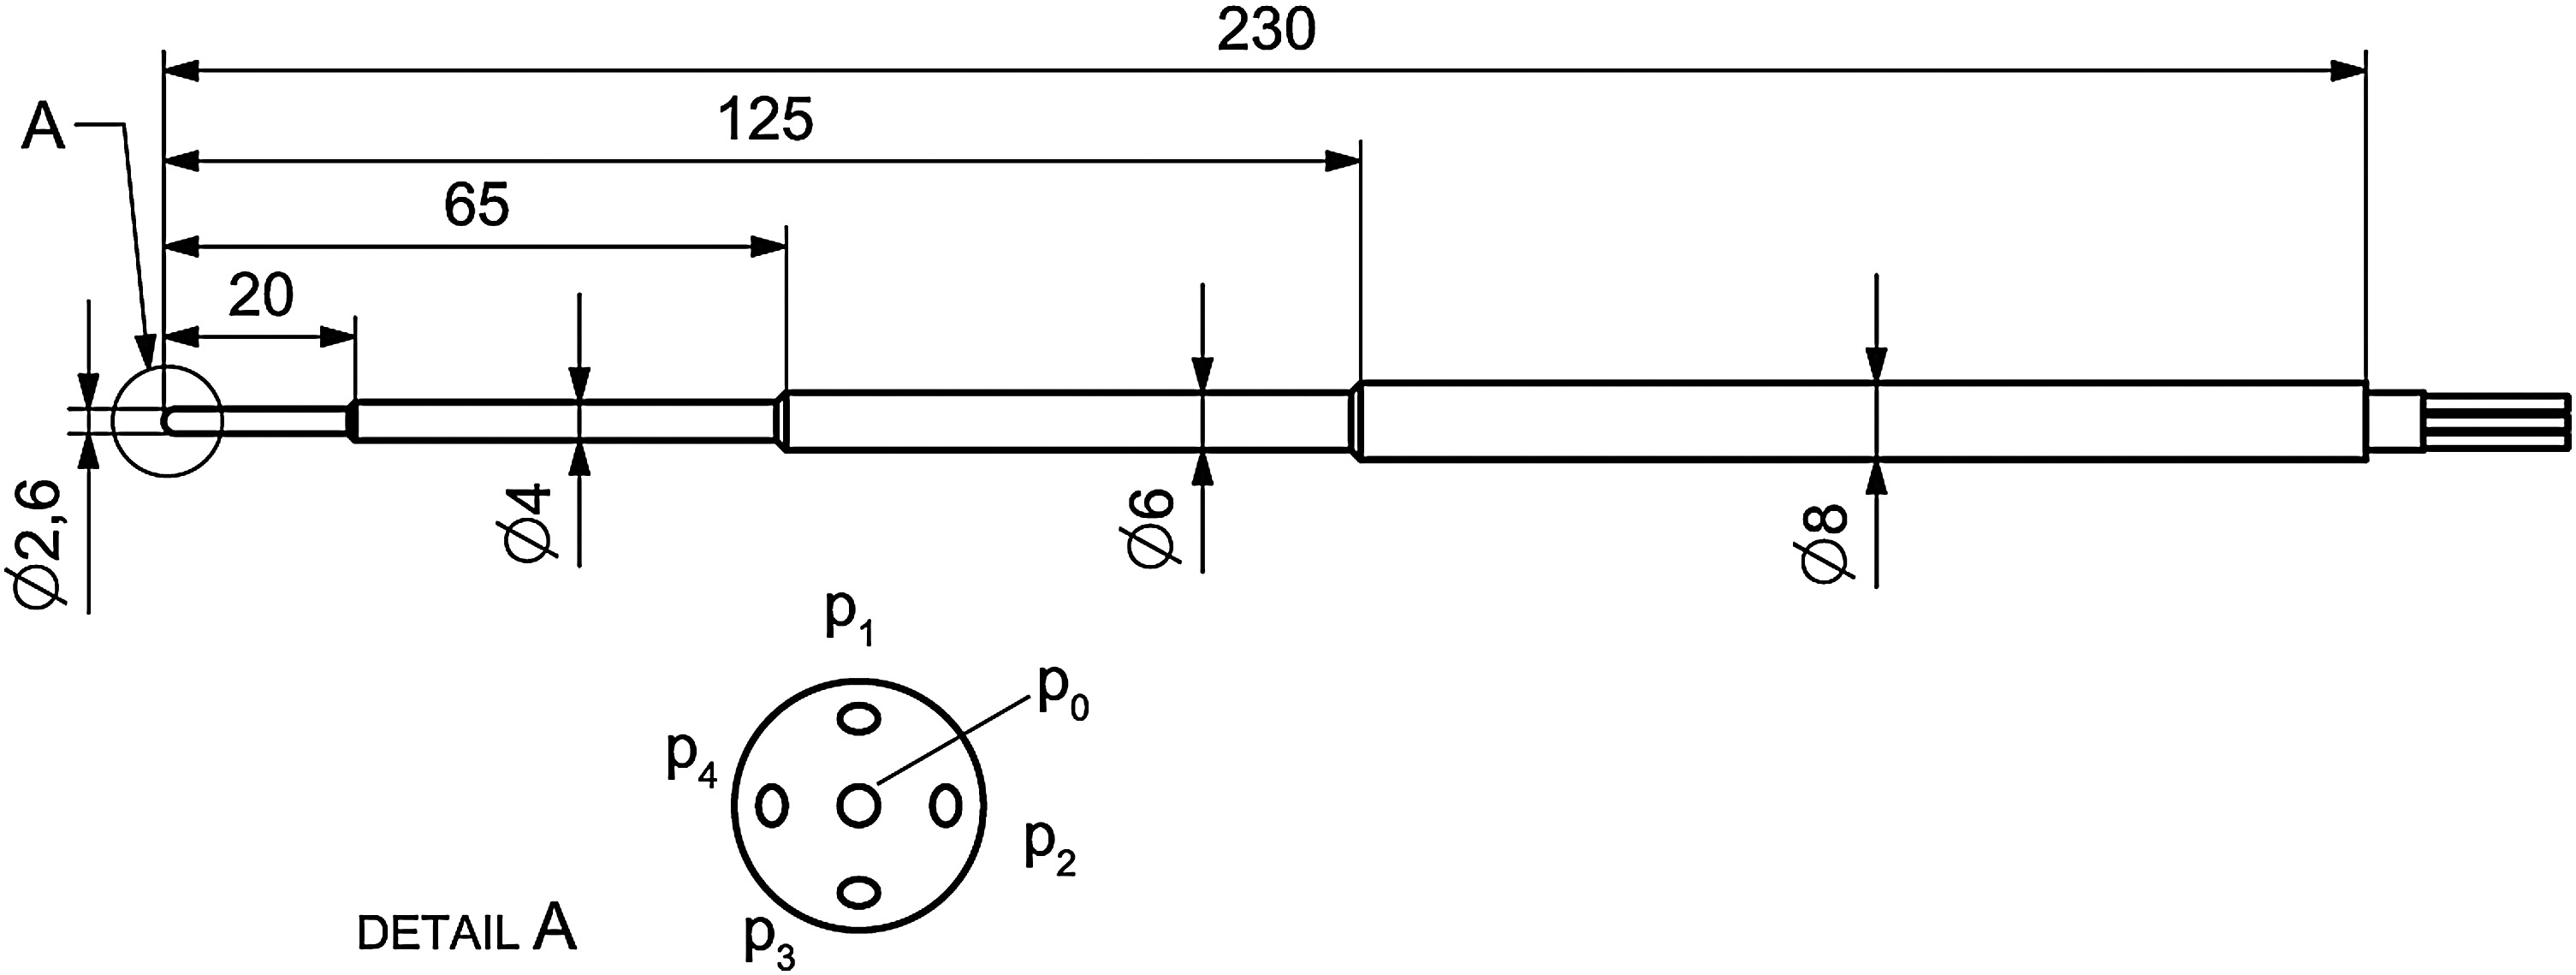
The data reduction method followed the procedure described in Bohn and Simon (1975). From the five pressure taps at the probe head (cf. Figure 2), the non-dimensional probe coefficients can be derived. They are closely connected with its special flow quantity Mach number, pitch and yaw flow angle:
Therein Δp is the quantity equivalent to the dynamic pressure, which is defined as
The finite distance between the pressure taps at the probe head causes measurement errors, especially in flows with large gradients. The error of not measuring each pressure at exactly the same position in the flow can be reduced by a spatial interpolation algorithm. Different versions of this correction are in common use, e.g. (Hoenen et al., 2012; Grimshaw and Taylor, 2016). The procedure applied in this investigation is based on Vinnemeier et al. (1990).
PIV wake flow measurements
A planar particle image velocimetry (2C2D-PIV) system was used to investigate the wake flow at midspan downstream of the fourth turbine blade. The camera field of view captured a 60 × 60 mm area which is indicated by the red window in Figure 3. One LaVision Imager Pro X4M CCD camera with 2048 × 2048 px was equipped with a ZEISS 50 mm f/2 Makro lens observing the scene normal through the acrylic glass window. DEHS seeding particles of approximately 1 µm were produced by a LaVision Aerosol generator and inserted into the settling chamber through a multi-hole nozzle. A Nd:YAG double pulse laser NewWave Solo III was used as light source with 30 mJ per pulse. It was placed outside the pressure tank and the laser beam was introduced through a glass window into the pressure tank.
Two experimental setups were investigated with the PIV system. In the first one, the undisturbed turbine exit flow was measured. In the second setup, the 5HP probe was inserted at different positions downstream of the cascade comparable to the 5HP traverse path described before. In this setup, the laser light hits the probe from the top (Figure 3). Therefore, the area below the probe features no light and reveals no flow information.
The PIV images were processed with the LaVision DaVis 8.3 software. First, the images were preprocessed and afterwards a multi pass PIV algorithm with 32 × 32 px final interrogation windows and 50% overlap was applied, i.e. one velocity vector per 0.5 mm. The PIV velocity fields presented here are ensemble-averaged over 2,000 frames.
In order to compare the velocity quantities from the PIV measurements with the measured Mach number from the 5HP the absolute velocity field was converted by
deriving the sonic speed from the ideal gas law and using the isentropic flow relations to derive the static temperature from the measured total temperature Tt1 and Mach number.
Therefore, the measured total temperature Tt1 in the settling chamber of the wind tunnel was assumed to be constant in the cascade wake flow. This is satisfying as the error even by a deviation of 2 K is less than 0.4% in Mach number. The temperature in the wind tunnel can be controlled better than ±1 K during the measurements (Sturm and Fottner, 1985).
Results
PIV and 5HP measurements of the wake flow
The results of the ensemble-averaged PIV measurements of the lowest and highest investigated exit flow Mach number are shown in Figure 4. The data is presented as contour plots of the Mach number normalized with the Mach number Maref,5HP at the 5HP wake traverse position u/t = 0 separately for each case. Therein, three wakes are present with the center wake downstream of the fourth cascade blade. The dashed line shows the traverse path of the 5HP over one blade pitch at 40% axial chord length downstream of the cascade outlet plane. As can be seen, the suction side flow from the neighboring blade interacts with the wake of blade four, which is typical for transonic turbines. Moreover, the influence increases with higher velocity on the suction side (cf. Figure 4b). The resulting high velocity variations (i.e. static pressure gradients) are merging with the high total pressure gradients from the blade wake. That means that the 5HP senses both gradients at the same place traversing parallel to the cascade outlet plane. It can be recognized from the measurement fields that the averaged flow field downstream of the cascade outlet plane is subsonic in all investigated cases and no supersonic flow regimes are noticeable. This is the basic requirement for applying the 5HP, which is merely calibrated for subsonic flows.
Figure 4.
Mach number field calculated from PIV normalized with the reference Mach number of the 5HP (Dashed line shows 5HP wake traverse path; blade numbers in boxes).
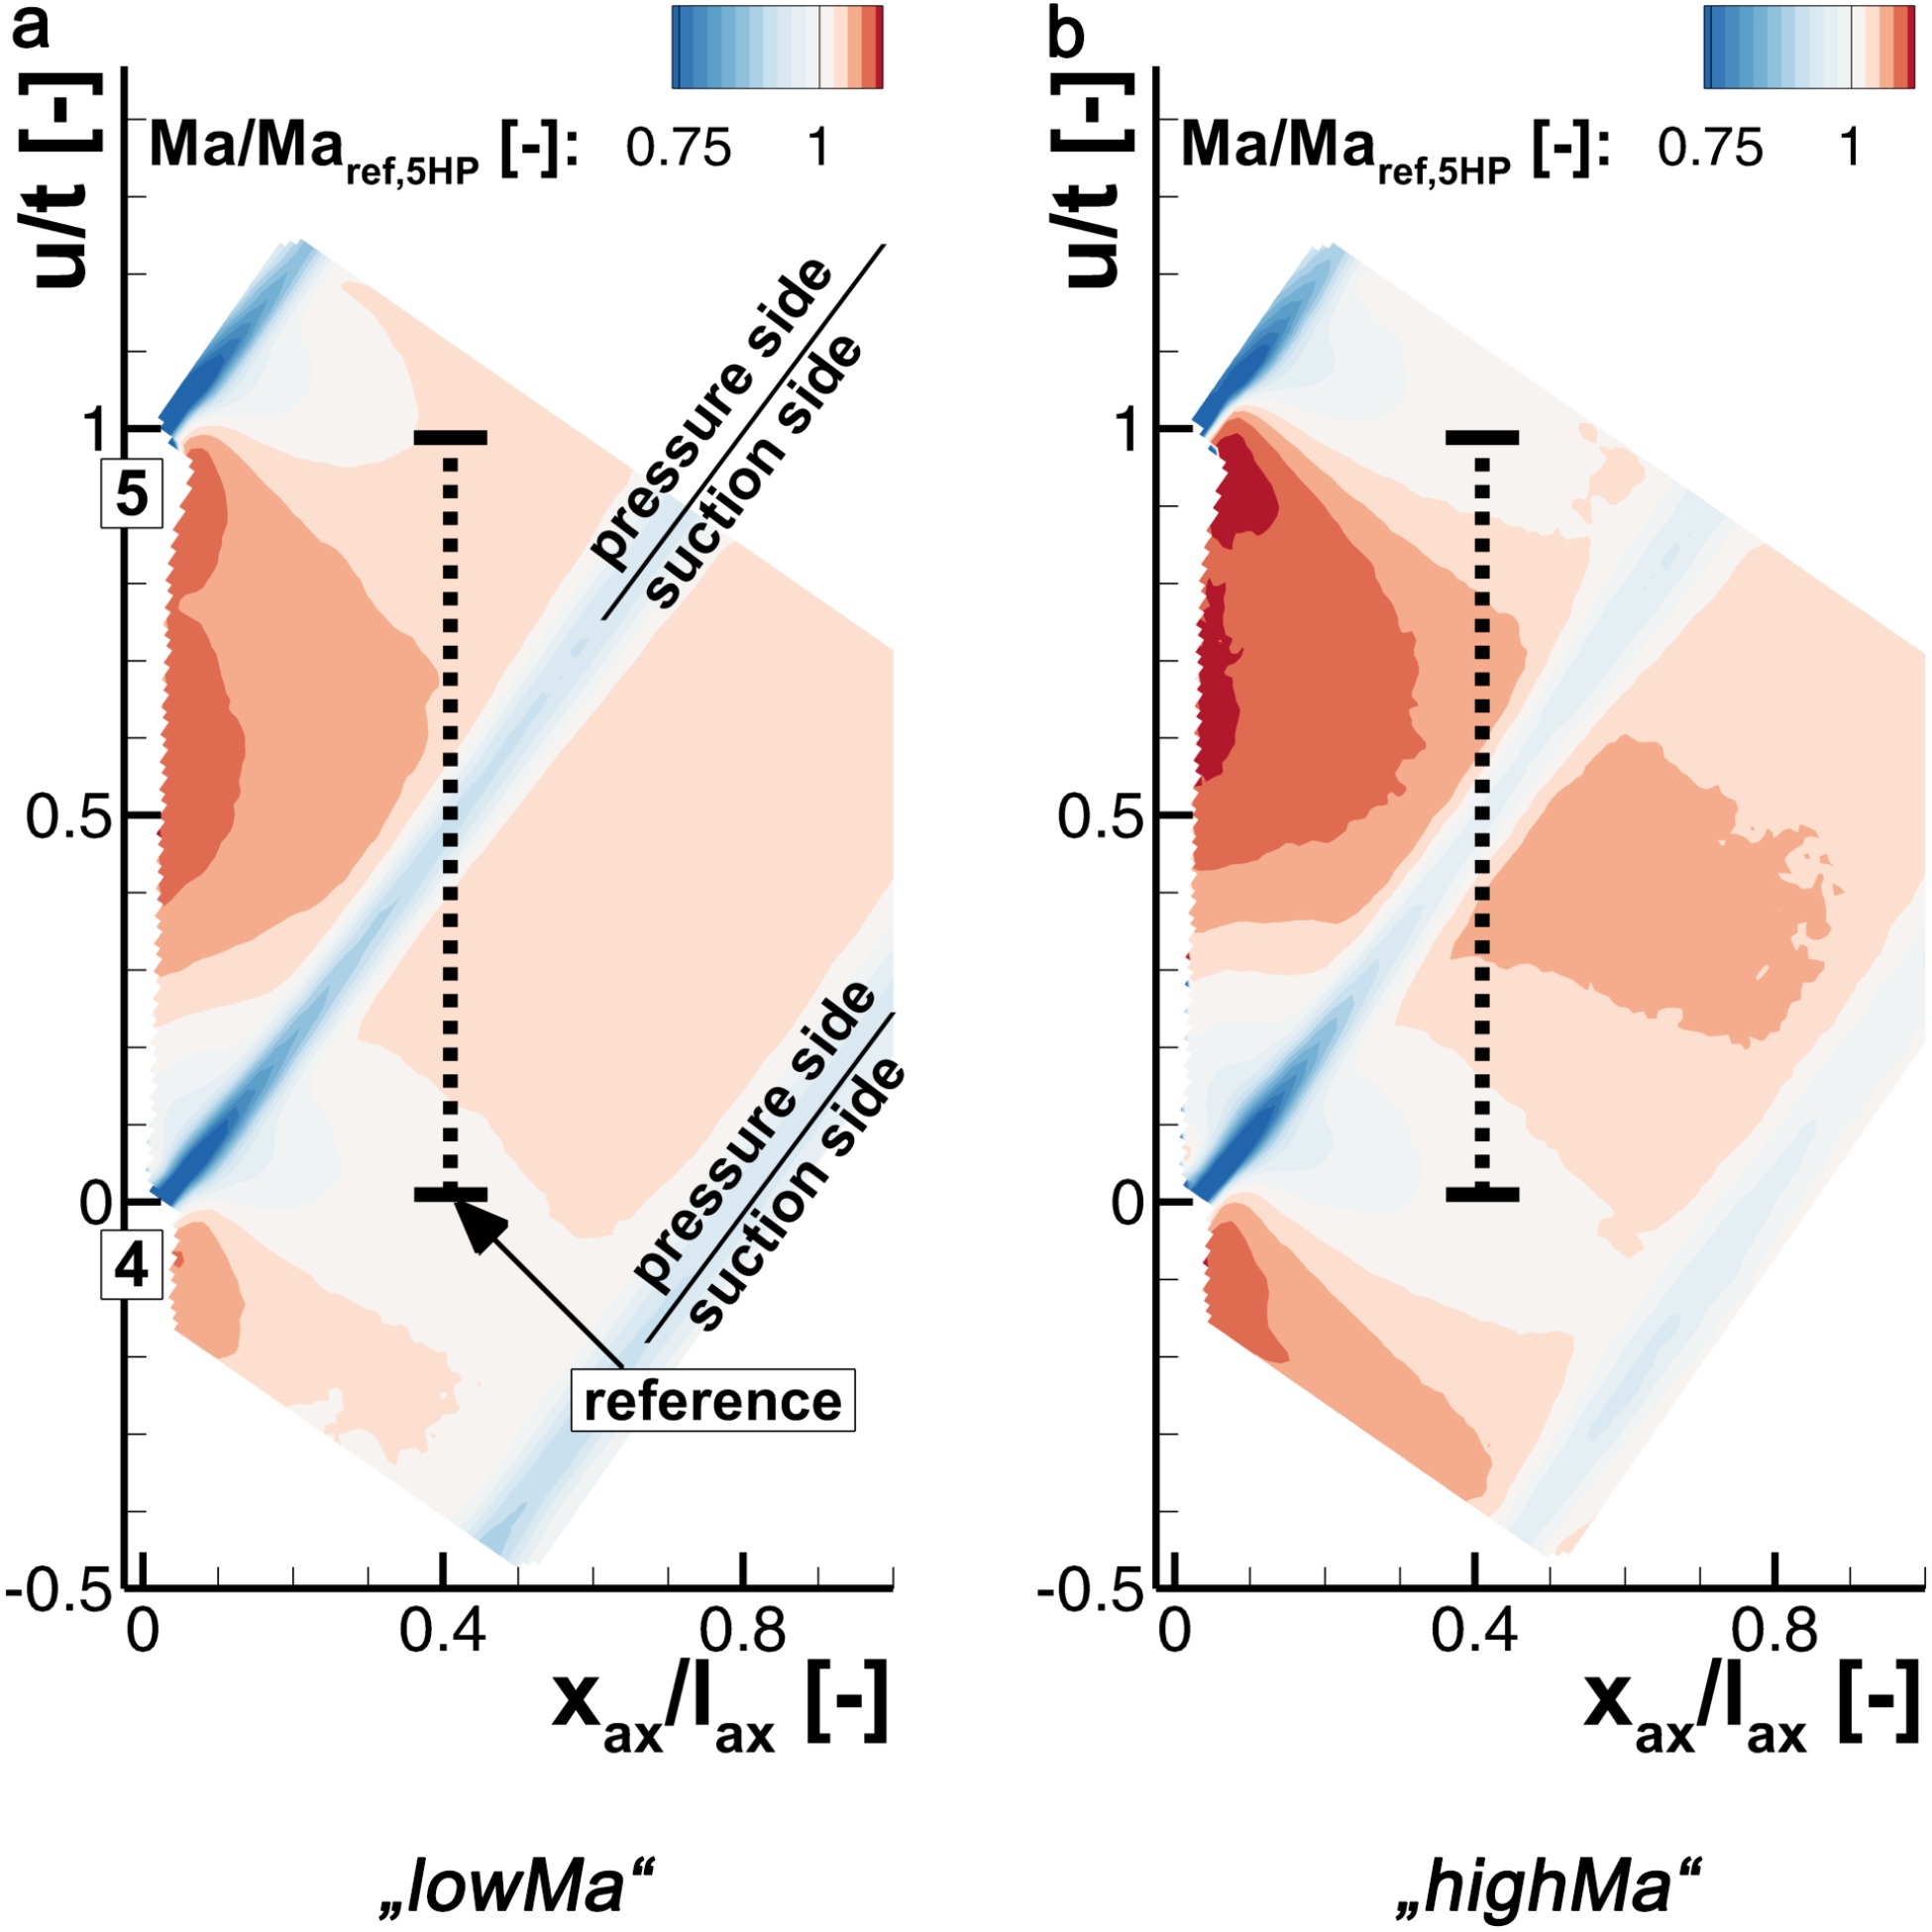
Data points along xax/lax = 0.4 were extracted from the PIV flow field to compare them to the 5HP wake traverse over one blade pitch. Linear interpolation was applied between the grid points. The results are shown in Figure 5 by a normalized Mach number plot for the three investigated operating points. Here, the reference Mach number Maref is chosen separately for each graph at its first pitch position u/t = 0 for qualitative comparison. In addition, the blue (dashed-double-dotted) line shows qualitatively the normalized total pressure distribution along the traverse path measured with the 5HP. Therein, the extension of the pressure wake is similar for all investigated operating points. The reference Mach numbers from 5HP and PIV at the same operating point deviate in the range of 1% to 2.5%.
Figure 5.
Normalized Mach number plot of 5HP and converted PIV measurements at xax/lax = 0.4. Blue (dashed-double-dotted) line qualitatively indicates total pressure distributions measured with the 5HP.
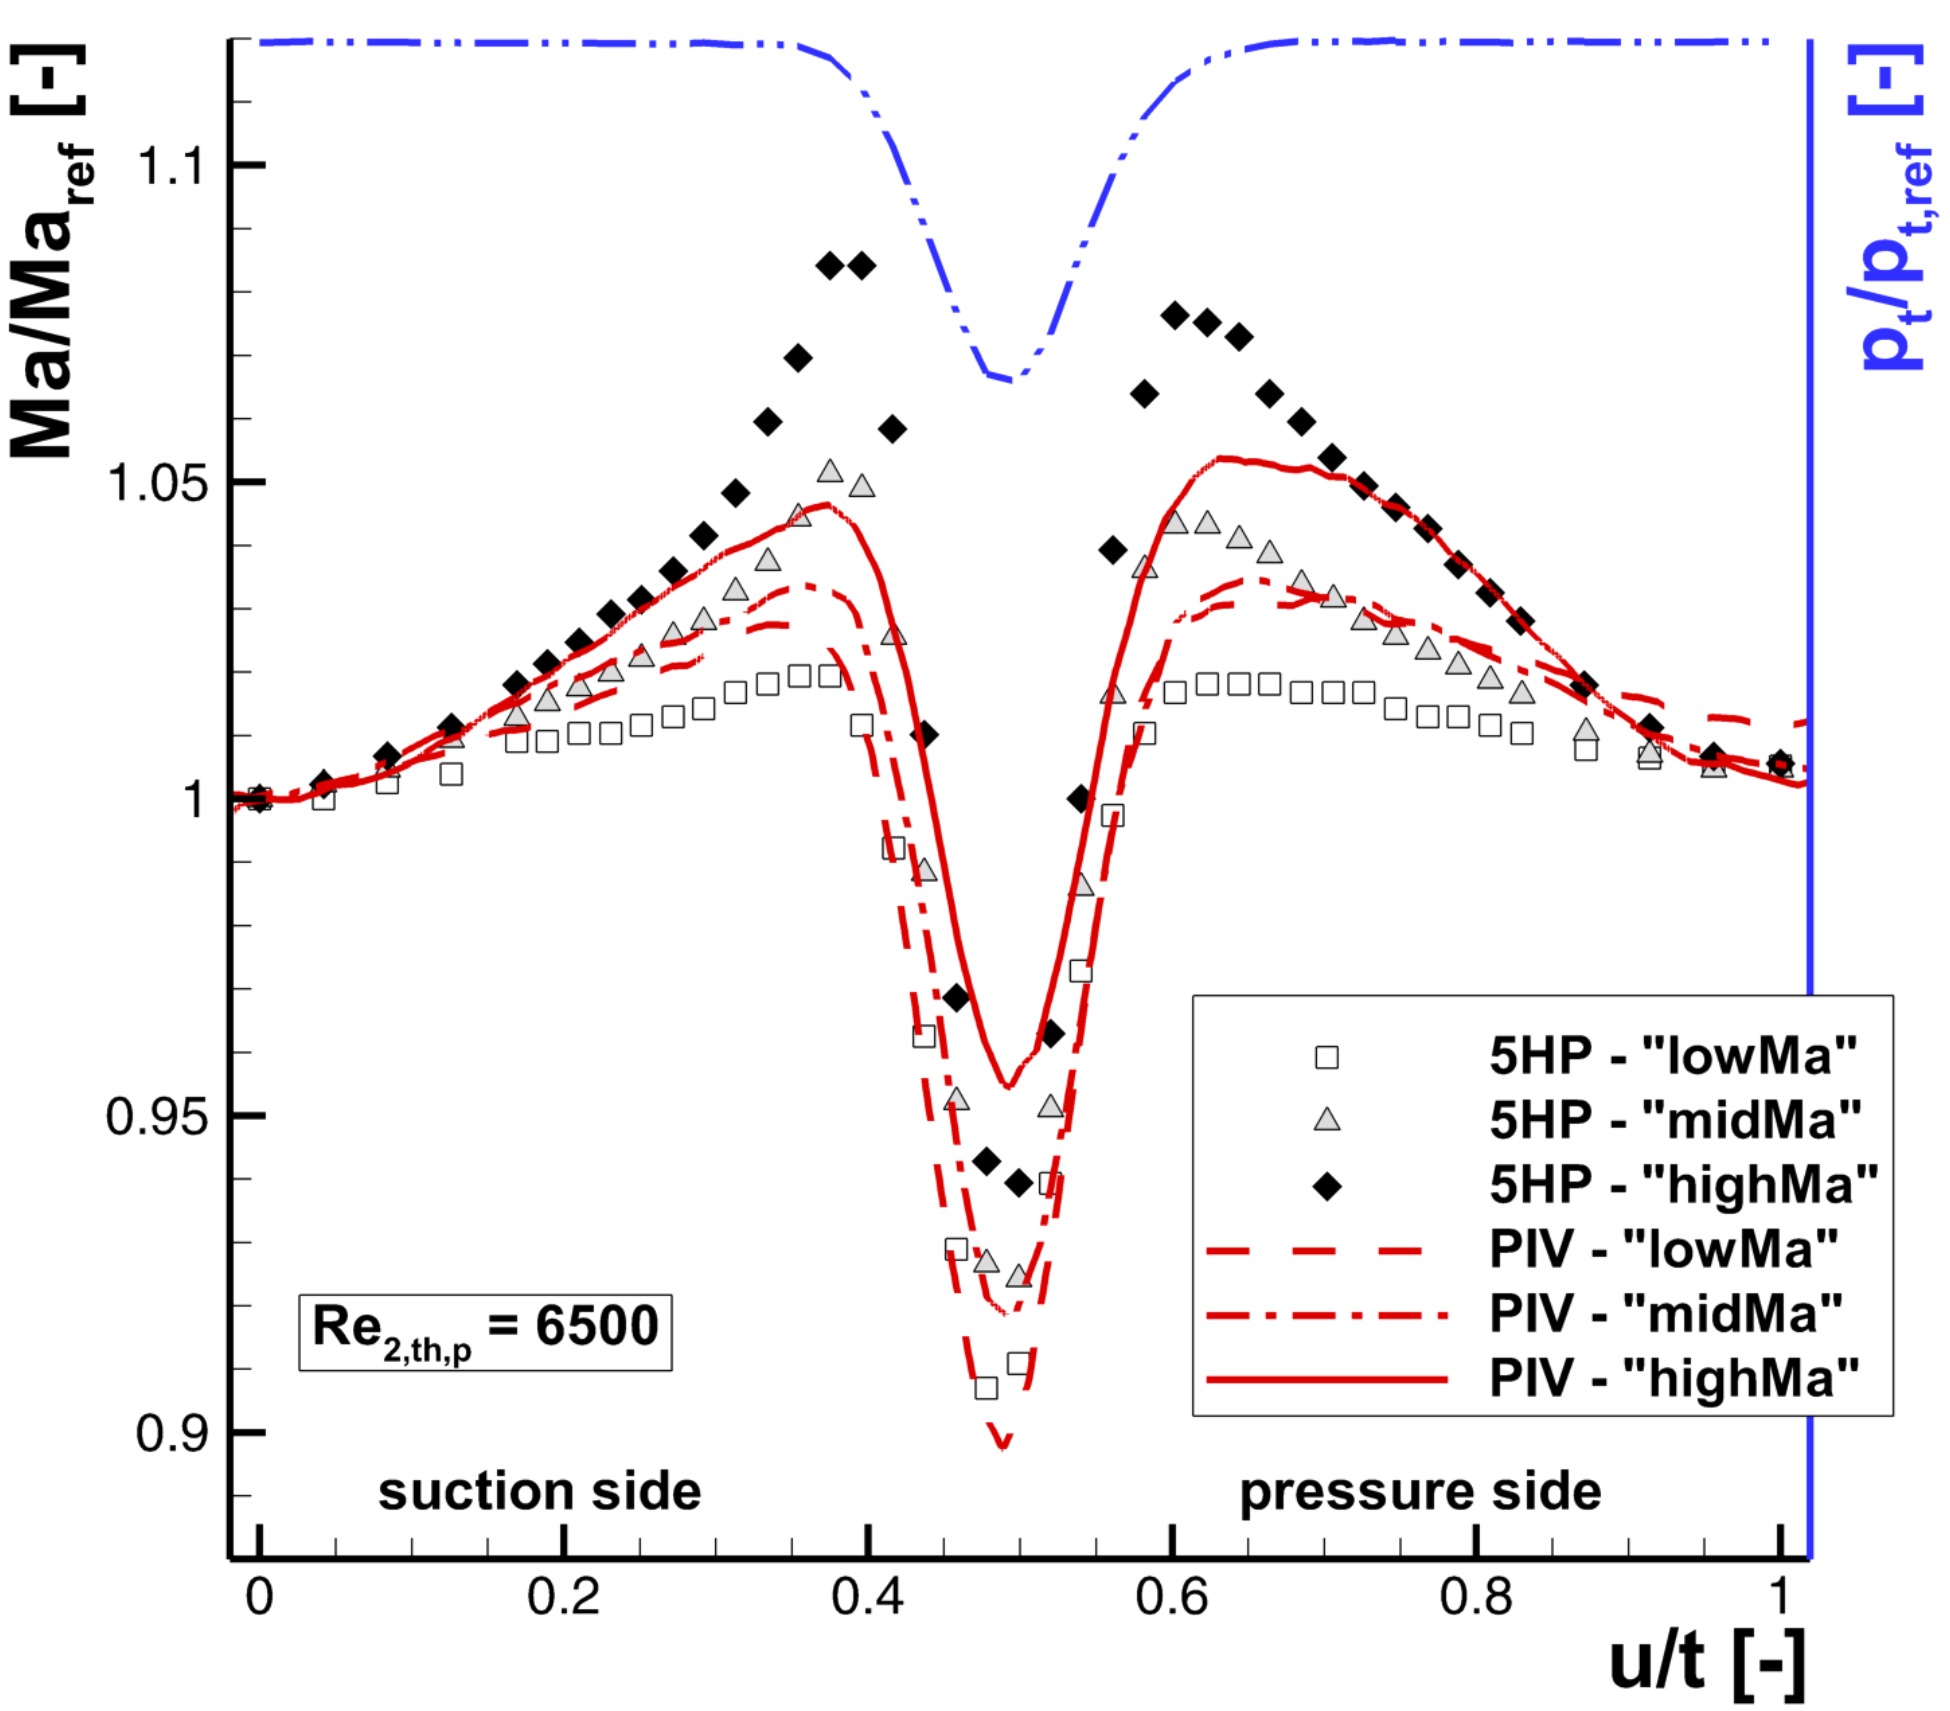
A good agreement of the probe and the PIV measurements can be found in the first and last 30% of the pitch-wise traverse, where no total pressure gradient is present in the flow field. Accelerated flow is observable both in PIV and 5HP measurements on each sides of the wake. These positions approximately at u/t = 0.4 and 0.6 coincide directly with the intersections of the probe's traverse path and the strong wake flow gradients (cf. Figure 4b). Figure 5 generally presents the trend that the 5HP overestimate the Mach number compared to PIV in areas of high pressure gradients. This effect increases as the shear layer becomes thinner and the wake gradient gets stronger with rising exit flow Mach number. It must be stated, that the flow Mach number evaluated by the 5HP is subsonic at all positions and in all investigated cases. Hence, the 5HP does not reach the constraints of its calibration range. The minimum velocity in the wake deficit is well captured by both techniques in accordance except for the “higMa”-case. In this case, a drop of the laser power led to reduced data availability in the PIV images, caused by a virtually reduced seeding particle concentration due to less illumination. A test repetition was not possible for time restrictions. Nevertheless, the observed phenomenon can be approved by the results of similar investigations carried out at another Reynolds number (Re2,th,p = 13,000) at the same total temperature but at higher ambient pressure. This demonstrates that the overestimation of the Mach number is not caused by the different Reynolds numbers at calibration and measurement.
Since the conversion from velocity values to Mach number is directly dependent on the total temperature (cf. Equation 7), a non-uniform temperature distribution in the wake flow could be an explanation for the shown deviations. Eckert and Weise (1942) were the first who observed a change in the surface temperature at the trailing edge of a circular cylinder. Afterwards, several experimental investigations substantiated these findings and related this appearance to vortex shedding. This flow phenomenon, known as the Eckert-Weise effect, can also occur downstream of thick trailing edges of turbine blades (Carscallen et al., 1999). Some theories are developed to explain the non-uniform total temperature distribution by an energy separation in the vortices. A short summary of the theories can be found in Gostelow and Carscallen (2010). Among others, Gostelow and Carscallen (2010) performed both time-resolved computational and experimental investigations of the temperature distribution downstream of a turbine blade. They showed that a colder wake core and hot spots at the wake edges can clearly be related to the vortex shedding from the trailing edge. This temperature distribution was also affirmed in their time-averaged measurement data.
Vortex shedding from the trailing edge is clearly evident in single PIV images from the investigations presented here. However, according to Equation 7 a wake temperature distribution related to the Eckert-Weise effect would lead to smaller Mach numbers derived from the PIV velocity fields instead of higher values noticeable in Figure 5. Hence, the Eckert-Weise effect can be excluded as an explanation for the higher measured Mach numbers by the 5HP.
5HP Characteristics close to Ma = 1
Analyzing the calibration characteristic of the five-hole-probe give a deeper understanding of the measurement behavior at high subsonic Mach numbers. In the characteristic of kMa plotted versus the Mach number at zero incidence (Figure 6) an almost linear gradient between Ma = 0.3…0.7 is observable. With increasing Mach number the slope flattens resulting in to a nearly horizontal plateau towards Ma = 1. This constraint was theoretically described by Hancock (1988) and experimentally investigated in detail by Kost (2009) for different probe types. In theory, all blunt bodies feature the appearance of a detached shock wave in supersonic flows. If the flow Mach number in front of the body is just slightly above Mach 1, the detached shock wave emerges in a distance upstream of it and is roughly normal to the flow direction. The flow downstream of the shock wave is consequently subsonic and the pressure taps at the probe head sensing subsonic conditions, too. If the flow Mach number increases, the shock wave moves closer to the probe head but its orientation to the flow still remains mostly normal. Therefore, the conditions downstream stay subsonic and the pressure taps at the probe head do not sense a significant change. Kost (2009) showed that this insensitivity of the pressure distribution on a cylindrical probe head can range up to Ma = 1.3.
Figure 6.
Mach number coefficient kMa of 5HP at zero incidence and the Mach number deviation emerging from 0.15% pressure error.

The decrease of sensitivity starts right before the flow becomes supersonic as the slope of kMa in Figure 6 illustrates. The influence of the flattening kMa-Slope is demonstrated by calculating the uncertainty of the Mach number determination separately for each calibrated Mach number. Therefore, the theory of linear error propagation was implemented in the evaluation algorithm. A measurement uncertainty of 0.15% was assumed based on measured pressures at zero incidence. The calculated relative deviation ΔMa from the true Mach number Ma is shown on the right axis of Figure 6. The propagated error obviously increases above Ma = 0.7 and correlates well with the decreasing gradient of kMa. The uncertainty grows by a factor of five towards Ma = 1 compared to the almost constant uncertainty level below Ma = 0.7. Similar results are given by Kost (2009) for different probes with blunt head shapes. For the reduction of the observed insensitivity close to Ma = 1, Kost proposes the use of a probe with a sharp head shape, e.g. a wedge. The sharp edge would feature a fixed attached shock wave rather than a separated one. Additionally, he suggests the application of an extra pressure tap sensing the base pressure in the wake of the probe head, since the base pressure did not feature the sensitivity drop close to Ma = 1.
In any case, this sensitivity study demonstrates that the Mach number measured by a 5HP with a blunt head shape in transonic flow conditions have to be interpreted carefully, especially if the probe is additionally applied in flow regions featuring strong gradients.
Flow field investigation with inserted 5HP
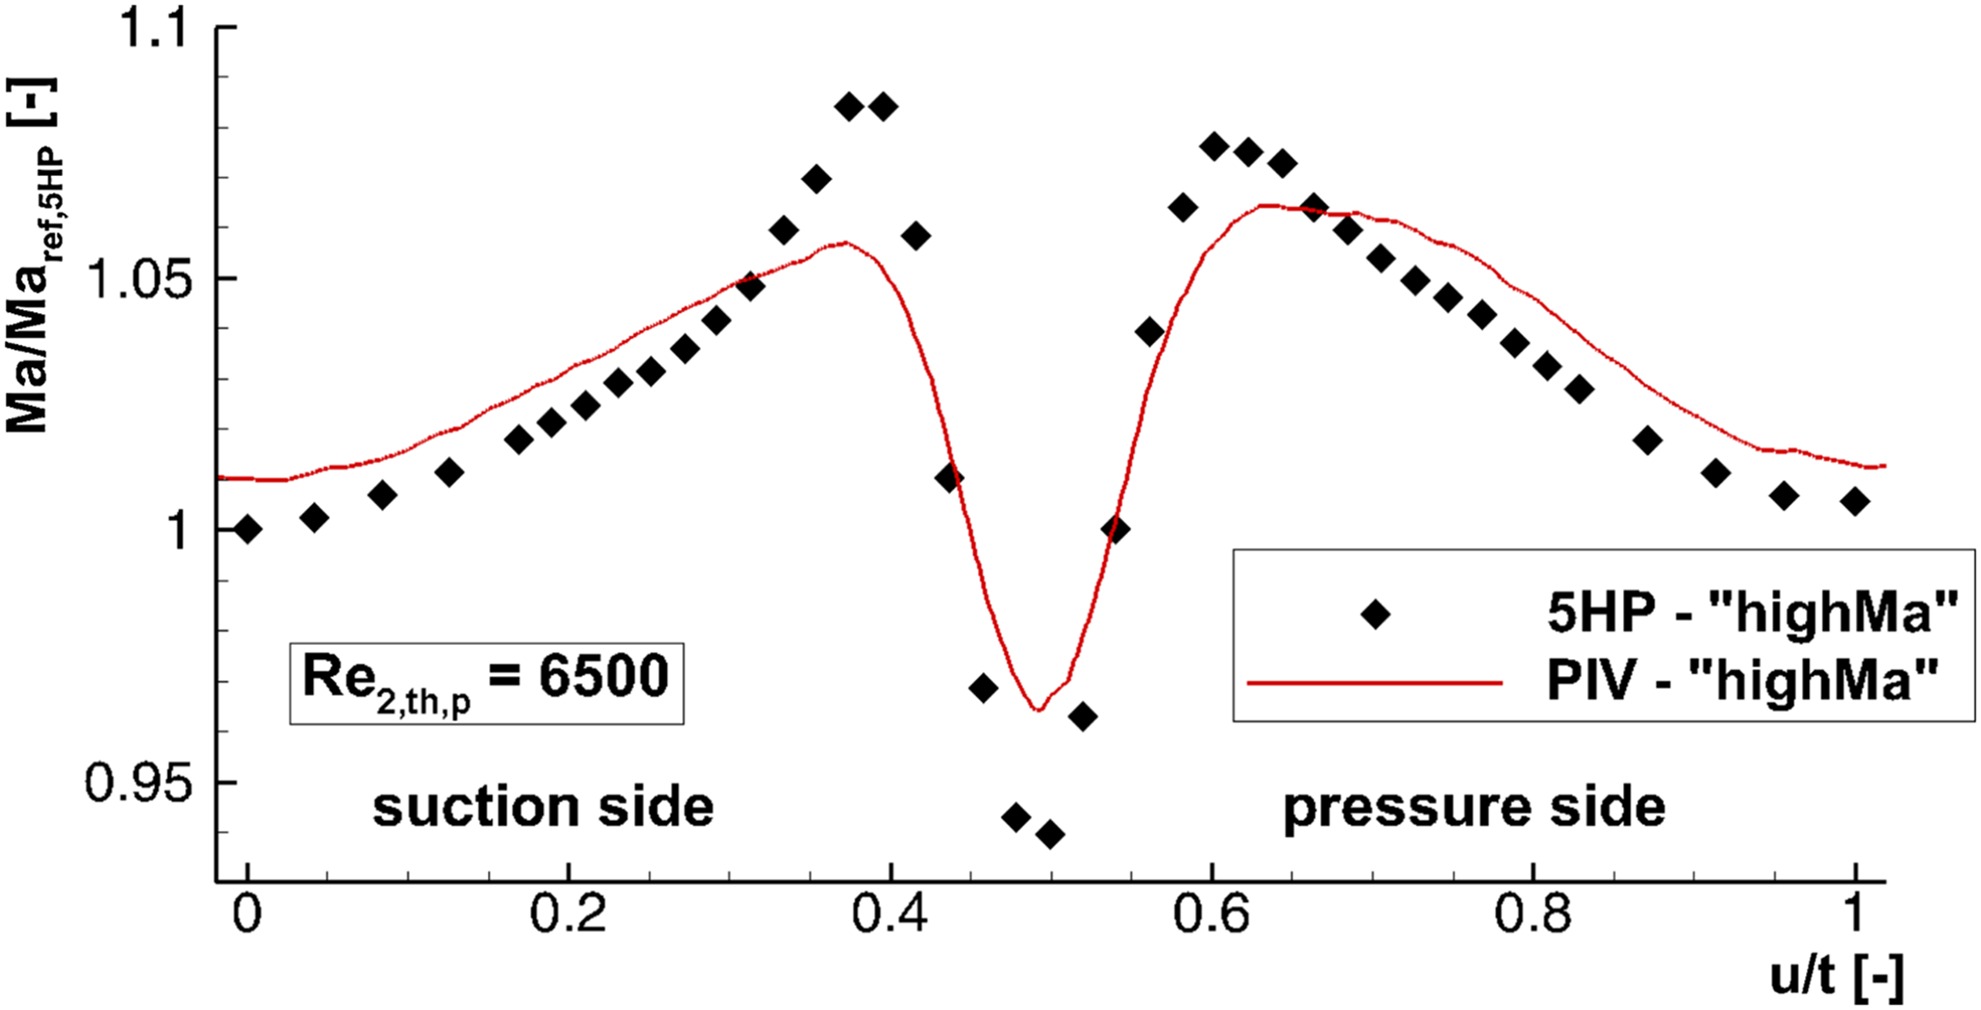
Since every probe inevitably disturbs the flow, especially by altering the static pressure (Fransson et al., 1988), it raises the question of how much the 5HP influences the turbine exit flow. Figure 7 shows the Mach number plot of 5HP and PIV results for the “highMa”-case. Therein, both curves were normalized by the reference Mach number of the 5HP Maref,5HP at u/t = 0 allowing a quantitative comparison. In the outer part of the plot the Mach number based on the PIV velocities is approximately 1% higher compared to the 5HP. Since no total pressure gradient is present in this part of the flow (cf. Figure 5) and the velocity variations are small, this offset can be an indicator for a slight blockage through the 5HP and its support.
The influence of the probe on the wake flow field was further investigated by the additional PIV setup with the 5HP inserted into the flow. The positions of the 5HP and the notation to distinguish the setups are given in Table 3. The “clean”-setup is the same as presented before in Figure 4b. The deviations of the flow with and without inserted probe are shown in Figure 8 for the “highMa” operating point where the strongest possible interactions are to be expected. The contour plot is based on the Mach number calculated from the measured PIV field with the inserted probe subtracted by the Mach number from the “clean”-setup without probe. The differences are normalized likewise with the reference Mach number of the five-hole-probe Maref,5HP. Furthermore, the position of the probe is visualized as dark bar in each of the plots. All figures feature a decelerated region in front of the probe due to the blockage effect of the probe body followed by an acceleration of the flow around the spherical probe head. A tiny region of supersonic flow can be observed close to the probe shaft surface only at the highest exit flow Mach number case. Hence, no shock wave disturbances originate from the probe head or shaft into the cascade outlet flow field. Furthermore, neither a deflection of the blade wake nor a significant change in the vector flow angles far away from the probe is recognizable in the flow field.
Figure 8.
Normalized Mach number differences of the Mach numbers calculated from the PIV velocity fields with inserted 5HP subtracted by the “clean”-field (“highMa”-case).
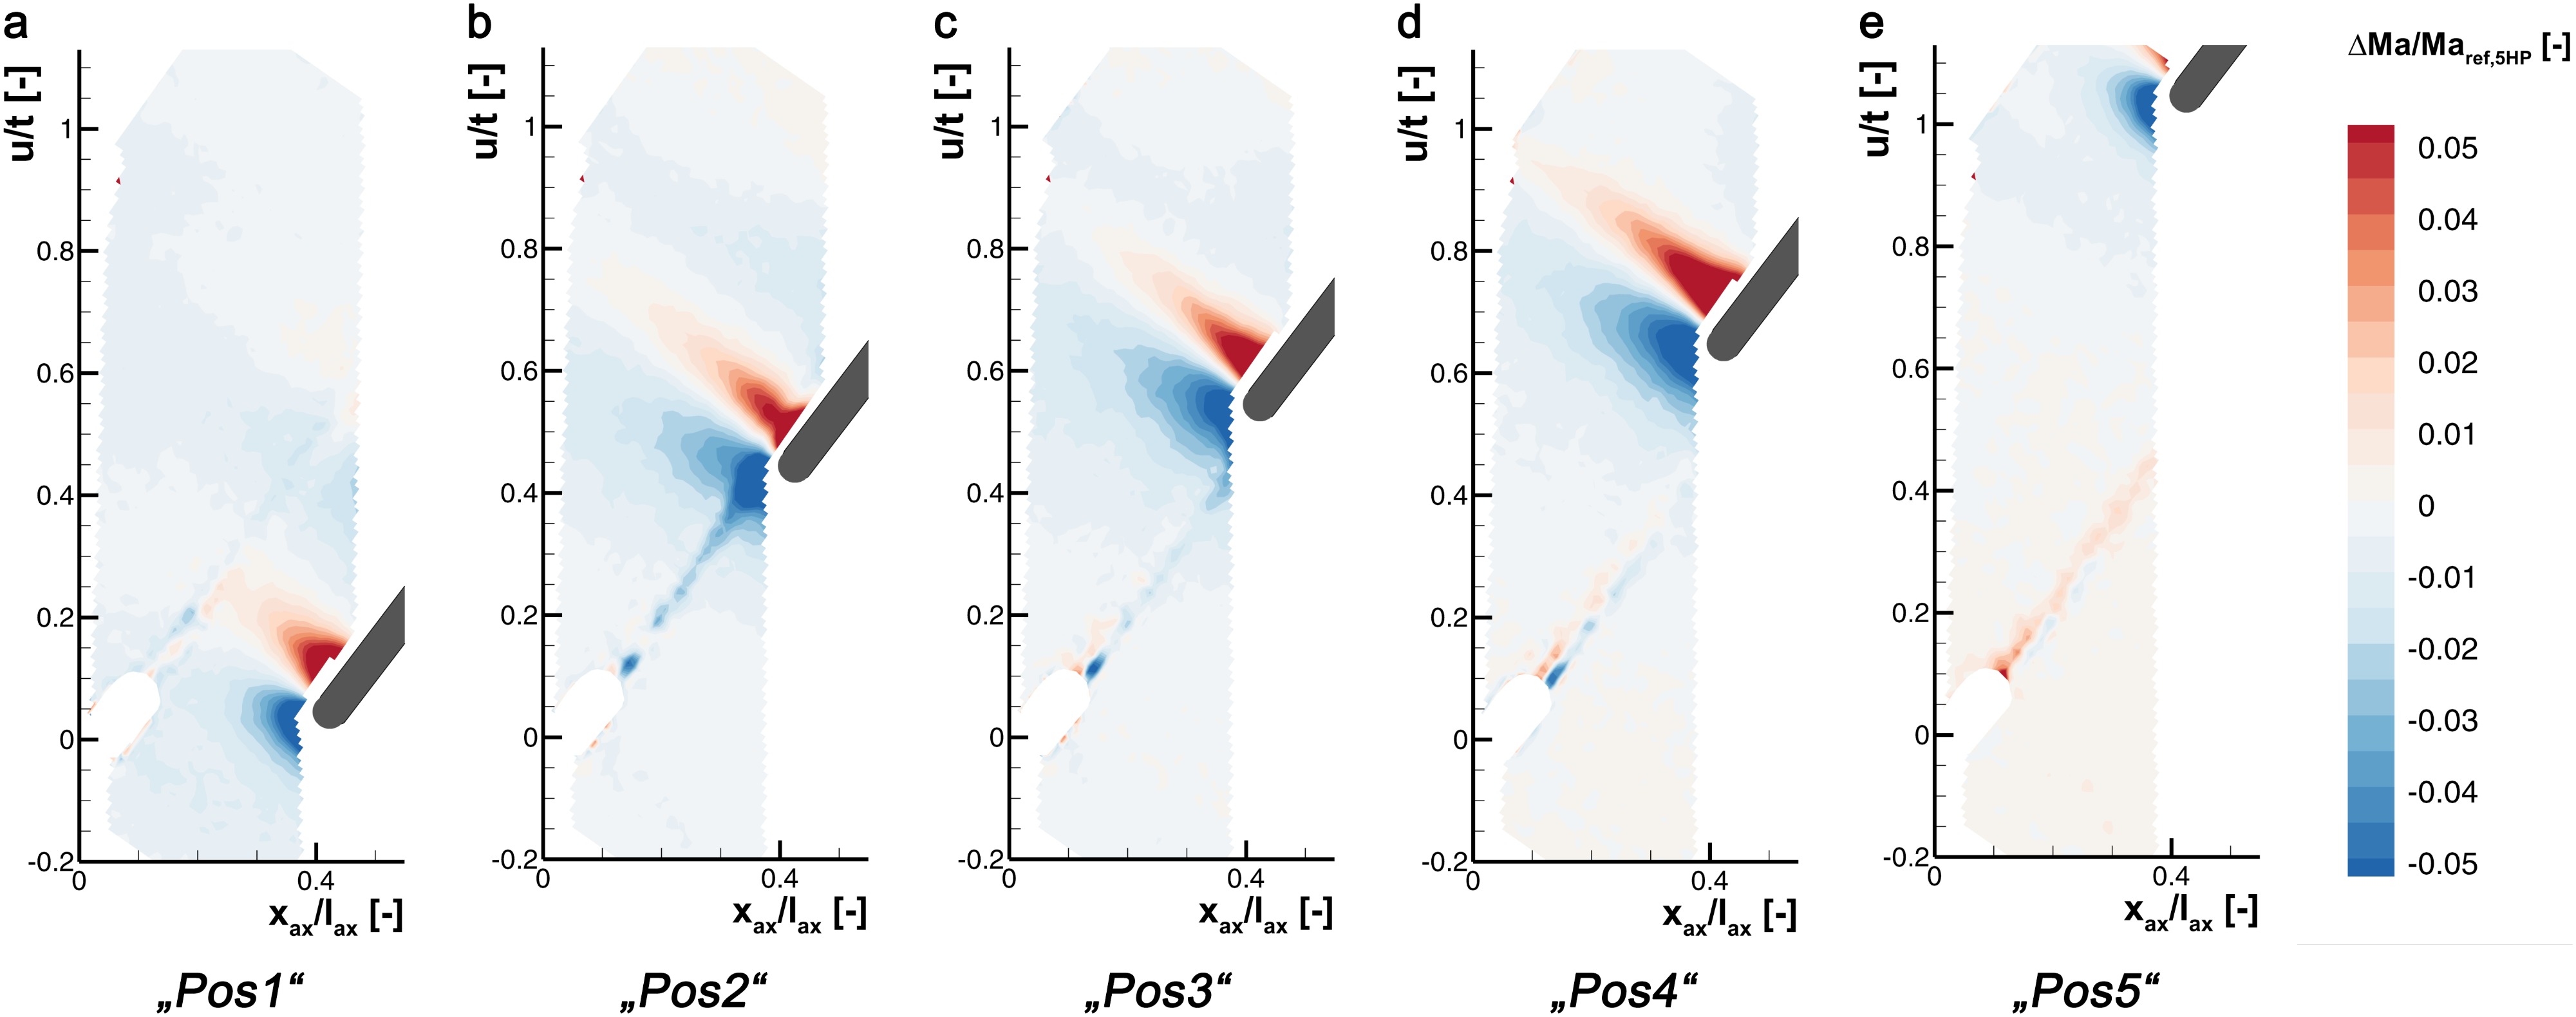
Table 3.
Notation of the PIV setups with inserted probe and the corresponding positions of the 5HP.
| Label | 5HP position in u/t [-] | Label | 5HP position in u/t [-] |
|---|---|---|---|
| “clean” | No probe | “Pos3” | 0.52 |
| “Pos1” | 0.02 | “Pos4” | 0.62 |
| “Pos2” | 0.41 | “Pos5” | 1.02 |
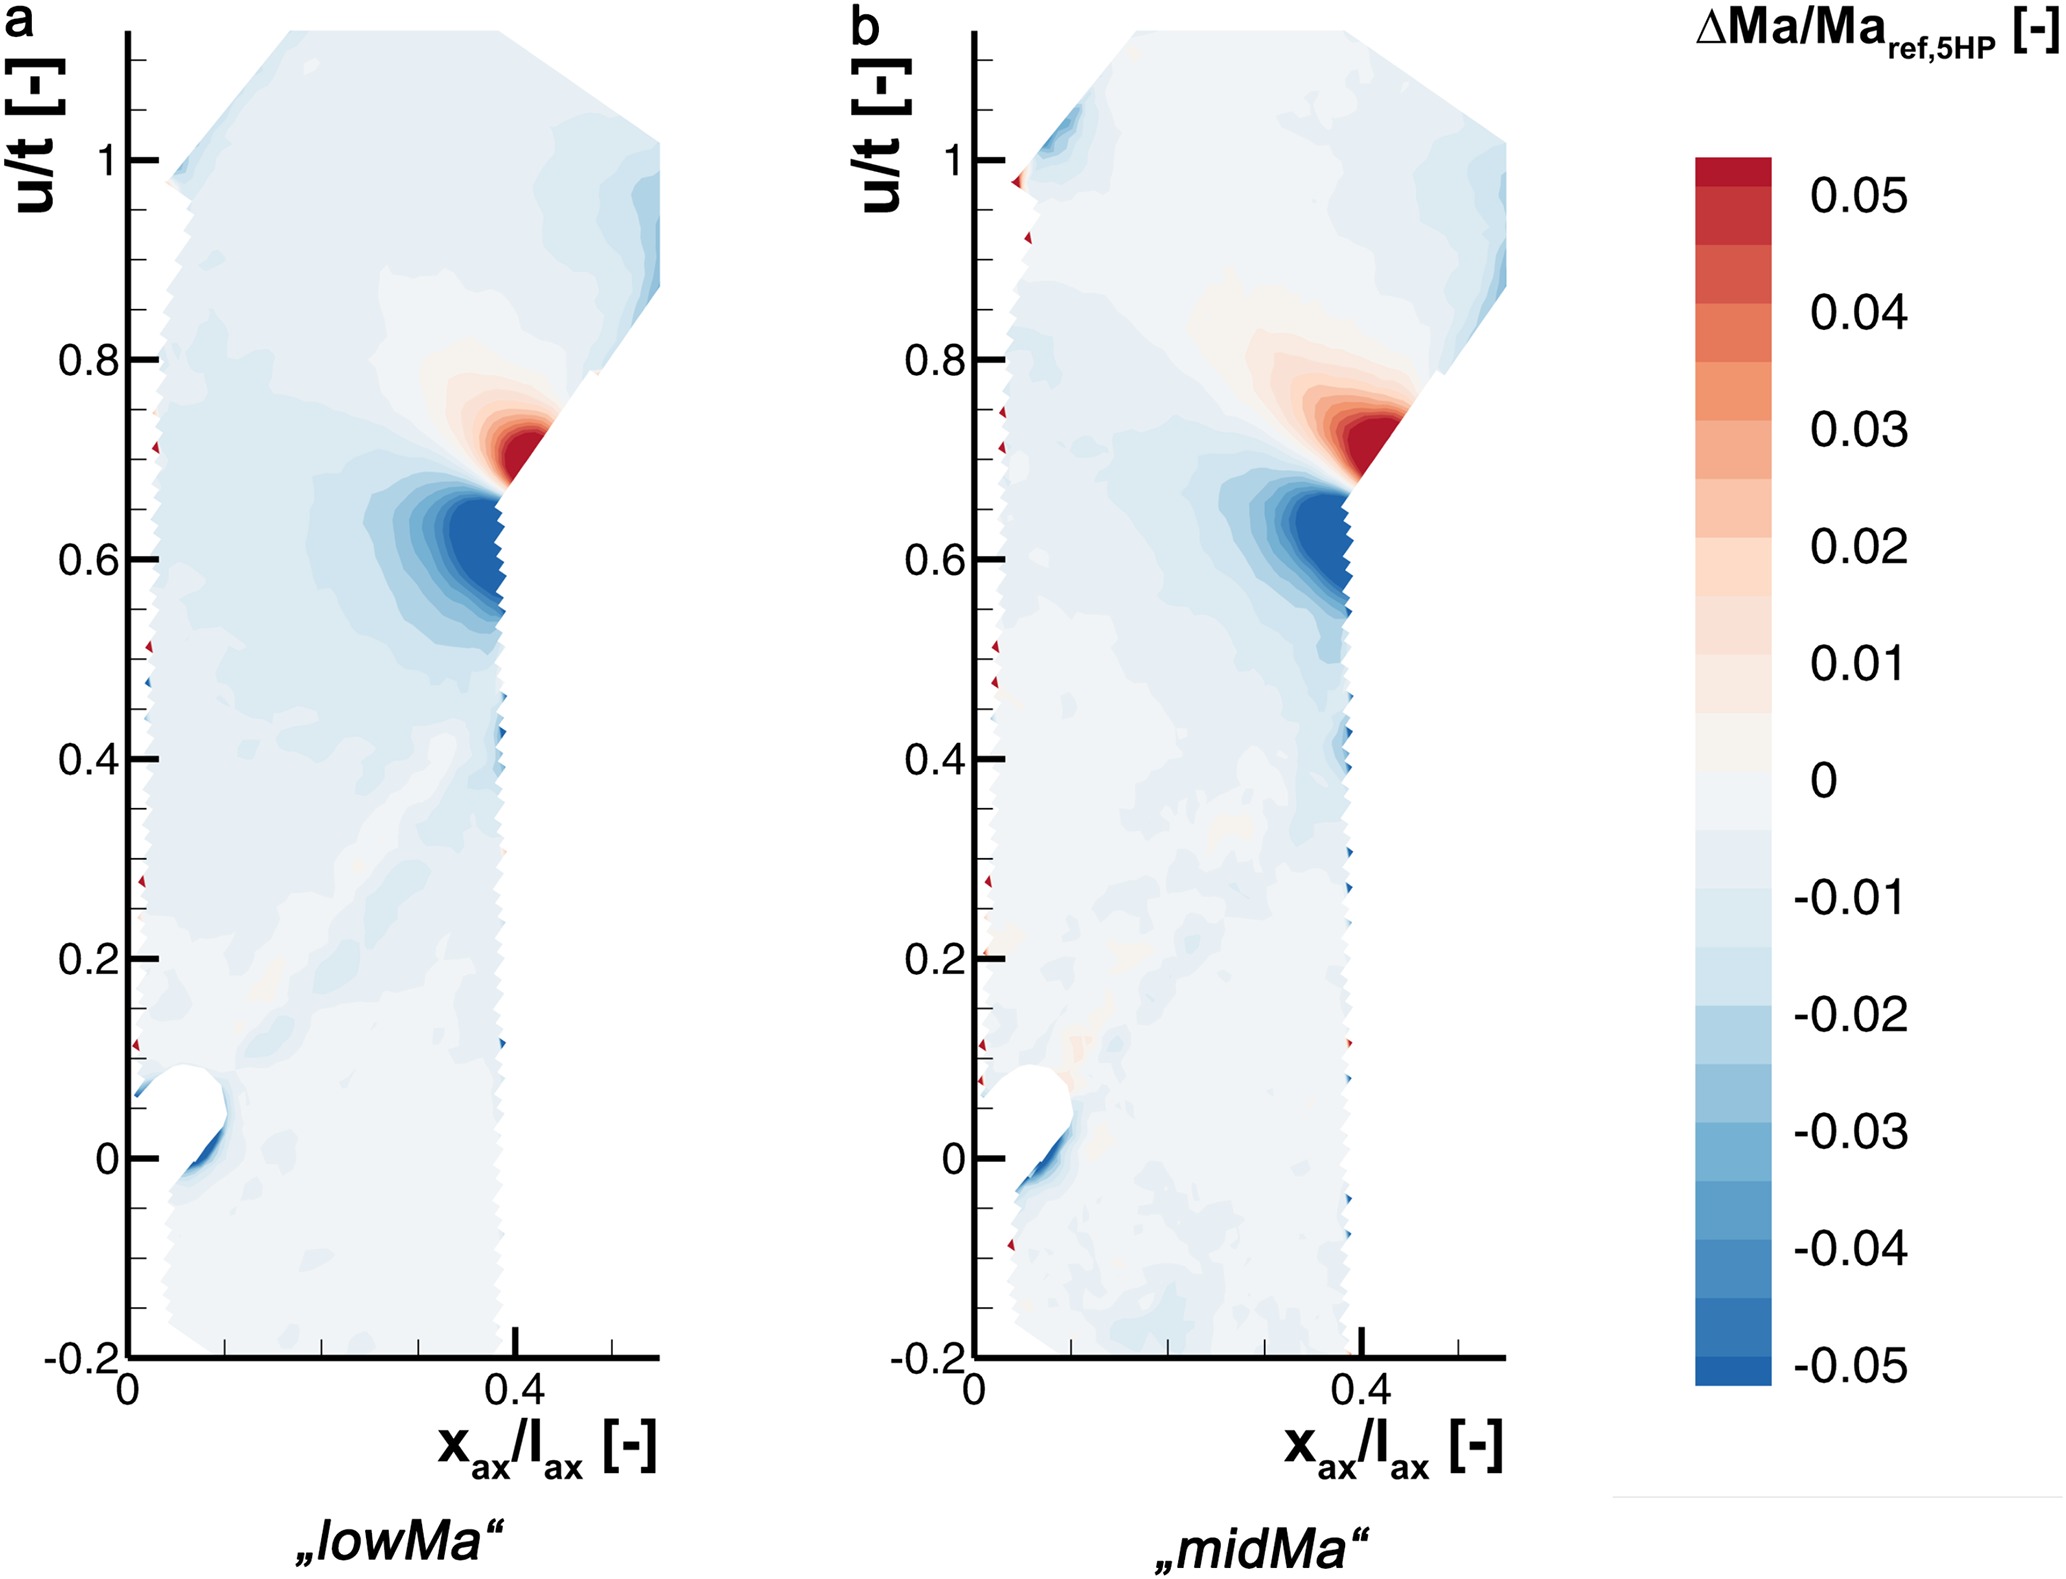
The highest differences in the flow field with inserted probe are found at “Pos4” as can be seen in Figure 8d. Compared to that, Figure 9 shows less deviation of the flow field for the two lower exit Mach numbers. Nevertheless, a slight velocity deficit caused by the probe and its support can clearly be observed for all investigated cases between “Pos1” and “Pos4”. Herein, the flow is generally 0.5% to 1% slower with the probe present compared to the “clean”-case. The blockage effect also results in a decreasing isentropic surface Mach number at the rear part of the suction side, which is measured at blade five. However, investigations with the 5HP one pitch shifted, i.e. downstream of blade five instead of blade four, did not change the suction side pressure distribution. That means that the blockage of the probe and support only affects the passage above the blade of investigation (i.e. off the pressure side of the center blade four). The mass flow blocked by the probe has to bypass through the neighboring passages. This can be observed in Figure 8e by slightly faster flow downstream of the fourth blade with the probe at its farthermost position. However, the blockage induced by the probe is still low. Measurements in rotating turbine facilities exhibit much higher disturbances, especially in transonic flow regimes. Because there, the probe stem has to be mostly perpendicular to the flow, the blockage effect leads to a change in dynamic pressure of up to 15% (Truckenmüller and Stetter, 1996).
The results conclude that the probe does not introduce significant disturbances into the wake flow field of the transonic turbine cascade at a measurement distance of 40% axial chord length downstream of the trailing edge. The observed effects on the flow field around the probe head do not explain the overestimation, which has to be caused by the strong gradients in the transonic turbine wake flow field itself.
Conclusions
Detailed measurements with a five-hole-probe (5HP) featuring a blunt, spherical head shape were performed in the wake flow of transonic turbine cascade. The objective of the investigations was to approve the 5HP measurements by comparing it to PIV flow field results and determine the influence of the probe onto the wake flow field. Therefore, different cascade exit flow Mach numbers close to Ma = 1 were analyzed for two separate probe Reynolds numbers (6,500 and 13,000). The results of the 5HP were compared to particle image velocimetry (PIV) measurements at an position 40% axial chord length downstream of the cascade outlet plane. The influence of the probe on the flow field was analyzed with a combined setup of PIV and the probe in the wake flow. Furthermore, the sensitivity of the blunt 5HP measuring the flow Mach number close to Mach 1 was investigated.
A good agreement of the Mach number topology with 5HP and PIV were shown at high subsonic flow Mach numbers, especially in the velocity wake and at the outermost parts of the blade pitch traverse. Although, an overestimation of the Mach number by the 5HP was observed in those wake regions where strong gradients are present. This deviation is small at low and moderate Mach numbers and increases with the flow Mach numbers getting close to Ma = 1. From the PIV flow field, those regions exhibit interactions of the wake induced by the blade and the suction side flow field of the neighboring blade. There, the 5HP is exposed to strong gradients in both total and static pressure, which is typical for wake flow fields of transonic turbines. It was shown that the influence of the Reynolds number, as well as a non-uniform temperature distribution from vortex shedding (Eckert-Weise effect) can be excluded as source for this overestimation.
In addition, a decreasing sensitivity was shown for the evaluation of the Mach number from the pressure taps at the blunt, spherical head shaped 5HP in flows close to Ma = 1. It was demonstrated that the impact of a small pressure error increases the uncertainty by factor of five close to Mach unity. An improvement can be achieved by an optimized probe design, as suggested by Kost (2009).
The PIV measurements with the 5HP inserted into the flow field revealed just a slight blockage effect of less than 1% for the investigated exit flow Mach number cases. Furthermore, local flow perturbation close to the probe head were observable, but they are not influencing the wake flow field significantly.
This leads to the conclusion that the major challenge for the blunt head shaped 5HP are the strong gradients arising from a merge of the blade wake and the transonic suction side flow field of the adjacent turbine blade. The complex flow gradients cause a different pressure distribution on the probe head compared to the one at free stream conditions during the probe calibration. The decreasing sensitivity of the probe close to Mach 1 fosters an overestimation of the Mach number especially in high subsonic flows. Therefore, great care has to be taken interpreting the Mach number measurements of blunt head shaped 5HP probes in gradient flows with Ma > 0.8.
In order to achieve better performance in the transonic flow regime other head shapes of pneumatic probes should be considered. Initial investigations with a wedge type probe already demonstrated improvements by reducing the uncertainty in transonic flows and the measurement results are less affected by the high gradients. Continuing investigations are scheduled on that. Furthermore, reducing the size of the probe head will be on focus, because concentrating the pressure taps in a smaller region is favorable in gradients flows, too. An optimized probe design seems to be highly promising to enhance the Mach number measurements in the wake flow of transonic turbine cascades.
Nomenclature
Subscripts
0 … 4
numbering of five-hole-probe pressure taps
1
conditions upstream of cascade
2
conditions downstream of cascade
5HP
five-hole-probe
ax
axial direction (normal to cascade outlet plane)
c
pressure tank ambient value
high
highest turbine exit flow Mach number case
p
probe
ref
reference at u/t = 0
t
total condition
th
theoretical (isentropic conditions)