
Introduction
Ever-increased passenger and cargo volumes drive the increasing number of aircrafts and global routes, which has prompted more aero-engines to be utilized in areas with high concentrations of contaminant particles. Particulates (dust, sand, volcanic ash, sea salt, debris, and impurity after fuel combustion, for instance), show a non-negligible effect on the performance, service life, and safety of the aero-engine. Particles first erode the fan and compressor blades, causing thrust loss, and then enter the combustion chamber to block the fuel nozzles and the cooling holes on the liner wall, forming carbon deposits and making the combustion chamber to be easily burned in a high temperature. Because of the high temperature, pressure, and velocity of the mainstream gas, the turbine is more vulnerable to the deposits of particles. In the high-pressure (HP) turbine, on one hand, the deposits of particles change the profile of the blade, reducing the aerodynamic efficiency; on the other hand, the deposits of particles not only increase the surface roughness (Bons, 2010), enhancing the heat transfer between the blade and the fluid, but also block the film cooling holes (Dunn et al., 1996), resulting in reduced cooling performance of the blade. After passing through the stator vane, the hot gas entrains the particles into the rotor blade with elevated velocity, leading to more serious erosion and deposition effects with the action of the high rotating speed of the rotor.
For the sake of a better understanding of the particle deposition in turbine so that the future design of an aero-engine can have the ability of a high-level particle tolerance, many fundamental researches have been carried out, including theoretical studies, experiments, and numerical simulations. Theoretical studies are mainly concentrated on the migration mechanism of particles flowing with the mainstream and the collision mechanism of particles impacting on the airfoil surface (Mueller et al., 2005; Forsyth et al., 2016; Yang et al., 2016). Experimental researches are divided into full-scale engine test, high temperature test, and normal temperature test according to different test objects and temperatures. Several actual full-scale aero-engines were employed to obtain the damage mechanism under various types of volcanic ash particles with the support of the government (Dunn, 2012; Cosher and Dunn, 2016). Full-scale engine test is the most intuitive method to investigate the deposition of particles since an actual aero-engine is tested under real operating conditions. Nevertheless, it is limited with the expensive cost and long period. By contrast, laboratory facilities are cheaper and easier to conduct. The effects of non-uniform incoming flow conditions, particle properties and film cooling structures were investigated via high temperature test respectively (Crosby et al., 2008; Ai et al., 2011; Bonilla et al., 2012; Casaday et al., 2013; Webb et al., 2013; Prenter et al., 2016; Laycock and Fletcher, 2016). In order to match the large flow in actual operating conditions, low melting point substances are adopted in normal temperature tests to simulate the effect of their deposits on the cooling efficiency of the stator vane, leading edge (Albert and Bogard, 2012; Lawson et al., 2012; Yang et al., 2021b) and endwall (Lawson and Thole, 2010; Mensch and Thole, 2014). With an attempt to have a more comprehensive and accurate study on particle deposition, various deposition models are implemented to numerically simulate particle deposition in turbines. The deposition models utilized in numerical simulations to consider the rebound and adhesion process of particles on impacting the wall includes critical velocity model (Brach and Dunn, 1992), critical viscosity model (Sreedharan and Tafti, 2010), elasto-plastic model (Singh and Tafti, 2013) and OSU model (Prenter et al., 2017).
In order to have a further insight into the deposition effect on turbine components, numerical simulations under actual operating conditions were performed. The Stator vane is of interest for most studies as it is the area with the highest temperature and most deposits. Different operating conditions were adopted to illustrated that the deposition distribution is mainly concentrated on the pressure side (PS) and leading edge (LE) of the vane, and the quantity of deposits strongly increases in view of higher gas temperature and larger particle sizes (Yang et al., 2020). Non-uniform inlet conditions, such as hot streaks (Prenter et al., 2016, 2017) and inlet swirls (Yang et al., 2021a), were found to have a significant influence on the migration pattern and deposition characteristics of particles. As for rotor blade, considering the action of rotating, studies of particle deposition effect are more complicated. The current research mainly focuses on the selection of simulation methods (Zagnoli et al., 2015), and a small part of the research involves the influence of the stator-rotor interaction on the deposition distribution in the subsequent rotor passage (Bowen et al., 2019; Hao et al., 2021).
In the open literature, up to date, there is no laboratory-scale experimental research on the deposition of particles over rotor blades, and ever considering the rotating action, to the authors’ knowledge. Rare studies of particle deposition effect conducted on the blade tip area, and the basic understanding of particle migration and deposition within a rotating turbine passage is not clear. Therefore, since there is lack of a basic understanding of particle migration and deposition characteristics in a rotating turbine passage, the purpose of the present study is to numerically simulate the particle behaviours in a rotor passage of the first-stage turbine and the distributions of deposits on rotating parts. Simulations with Unsteady Reynolds-Averaged Navier-Stokes (URANS) were undertaken considering the effects of different rotating speeds by characterizing various tip clearances and cavity depths, so as to more clearly understand the mechanisms of particle deposition on rotor blades, which hopefully in turn improves particle tolerance in rotor passages.
Methodology
Computational domain and flow solver
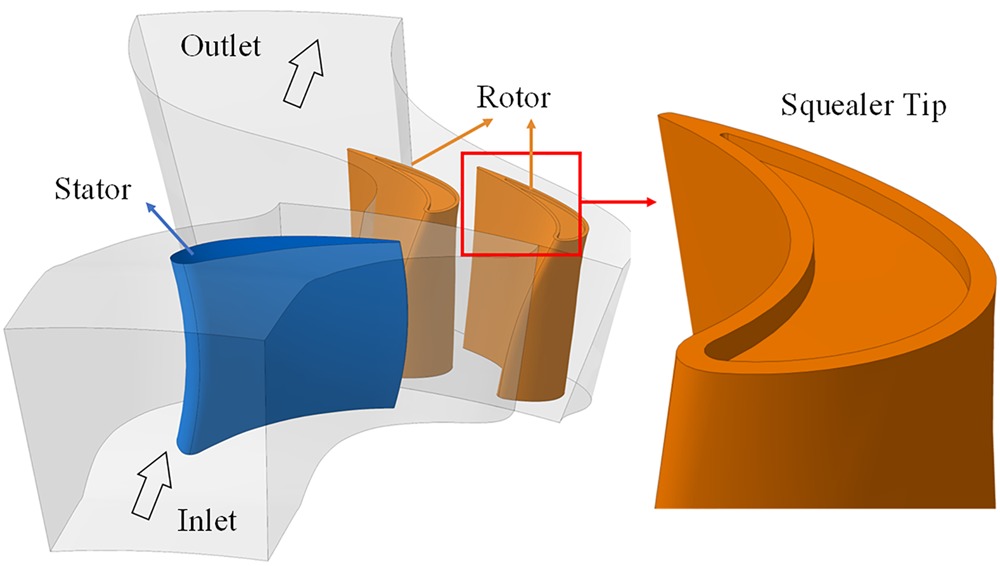
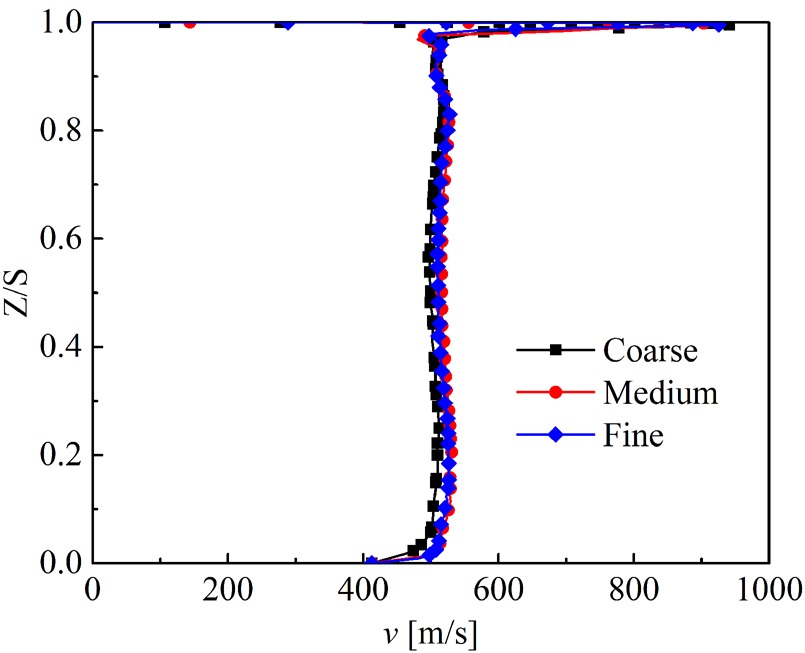
The first-stage HP turbines for an aero-engine is selected as the calculation model and presented in Figure 1. The actual numbers of stators and rotors are 40 and 68. For convenience of the unsteady calculation, the number of stators is reduced and the final computational domain contains one stator passage and two rotor passages. Squealer tips with different tip clearance and cavity depth were employed and the parameters are tabulated in Table 1. Numerical simulations were conducted to predict the mainstream flow in the first stage of a HP turbine by URANS method employing the ANSYS FLUENT software. The time step is 1/50 of the rotation period of a rotor blade. The computational domain was generated into fully-unstructured grid with twenty layers of refined prism near the wall surfaces, ensuring that the non-dimensional distance, y+, is below 1.0, which is appropriate for the application of the Standard k-ω turbulence model, which was validated with relevant experimental data (Hao et al., 2021). A grid-independent analysis was conducted, shown in Figure 2, by meshing coarse, medium, and fine grids and checking the grid-sensitivity of velocity magnitude profiles at the mid-passage of the rotor outlet along the spanwise direction. The fine mesh achieved the grid-independent solution, which contained approximately 6.9 million and 11.2 million elements in the stator and rotor zones, respectively.
Boundary conditions
Operating conditions of the turbine for the present study were a setting of economic cruise for an advanced aero-engine, as summarized in Table 2. A uniform total pressure and temperature distribution were specified at the vane inlet, and a static pressure at the rotor outlet, respectively. Three different rotating speeds (80%, 100%, and 120% of the design rotating speed) were considered. Periodic boundary conditions were implemented and a sliding mesh was used at the interface between vane and rotor domains to transmit flow and particle information from one to another. All walls were set as a no-slip, adiabatic condition.
Table 2.
Cruise operating conditions.
During the flight of an aero-engine, in most working conditions the volumetric fraction of the inhaled particles is small enough to have a negligible effect on the mainstream flow. Therefore, the discrete phase model (DPM) inherently in the Fluent is able to accurately predict the trajectories of the particles, in which the Euler-Lagrange method is applied to compute the trajectory of particles by comparing the inertia force and other forces induced by the mainstream. The Bridger Power Station (JBPS) subbituminous (Barker et al., 2013) are selected as the particles utilized in this study and the material property is displayed in Table 3. Particulates are injected at the vane inlet and each center of the surface cells is an injection source. The velocity and temperature of the particles at the vane inlet are equal to those of the mainstream gas through extracting the flow field information and assigning to the particles by the user defined function (UDF).
Table 3.
Particle property and inject condition (Barker et al., 2013).
Critical velocity model
The behaviours of particles, such as deposit, rebound, and detach, after impacting on the wall surfaces depend on compiled UDF conducted in the Fluent code. The critical velocity deposition model applied in present study is in good agreement with the experimental data (Ai and Fletcher, 2012). The critical velocity model was proposed (Brach and Dunn, 1992) to decide the deposition of particles on impacting the wall through comparing the normal impact velocity and the critical velocity. When the critical velocity is larger than the impact velocity, particles are supposed to stick onto the wall, otherwise rebound from the surface. The critical velocity is described as:
where
Detachment model
The detachment modelis adopted since particles can be detached from the wall by the shear force of the gas flow (El-Batsh, 2001), which is given as:
where
Results and discussion
Particle migration
The distribution of deposits on the blade surface is not only determined by the migration pattern of particles in the rotor passage, but also related to the characteristics of mainstream flow. Therefore, the migration of particulates in the turbine passage is firstly discussed and the particle trajectories in the passage at different rotating speeds are presented in Figure 3. The trajectories of particles are coloured by velocity magnitude and the diameter of the sphere represents the 10 times sizes of the particles for a clear observation. Multiple bounces are presented on the vane and the blade surfaces since the impact velocity of particles striking onto the airfoil is much greater than the critical velocity under the cruise condition. Some particles directly impact onto the blade surface after passing through the vane passage, and the other particles impact onto the downstream regions of the blades after rebounding from the blade leading edge. At ω = 12,000 rpm, the particles impacting onto the area before the mid-chord bounce upstream, having a shorter migration distance on the blade surface, while the ones impacting onto the area after the mid-chord bounce downstream and some of them pass through the rotor ultimately. With the rise of rotating speed, the injection angle (the angle of the particle flow relative to the axial direction) of particles at the rotor inlet increases and more particles impact on the area before the mid-chord. Therefore, there are more particles leaving from the rotor outlet at ω = 9,600 rpm compared with the rotating speed of 14,400 rpm.
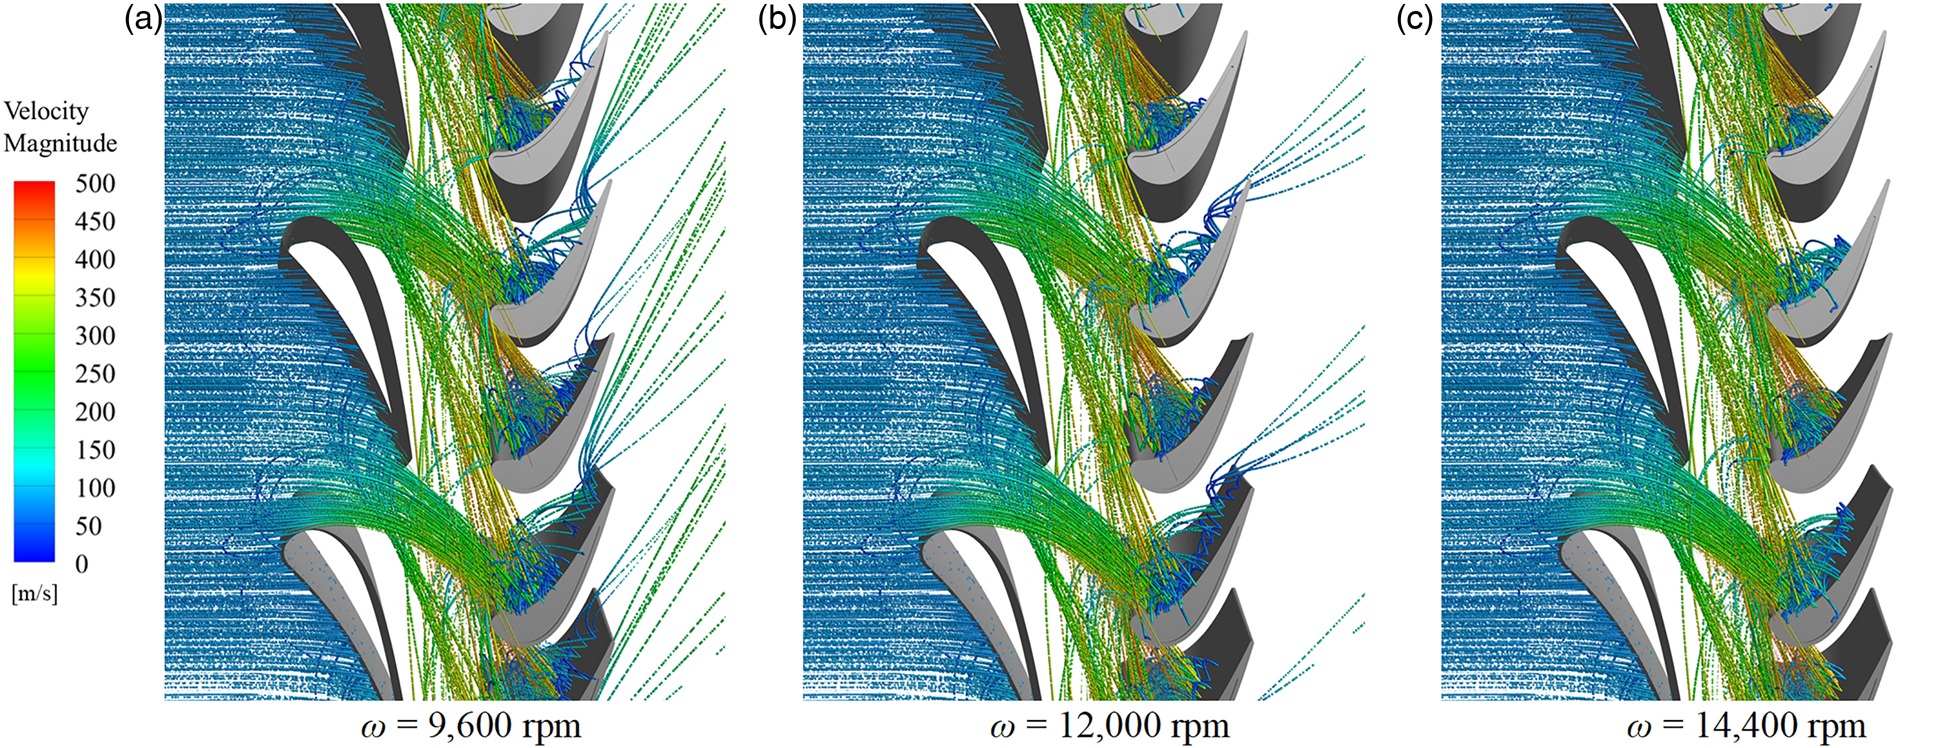
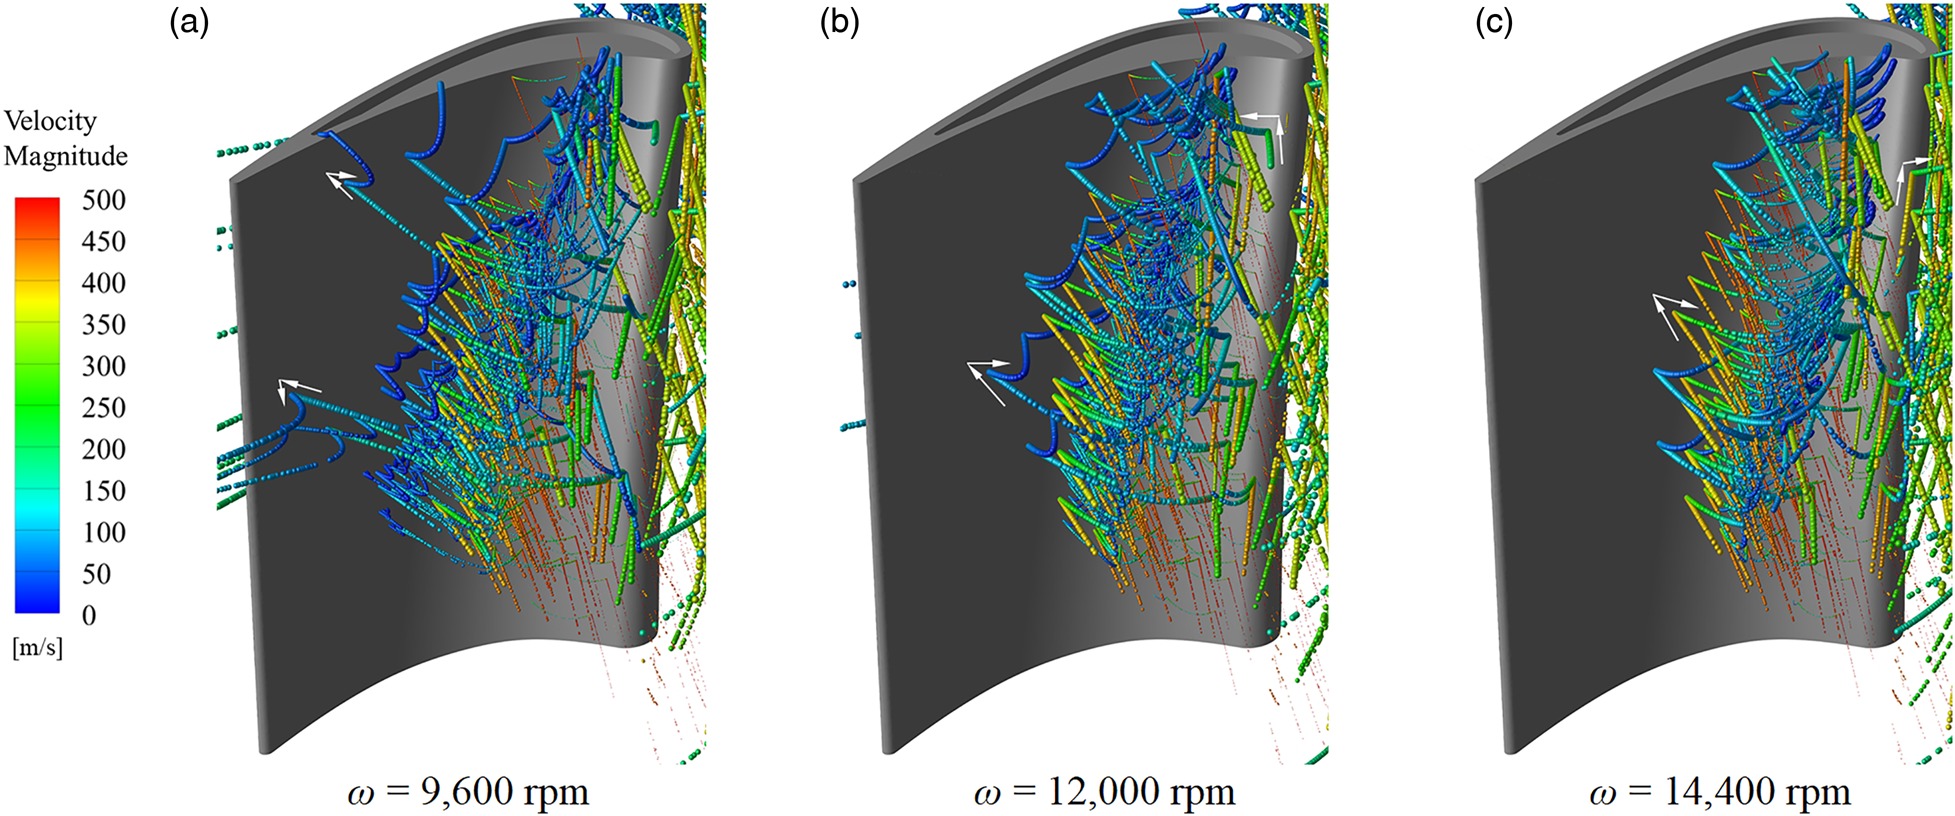
Figure 4 displays the trajectories of the particles on the blade surface in a close-up view. Because of the energy consumption of every single impact, the rebound velocity is lower than the impact velocity, and the particles finally stop on the surface of the blade. Owning to a smaller injection angle at a lower rotating speed, the impact position of particles on the blade surface is more dispersed, and the migration range of the rebound is wider. Particles with a small diameter have a higher impact velocity since their less inertia which makes them more susceptible to the influence of the fluid. Because of larger particle sizes, the number and the distance of rebounds on the surface increase. Given the turning shape of the rotor blade, particles, impacting on the blade surface, are more likely to bounce on the side wall of a “bowl” and finally stop at the bottom of the “bowl”, where the PS has a strong concave curvature. In addition, owing to the centrifugal force under rotating conditions, larger particles are easier to migrate towards the tip area of the blade, and a small part of the particles enter the tip clearance after multiple rebounds due to the entrainment of the leakage flow.
Particles in the tip clearance and squealer tip show a complex migration behaviour, the information of the fluid field is thus provided to better illustrate the migration of particles. The streamlines of the fluid coloured with velocity magnitude and started from the squealer tip is presented in Figure 5, in which the effect of different rotating speeds, tip clearances, and cavity depths are considered. It can be observed from the figure that there is a pair of vortexes with opposite rotating direction in the squealer tip. The vortex near the PS rim is generated by the leakage flow, carrying particles into the tip clearance, and the vortex near the suction side (SS) rim results from the rotating action, which has the capacity of carrying particles into the cavity. Because of the opposite rotating direction, the two vortexes counteract each other at the confluence, forming a low-speed zone where the shear force is reduced, which provides a favourable condition for particles to deposit.
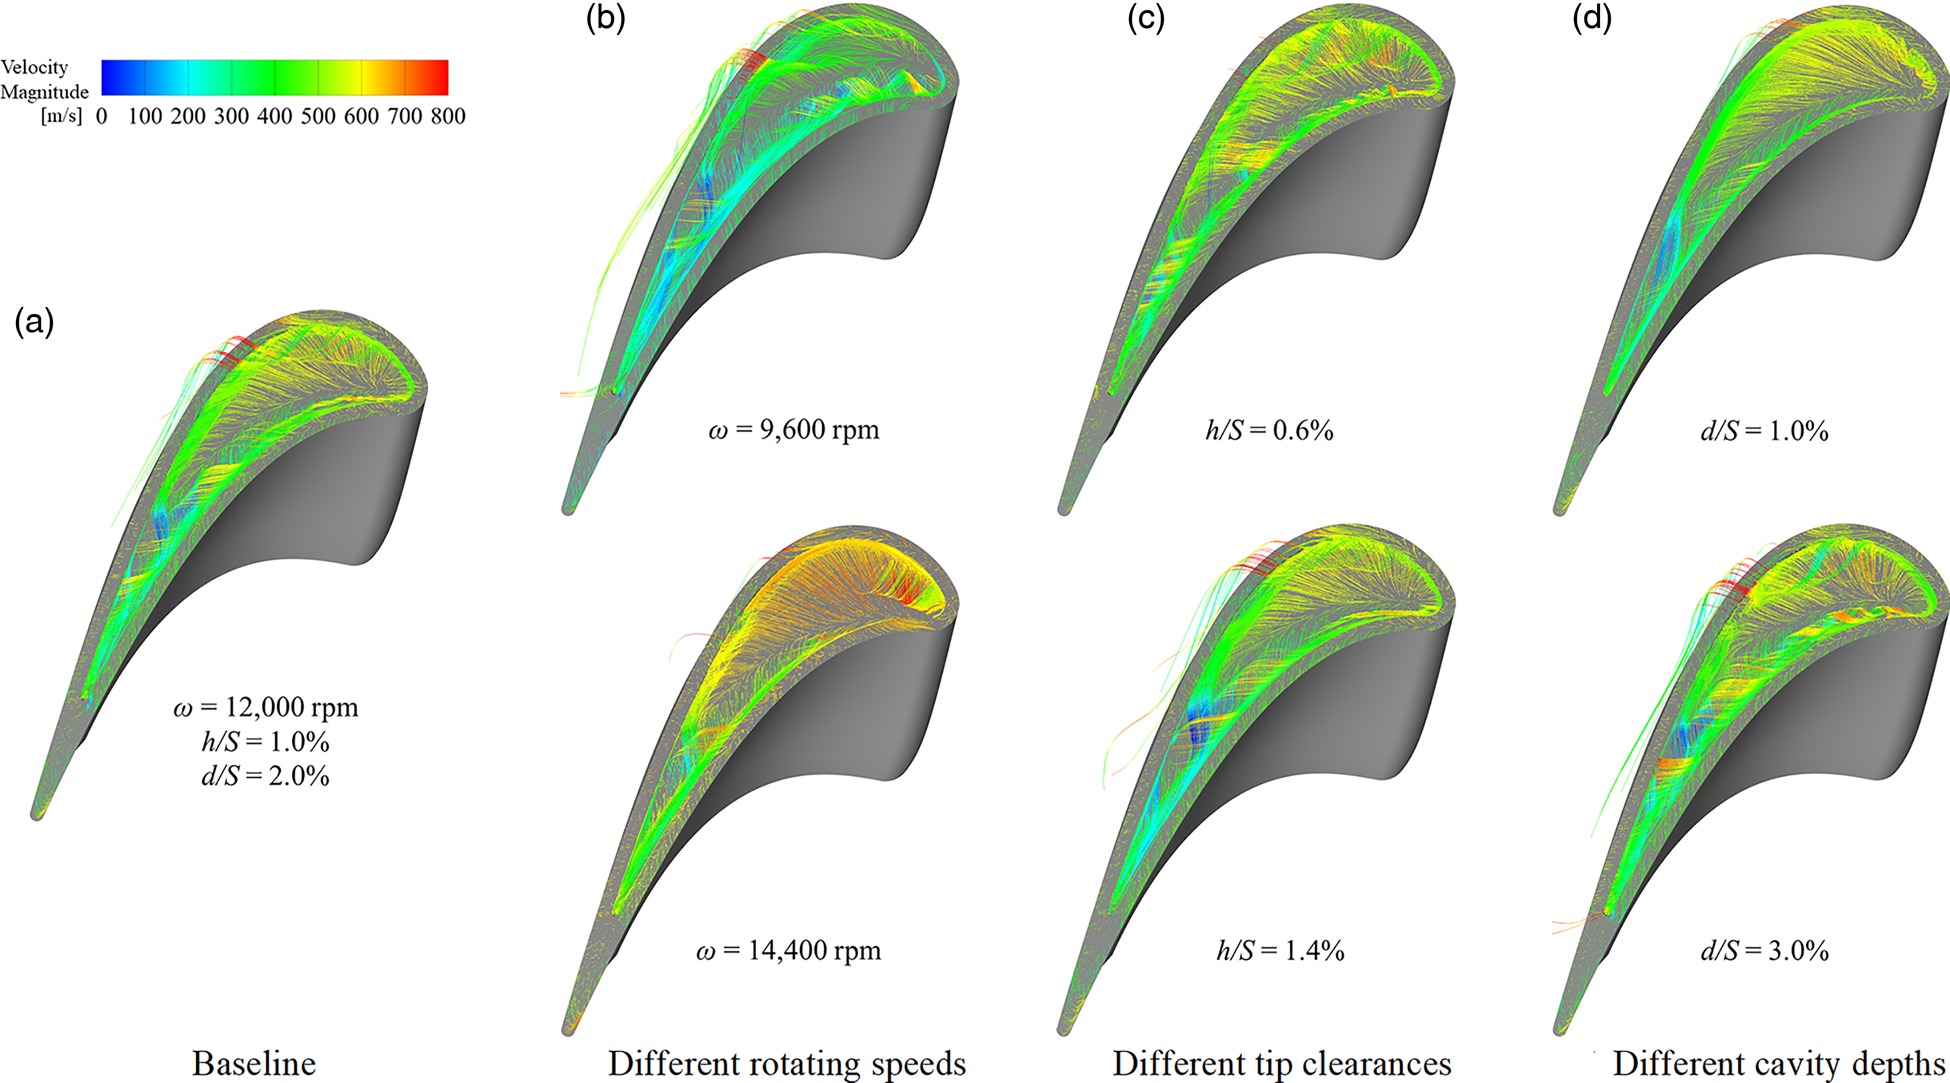
The intensity of the vortex near the PS rim is stronger than that near the SS rim at a low rotating speed, and gradually increases due to the growth of the pressure difference between the SS and PS of the blade as the rise of the rotating speed. However, this increase is not as large as that of the vortex near the SS rim, resulting from the rotating action, and the low velocity zone gradually disappears as the SS vortex dominates in the squealer tip; Since the rotating speed remains the same under different tip clearances, the intensity of the vortex near the SS rim is basically the same, but the shape of the vortex changes that is flatter in a small tip clearance. The flow area gets bigger because of the increase of the tip clearance, leading to a strong intensity of the vortex near the PS rim. The intensity of the vortex near the PS rim gradually close to that on the SS rim in the downstream region of the mid-chord zone where the two vortexes meet, and thus there is a low velocity area; With a deeper cavity, there is more fluid entering the tip clearance. The intensity of both vortexes near the PS and SS increases at the same rate, which is reflected by the unchanged location of the low velocity zone. Therefore, not only more particles enter the tip clearance carried by the leakage flow, but also they have a higher possibility to impact on squealer tip.
Since the trajectory of the particles in the rotor tip cannot be displayed separately in the calculation, and it is not clear together with all the trajectories, four cut planes are selected in the flow direction, in which the concentration distribution of particles is presented, shown in Figure 6, to have a further insight into the behaviours of particles in the tip clearance. Through the previous migration of particles on the blade surface, it can be found that particles enter the tip clearance in two ways. The first is that the particles near the shroud enter the tip clearance directly with the fluid, and the other one is that the particles which migrate to the tip of the blade by rebound are entrained by the vortex neat the PS rim into the tip clearance. On account of the centrifugal force, the particles entering the tip clearance closely adhere to the shroud and move from the PS to the SS. Some of the particles, affected by the vortex near the SS rim, are drawn into the squealer tip and impact on the surface of the tip rim and cavity tip.
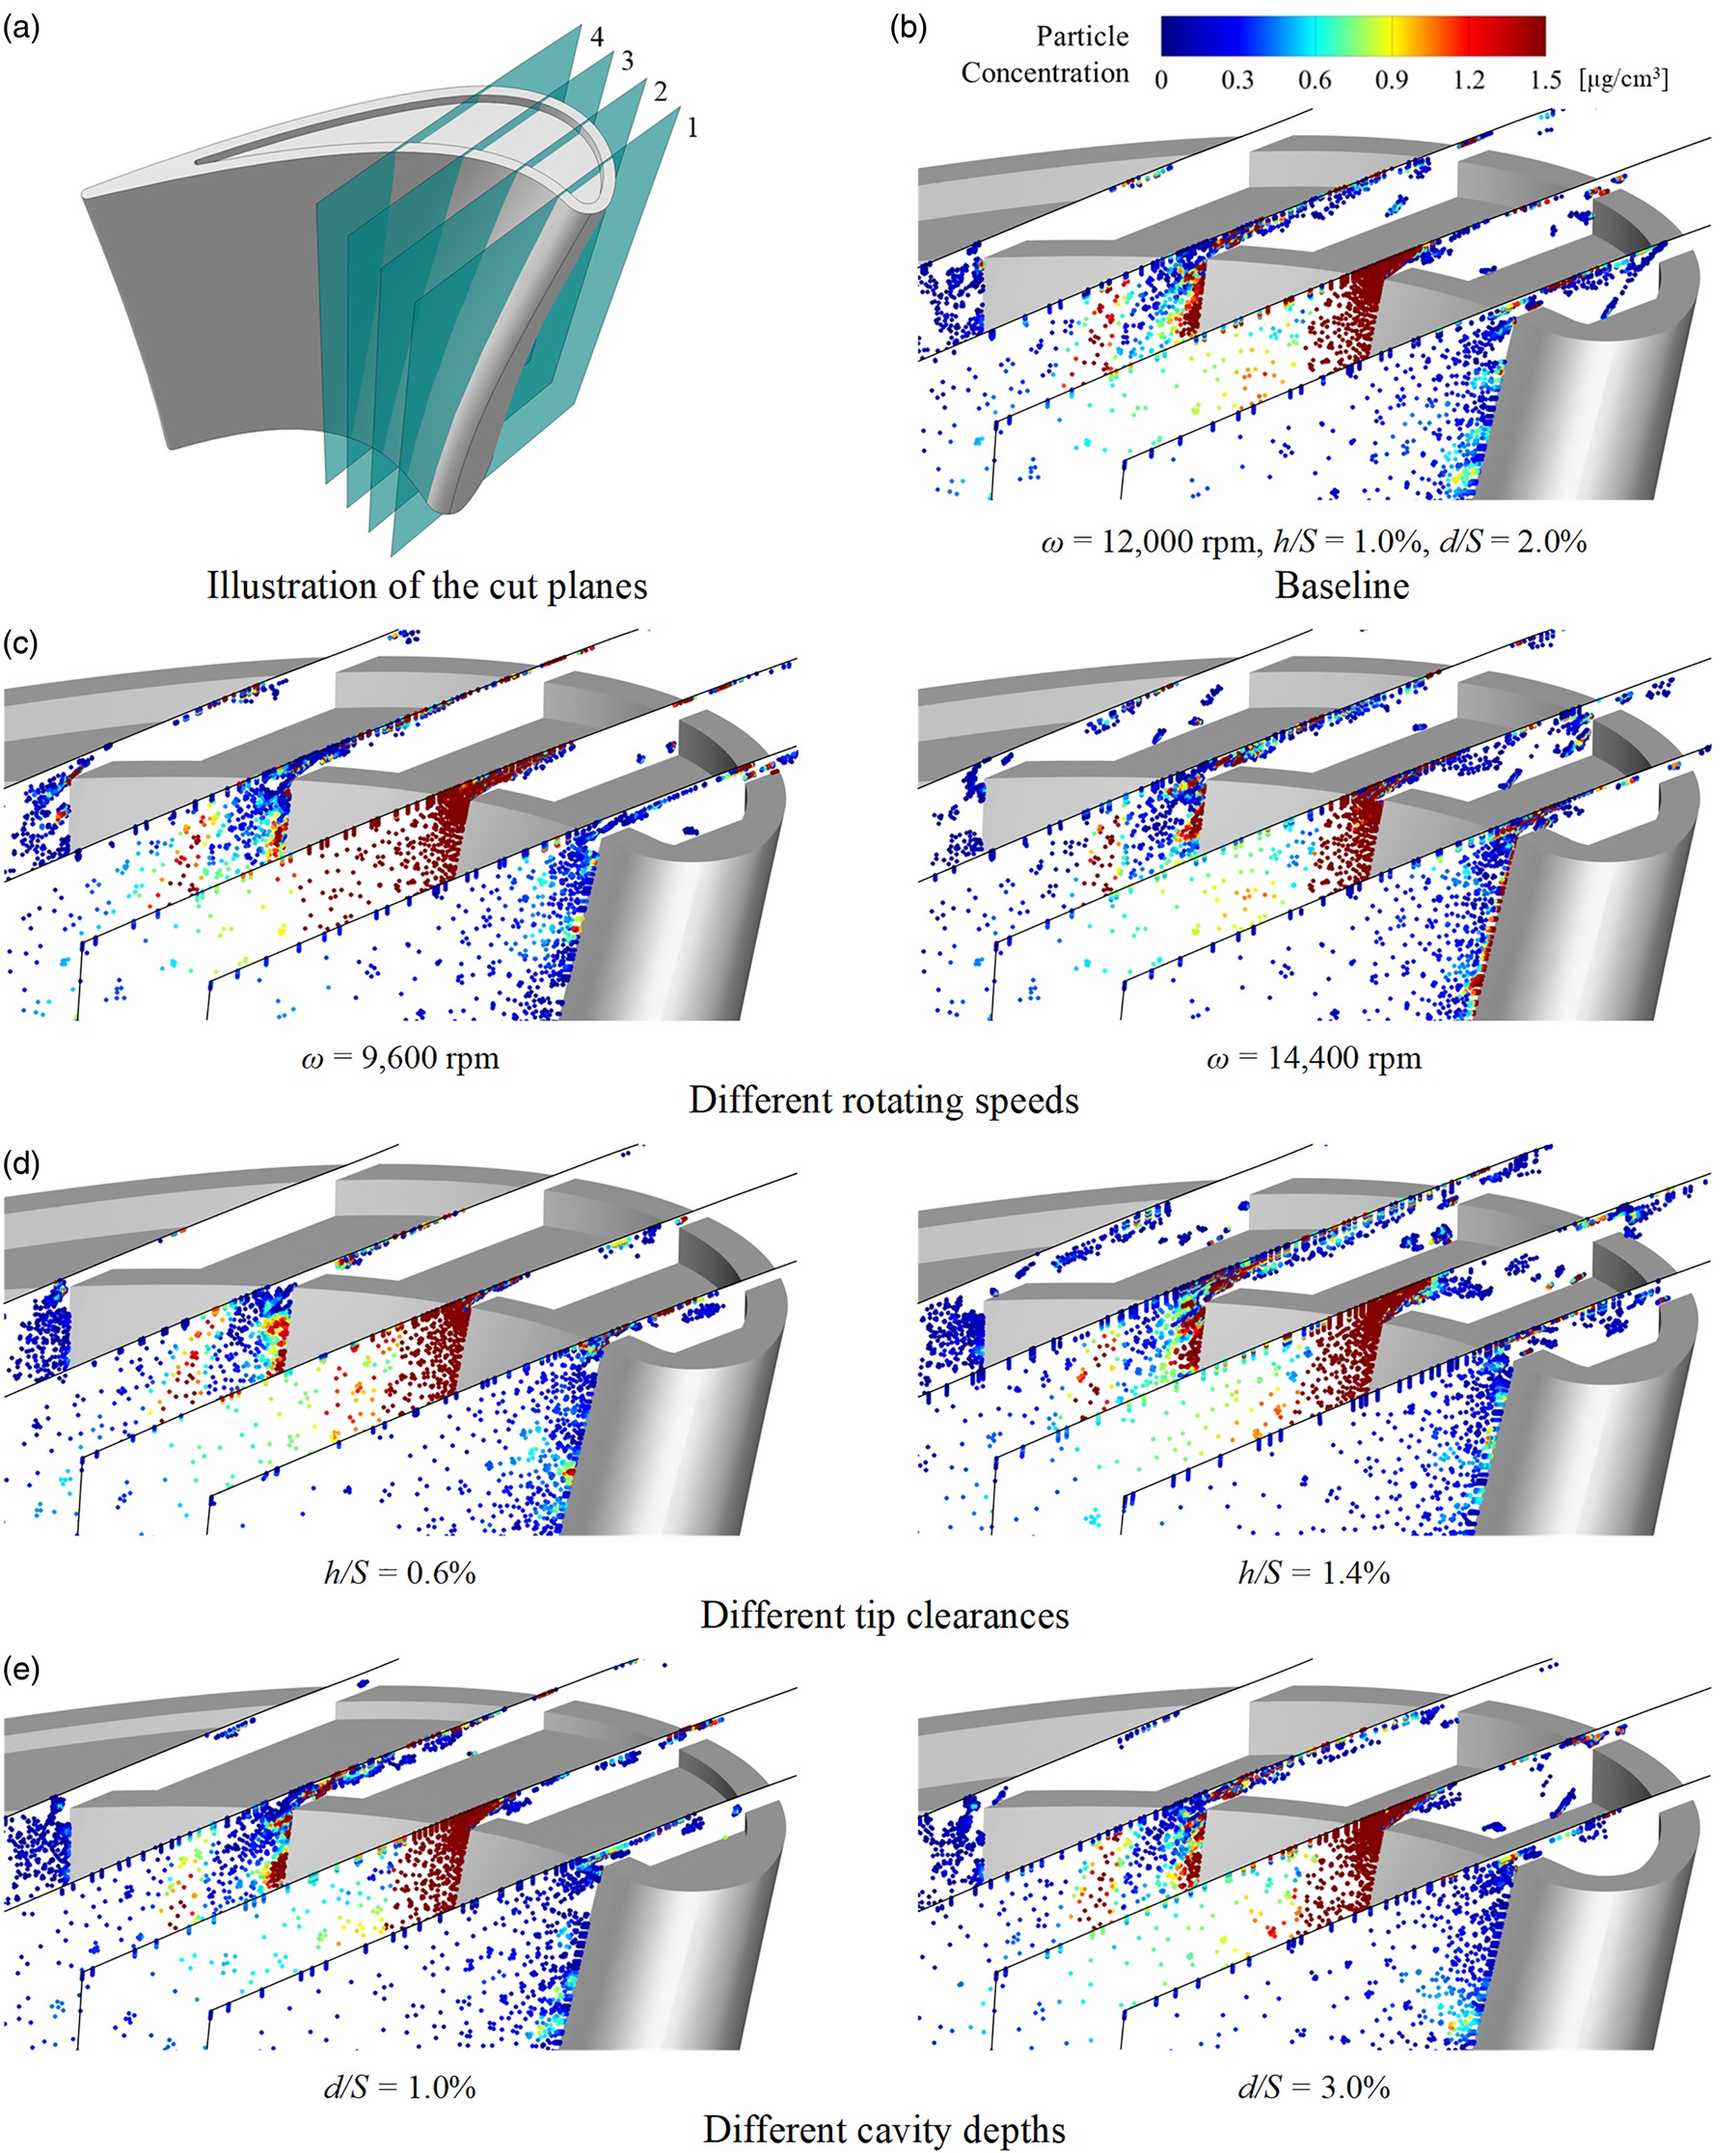
Particles are concentrated on the mid-chord of the PS of the blade tip and little particles enter the cavity at a low rotating speed. With the rise of the rotating speed, a larger intensity of the vortex near the PS rim, induced by a greater pressure difference, sends more particles into the tip clearance, and a larger intensity of the SS vortex, resulting from a higher rotating speed, enhance the flow disturbance, making more particles impact on the squealer tip. Additionally, due to the increase of the particle injection angle, the concentration of particles on the blade tip gradually move to the front of the mid-chord area; The variation of the tip clearance significantly affects the concentration of particles in the tip clearance. A large quantity of particles is carried into the tip clearance by a stronger leakage flow under a larger tip clearance. Besides, although the particles with larger sizes, having greater inertia, are difficult to move with the fluid, due to the increase in the tip clearance, they can also enter the tip clearance through the rebounds with the shroud, and are more likely to impact on the squealer; The growth of the cavity depth enhances the intensity of both the vortex near the PS and SS rim, leading to an increased concentration of particles in the tip clearance and cavity. Moreover, on account of a larger migration space of particles in the tip clearance, particles are easier to deposit.
Particle deposition
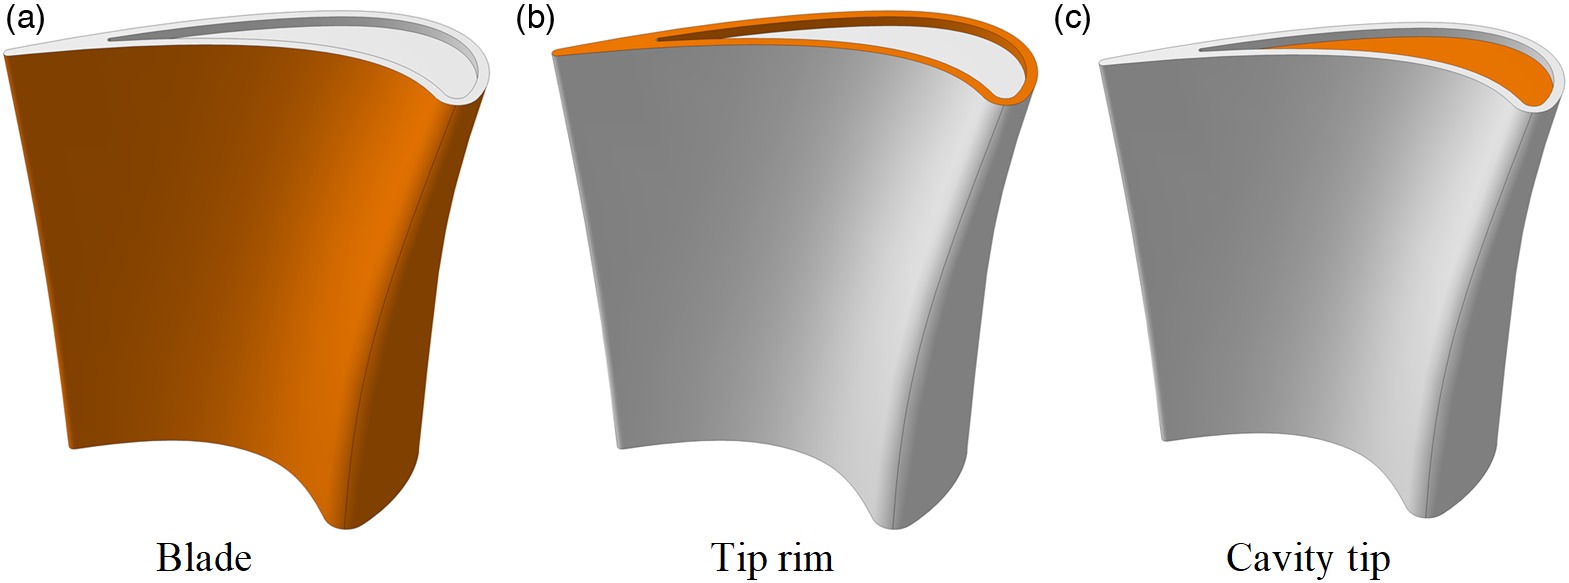
The following part presents the deposition of particles in the rotor passage. Different rotating speeds and squealer tips, with various tip clearances and cavity depths, are investigated to explore their effects on deposition efficiency of particles. The deposition on the rotor blade and tip shows different orders of magnitude in deposition thickness. Therefore, for the clarity of discussion, the rotor is separated into three parts, which is shown in Figure 7. It is noted that when the deposition on one of the three parts is displayed, the remaining two parts do not show the deposition.
The deposition of particles on the rotor blade has different distributions with various rotating speeds, which is presented in Figure 8. It can be observed that the deposits mainly concentrate on the leading edge and the PS of the blade on which especially, there is a strip-like area with dense deposition. Compared with higher rotating speeds, the strip-like area is more dispersed and has less deposition at ω = 9,600 rpm. It is because that the lower impact velocity of particles not only makes particles easier to deposit on the surface in the initial collisions, but also reduces the number of rebounds, and thus particles have less capacity of moving to the area on the PS where the curvature is the greatest. The deposits increase with the rise of the rotating speed. Combining the mainstream information and the trajectory of particles on the blade surface, it can be inferred that the lower rotating speed makes the position where the particles firstly impact moves backward. The rebound direction of particles is toward downstream, which makes it hard to deposit on the rotor blade owing to the larger pressure gradient in the throat area. However, the rebound direction under higher rotating speed is toward upstream and the lower pressure gradient before the mid-chord of the pressure side makes it easy for particles to move and deposit.
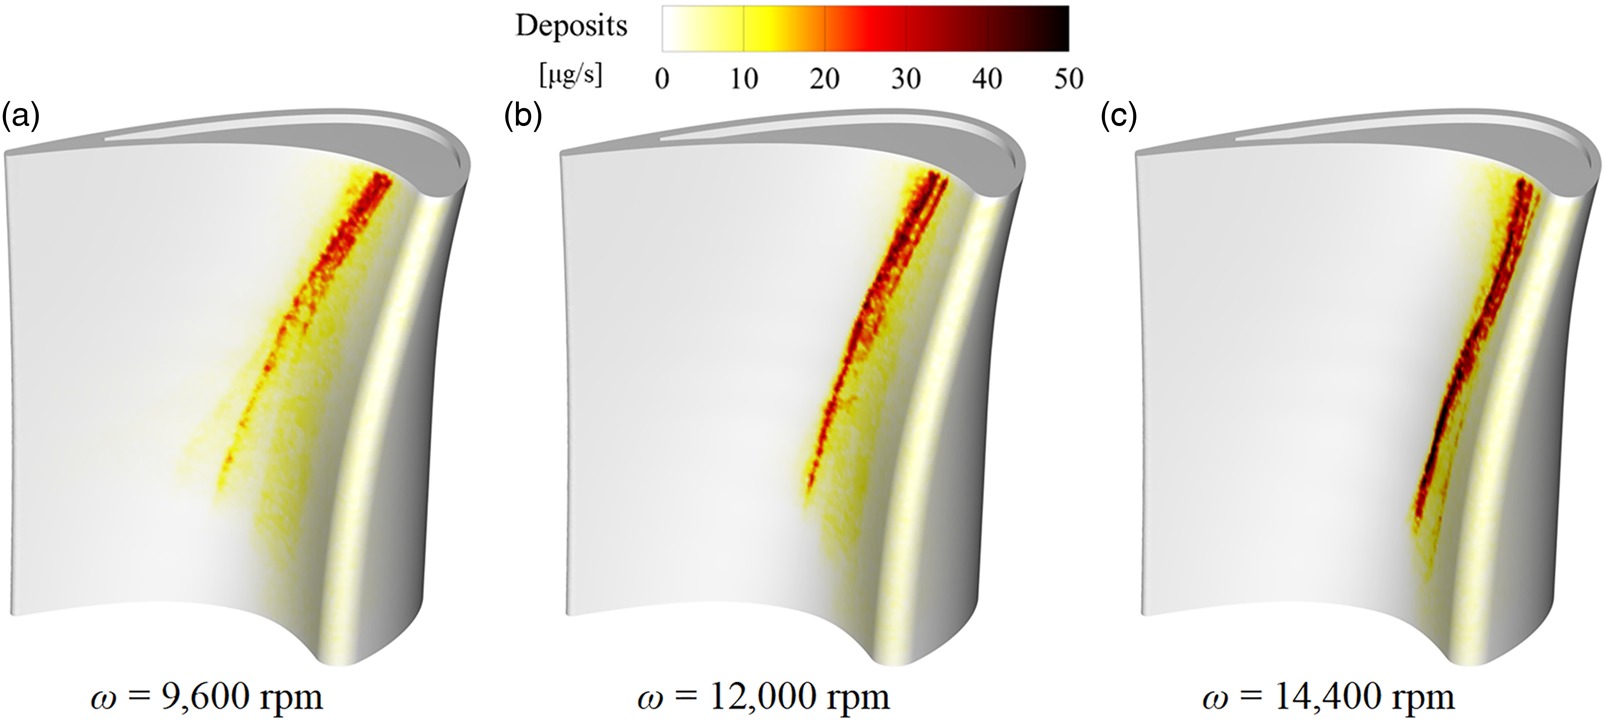
Figure 9 presents the distribution of deposits on the tip rim under different rotating speeds, tip clearances, and cavity depths respectively. In general, the deposits are mainly concentrated on the SS rim before the mid-chord of the squealer tip. For the effect of rotating speed, the stronger intensity of the vortex near the SS rim under a higher rotating speed makes a mass of particles enter the cavity and impact on the SS rim where the deposition mainly concentrates and the quantity of deposits increases with the growth of rotating speed. As the rotating speed increases, the impact position on the blade gradually moves downstream and thus the location of deposition also migrates downstream along the tip chord. Considering that the width of rim in an actual rotor is very thin, the impact and deposition of particles in this location not only damage the structure of the blade, but also increase the leakage flow, leading to an aerodynamic loss; As for the effect of tip clearance, there are more deposits on the tip rim and increase with the growth of the tip clearance. The deposits on the tip rim mainly concentrate on the SS before the mid-chord, and the concentration position is basically the same, not changing with the height of the tip clearance. Besides, as more particles enter the larger tip clearance, the distribution range of the deposition on the tip rim becomes wider; The leakage flow is weaker in terms of a lower cavity depth, and less particles can enter the tip clearance. The vortex near the SS rim also has a low intensity, thus there is a small quantity of particles on the tip rim. With the increase of the cavity depth, not only the deposits on the tip rim increases with a stronger leakage flow, but also there is a more concentrated distribution because of a stronger vortex near the SS rim.
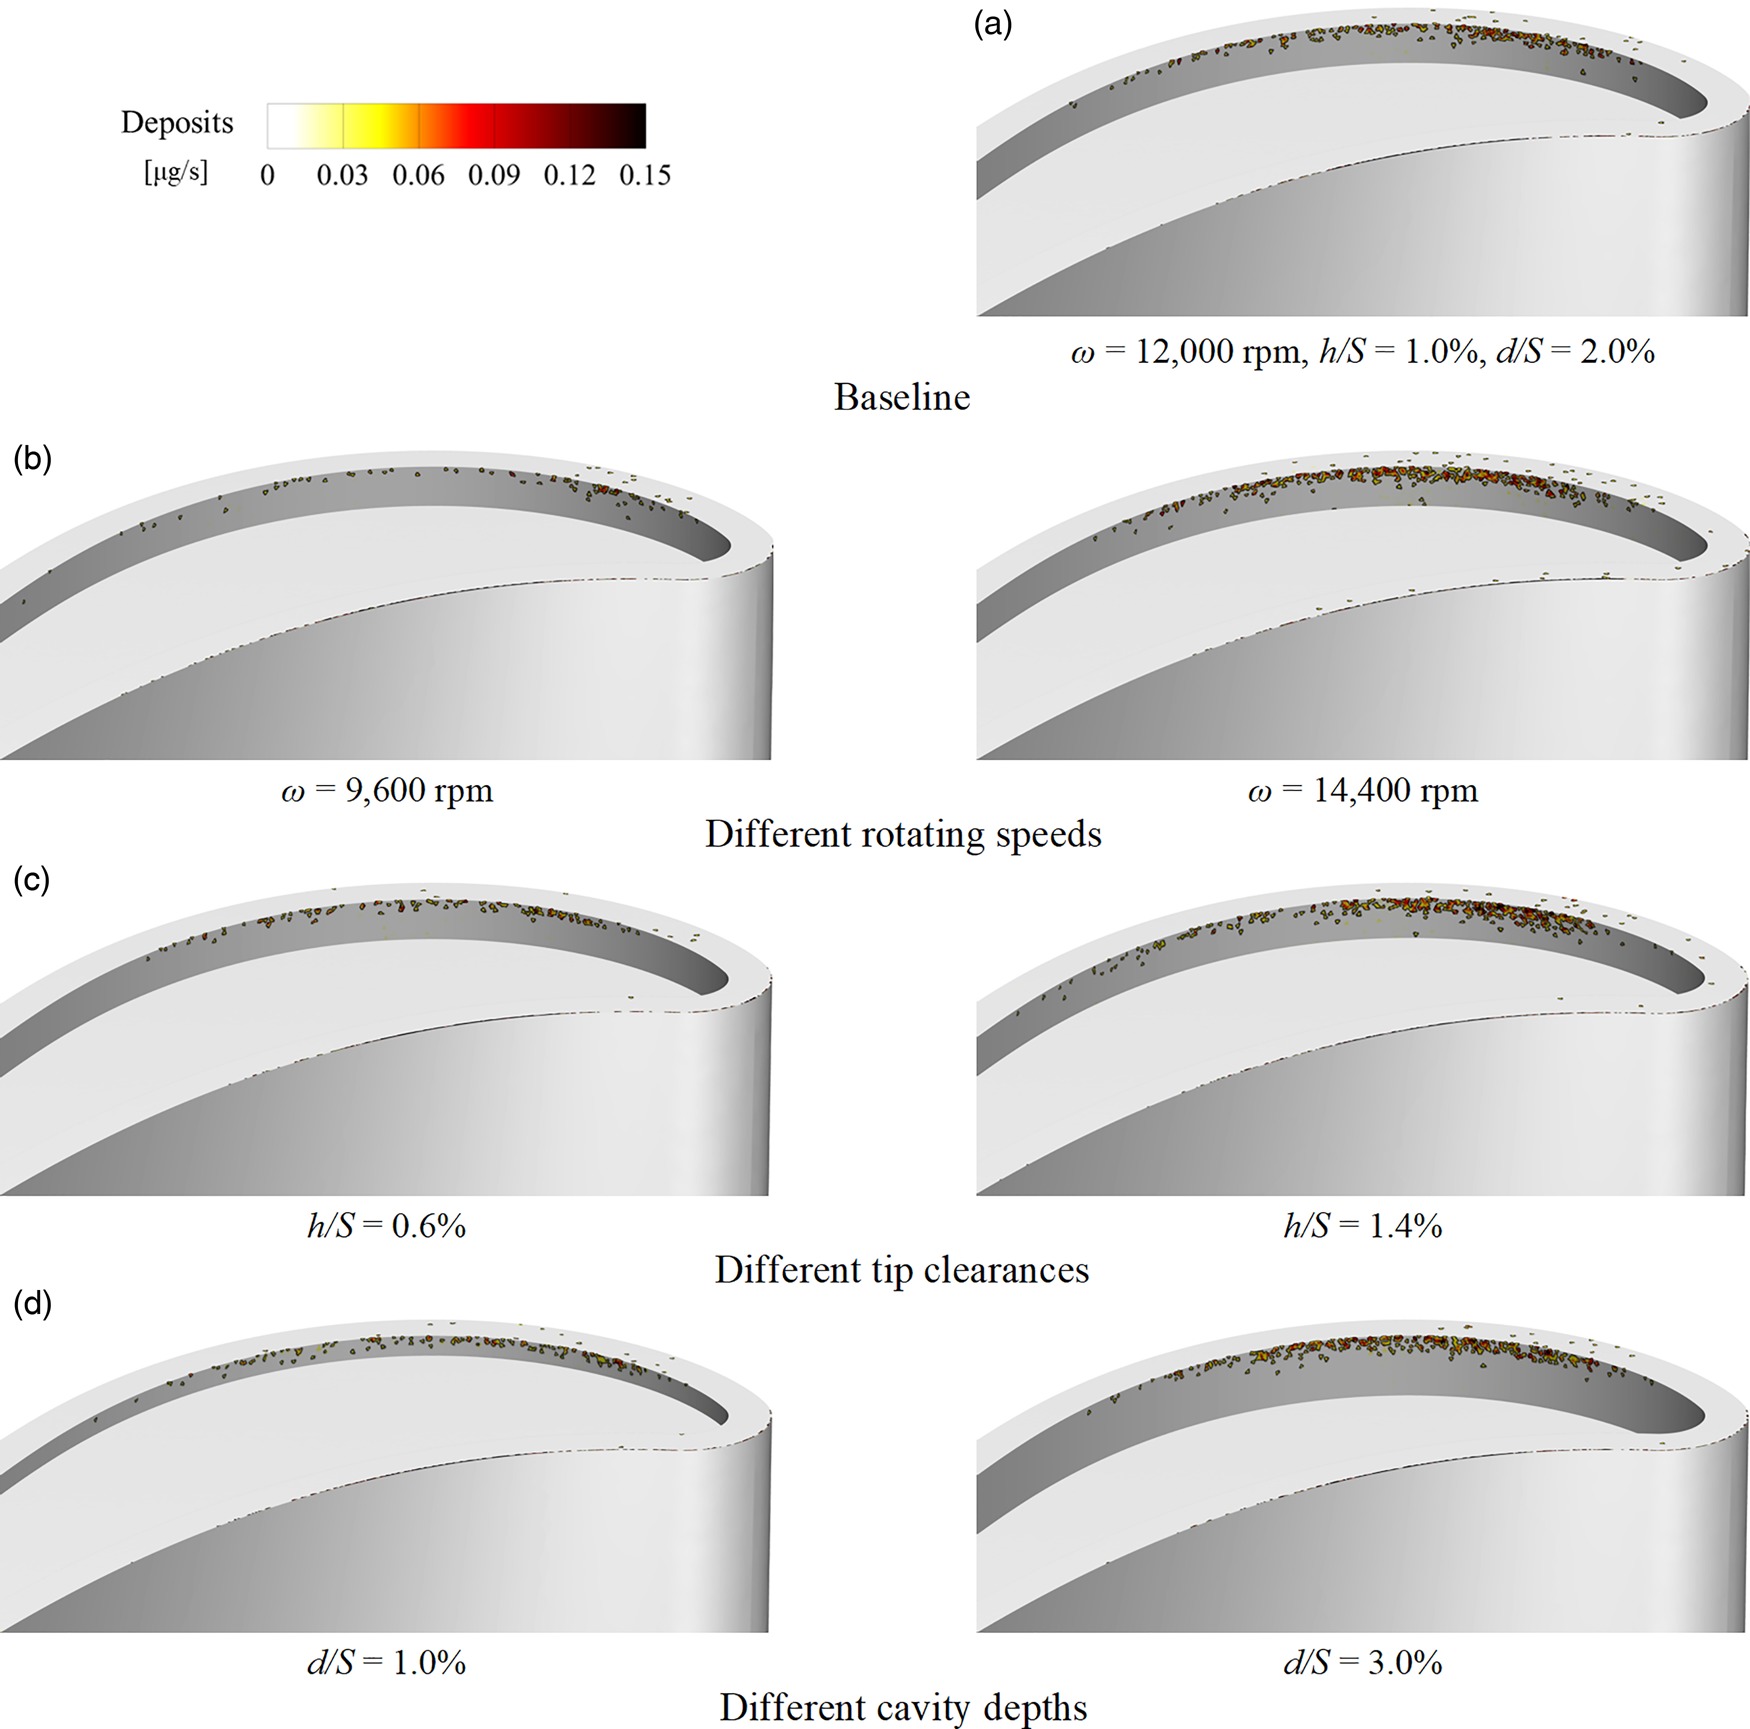
The effects of rotating speed, tip clearance, and cavity depth on the deposition of particles on the cavity tip are illustrated in the Figure 10. Generally, the deposits mainly concentrate on the SS before the mid-chord area of the cavity tip, and in some cases, deposits also appear on the low velocity zone as mentioned above. For the effect of rotating speed, there is a small amount of deposition at the trailing edge for a lower rotating speed. With the rise in rotating speed, the deposition in the low velocity zone gradually reduces and the distribution of deposition gradually concentrates on the SS of the cavity tip on account of a stronger vortex near the SS rim which dominates in the cavity; The change of the tip clearance has the most obvious effect on the deposition of particles on the cavity tip. The cavity tip only has a small quantity of deposits on the front of the SS when the tip clearance is very small. With the increase of the tip clearance, in addition to the significant growth of the deposition on the SS before the mid-chord area, a large amount of deposition is also appeared in the low velocity zone after the mid-chord area. Therefore, the reduction of the blade tip clearance is able to effectively prevent the particles entering the tip clearance and depositing on the surface of the cavity tip; As for the effect of cavity depth, there is a small quantity of deposits on the cavity tip under a shallow cavity depth, and the deposition distribution is wider owning to a weaker vortex near the suction rim. The increase of the cavity depth makes the deposition on the cavity tip shows the same variation tendency. The difference is that since the intensity of the pair of vortexes stays the same with the changing of the cavity depth, there is always a low velocity zone after the mid-chord area, in which the deposits increase with the depth of the cavity.
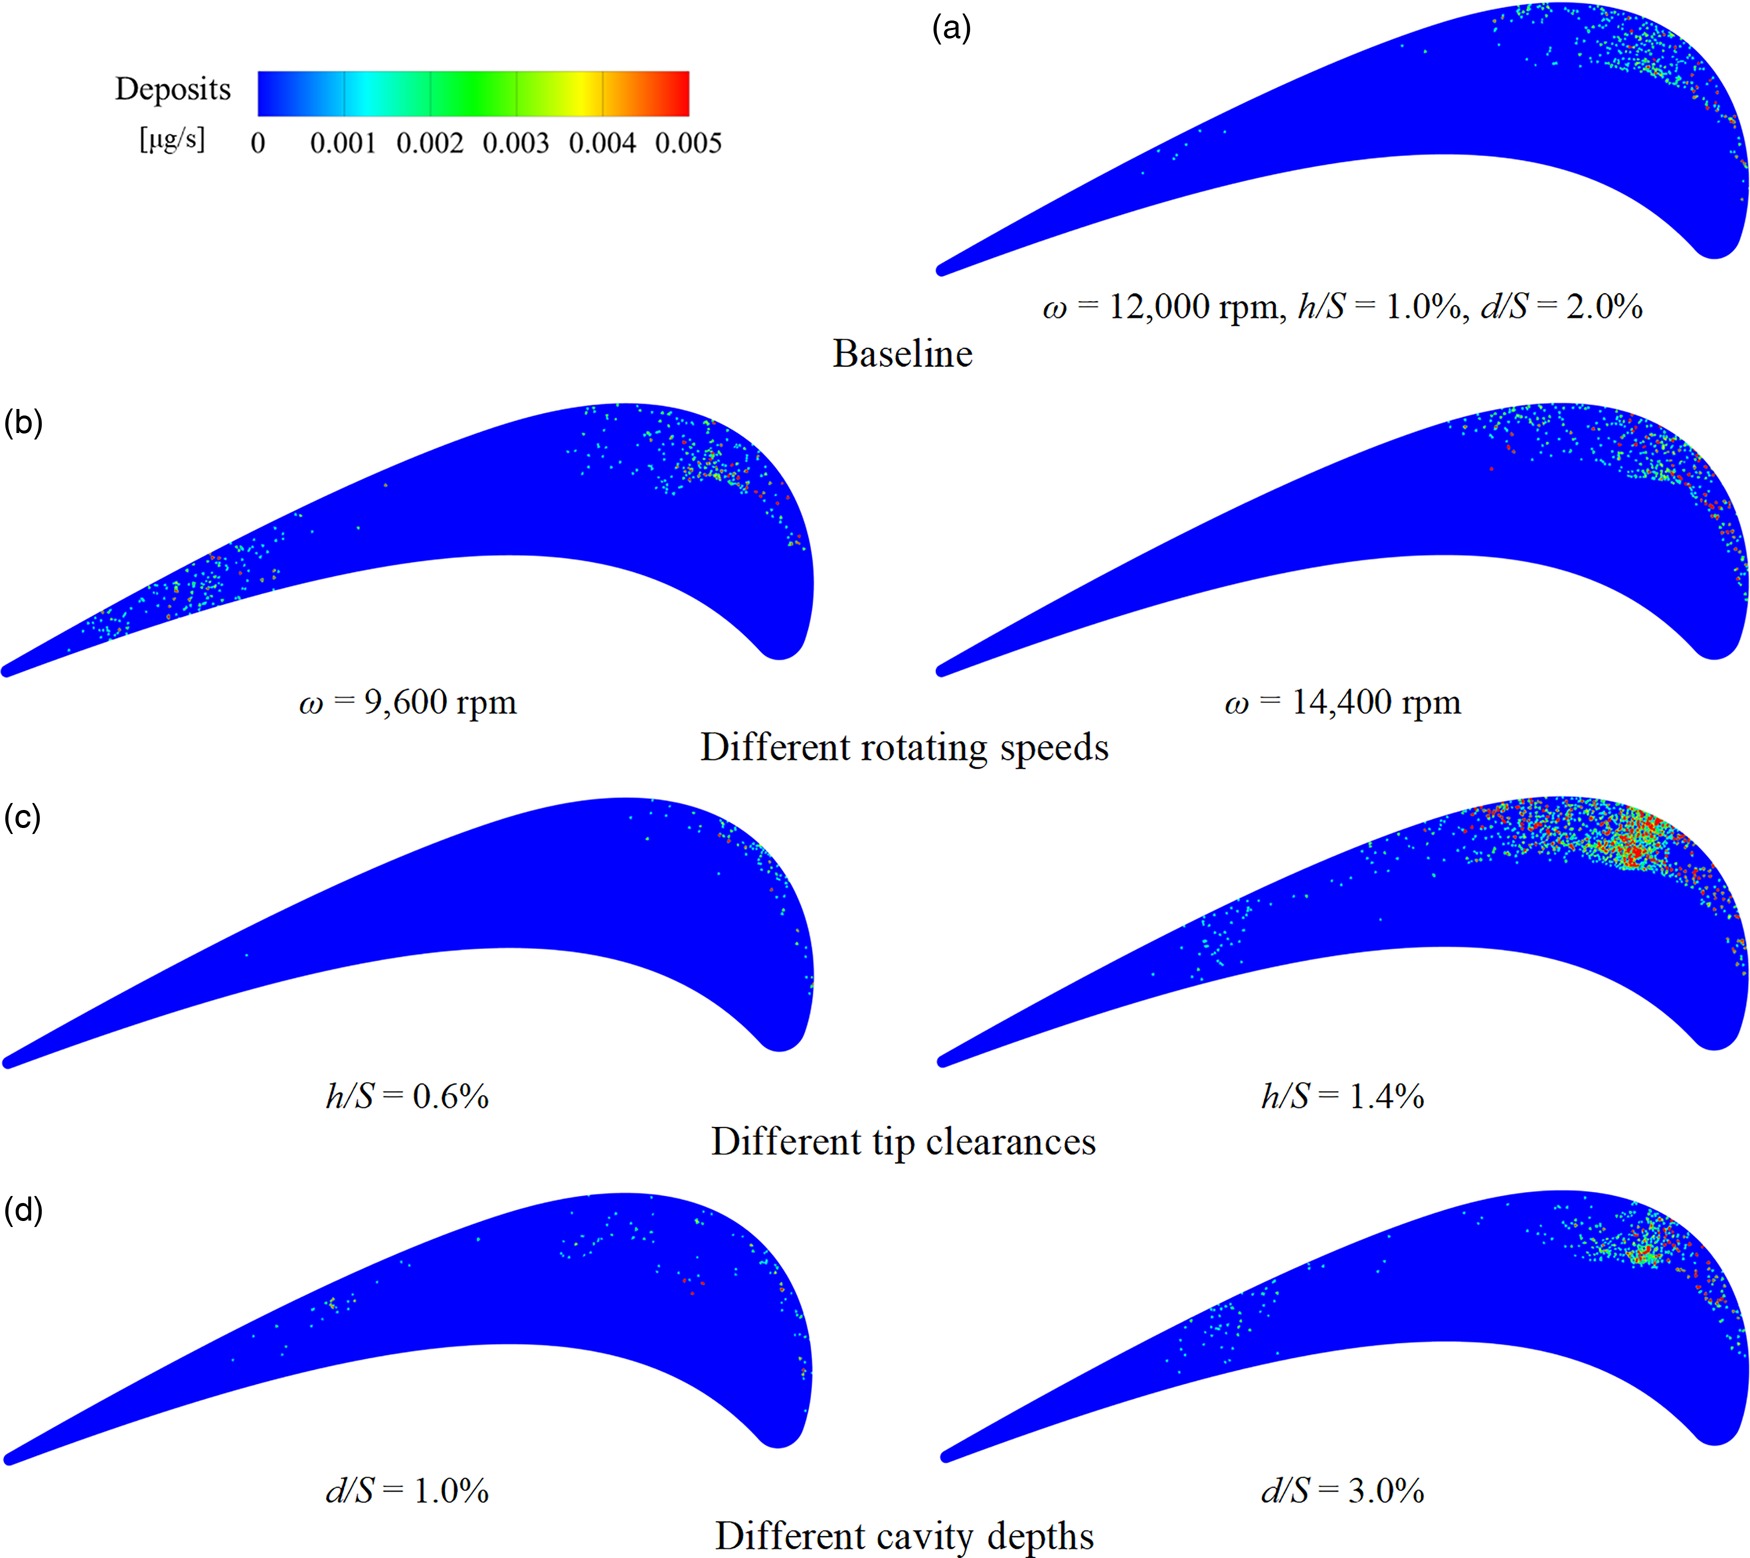
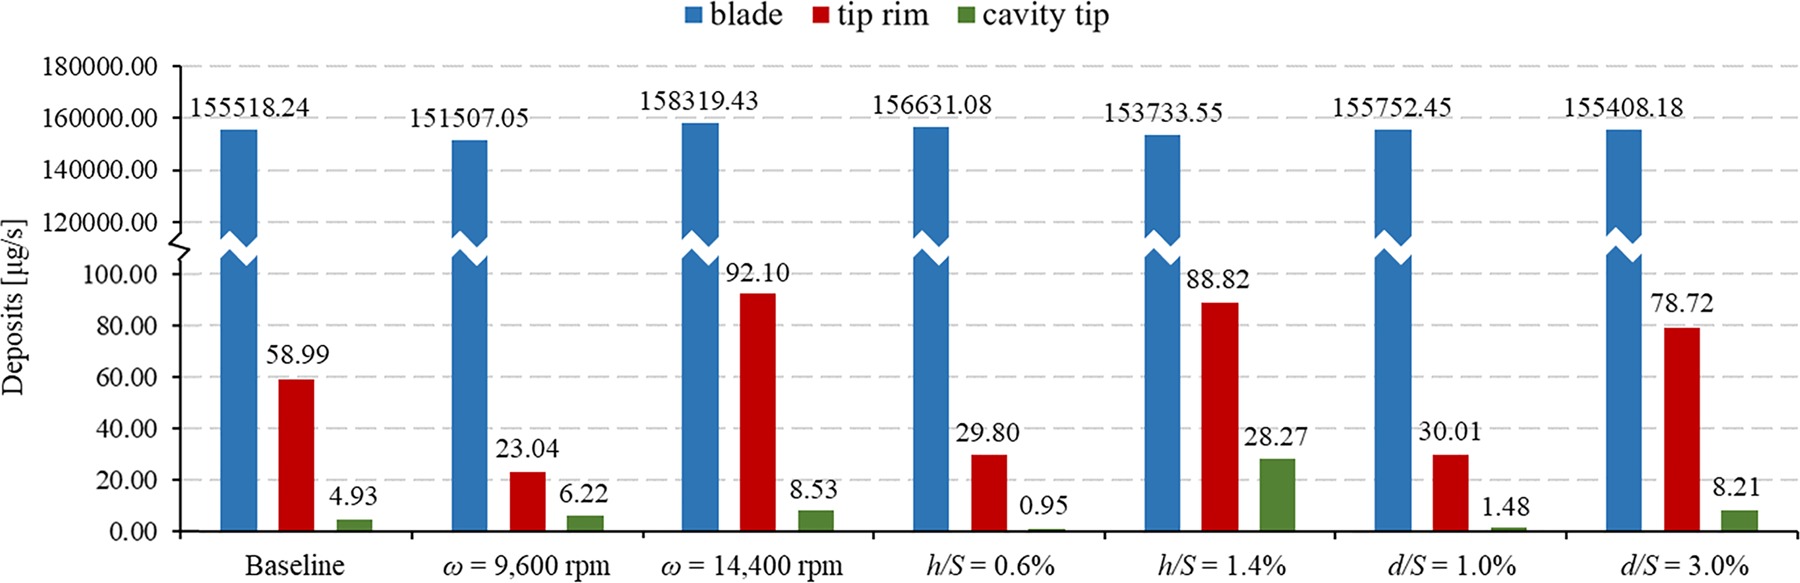
Figure 11 quantitatively demonstrates the effect of rotating speed, tip clearance, and cavity tip on the deposits of the three parts on the rotor. In total, the blade has the most deposits, the tip clearance is the second, and the deposits on the cavity is the least. Both the deposits on the blade and cavity tip increase with the rise of rotating speed, and the reason why deposits on the tip rim first decrease then increase is that there is a low velocity zone at ω = 9,600 rpm, which provides favourable conditions for the particles to deposit; The deposits on the tip rim and cavity tip are significantly affected by the tip clearance, especially the latter which is extremely sensitive to the variation of tip clearance. Unlike the deposits on the tip rim and cavity tip, which increase with the growth of the tip clearance, there is a decrease in the deposits on the blade surface as more particles enter the tip clearance under a stronger leakage flow. Judging from the existing data in this study, the reduction of the tip clearance can effectively reduce the deposition of particles in the tip area. However, a smaller tip clearance also brings huge challenges for processing and assembling; The cavity depth barely influences the deposits on the blade surface. A deeper cavity not only sends more particles into the tip clearance but also makes them deposit on the tip rim and cavity tip. The growth rate of the deposits on the tip rim is much higher than that on the cavity tip. Nevertheless, a deeper cavity makes the squealer tip more fragile, which is more likely to be damaged after the impact of a large number of particles. Although the deposits on the squealer tip are much less than that on the blade in the present study, the effect of the deposition of particles on the flow in such narrow tip clearance cannot be neglected, not to mention that the dense impacts of particles on the tip rim make it easier to be damaged under a long-term operation.
Conclusions
Unsteady computational simulations were implemented to study the migration patterns of particulates in a rotor passage and the distribution of deposits on the rotor airfoil under an actual cruise operating condition of the first stage HP turbine in an aeroengine. Different rotating speeds, tip clearances, and cavity depths of the rotor were studied so as to reach the following conclusions:
The deposition on the blade is much larger than that on the tip rim and cavity tip. With the rise of the rotating speed, not only the amount of deposition increases, but also the distribution becomes more concentrated on the rotor blade. The increase of tip clearance leads to a stronger leakage flow carrying more particles into the tip clearance, and thus the deposits on the blade surfaces reduce, while the cavity depth can barely affect the deposits on the blade.
The deposition on the tip rim is sensitive to the variation of external conditions and there is a rapid growth in the deposits with a higher rotating speed, a larger tip clearance, or a deeper cavity. As for the cavity tip, compared with the rotating speed and cavity depth, the tip clearance has much more significant effect on the characteristic of particle deposition.
The migration and deposition of particles in the cavity is affected by a pair of vortexes with opposite rotating directions near the pressure and suction sides of the tip rim. The vortex near the pressure side tip rim results from the leakage flow, sending particles into the tip clearance, while the vortex near the suction side tip rim is induced by the rotation, carrying particles into the cavity. A low velocity zone is formed where the two vortexes meet, increasing the possibility of particle deposition.
Nomenclature
Symbols
a
Distance from the center of the sphere to the wall
Acp
Cross-sectional area of the particle
CD
Drag coefficient
Cp
Specific heat
Cu
Cunningham correction factor
dave
Particle average diameter
dmax
Particle maximum diameter
dmin
Particle minimum diameter
E
Composite Young’s modulus
Ep
Particle Young’s modulus
Es
Surface Young’s modulus
f
Correction factor for the particle near the wall
FD
Drag force of particle
Fpo
Sticking force of particle
k
Thermal conductivity
mp
Particle flow rate
N
Spread parameter
Ps,outlet
Outlet static pressure
Pt,inlet
Inlet total pressure
Tave,inlet
Inlet temperature
Tg
Gas temperature
Ts
Surface temperature
Tuinlet
Turbulence intensity
uc
Fluid velocity at the center of particle
Vcr
Critical velocity
vp
Particle Poisson ratio
vs
Surface Poisson ratio
WA
Work of sticking for particles
y+
Non dimensional wall distance
Λ
Turbulence length scale
ρp
Particle density
Ω
Rotating speed