
Introduction
In order to improve the thermal efficiency and output power, the inlet parameters of gas turbine are gradually increased, which leads to high thermal load and huge pressure difference at the rotor tip. Under the influence of the high-pressure difference, high temperature gas enters the gap between the rotor blade and the casing, enhancing the convective heat transfer on the blade tip. With the high heat load effect, the thermal stress of tip material increases. The unsteady interaction between rotor and stator induces the flow fluctuation downstream. The location and peak value of high heat load region on blade tip surface show unsteady variation characteristics. Film cooling design in the tip region is one of the important ways to reduce the tip heat load (Bunker, 2006). It has become a great challenge for turbine designers whether film cooling can effectively protect tip region against high heat load under the unsteady waking between the rotor and stator.
With experimental measurement, numerical simulation and theoretical analysis adopted, the leakage flow, heat transfer and cooling characteristics of turbine rotor tip clearance were studied. Bunker et al. (2000) experimentally measured the heat transfer characteristics of the flat tip. The results show that the separation bubble is the main factor for the high heat transfer coefficient region formation. Zou et al. (2017) numerically studied the internal vortex structure of a squealer tip in a turbine stage. The results show that: the pressure side corner vortex and the scraping vortex form a group of reverse vortex pairs, which drive the leakage flow to impinge on the blade tip wall and form a high heat transfer area. Zhou et al. (2013) studied the aerothermal performance of the turbine blade tip with film cooling design. The results show that the heat transfer coefficient of blade tip wall decreases gradually with the cooling flow rate increasing. Zhang and He (2011) numerically studied the heat transfer characteristics of transonic tip leakage flow. Ma et al. (2017) analyzed the mixing mechanism between cooling injection and tip leakage flow under transonic condition through experimental measurement and numerical method. It is found that the cooling injection will form reverse vortex pairs downstream, which leads to high heat transfer.
The upstream stator wake directly affects the leakage flow inside the tip clearance of the downstream rotor under the effect of the unsteady interaction between the rotor and stator, thus changes the flow pattern of the downstream tip clearance, resulting tip heat transfer and cooling performance variation. Atkins et al. (2012) used experimental measurement and numerical simulation methods to explain the mechanism of unsteady heat transfer characteristics by analyzing the unsteady pressure field near transonic tip clearance.
Zhou et al. (2017) compared the unsteady results of three kinds of tip structures, and the time-averaged simulation results show that the tip structure with winglets can obtain the least tip leakage as well as the highest aerodynamic performance. Zhang et al. (2019) further analyzed the influence of stator wake on downstream area under unsteady conditions. The results show that the time-averaged leakage flow is similar to the steady-state results. The difference of tip averaged heat transfer coefficient between steady-state results and time-averaged results is almost less than 4%. However, the local instantaneous heat transfer coefficient increases rapidly by more than 20%.
Film cooling is an important cooling technology to ensure the safety and reliability of gas turbine at high temperature environment. Although researchers have carried out researches on unsteady flow and heat transfer characteristics of turbine tip, and considered the influence of film cooling, these researches have not considered detailed analysis on vortex structure distribution characteristics and surface heat transfer mechanism inside tip clearance. Therefore, the unsteady leakage flow and heat transfer characteristics of GE-E3 turbine stage with film cooling design are studied by numerical method in this paper, which can provide a reference for the turbine blade tip film cooling design.
Methodology
In this paper, the unsteady numerical study of GE-E3 first stage turbine stage (Kwak and Han, 2003) is carried out. The original turbine stage includes 46 stator blades and 76 rotor blades. In order to accurately calculate and process the data transmission of the interface between rotor and stator as well as save the calculation resources, the domain scaling method proposed by Rai (1987) is adopted to reduce the number of stator blades to 38, so as to ensure that the number ratio of rotor and stator blades is 1:2. At this time, the stator blade is magnified according to the scaling factor of 1.21 times, and the stator chord ratio and the axial gap of the rotor and stator blade remain unchanged. Figure 1 shows the computation model of GE-E3 turbine stage for unsteady study, including a stationary domain and a rotating domain, in which the rotating domain consists of two rotor passages. The 8 cooling holes are arranged in the tip camber line with equal intervals, and the diameter is 0.5 mm. In the order from leading edge to trailing edge of blade tip, the cooling holes are named as Cooling hole 1, Cooling hole 2,…, Cooling holes 7 and 8. Table 1 lists the specific geometric parameters of the turbine stage.
Figure 1.
Computation model of the turbine stage and location of cooling holes. (a) Computational model. (b) Cooling hole design.
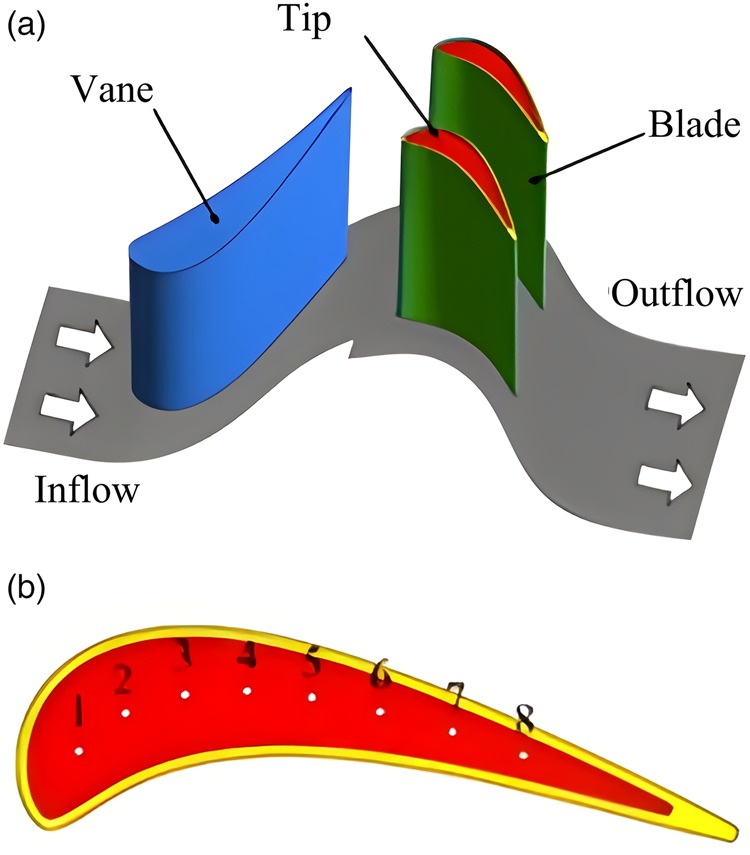
Table 1.
Geometry parameters of the GE-E3 first stage.
| Parameter | Value |
|---|---|
| Vane | 38 |
| Blade | 76 |
| Axial chord | 28.5 mm |
| Blade height | 40 mm |
| Tip clearance | 0.4 mm |
| Rim thickness | 0.4 mm |
| Cavity depth | 0.8 mm |
| Cooling hole diameter | 0.5 mm |
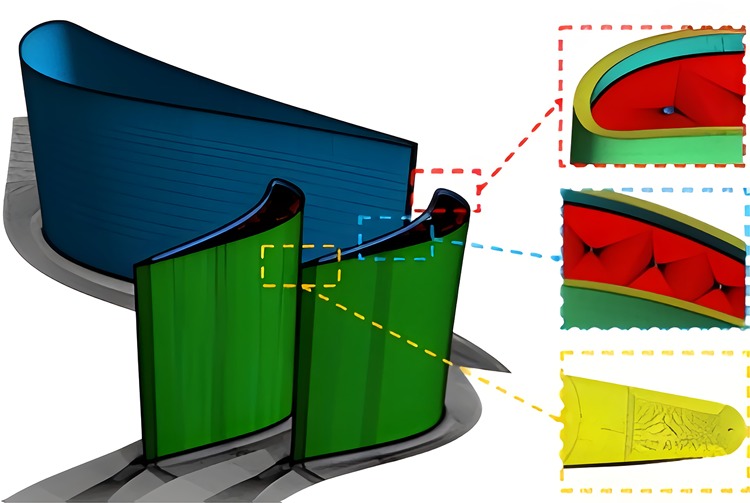
Figure 2 shows the turbine stage mesh and the detailed squealer tip grid for film cooling design. The three-dimensional structured mesh of turbine stage computational domain is generated by ANSYS-ICEM, and more than 60 grid nodes are set along the tip clearance to capture the complex three-dimensional flow characteristics; the grid near the blade wall surface is densified to meet the turbulence model requirements; O-type block is used around the blade and cooling hole to improve the mesh quality. The upstream of stator and downstream of rotor are respectively extended by 1.0 and 1.8 times of axial chord length to prevent backflow. The number of stator grids is 1.5 million, and that of rotor is 10 million.
Based on the experimental data of GE-E3 rotor tip profile three times enlarged linear cascade [13], the reliability of turbulence model selection is verified. The experimental cascade height is 122 mm, axial chord length is 86.1 mm and pitch is 91 mm. Inlet total temperature and total pressure is 297 K and 126.9 kPa, the flow angle is 32° and the turbulence intensity is 9.8%. The outlet static pressure is 102.7 kPa and the wall temperature is 340 K. The URANS equation is solved by ANSYS-CFX, and the heat transfer coefficient distributions of four turbulence models are compared. The heat transfer coefficient h is defined as:
where q is the local wall heat transfer,
Figure 3 compares the tip heat transfer coefficients of the four turbulence models with the experimental data. It can be seen from the figure that the heat transfer coefficient distribution of the standard k-w turbulence model is consistent with the experimental data, so the standard k-w turbulence model is adopted in this paper.

In order to get accurate heat transfer data and reduce number of grids, grid independence test needs to be further carried out after selecting appropriate turbulence model. In this paper, grid nodes are added synchronously in axial, vertical and radial directions of computational domain. As shown in Table 2, it can be found that when number of grids reaches 5.5 million, tip average heat transfer coefficient error is less than 1%, which can be considered that number of grids meets requirements of grid independence verification.
Table 2.
Grid independent test.
| Grid size/×106 | Area-averaged h/W m−2 K−1 |
|---|---|
| 2.5 | 864.5 |
| 4.0 | 857.6 |
| 5.5 | 854.1 |
| 7.0 | 853.0 |
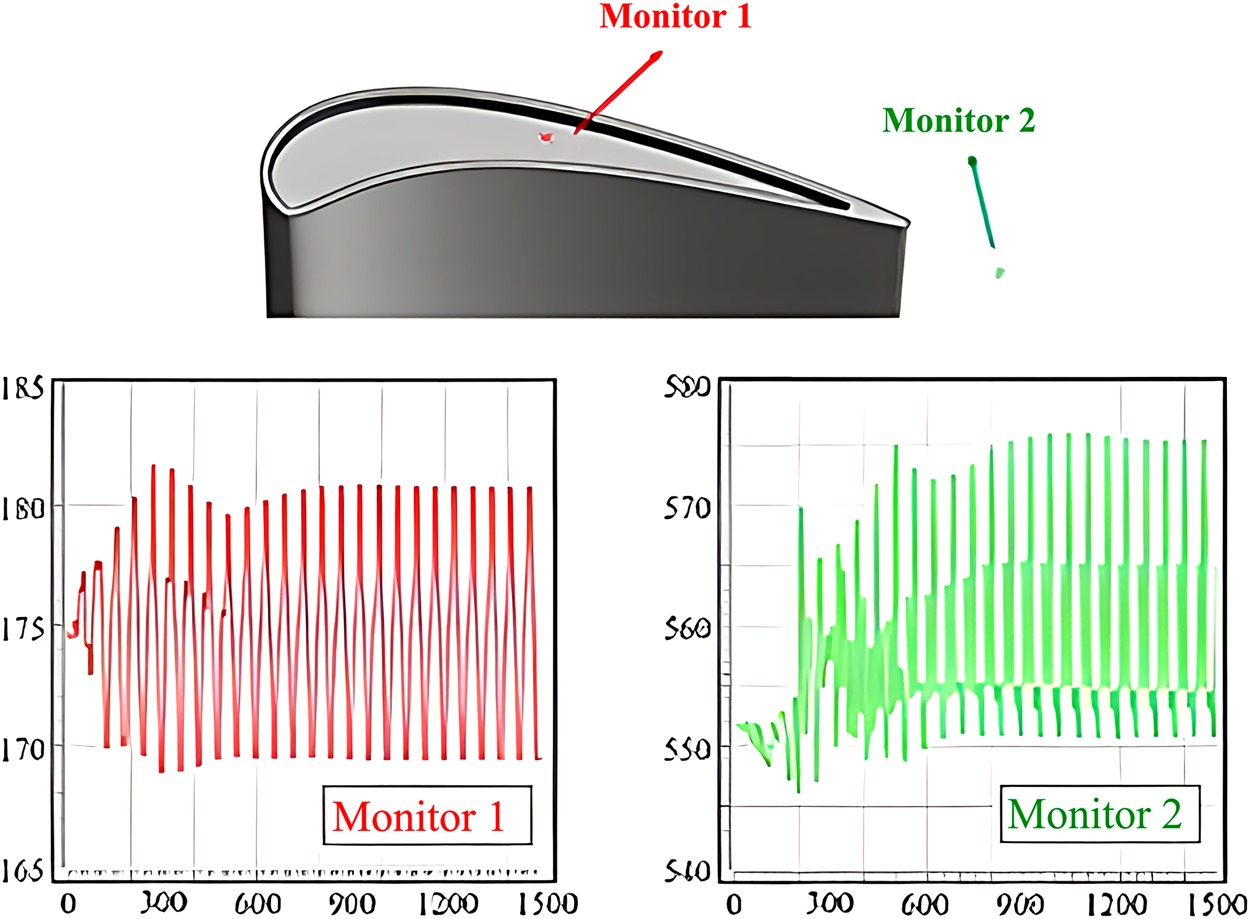
In order to capture the three-dimensional transient flow structure, 60-time steps are set in each pitch, and 10 iterations are performed in each time step. The boundary conditions of numerical simulation are the same as the experimental data [13]. The detailed numerical boundary conditions are listed in Table 3. The transient rotor stator model is used between the stationary domain and the rotating domain, and the second-order upwind scheme is used for calculation. In order to accelerate the convergence, the steady results obtained by the frozen rotor method are taken as the initial field. In the process of unsteady calculation, monitoring points are set in the tip cavity and downstream of the tip trailing edge. When the monitoring parameters show the characteristics of time periodic variation, the calculation is considered to be convergent. Figure 4 shows the specific location of monitoring points and the convergence curve of monitoring parameters.
Results and discussion
Steady tip aerothermal performance with no film cooling
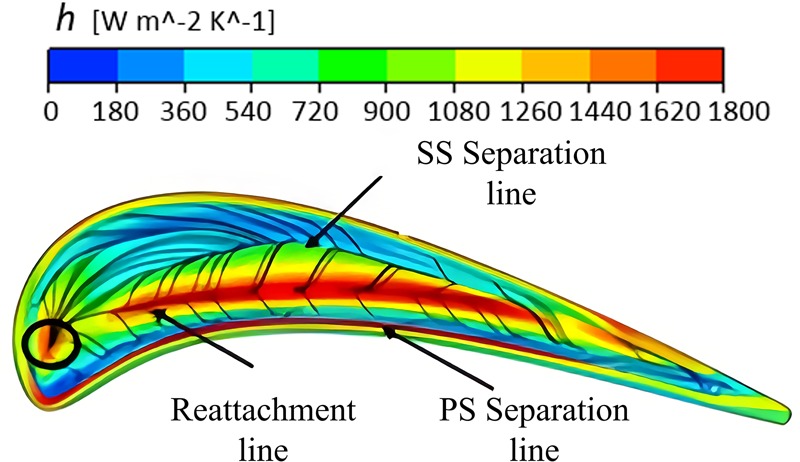
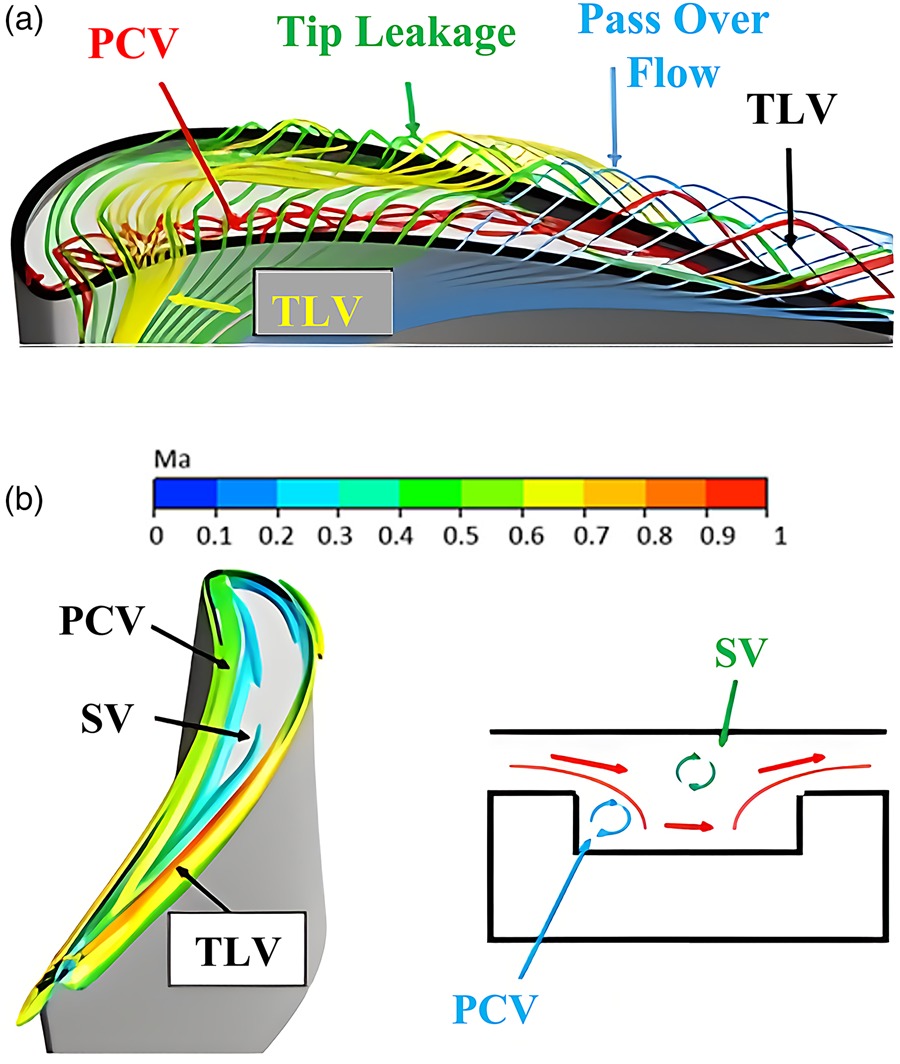
Firstly, the flow characteristics inside the tip clearance and the formation mechanism of high heat transfer coefficient region on the wall are explored by analyzing the steady simulation results. Figure 5 shows the tip heat transfer coefficient distribution of squealer tip under steady condition. A high heat transfer coefficient stripe is formed around the leakage flow reattachment line near the tip pressure side, and a small high heat transfer coefficient zone is also formed near the tip leading edge. This phenomenon is mainly caused by a group of reverse vortex pairs inside the tip cavity. Figure 6 reveals the leakage flow pattern inside the tip clearance. Under the combined effect of the pressure gradient and the casing relative motion, two parallel vortexes with opposite rotation direction are formed, which are called Pressure side Corner Vortex (PCV) and Scraping Vortex (SV) respectively. Because of the interaction of these two vortexes, the high temperature leakage flow impinges on the tip floor, increasing thermal load and forming a high heat transfer coefficient region.
Unsteady tip aerothermal performance with no film cooling
Figure 7 shows the time-dependent curve of the tip-averaged heat transfer coefficient. The curve changes periodically, reaching the peak and trough at 3/6 T and 5/6 T respectively. Therefore, in order to accurately capture the tip heat transfer characteristics, six times are selected for discussion and analysis. Figure 8 shows the relative positions of the rotor and stator at six times.

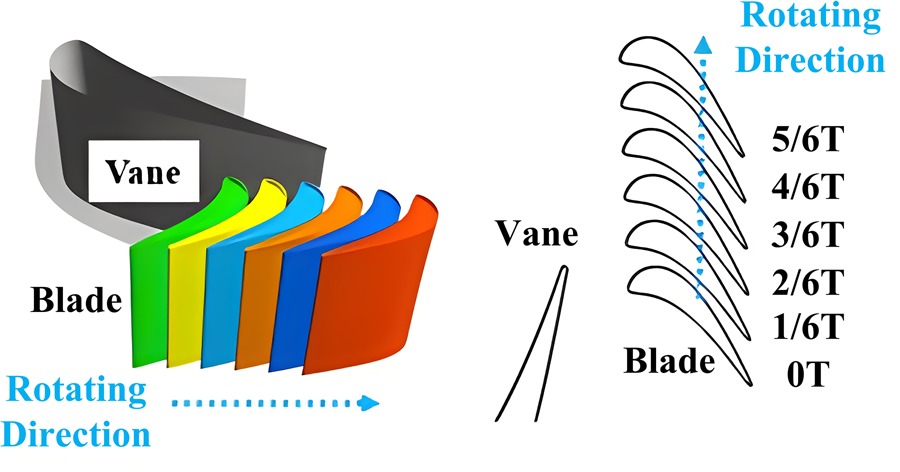
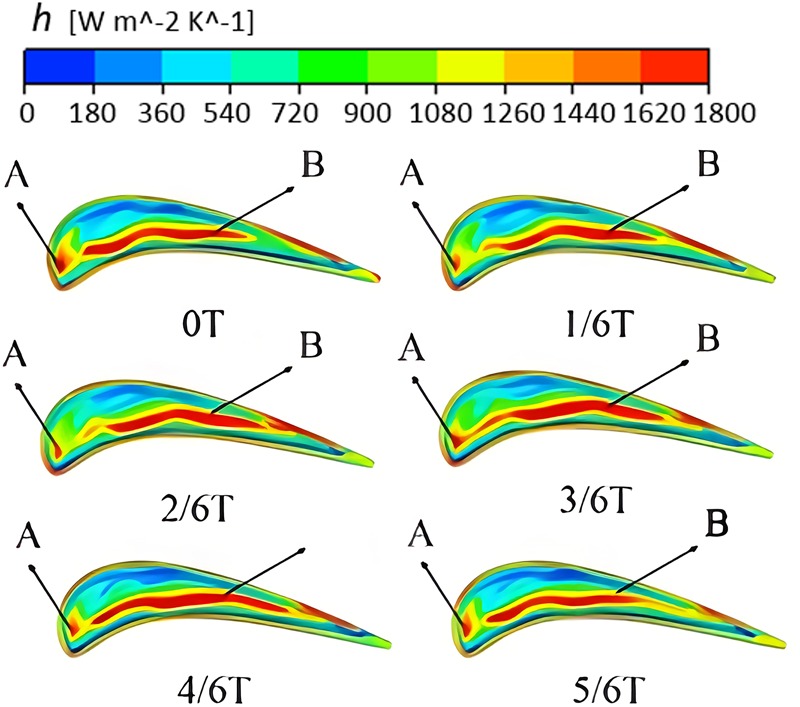
Figure 9 shows the contours of heat transfer coefficient at different times. A is the high heat transfer region formed by the leakage flow impingement near the leading edge, while B is the high heat transfer stripe formed by the interaction of SV and PCV. The large area of high heat transfer stripe B needs to be detailed analyzed and discussed. Compared with the steady-state results, the high heat transfer coefficient stipe is no longer parallel to the tip pressure side rim, showing significant fluctuations. The area and location of the high heat transfer stripe change, and the 3/6 T time has the largest area, while the 5/6 T time node has the smallest area. Figure 10 quantitatively compares the tip-averaged heat transfer coefficients at different times. Where
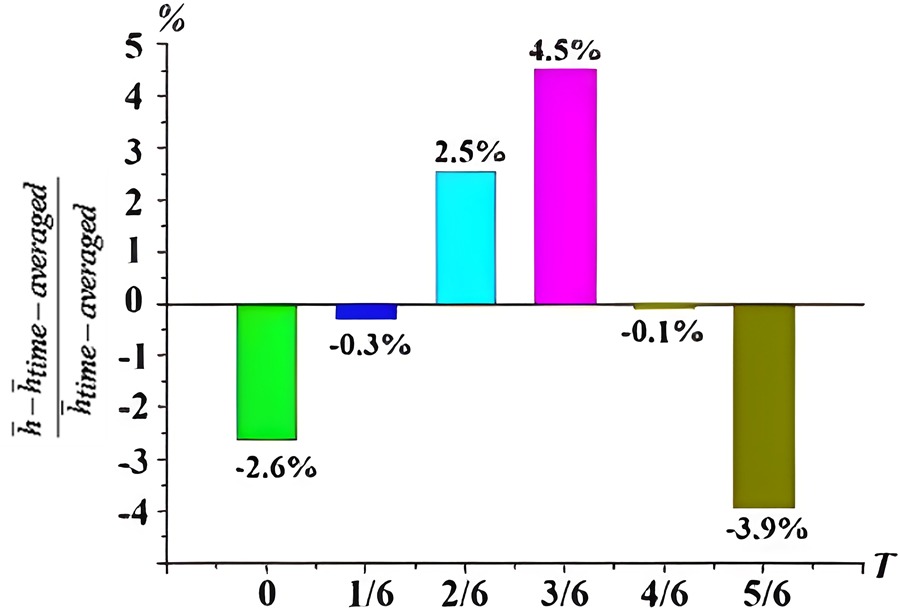
After passing through the trailing edge of the stator blade, the mainstream falls off and forms a low energy wake. The stator wake downstream development will affect the pressure distribution around the rotor tip and form periodic fluctuation. In the cylindrical coordinate system, the radial vorticity is defined as:
where
Figure 11 shows the effect of stator wake on the downstream rotor through the radial vorticity distribution on the middle plane of tip clearance. At 3/6 T, the tip pressure side gradually gets rid of the last wake influence, and the pressure reaches the highest value; at 5/6 T, the wake is completely truncated by the leading edge of the tip, and the truncated wake develops to the tip pressure side and suction side respectively, so that the pressure on both sides of the tip gradually decreases. Figure 12 shows the static pressure contour of the tip clearance middle plane at different times. There is a high-pressure region and a low-pressure region around the rotor tip. Under the influence of the stator wake, the high-pressure region near the tip pressure side moves from the suction side of the passage to the pressure side. At 3/6 T, the pressure gradient around the blade tip is the largest, while at 5/6 T, the pressure gradient around the blade tip is the smallest.
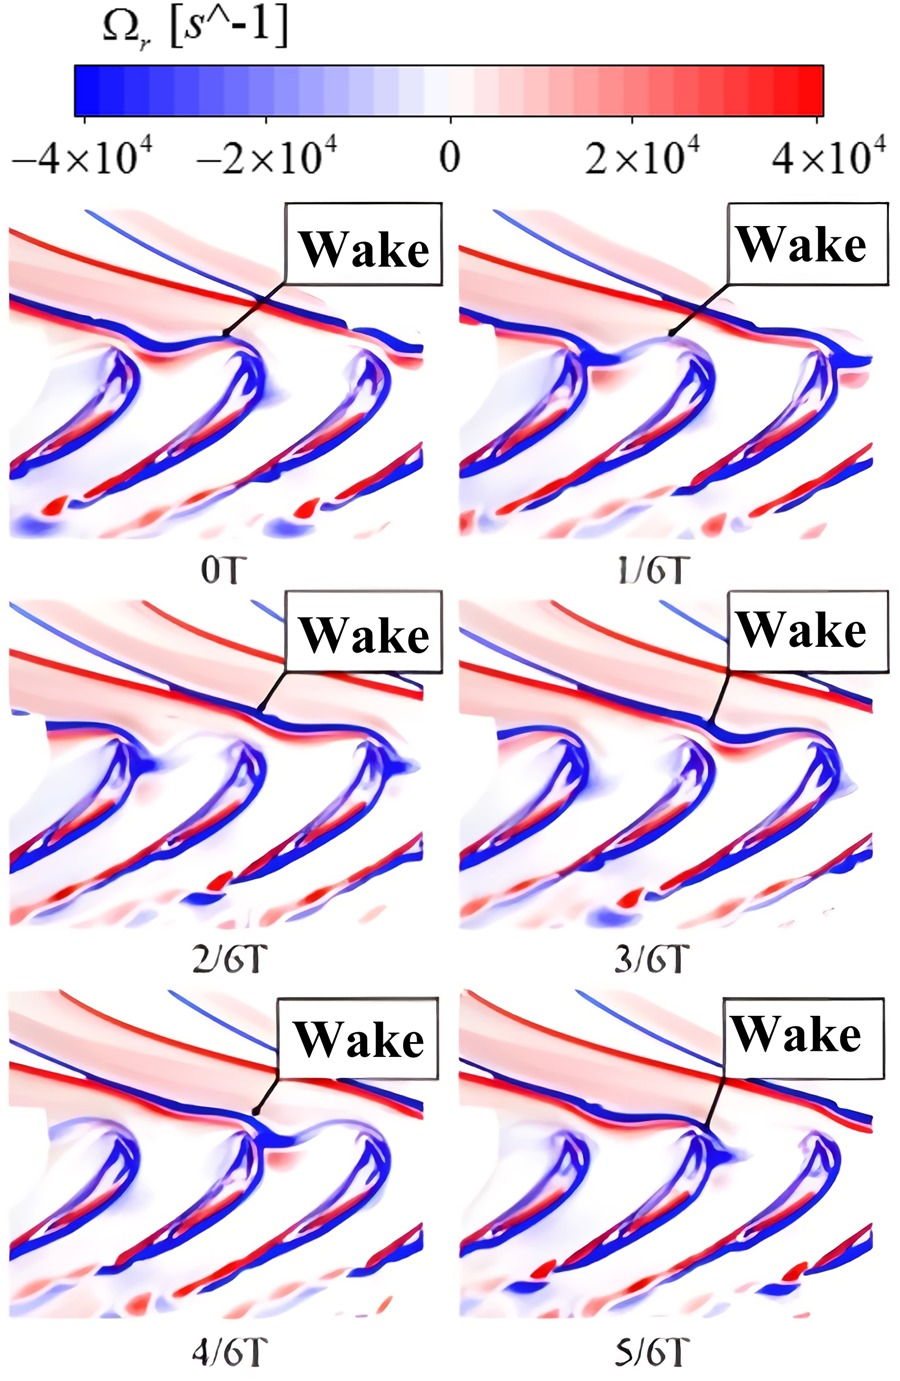
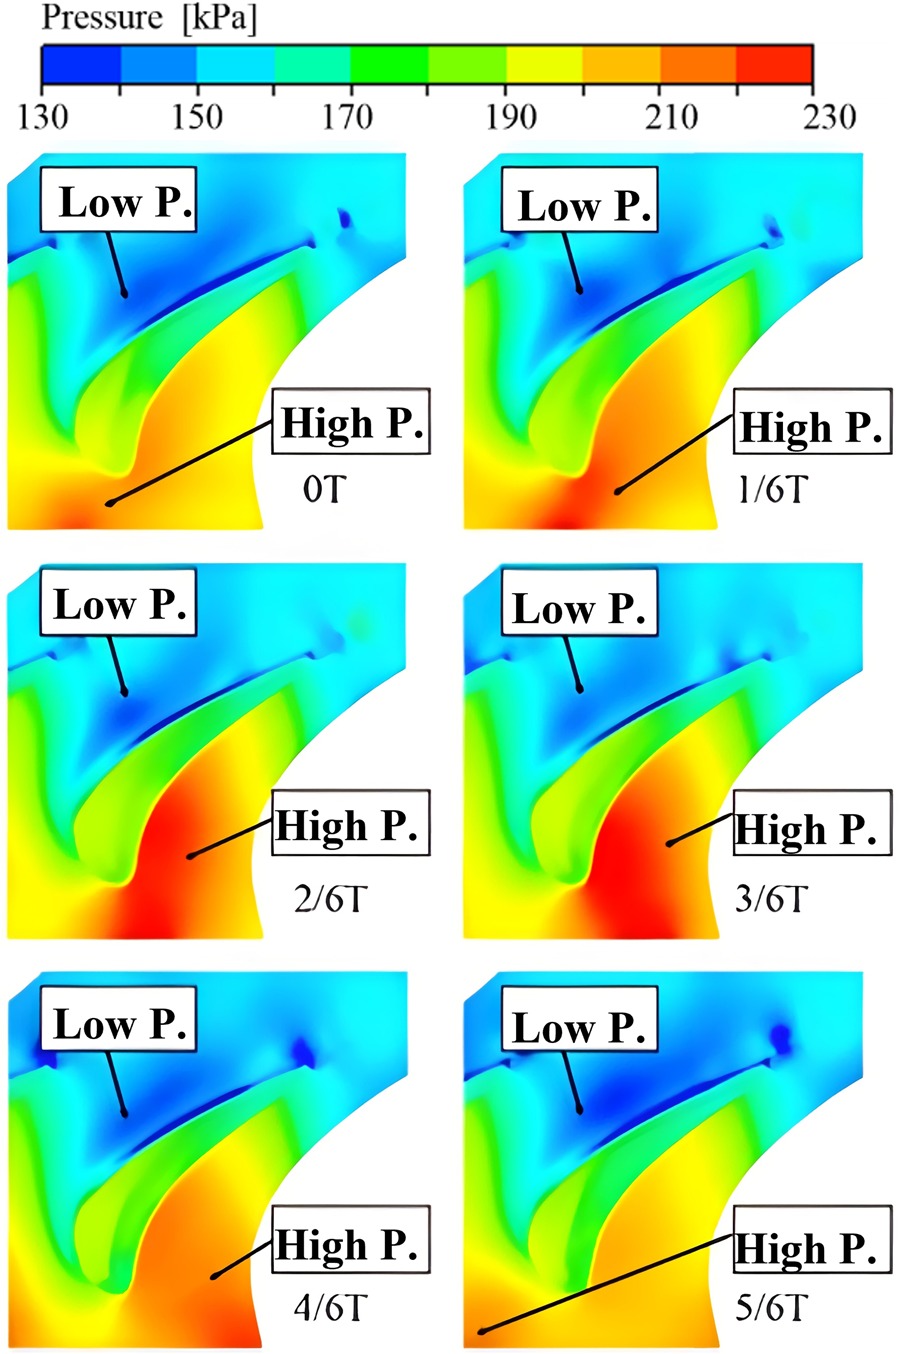
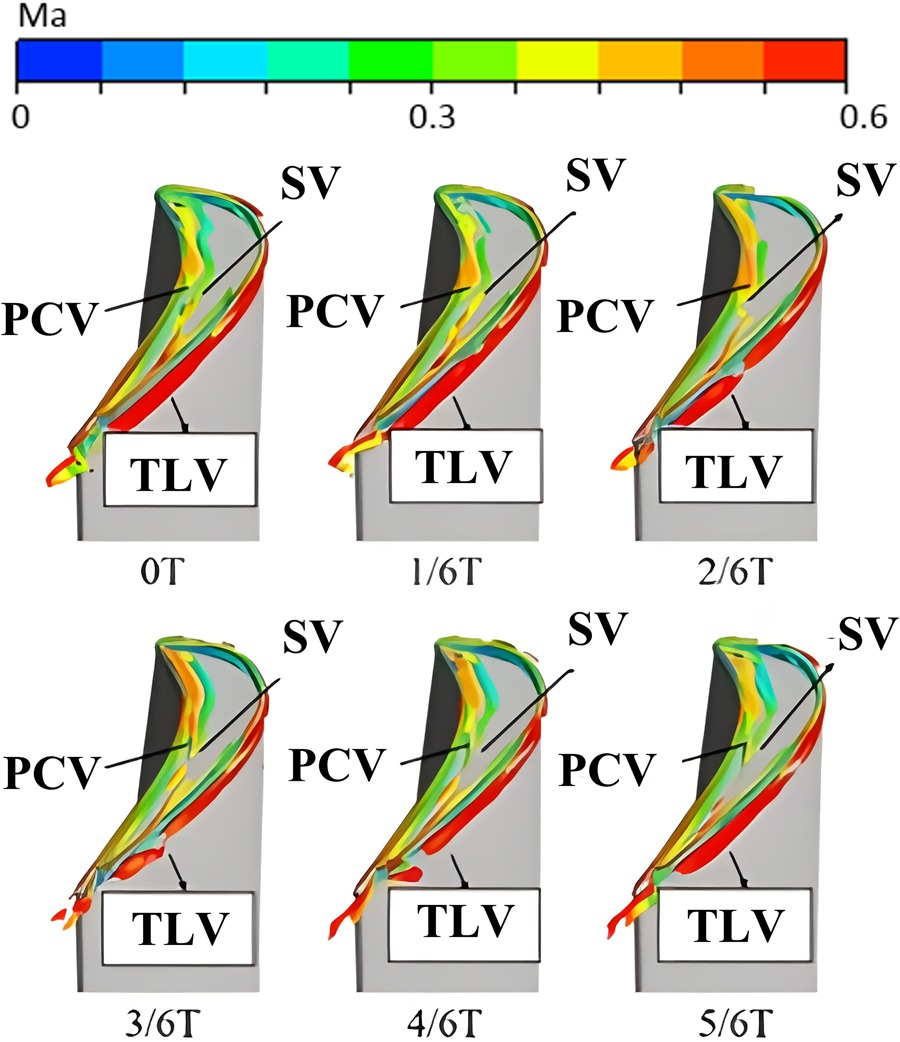
Figure 13 shows the vortex structure in the tip clearance at different times. Under the influence of pressure gradient fluctuation around the blade tip, the vortex structure in the tip cavity under unsteady state is quite different from that under steady state. At this time, the PCV and the SV show the characteristics of fluctuation and easily-broken. At 3/6 T, under the influence of larger pressure gradient around the blade tip, the strength of the SV and PCV inside the tip cavity is larger, the high temperature leakage flow impingement on the cavity floor is enhanced, so that the tip heat transfer coefficient increases; while at 5/6 T, because of smaller pressure gradient around blade tip, the strength of the SV and PCV inside the tip cavity also decreases, so that the tip heat transfer coefficient increases.
Unsteady tip aerothermal performance with film cooling
In this paper, the unsteady leakage flow and thermal characteristics of the rotor tip with film cooling arranged tip cavity camber line are studied, and tip heat transfer characteristics with three blowing ratios are compared. The blowing ratio is defined as:
where
Figure 14 shows the tip time-averaged heat transfer coefficient distribution under three blowing ratios. The overall tip heat transfer coefficient performance is decreased. However, only the first cooling hole and three cooling holes near the tip trailing edge can perfectly block the high heat transfer coefficient stripe formation, and other cooling holes have little effect on decreasing convective heat transfer. It is found that the overall heat transfer coefficient decreases when the blowing ratio increases to 1.0 compared with that when the blowing ratio is 0.5, but there is almost no change when the blowing ratio increases to 1.5. Figure 15 shows the time variation curves of the tip-averaged heat transfer coefficient under three blowing ratios. In one time period, the peak and trough of the tip-averaged heat transfer coefficient are almost the same, but the peak value decreases. When the blowing ratio is 0.5, 1.0 and 1.5, the average heat transfer coefficient decreases by 9.0%, 12.4% and 13.2%, respectively. Considering combination of the tip cooling effect and coolant consumption, the film cooling effect is the best when the blowing ratio is 1.0. The heat transfer characteristics and flow structure of the blade tip with blowing ratio of 1.0 are analyzed next.
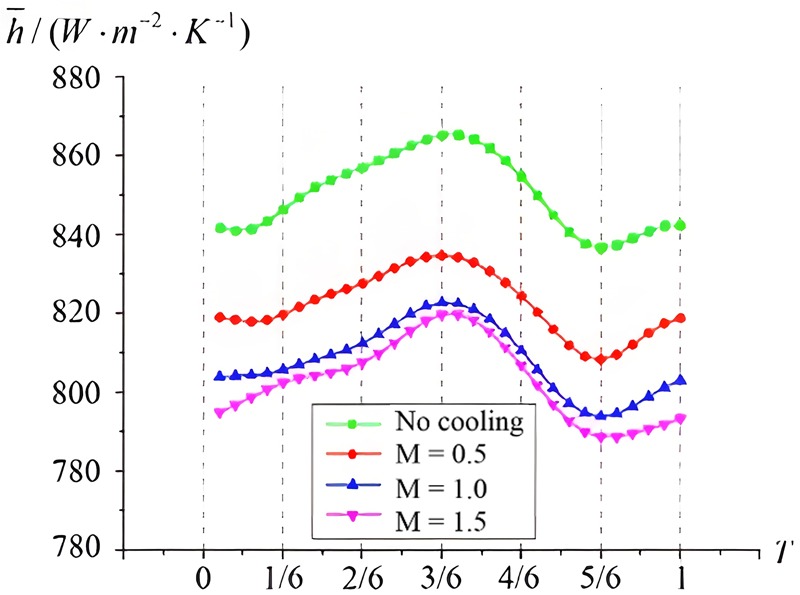
Figure 16 shows the tip heat transfer coefficient distribution with blowing ratio of 1.0 at different times. Compared with the case without film cooling in Figure 9, the location and area of the high heat transfer coefficient region near the tip leading edge and the high heat transfer coefficient stipe near the pressure side rim are almost not affected. However, the flow direction of the coolant in the eight cooling holes is quite different, which can be roughly divided into three categories: the flow direction of the coolant in cooling holes 1 (marked as A) and 6 (marked as B) changes with time; the flow direction of the coolant in cooling holes 2–5 almost does not change with time, and flows from the cooling hole to the suction side of the blade tip; and the coolant in cooling holes 7 and 8 also basically flows towards the tip. For cooling hole 1, during 2/6 T–4/6 T, the coolant flows from the cooling hole to the tip suction side, without cooling the high heat transfer coefficient stripe; while during 5/6 T–1/6 T, the coolant effectively cuts off the high heat transfer coefficient stripe. The situation of cooling hole 6 is similar to that of cooling hole 1. The flow structures of 2/6 T and 5/6 T are analyzed in detail.
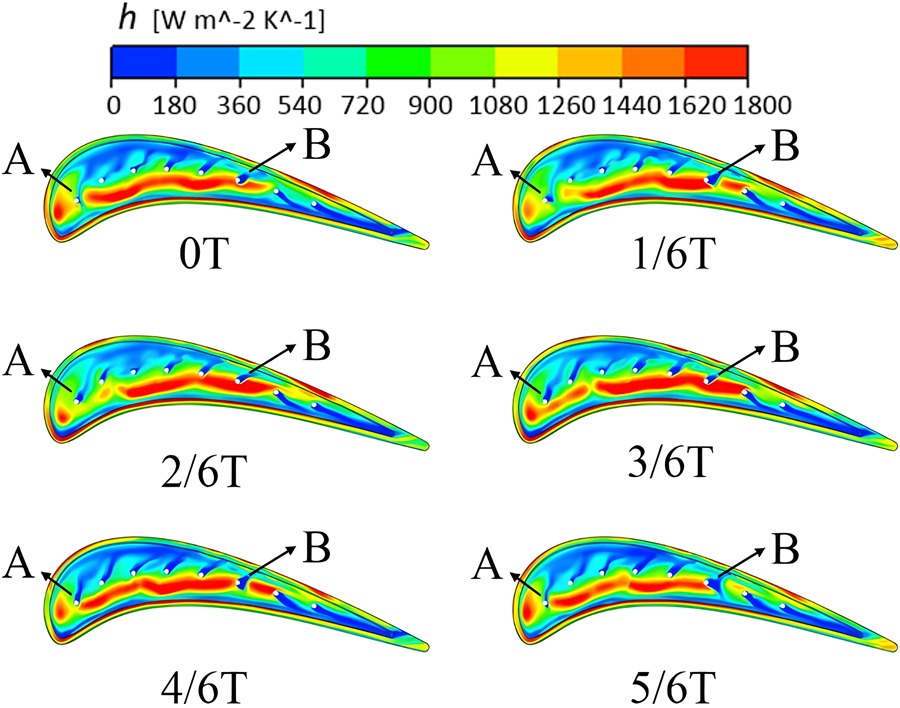
Figure 17 shows the tip surface streamline distribution and stator wake at 2/6 T and 5/6 T. A separation line appears in the middle of the tip high heat transfer stripe, and the flow direction around the separation line is opposite. At 2/6 T, because the stator wake almost has no effect on the rotor blade, the leakage flow separation line position is inclined to the tip pressure side, and the cooling holes 1–6 are all located on the suction side of the separation line, so that coolant is brought to the tip suction side area by the leakage flow, and the high heat transfer area cannot be cooled; at 5/6 T, the stator wake reaches the tip suction side and the separation line position is shifted to the tip suction side, cooling hole 1 and cooling hole 6 cut off the formation of separation line. Figure 18 shows the flow structure at this two time. At 2/6 T, the coolant of all cooling holes is not affected by the SV and PCV interaction, and thus the coolant cannot cool the high heat transfer coefficient region; at 5/6 T, part of the coolant of cooling holes 1 and 6 is sucked into the tip pressure side by the SV, effectively cooling the high heat transfer region.


Conclusions
In this paper, the unsteady tip leakage flow and heat transfer characteristics of GE-E3 turbine stage rotor blade were studied by numerical simulation. The flow characteristics and heat transfer coefficient distribution under different blowing ratios were compared.
The flow structure in the tip clearance is mainly dominated by PCV and SV which are parallel to the tip pressure side rim. Under the influence of the two vortexes interaction, the tip high temperature leakage flow is entrained and impinges on the cavity floor, resulting in high heat transfer coefficient stripes;
Due to the influence of unsteady stator wake, the pressure distribution of blade tip changes periodically with time variation. Under the pressure gradient around the blade tip, PCV and SV fluctuate periodically in the direction perpendicular to the leakage flow separation line, which leads to the fluctuation of high heat transfer coefficient stripe;
Under unsteady conditions, compared with the film cooling tip, the cooling hole arranged at the tip camber line can effectively reduce the tip heat load. When the blowing ratio of film cooling is 0.5, 1.0 and 1.5, the tip-averaged heat transfer coefficient of blade tip decreases by 9.0%, 12.4% and 13.2%, respectively;
Under unsteady conditions, due to the fluctuation phenomenon of high-heat transfer coefficient region, when the cooling holes are set at the tip camber line position, most of the cooling holes deviate from the leakage flow separation line except for cooling holes 1 and 6, and the coolant is directly entrained to the tip suction side, so it is difficult to effectively cool the high heat transfer region.
Nomenclature
Blade chord length (m)
Axial chord (m)
Rim height (m)
Purge flow size (m)
Heat transfer coefficient (W/ (m2 K))
Blade height (m)
M
Blowing ratio
Pressure (Pa)
Local heat flux (W/m2)
Tip clearance height (m)
Temperature (K)
Velocity (m/s)
Squealer rim thickness (m)
Non-dimensional distance from the wall (−)
ŋ
cooling effectiveness