
Introduction
Advanced manufacturing techniques such as metal additive manufacturing (AM) provide a platform for rapid prototyping and advancing the feasibility of complex designs relative to traditional subtractive or casting fabrication methods. Specifically in this paper, we are referring to parts made through direct metal laser sintering; however, we will use the term AM. AM provides significantly shortened manufacturing times for components and provides opportunities for enhanced design freedom, reduction in part numbers, and reduced development costs relative to conventional fabrication methods. Metal printing techniques, such as direct metal laser sintering, require unique manufacturing and design considerations to produce consistent part tolerances, surface roughness, and overall component quality. The range of geometric tolerances that an additive part can experience becomes an important factor when making turbomachinery components with the goal for rapid prototyping and testing. Consequently, understanding the amount of variability in overall part design and the effect on the performance of cooling schemes between parts gives insights into the deviation from design intent and overall variability in cooling performance.
This article provides an overview of the state of AM component manufacturing with a focus on turbomachinery components and cooling designs. In more detail, this article examines the: (i) manufacturing variation of simple cooling designs; (ii) variability and reproducibility of engine scale vanes; and (iii) implications of part consistency on convective heat transfer and flow losses. This article pays particular attention to the printability of small-scale cooling features such as film cooling holes and channels over time as technology advancements in the AM process has occurred.
Causes for geometric variation of additively manufactured components
The additive manufacturing process, specifically direct metal laser sintering, is a layer by layer manufacturing process whereby a layer of powder is deposited on to a substrate referred to as a build plate. A laser then selectively melts the powder to form a liquid pool of metal, which then solidifies following the design intent profile of a component. The process is repeated until the component is fully sintered (King et al., 2015). More detail of each specific process is reported by Frazier (Frazier, 2014). After the part is built, post-processing actions such as heat treatments are performed to reduce residual thermal stresses and alter material properties (DebRoy et al., 2018). Changes and instabilities to the shape of the melt pool directly impacts the magnitude and variation of surface morphology and structural properties within an AM component as described by Feng et al. (2021) and Wang et al. (Wang et al., 2013). Several factors that contribute to the shape of the melt pool, which in turn affect the surface morphology and deviation from design intent, include surface orientation (build direction), laser processing parameters, support structures, and the distance the part is from the laser source (laser incidence angle) for a given material (Calignano et al., 2013; Dahmen et al., 2020; Kleszczynski et al., 2020; Subramanian et al., 2021).
Build direction has been reported by many to be a dominating effect on part quality due to additional material being sintered for surfaces that are downward facing (Ventola et al., 2014). For circular cooling channels, Wildgoose et al. (2021) showed that the standard deviation in hydraulic diameter increased by more than 50% when orientating a vertically built channel relative to the horizontal orientation. Similarly, Snyder et al. (2015) showed that the circularity, internal surface roughness, and concentricity of a circular channel also changes as a function of build direction.
Data in the literature also shows that when a part shares the same position on different build plates, surface morphology and part geometry can vary between components (Fox, 2019; Dowling et al., 2020). Gradl et al. (2021) extensively reported on the part-to-part variation of different geometries including thin walls, holes, hollow and protruding cylinders. Relative geometric error decreased with increasing feature size, which is similar to results for circular channels from Wildgoose et al. (2021). Regardless of the part geometry, all components from Gradl et al. (2021) contained deviations from their design intent.
Variations from the design intent are also present even when multiple samples are built on the same build plate. A contribution to the variation of components within a build plate is related to the location of a part on the build plate. The cause for the positional dependency is a result of the interaction between the angle of the laser beam and powder, this angle is called the laser incidence angle. The work of Kleszczynski et al. (2020) highlighted that surface roughness increases the further a sample is from the laser source. Both Sendino et al. (2020) and (Subramanian et al. (2021) support the positional dependency and present relationships between roughness and laser incidence angle through different calibration and benchmark test pieces.
Progress in using am to manufacture turbine cooling features
Since the AM process has been embraced by turbine manufactures for rapid development of components, there has been significant progress in the AM technology itself. While this section is not a comprehensive review of all the improvements that have been made to the AM processes, it does focus specifically on how research has improved the printability of geometric features over time. Driving these improvements is the ability required to replicate complex features of hot section components such as vanes, that benefit from the reduced lead time and cost relative to conventional manufacturing methods. Common cooling designs implemented in turbine airfoils include external cooling such as film cooling and internal cooling such as pin fins, ribs, and channels (Han et al., 2012). Within the additive cooling field, there has been considerable research to characterize both traditional internal and external cooling designs as well as designs utilizing the design space offered through AM such as lattice structures (Liang et al., 2022) and wavy channels in the work of (Kirsch and Thole, 2016; Corbett et al., 2022).
One of the early additive film cooling studies by Vinton et al. (2016) and Jackowski et al. (2016) showed the ability of AM to produce the millimeter sized features and highlighted the impact of surface roughness from the AM process on overall cooling effectiveness. Stimpson et al. (2018a,b) expanded upon the work in terms of characterizing the deviation from design intent as well as an overall cooling effectiveness comparison between AM and traditionally manufactured electric discharged machined film cooling holes. The study reinforced that build direction and hole size are important factors toward hole blockage and printability.
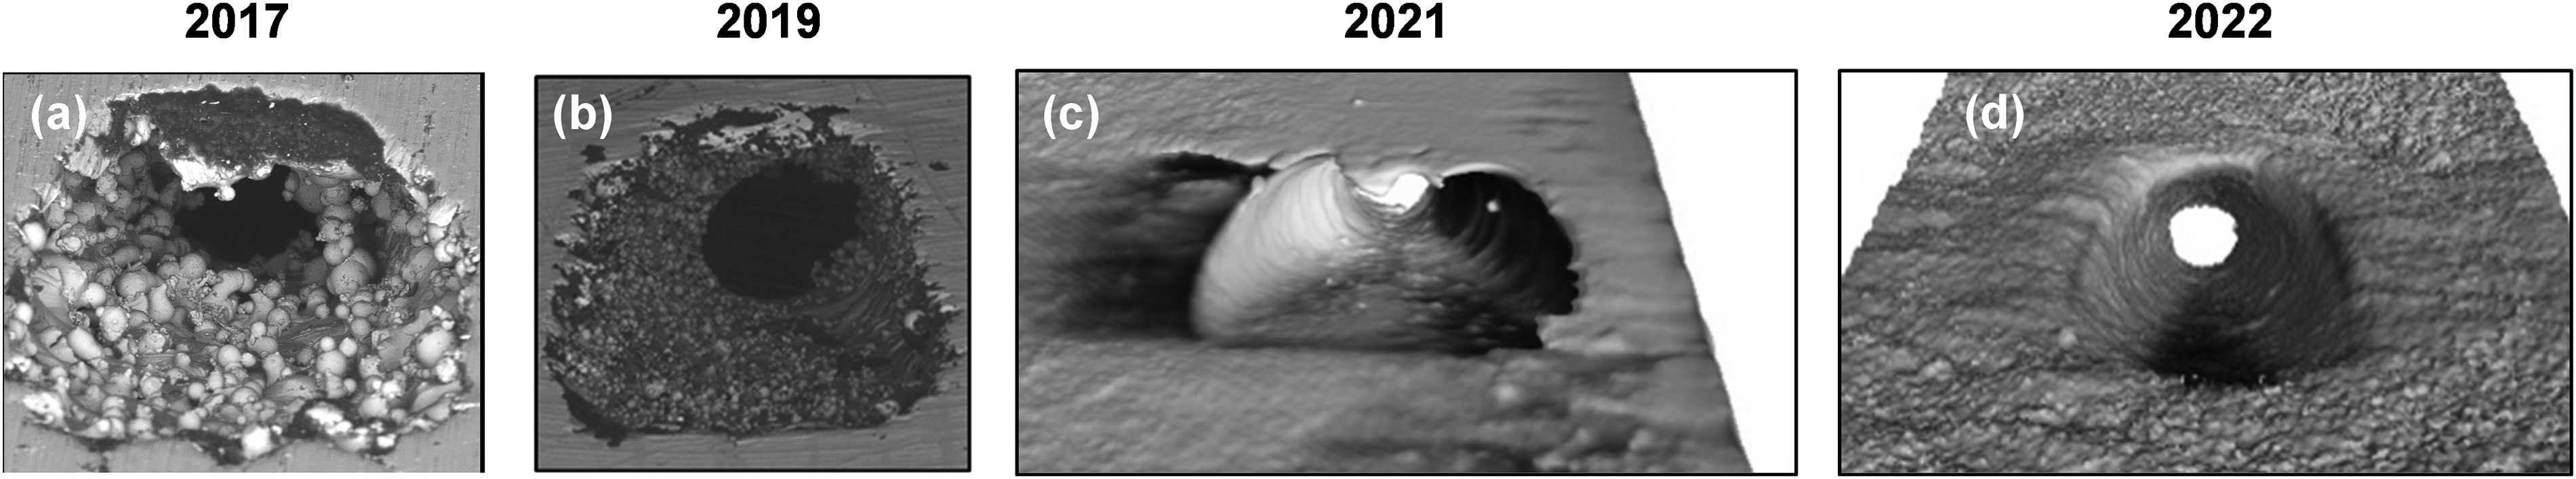
Film cooling holes are especially challenging to fabricate using AM due to the scale of the hole; however, there has been significant advances in AM technology over time as seen in Figure 1. Scanning electron microscope images from Stimpson et al. (2018a,b) in Figure 1 show the severity of the in-hole roughness and deformation. As AM continued to advance through a better understanding of the interaction between laser parameters and surface roughness, AM vendors have been able to more accurately produce engine-scale film cooling holes as seen from the progression of 2017 to 2022 in Figure 1. More specifically, the film cooling holes in Figure 1 were fabricated using the same EOS M280-1 machine overall several years. The 2017 hole in Figure 1a exhibits the most protrusions in the flow field relative to the other film cooling holes, while the most recent hole Figure 1d shows the least amount of protrusions and roughness features. Furthermore, with the improvement in machine parameters several studies such as Gutierrez et al. (2022) have shown the ability to produce highly complex adjoint optimized holes on flat coupons. Airfoils, however, remain challenging for AM given the thin walls and wide range of local surface orientations.
Figure 1.
Quality of additively manufactured film cooling holes (a) (Stimpson et al., 2018a,b), (b) (Snyder and Thole, 2019), (c) (Veley et al., 2022), (d) film cooling hole from this study highlighting the improvement in printability over several years.
As seen from the nondestructive computed tomography (CT) scans in Figure 2, there is a range of roughness and deviation from design intent for the external (film cooling hole in Figure 2a) and internal cooling designs (pin fins, ribs, and cooling channel in Figure 2b–d). It is commonly known that the surface deformations in a cooling hole can be reduced by changing the build direction.
Figure 2.
Computed Tomography scans highlighting the print quality of (a) film cooling holes, (b) pin fins from Ferster et al. (2017), (c) ribs, and (d) cooling microchannels from Snyder et al. (2015).
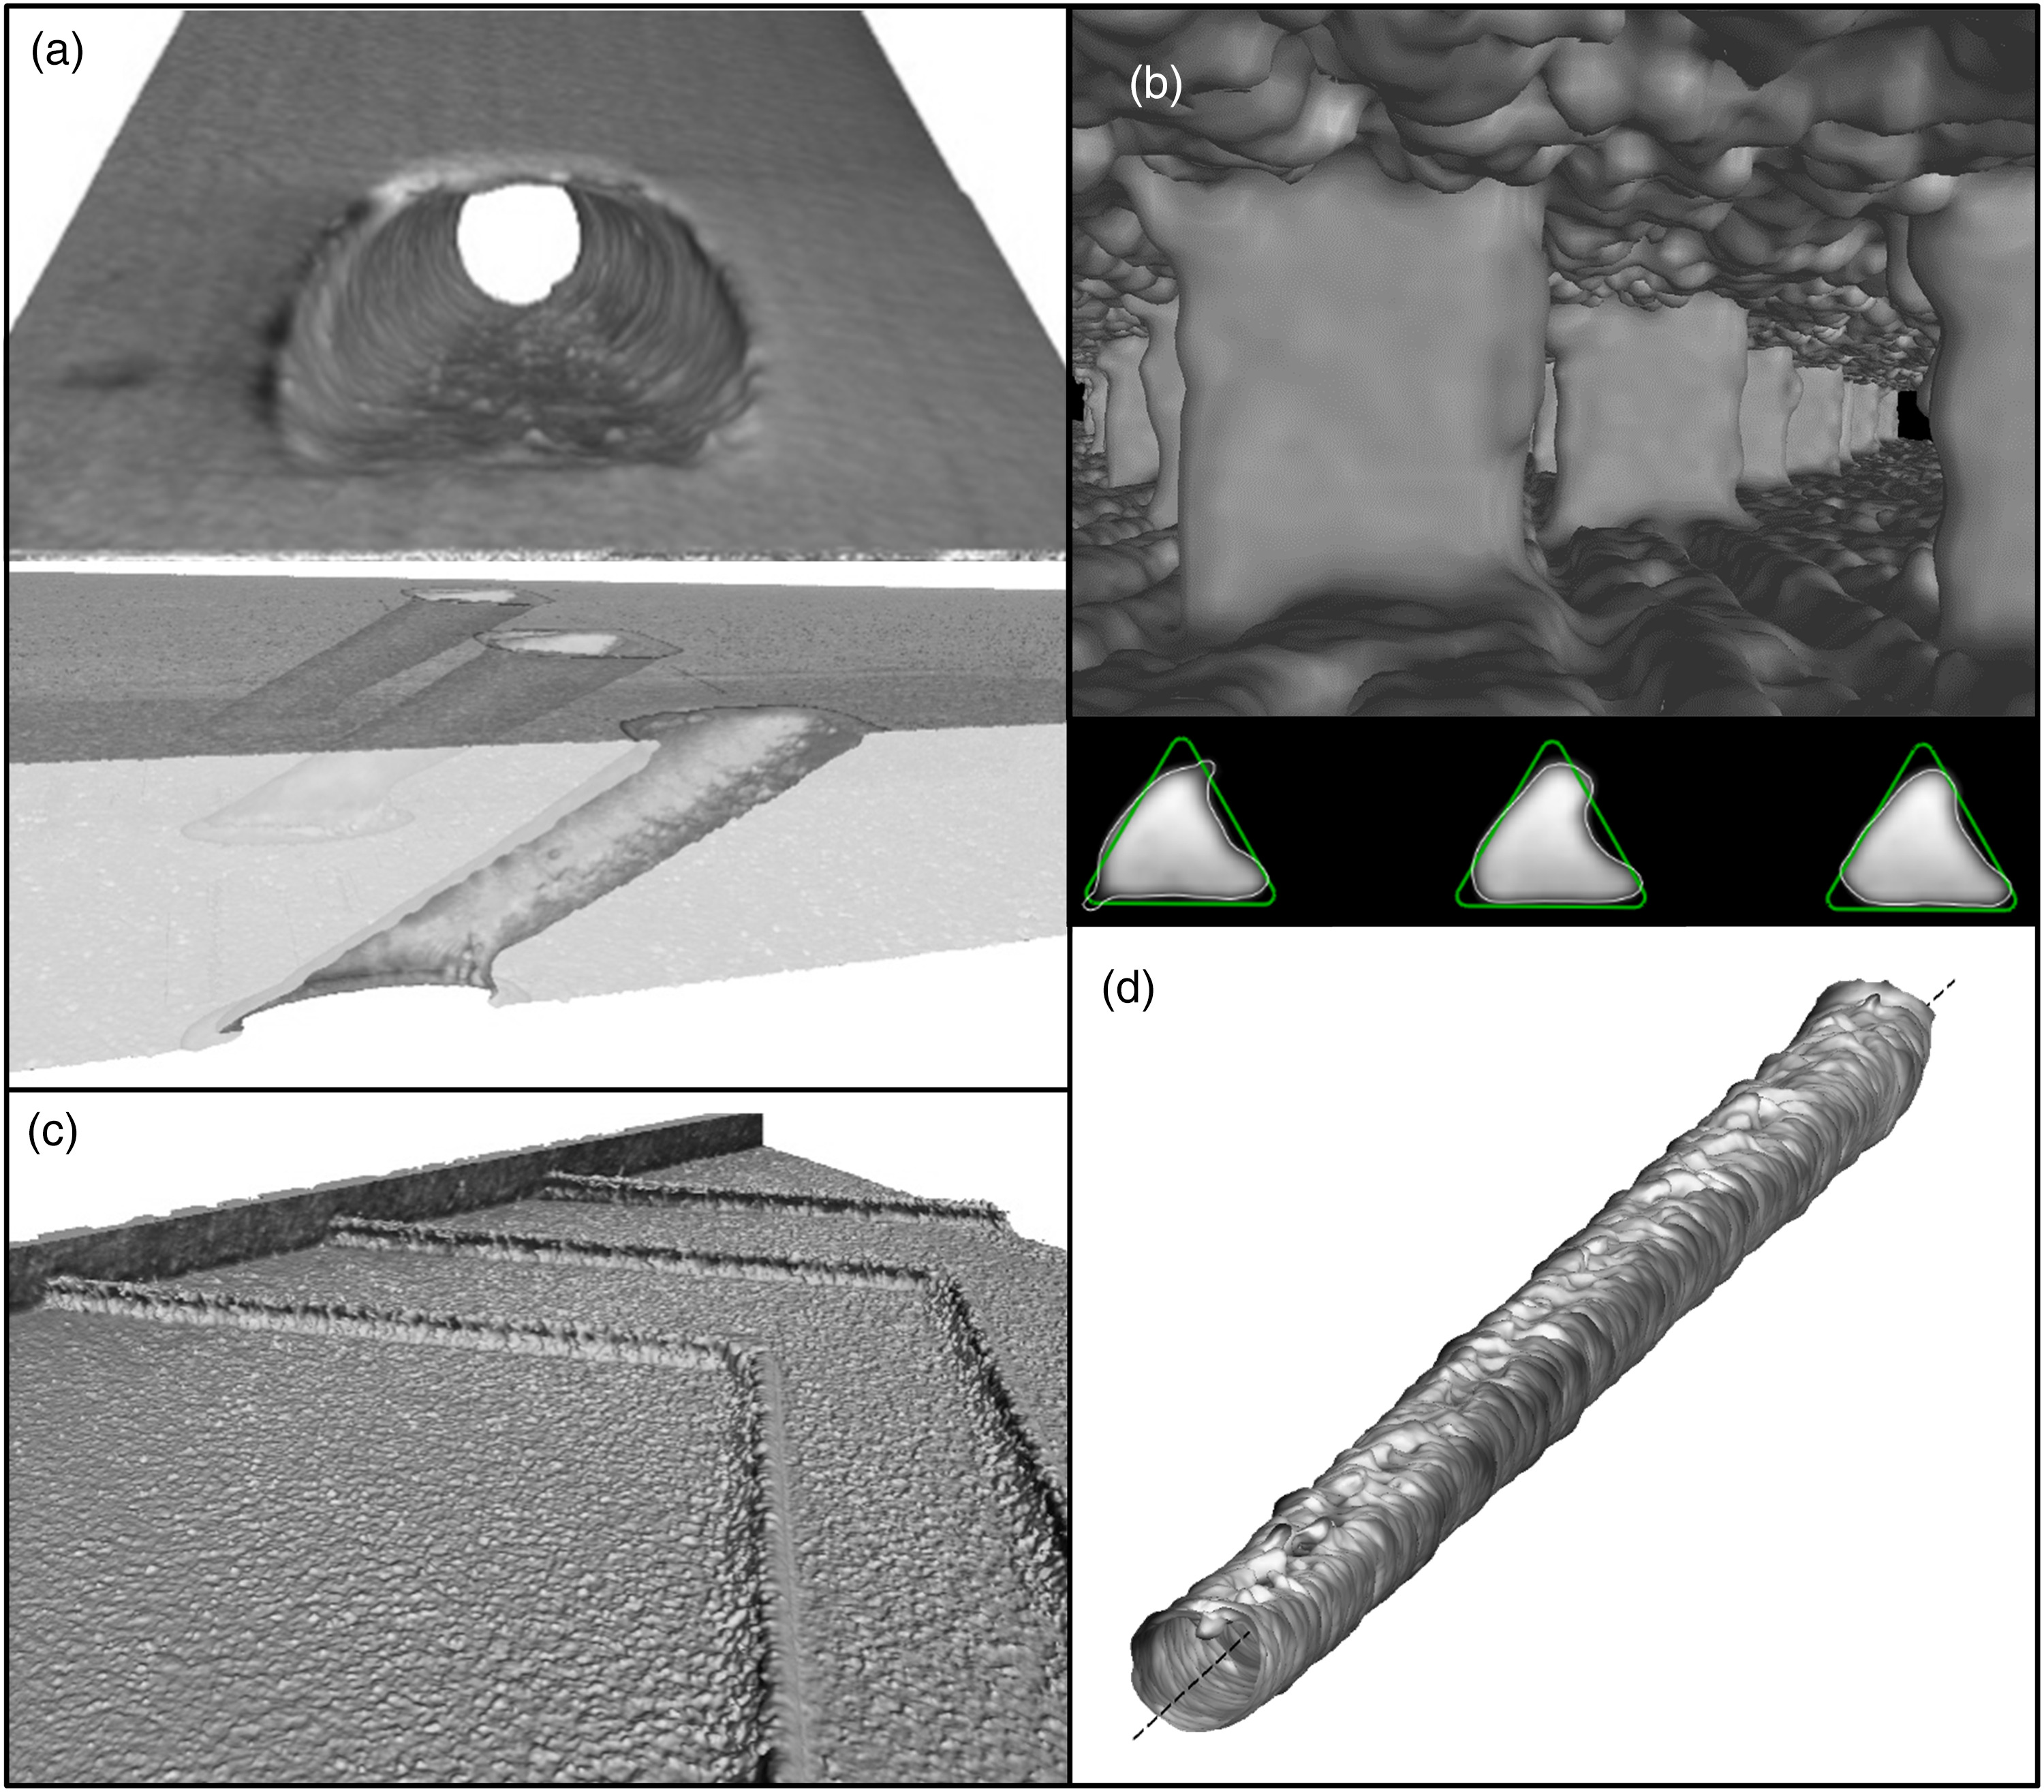
For the film cooling hole in Figure 2a, in-hole roughness is lowest when orienting the metering section of the film cooling hole perpendicular to the build plate (Stimpson et al., 2018a,b). Downward facing surfaces result in unsupported surfaces that cause additional melted material. The additional melted material causes hole blockages and large protrusions in the flow field that reduce the minimum cross-sectional area which ultimately limits the mass flow exiting the cooling hole for a given pressure ratio. The range of deviation between the design cross-sectional cooling hole area to the minimum cross-sectional area has been reported to be as high as 33% when the hole metering section is aligned perpendicular to the build plate and as high as 75% when the metering section is at a build direction other than being perpendicular to the build plate (Stimpson et al., 2018a,b; Veley et al., 2022). In some cases, at angles where the film cooling holes are less than 45° between the metering section axis and the build plate the holes have been shown to be completely blocked (Stimpson et al., 2018a,b). When examining the variation from hole to hole for a given part, Veley et al. (2022) observed that variation from the design intent between holes depends upon the film cooling hole design.
The same AM build factors that affect the printability of film cooling holes have also been shown to impact the quality of pin fins produced through AM as seen in Figure 2b. The pin fin from Ferster et al. (2017), in Figure 2b, shows the severe amount of deformation that can occur for a triangular pin fin that has surfaces downward facing, in this case some surfaces were built parallel to the build plate. When qualitatively observing the variation from pin to pin in Figure 2b there is not an immediately noticeable difference in cross-section between pin fins. The work of Ferster et al. (2017) and (Corbett and Thole, 2022) showed that changes to geometry of a pin fin, such as going from a circle to a star, can mitigate deformation caused by downward facing surfaces, however similar to the triangular pins in Figure 2b, there is minimal change in tolerances qualitatively between pin fins for a given pin design.
Despite ribs, seen in Figure 2c, being prominent in modern turbine airfoils, there has been little focus toward characterizing the geometric deviations of ribs made through AM. These characterizations continue to be important for turbine applications and more research is needed. The work by Chen et al. (2019) investigated the cooling performance of various engine scale rib designs in a two pass rectangular duct, even though AM was used to fabricate the part the rib features were machined to the desired geometry. Searle et al. (2022) used the as-built form of the ribs to investigate the cooling performance of ribs and dimple configurations, however the study did not characterize the tolerances or comment on the quality of the ribs.
A significant portion of literature has focused on the deviation from design intent and geometric tolerances for micro-sized channels ranging in diameter from 500 µm to 1,250 µm as seen in Figure 1d, more so than other internal features. Similar to the film-cooling hole, the angle at which the channel is relative to the build plate impacts the resulting tolerances and geometry. Snyder et al. (2015), Mingear et al. (et al.2019), Wildgoose et al. (2021), Kamat and Pei (2019), and Kasperovich et al. (2021) showed that cooling channels built perpendicular to the build plate result in the lowest surface roughness and deviation from design intent. Wildgoose et al. (2021) showed that for a circular channel fabricated at different build directions, the standard deviation in hydraulic diameter increases 166% when going from a channel built perpendicular to parallel with the build plate. Kasperovich et al. (2021) accounted for these differences due to build direction by altering the geometry as well as laser scan parameters to produce favorable tolerances for a range of build directions. Less complex changes to the geometry of the cooling channel such as implementing a teardrop correction for circular channels has also been shown to produce circular channels without severe deformations as in the case of Kamat and Pei (2019) and Snyder et al. (2015).
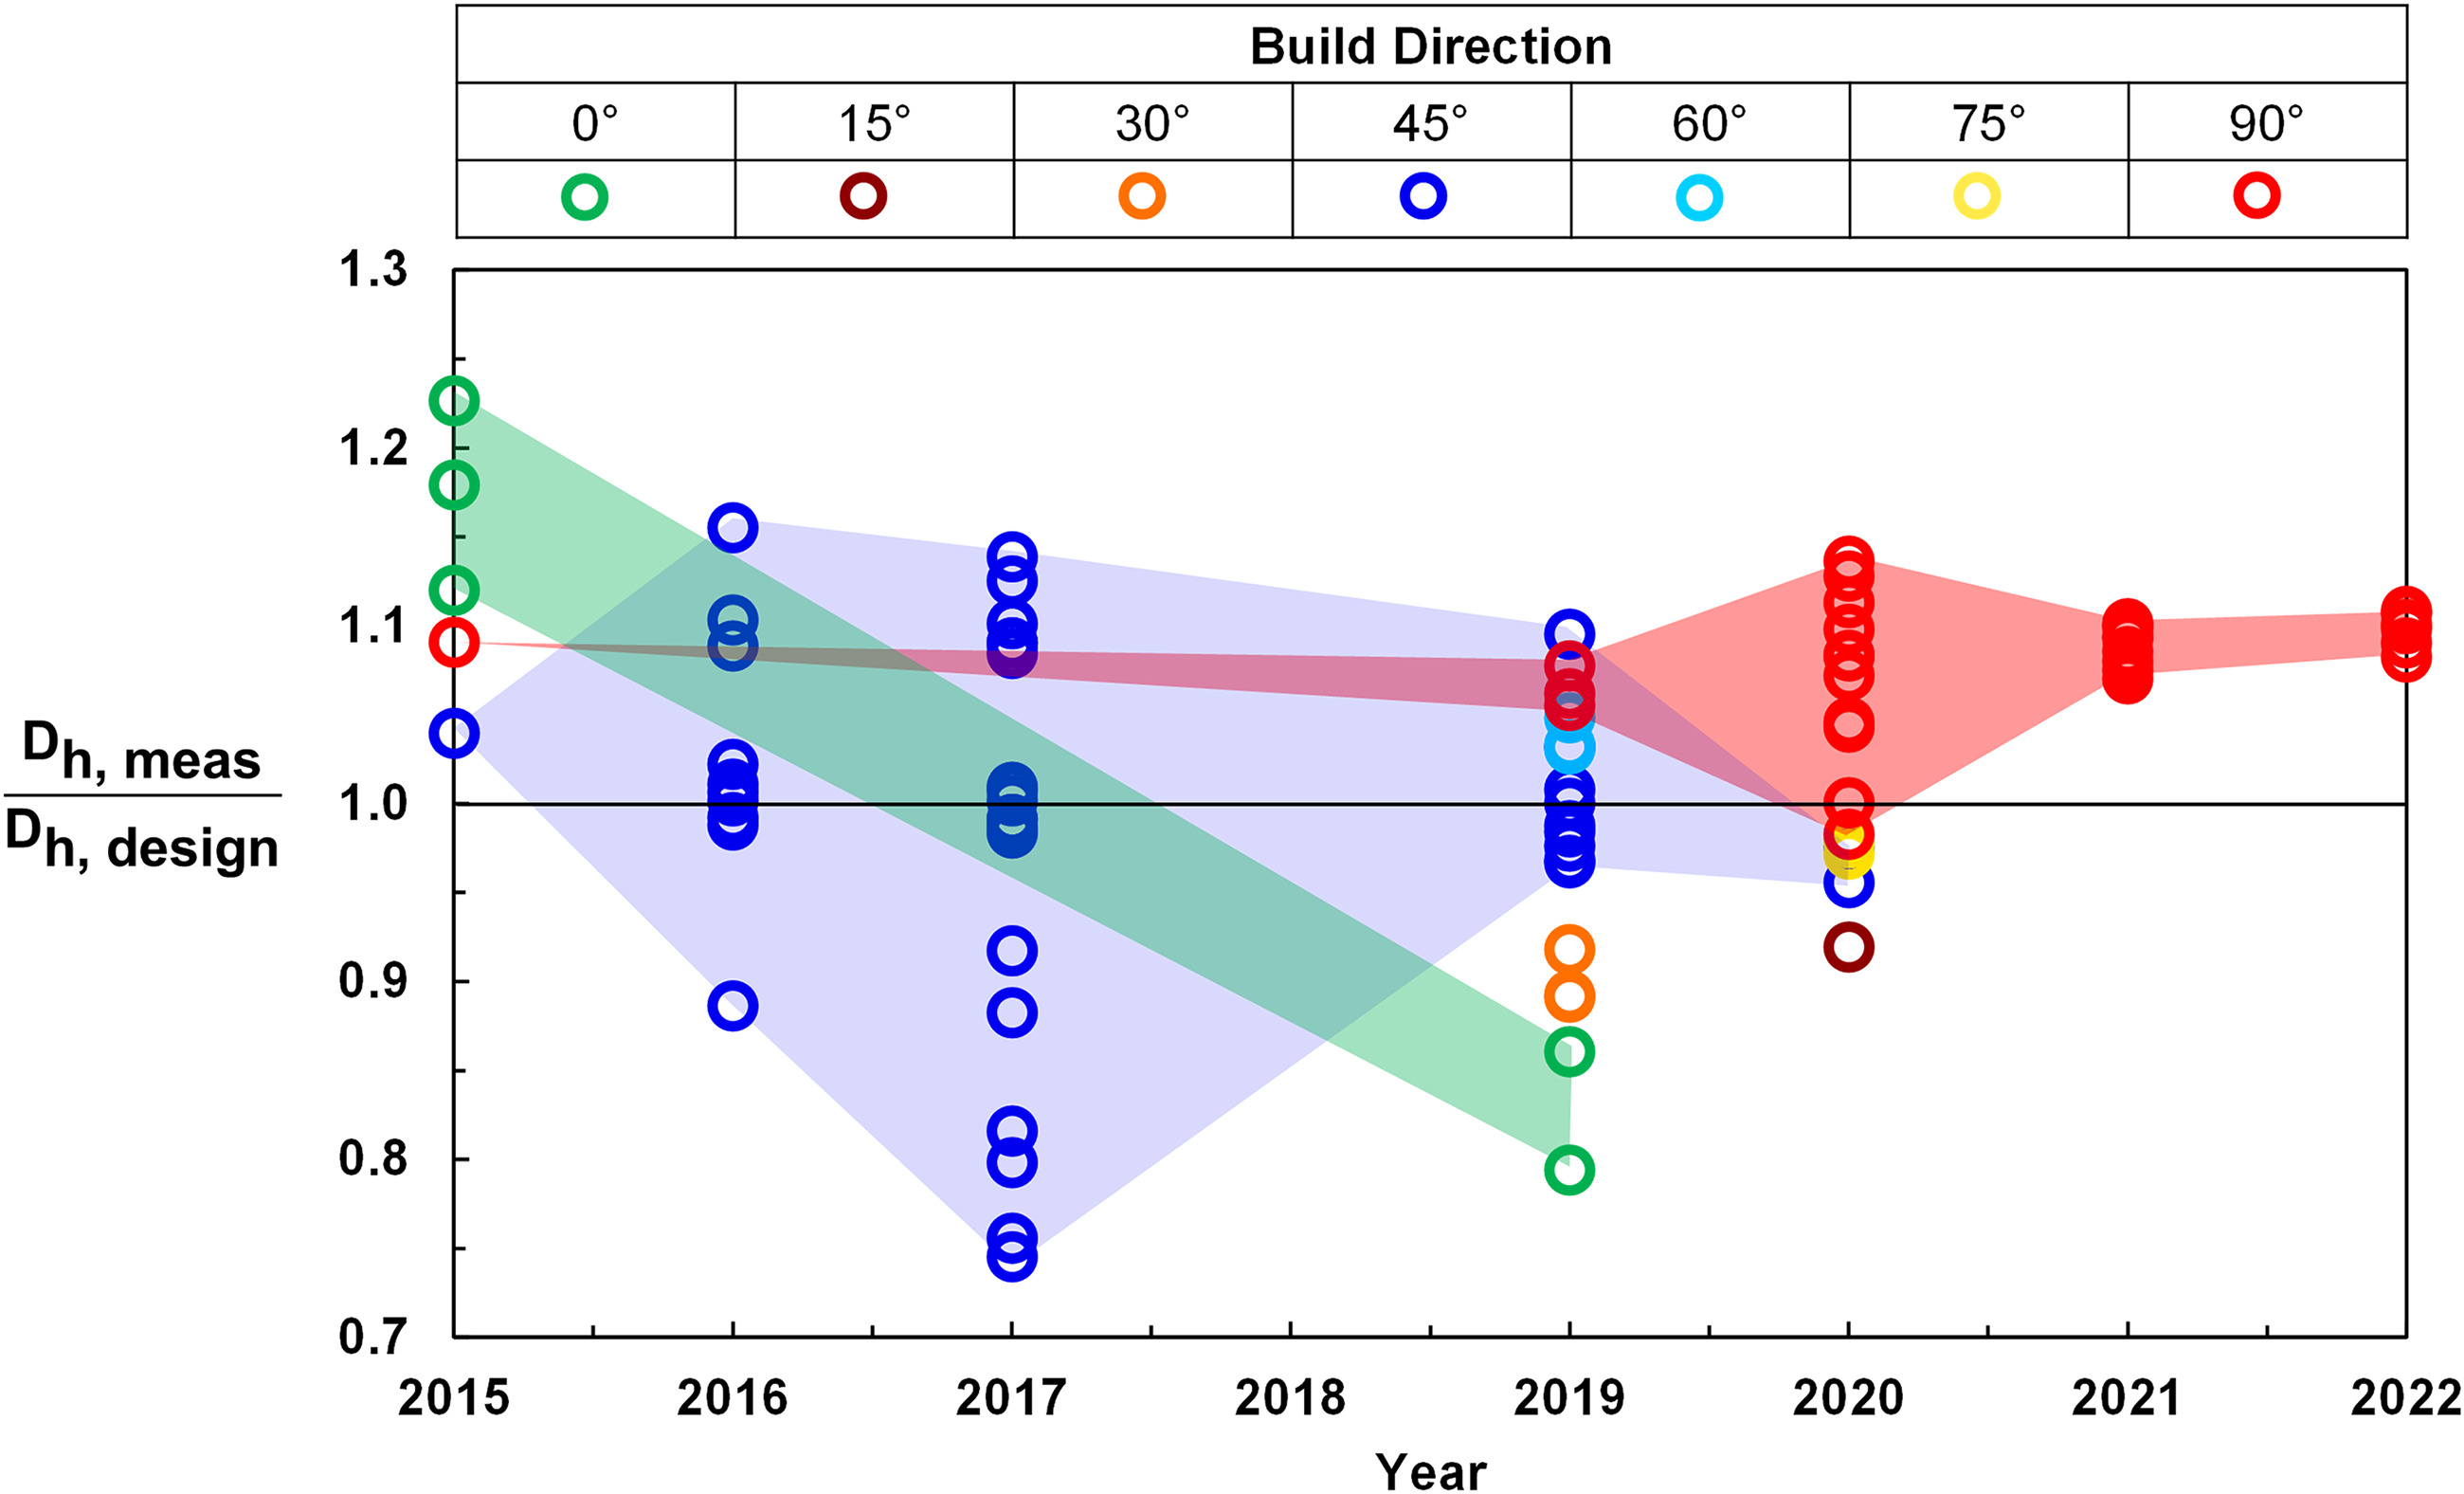
Similar to the improvement in film cooling hole printability over time in Figure 1, the quality of cooling channels, in terms of replicating the design hydraulic diameter, has also improved over time as indicated in Figure 3. Figure 3 shows the difference between the measured hydraulic diameter to that of the design intent for cooling channels built using a variety of AM machines (EOS M280-1 and EOS M290-1) at different build directions reported in literature over several years (Stimpson et al., 2016a,b; Kirsch et al., 2017; Dahmen et al., 2020; Wildgoose et al., 2021, 2022; Wildgoose and Thole, 2022). The samples in Figure 3 includes a variety of materials, channel cross-sectional shapes, channel sizes, and laser process parameters. Immediately noticeable is that the spread in hydraulic diameter for the 45° build direction is less when going from 2015 to 2019. Additionally, the same is true for the 90° channels between 2019 and 2022.
Figure 3.
Deviation from design intent hydraulic diameter of microchannels in literature at a variety of build directions (Stimpson et al., 2016a,b; Kirsch et al., 2017; Dahmen et al., 2020; Wildgoose et al., 2021, 2022; Wildgoose and Thole, 2022).
Roughness and geometery variability of simple channels due to build plate location
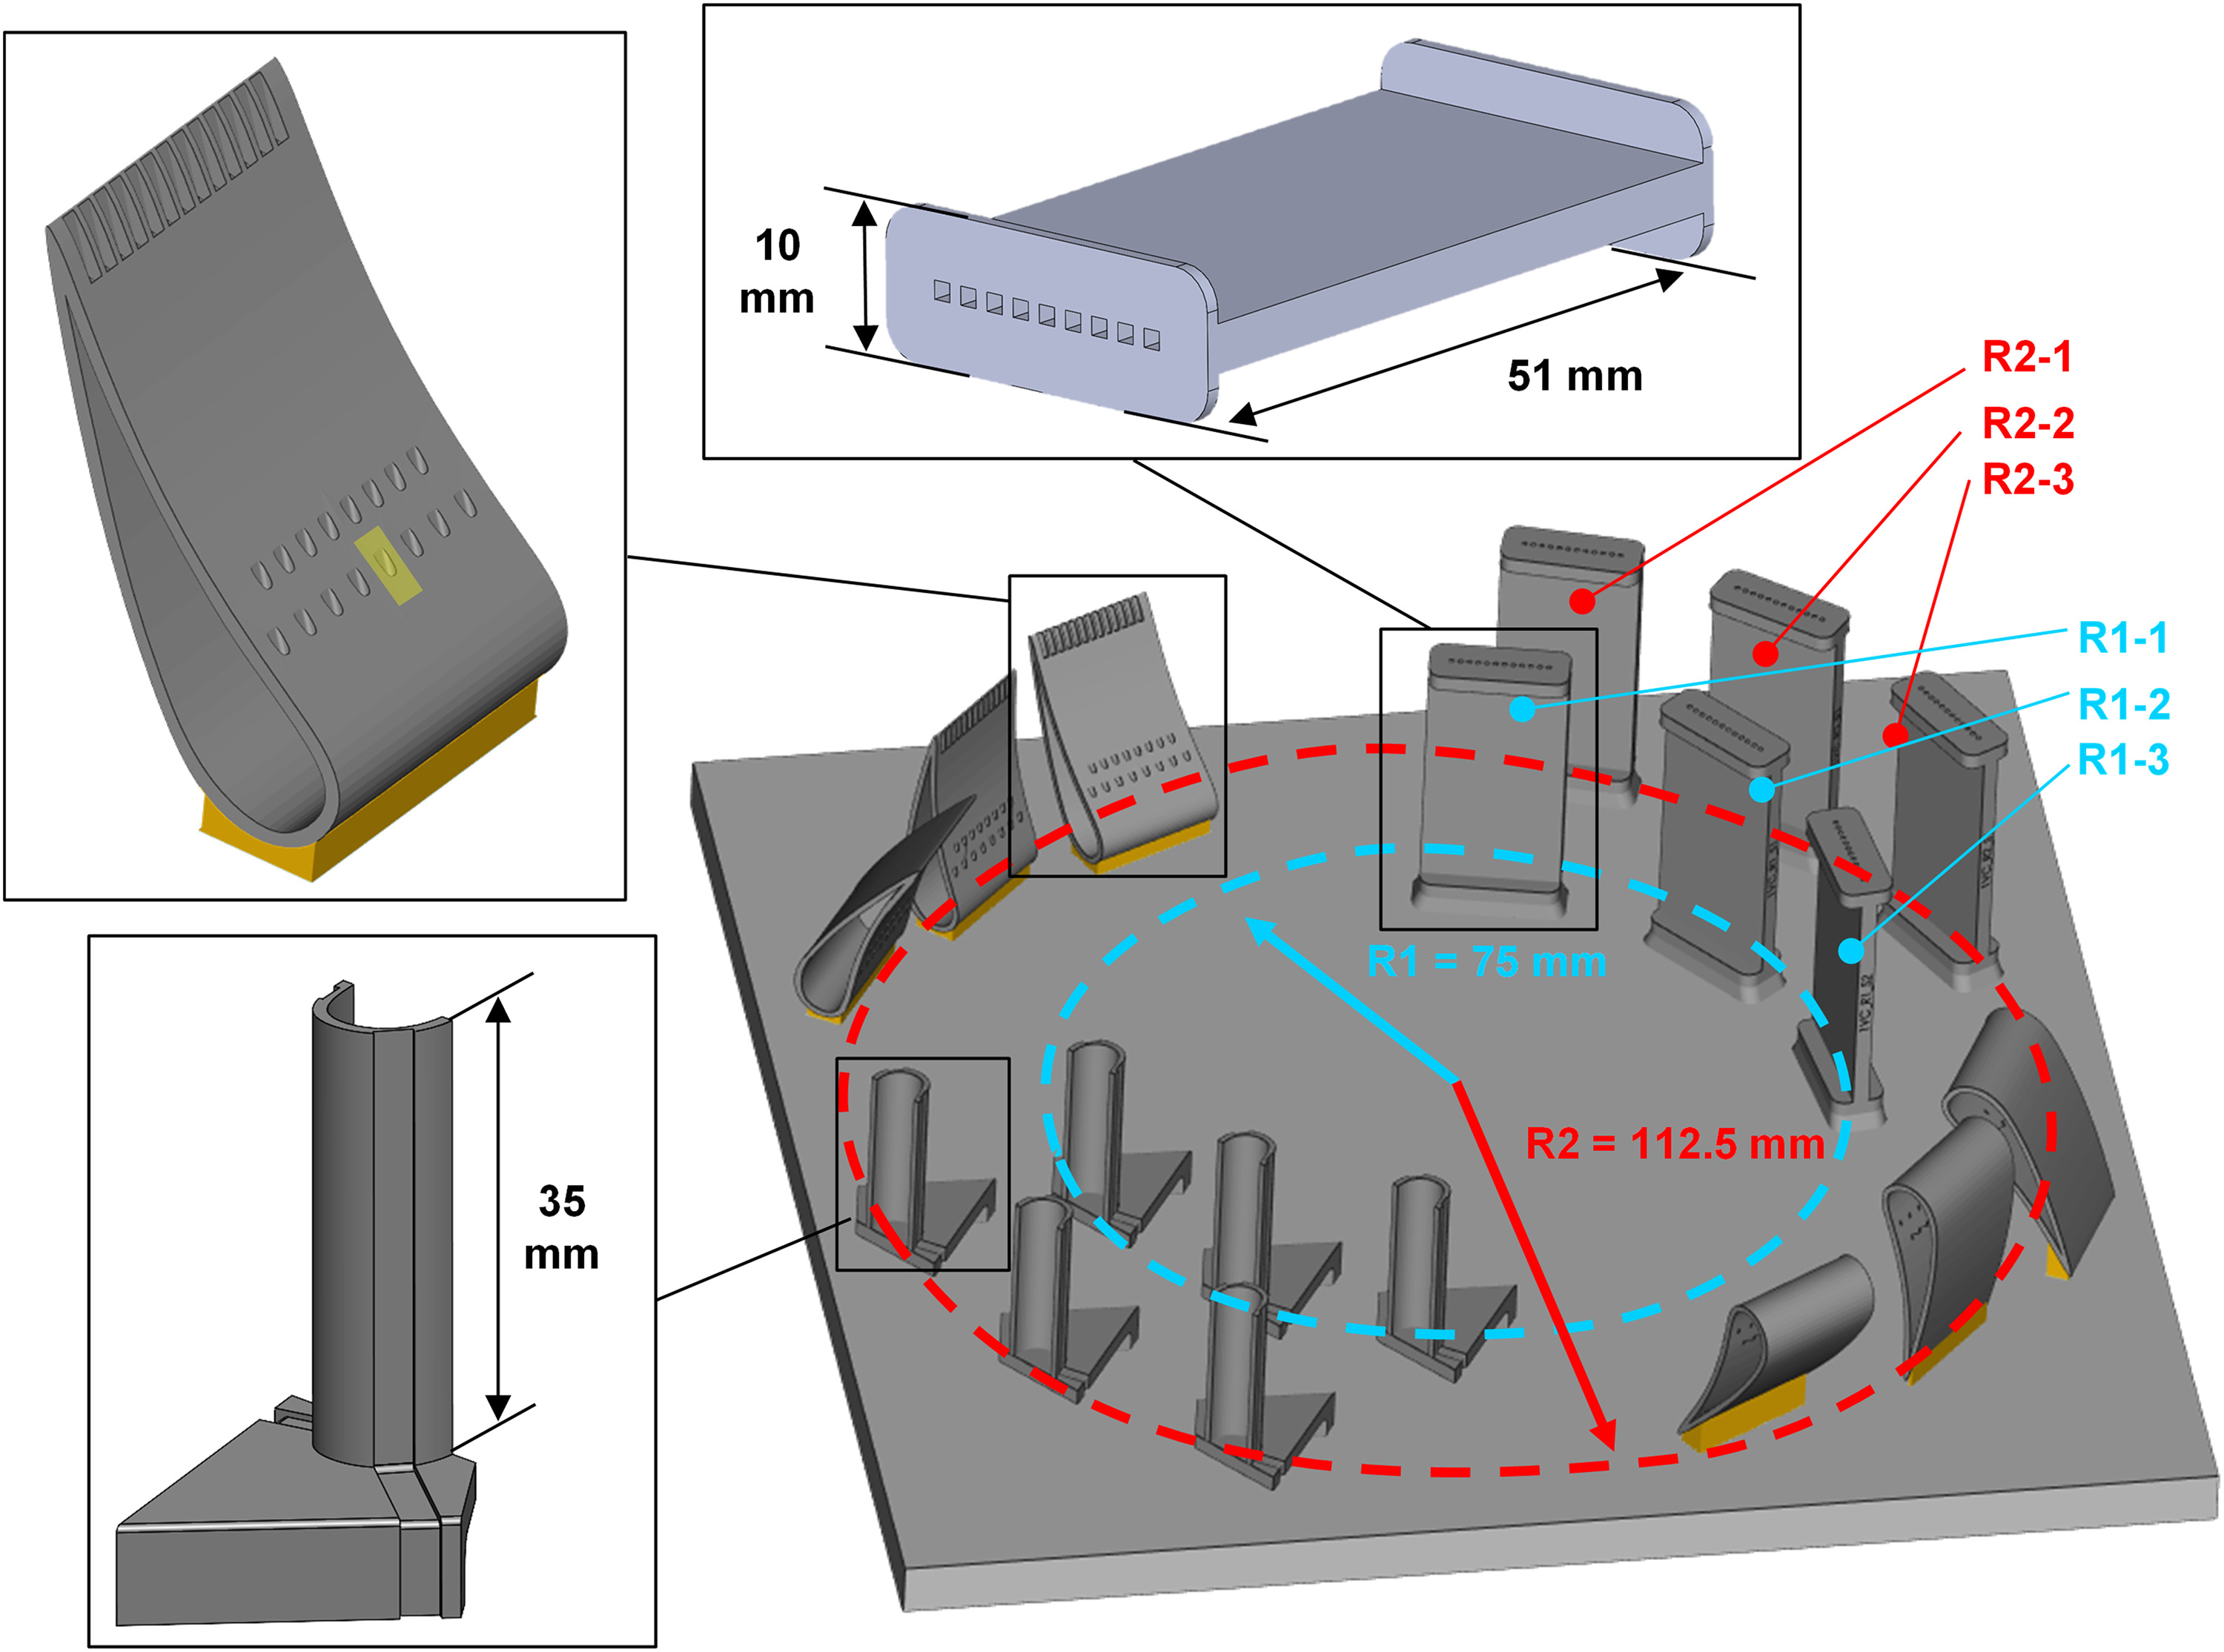
As the AM technology has continued to evolve over time, research has gone beyond identifying the most primary effects on as-built geometry such as feature size and build direction, new issues have evolved such as part reproducibility. Especially since part reproducibility is critical in turbine components to ensure expected flow distributions and part temperatures. As a result, several cooling channel coupons were fabricated to investigate the variability in geometry and roughness at different build plate locations. More specifically, square microchannel coupons with a Dh = 1.25 mm were fabricated multiple times on a build plate at two different radial build plate locations, as seen in Figure 4. The coupons were made using Inconel 718 with a 40 micron layer thickness. The coupons were fabricated at a radial distance of R1 = 75 mm and R2 = 112.5 mm from the center of the build plate (laser source) as seen in Figure 4. Each leading edge vane and microchannel sample design was printed three times at each of the radial build locations in Figure 4. To mitigate surface deformation caused by build direction, the channels were fabricated with their streamwise axis perpendicular to the build plate. The samples were fabricated using standard manufactured recommended laser process parameters on a single laser EOS M290-1 machine and with EOS recommended post processing heat treatment parameters (EOS, 2011). Furthermore, the Inconel 718 powder was sieved through a filter to a 40-micron nominal powder size.
Figure 4.
Layout of build plate to evaluate the variability of cooling channels and cooled NExT vanes on an EOS M290-1.
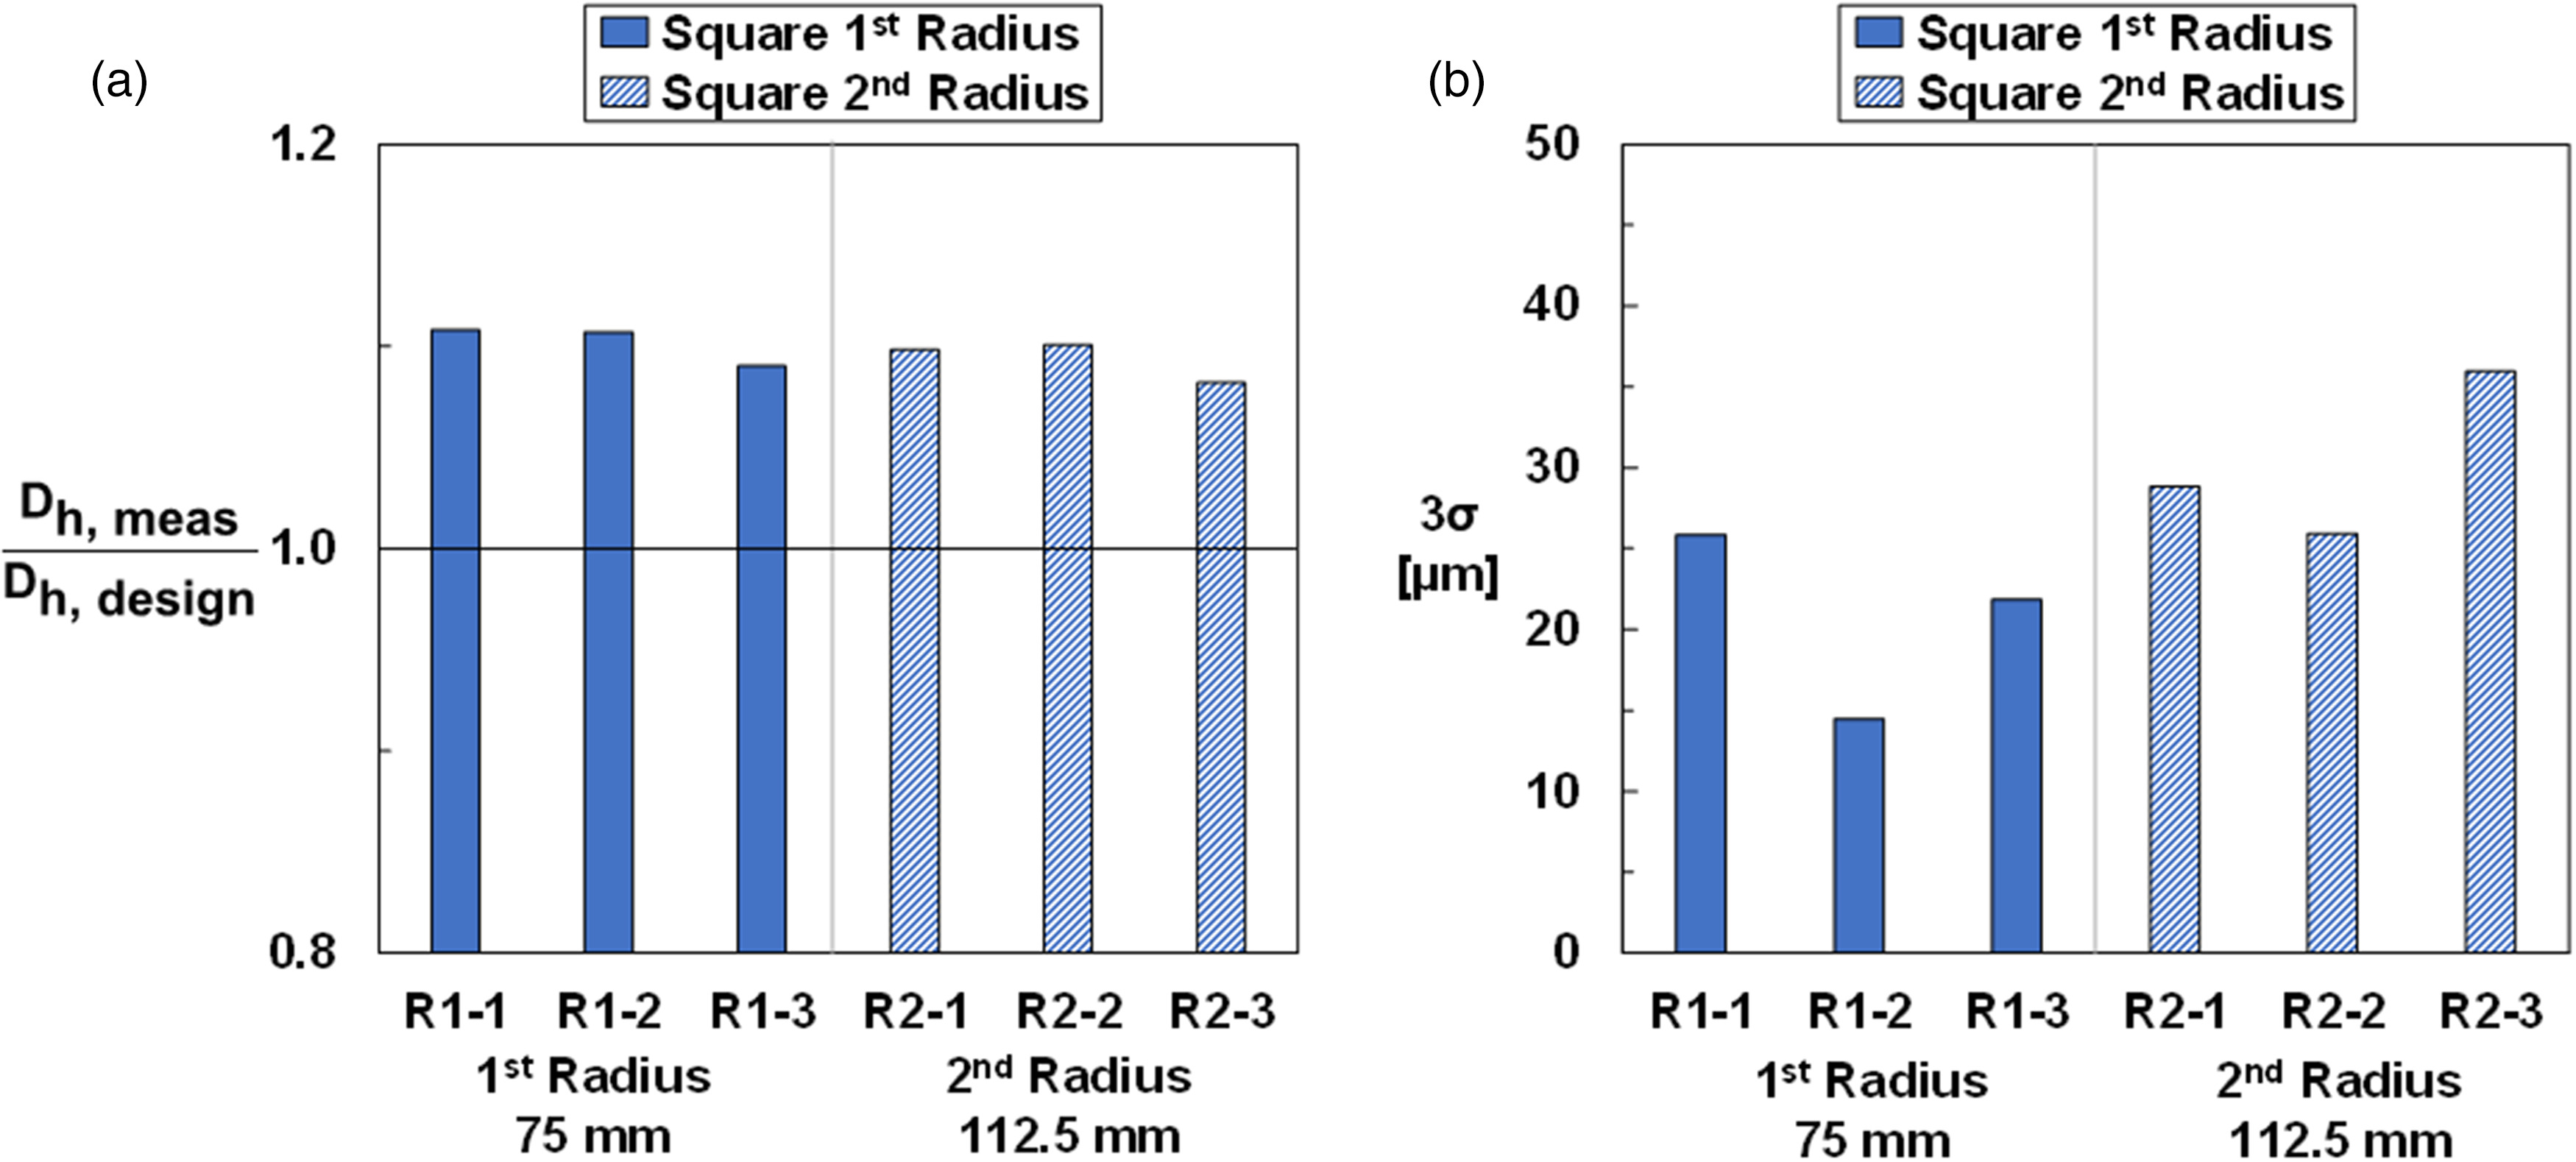
Hydraulic diameter was characterized for the cooling coupons in Figure 4 using computed tomography scanning. The deviation from design intent hydraulic diameter for each square channel samples at the two radii's is shown in Figure 5a. The naming convection of for each of the samples lists the radius they were fabricated at and then the sample number (i.e. R1-1), as shown in Figure 4. As seen by the data in Figure 5a, there is little difference in hydraulic diameter for the square channels even with changes to build location. For the square samples at both radii, 75 and 112.5 mm, there is a 2% difference in hydraulic diameter between the three samples. While there is minimal difference in the as-built hydraulic diameter between the samples at different locations, the standard deviation in hydraulic diameter, specifically 3σ variation in hydraulic diameter, for a sample does change with build location. There is a greater variation in hydraulic diameter for samples built at the 112.5 mm radius compared to the closer radius as seen in Figure 5b for the square coupons. The average variation in hydraulic diameter of the 112.5 mm radius group for the square channels is 37% higher compared to the smaller radius.
Figure 5.
Average hydraulic diameter of square and hexagonal channels, built across two different build locations, measured from CT scans (a) along with each of the coupons 3σ (b) variation in hydraulic diameter.
In addition to characterizing the geometry of the coupon, surface arithmetic mean roughness values were quantified for each sample. The arithmetic mean roughness describes the average deviation from a surface to a datum value. In this case, multiple planes were fitted for each surface of the channel to act as a reference value and the difference between the surface and the planes were recorded as the arithmetic mean roughness. The specific details of this method have been described by Wildgoose et al. (2021) and Snyder et al. (2015). The arithmetic mean roughness for each surface of the square channels (as defined by the clock shown in the legend) were averaged and given by Figure 6a while the area average arithmetic mean roughness in Figure 6b is averaged between all channel surfaces for a given coupon and is weighted by the design intent surface area.
Figure 6.
Arithmetic mean roughness form CT scan data of each surface for the square cooling channels (a) along with area average arithmetic mean roughness (b) of the same square channels weighted by the design intent surface area.
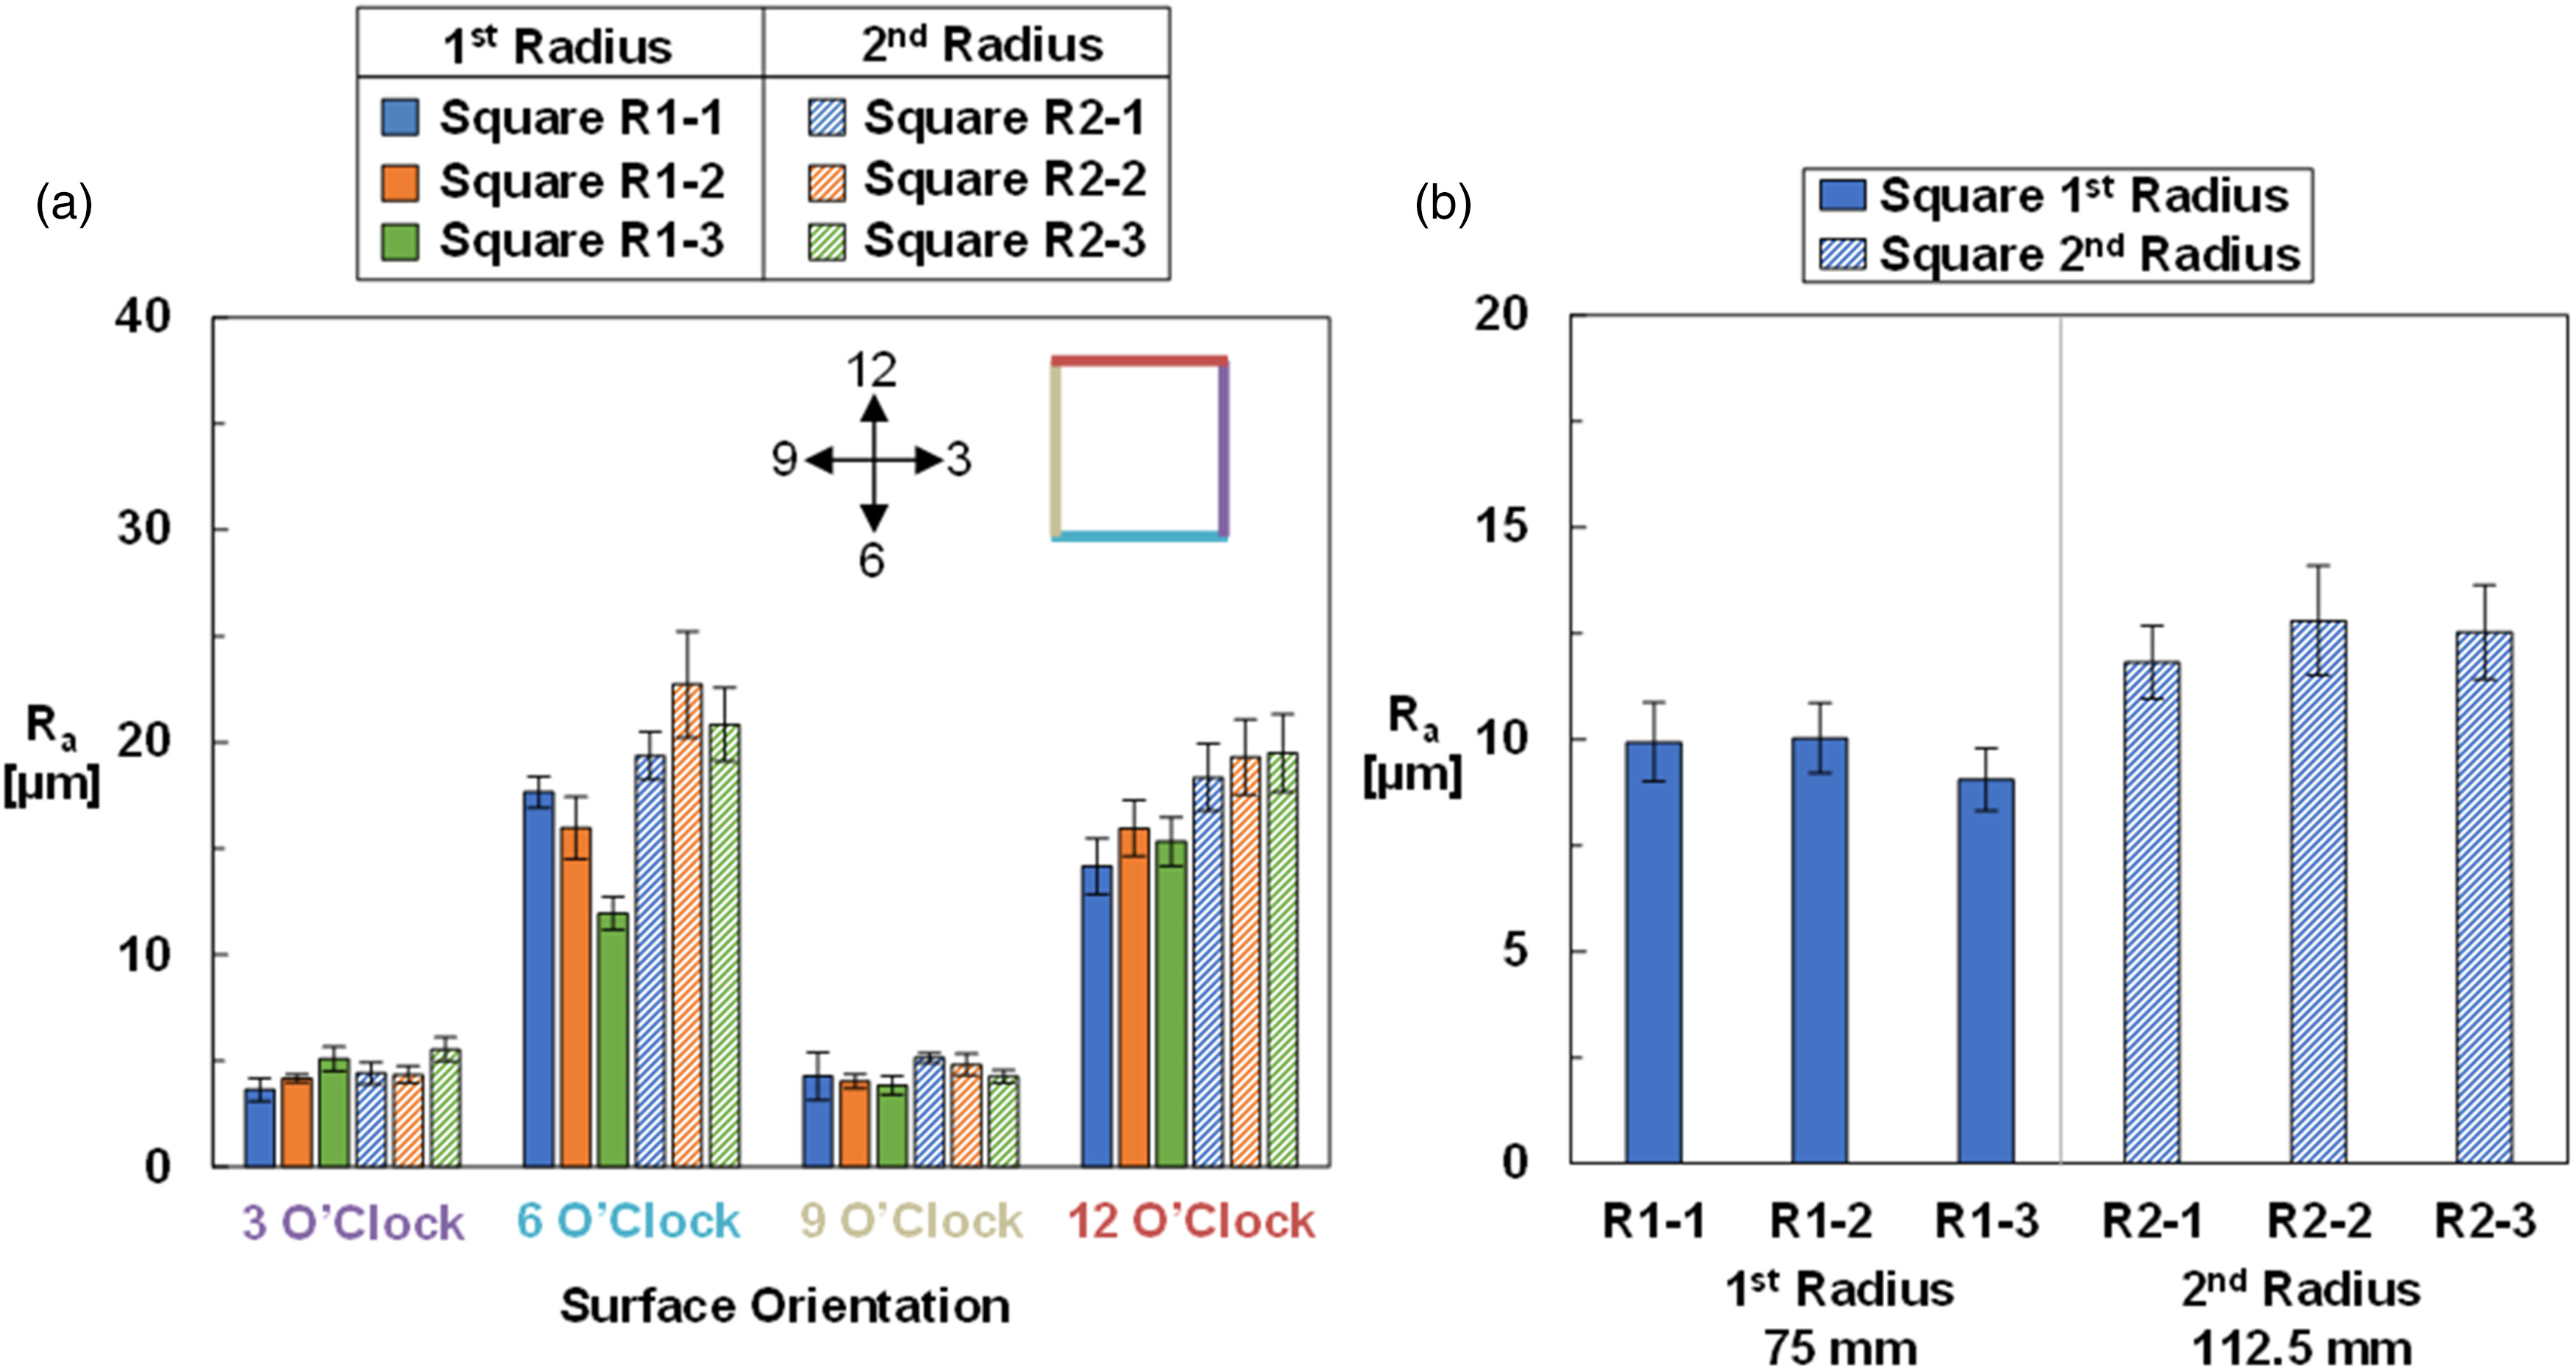
Regardless of surface orientation in the square channel, samples that were produced further from the laser source exhibit a higher arithmetic mean roughness relative to samples built closer to the laser source as seen in Figure 6a. The positional dependency on roughness exhibited by the square channels is similar to literature (Sendino et al., 2020; Subramanian et al., 2021; Wildgoose et al., 2022). Even though multiple parts can be built on a build plate, there can still be differences in surface roughness between parts as result of changes to the radial build location. Most surface orientations, such as 3 o’clock, 9 o’clock, and 12 o’clock in Figure 6a have a similar arithmetic mean roughness between samples for a given build location. However, the 6 o’clock direction has the highest variation in arithmetic mean roughness between samples for both build locations relative to other surface orientations. The result infers that some surfaces within a channel, despite all sharing the same local surface orientation with respect to the build plate, can differ between samples. Even though the square cooling channels were all built vertically, the 6 o’clock and 12 o’clock orientations contain higher roughness levels relative to the 3 and 9 o’clock surfaces. The reason for the differences was found to be a factor of wall thickness (Wildgoose et al., 2022).
The area averaged arithmetic mean roughness in Figure 6b show an average 28% increase in surface roughness for the 112.5 mm radial position relative to the smaller radial build location. Figure 6b also indicates little difference in surface roughness between samples for a given radial build location. Samples fabricated at the larger radius have a difference of 6% in arithmetic mean roughness while samples fabricated at the smaller radius have a 10% difference in roughness. These results indicate that cooling channels built further from the laser source exhibit more variation and higher surface roughness compared to samples built closer to the laser source.
Part-to-part variability of features on turbine components due to build plate location
The inherent complexity of cooling schemes implemented in turbine vanes highlights the challenges additive manufacturing faces to both resolve and fabricate the tight tolerances required for predictable cooling performance between parts. Few studies have investigated the printability of vane external or internal cooling features as well as the overall deviation from design intent. Hossain et al. (2021) evaluated the overall cooling effectiveness of nozzle guide vanes with different film cooling holes designs. To adequality resolve a complex cooling hole, (Hossain et al., 2018) and (Hossain et al., 2021) increased the diameter of the film cooling hole by 30% to ensure minimal blockage. Kirollos and Povey (2017) also oversized film cooling holes to reduce shrinkage effects during manufacturing of a nozzle guide vane produced through AM. While the Kirollos and Povey (2017) study primary focus was on cooling performance of the AM vane relative to a traditionally casted vane, there was a standard deviation of ± 0.15 mm from the design intent of the AM vane.
Wildgoose et al. (2022) focused on the impact of the vane geometry and AM build parameters on the resulting surface quality of vane airfoils. Their results showed the importance of the overall build direction given the many features in a vane giving way to differences in surface uniformity between the pressure and suction sides. Their study also investigated positional effects on a vane airfoil and showed that the surface roughness of airfoils increased by 25% as the part location on the build plate went from 75 mm to 187.5 mm. Additionally, differences were observed between different machines and layer thicknesses. Airfoils fabricated using an 80 micron layer thickness contained higher levels of surface roughness relative to 40 microns. Additionally, the surface roughness of the airfoils was lower when fabricated on an EOS M290-1 compared to an EOS M400-1. However, there were no cooling features, either internal or external, included in their printed vane coupons.
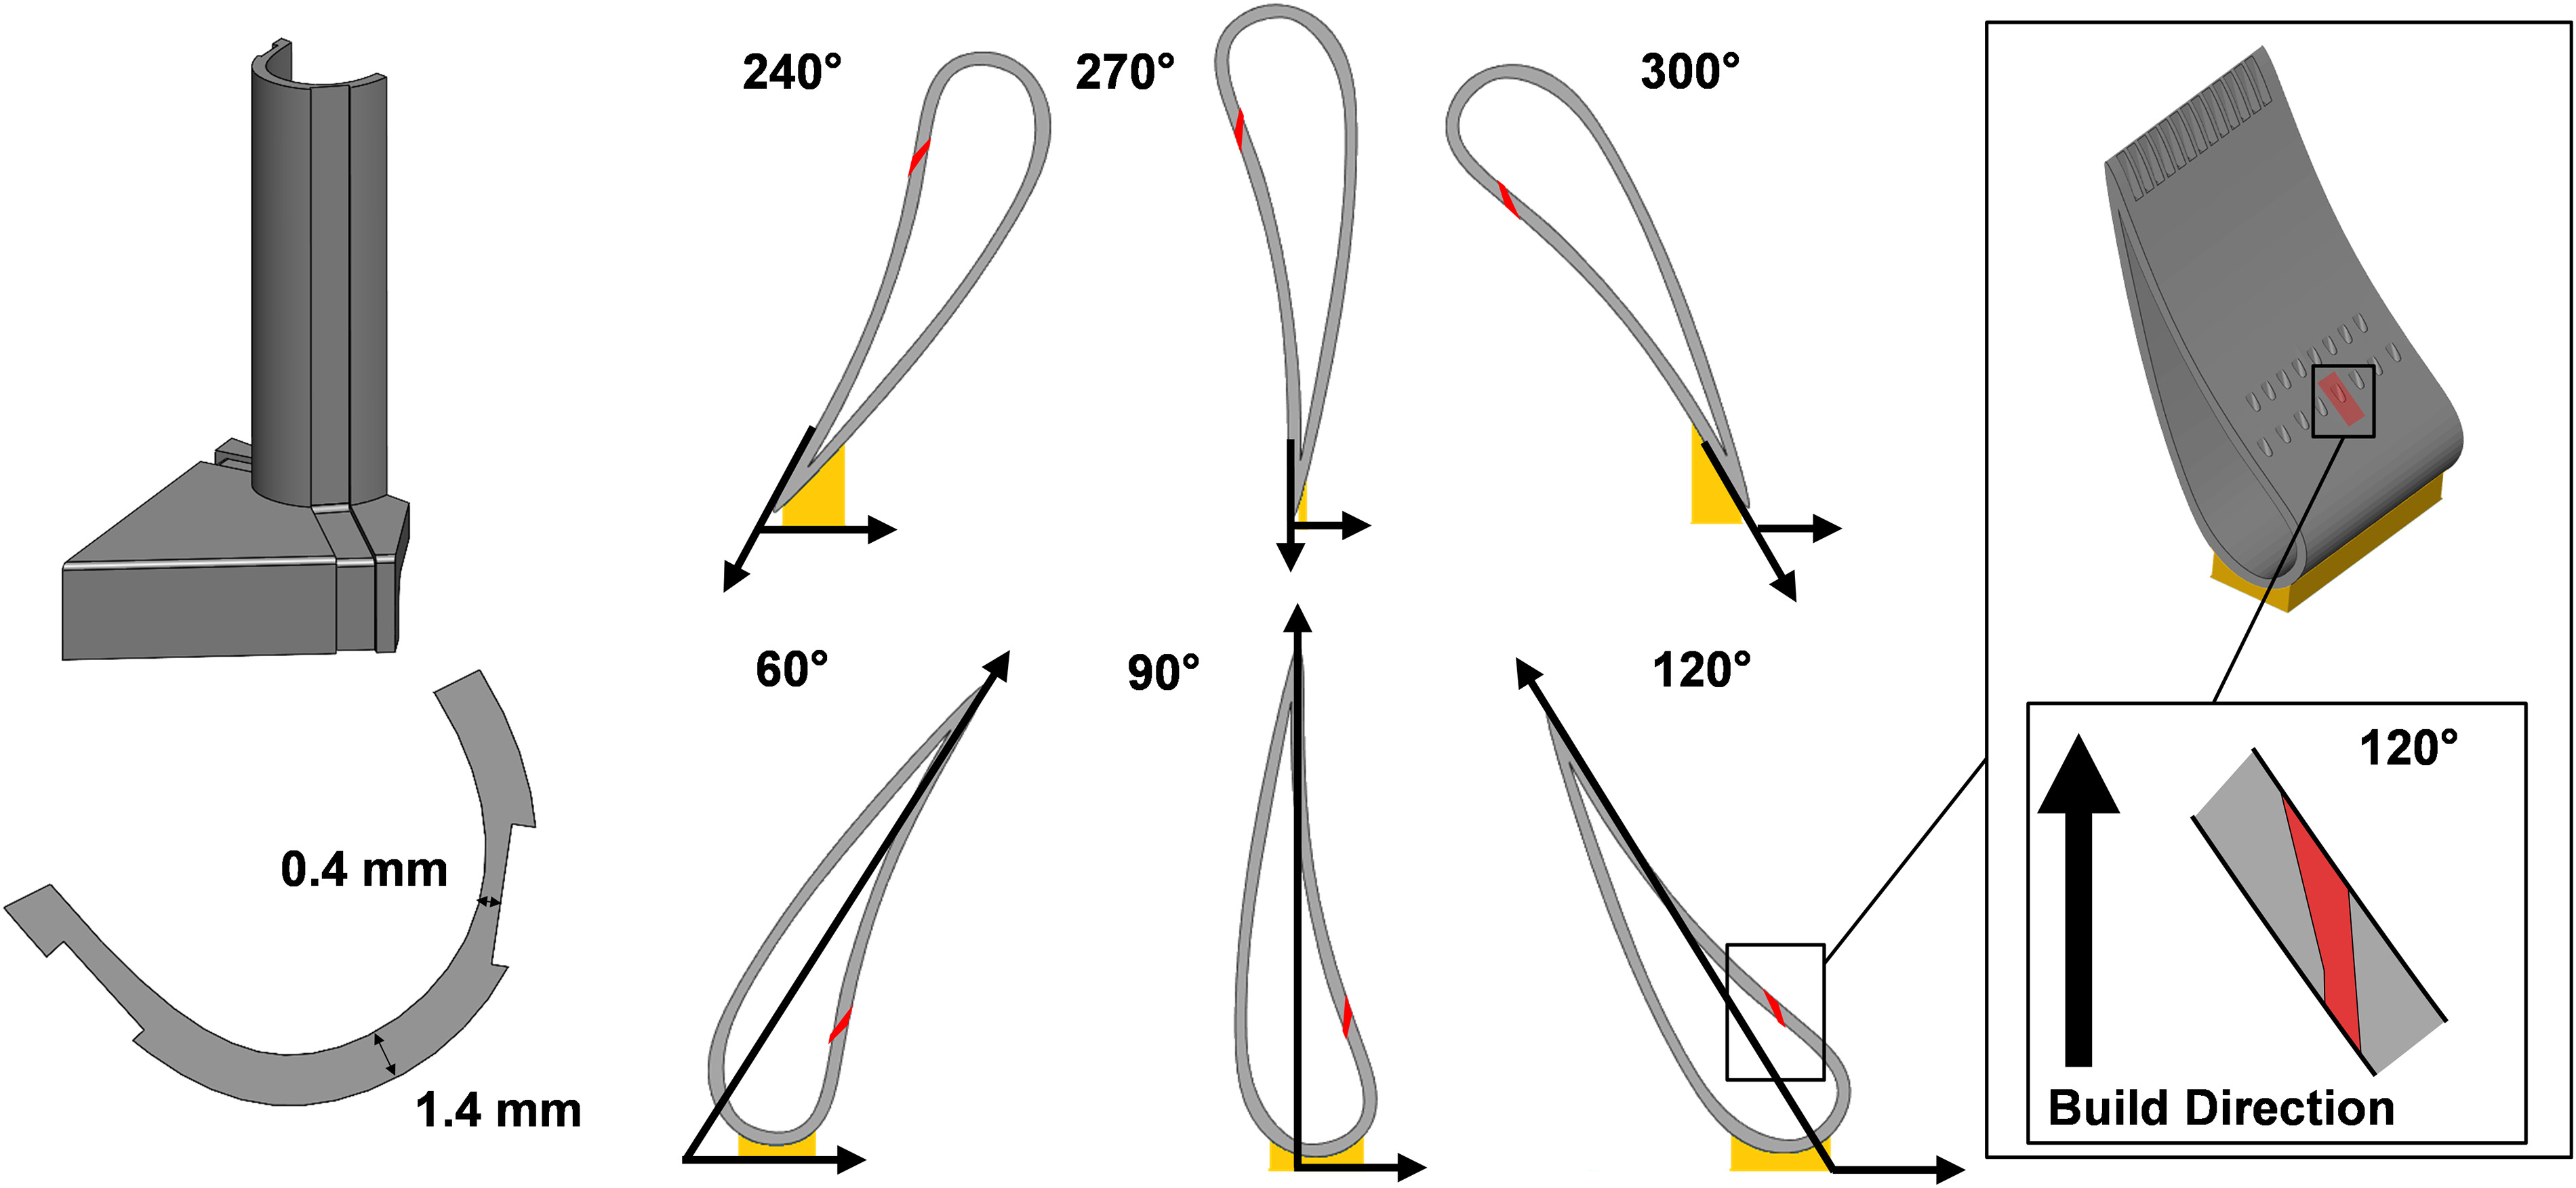
It would be expected that the variations from design intent from part-to-part of cooling channels would be amplified when fabricating the higher complexity of vanes with cooling features. To further understand the effect of part-to-part variation and printability of cooling features in vanes, several coupon sections from Penn State's National Experimental Turbine (NExT) vane (Thole et al., 2021a,b), shown in Figure 7, were fabricated using an EOS M290-1 with a 40 micron layer thickness using standard EOS recommended process parameters. The sample designs in Figure 7 serve as an illustration of the leading-edge vane with variable wall thicknesses (0.4 mm and 1.4 mm) as well as a full vane airfoil with pressure side film cooling holes at different build directions. Wildgoose et al. (2022) showed that wall thickness below 0.6 mm influences the surface roughness as result of instabilities to the melt pool caused by the change in conduction resistance due to the geometry.
Figure 7.
Leading edge NExT vane that were fabricated at different build locations as well as the full NExT vane with highlighted first row film cooling holes fabricated at different build directions (300°, 270°, 240°, 60°, 90°, 120°).
In printing the NExT vanes, the first objective was to evaluate the part-to-part variation of the airfoil shape, specifically the leading edge, while the second objective was to investigate a feasible build direction to resolve cooling features for a cooled AM vane. The focus of this was primarily on the film-cooing features. As seen in Figure 4, the leading edge (LE) portion of the NExT vane airfoil was printed multiple times at two different radial build locations to investigate part-to-part variation of a vane airfoil with no cooling features. Additionally, the mid-span region of a full vane airfoil with internal cooling features including the ribs and film-cooling holes was fabricated at six different build directions. All of the six build directions maintained the same radial build and were placed on the build plate shown in Figure 4.
The LE vane samples included two wall thicknesses to observe this affect for the airfoil. The leading edge of the vane samples was fabricated perpendicular to the build plate resulting in minimal impact of build direction on surface quality due to no downward facing surfaces. The arithmetic mean roughness was evaluated for the interior portion of the LE vane samples for the two different wall thickness as given in Figure 7. Even with the added complexity of the curved vane surface compared to the cooling channels without surface curvature, the arithmetic mean roughness of the LE vanes in Figure 8 follow similar relationships as the channels in Figure 6. For both wall thicknesses, the arithmetic mean roughness is higher for a part this is located further from the laser source. Quantitatively, there was an average 49% increase in surface roughness for the 0.4 mm wall thickness when increasing the radial location from 75 mm to 112.5 mm. There was a 39% increase in arithmetic mean roughness for the 1.4 mm wall thickness when comparing the 1st and 2nd radial build locations. The roughness dependency on position agrees with literature, (Kleszczynski et al., 2020; Subramanian et al., 2021) where the change in roughness is attributed to the laser incidence angle. Following Subramanian et al. (2021), the laser incidence angle is the angle between the vector normal to the surface being sintered to that of the vector from the laser source to the surface.
Figure 8.
Arithmetic mean roughness measured from CT scan data of the different wall thickness and build location of the leading edge NExT vane samples seen in Figure 7.
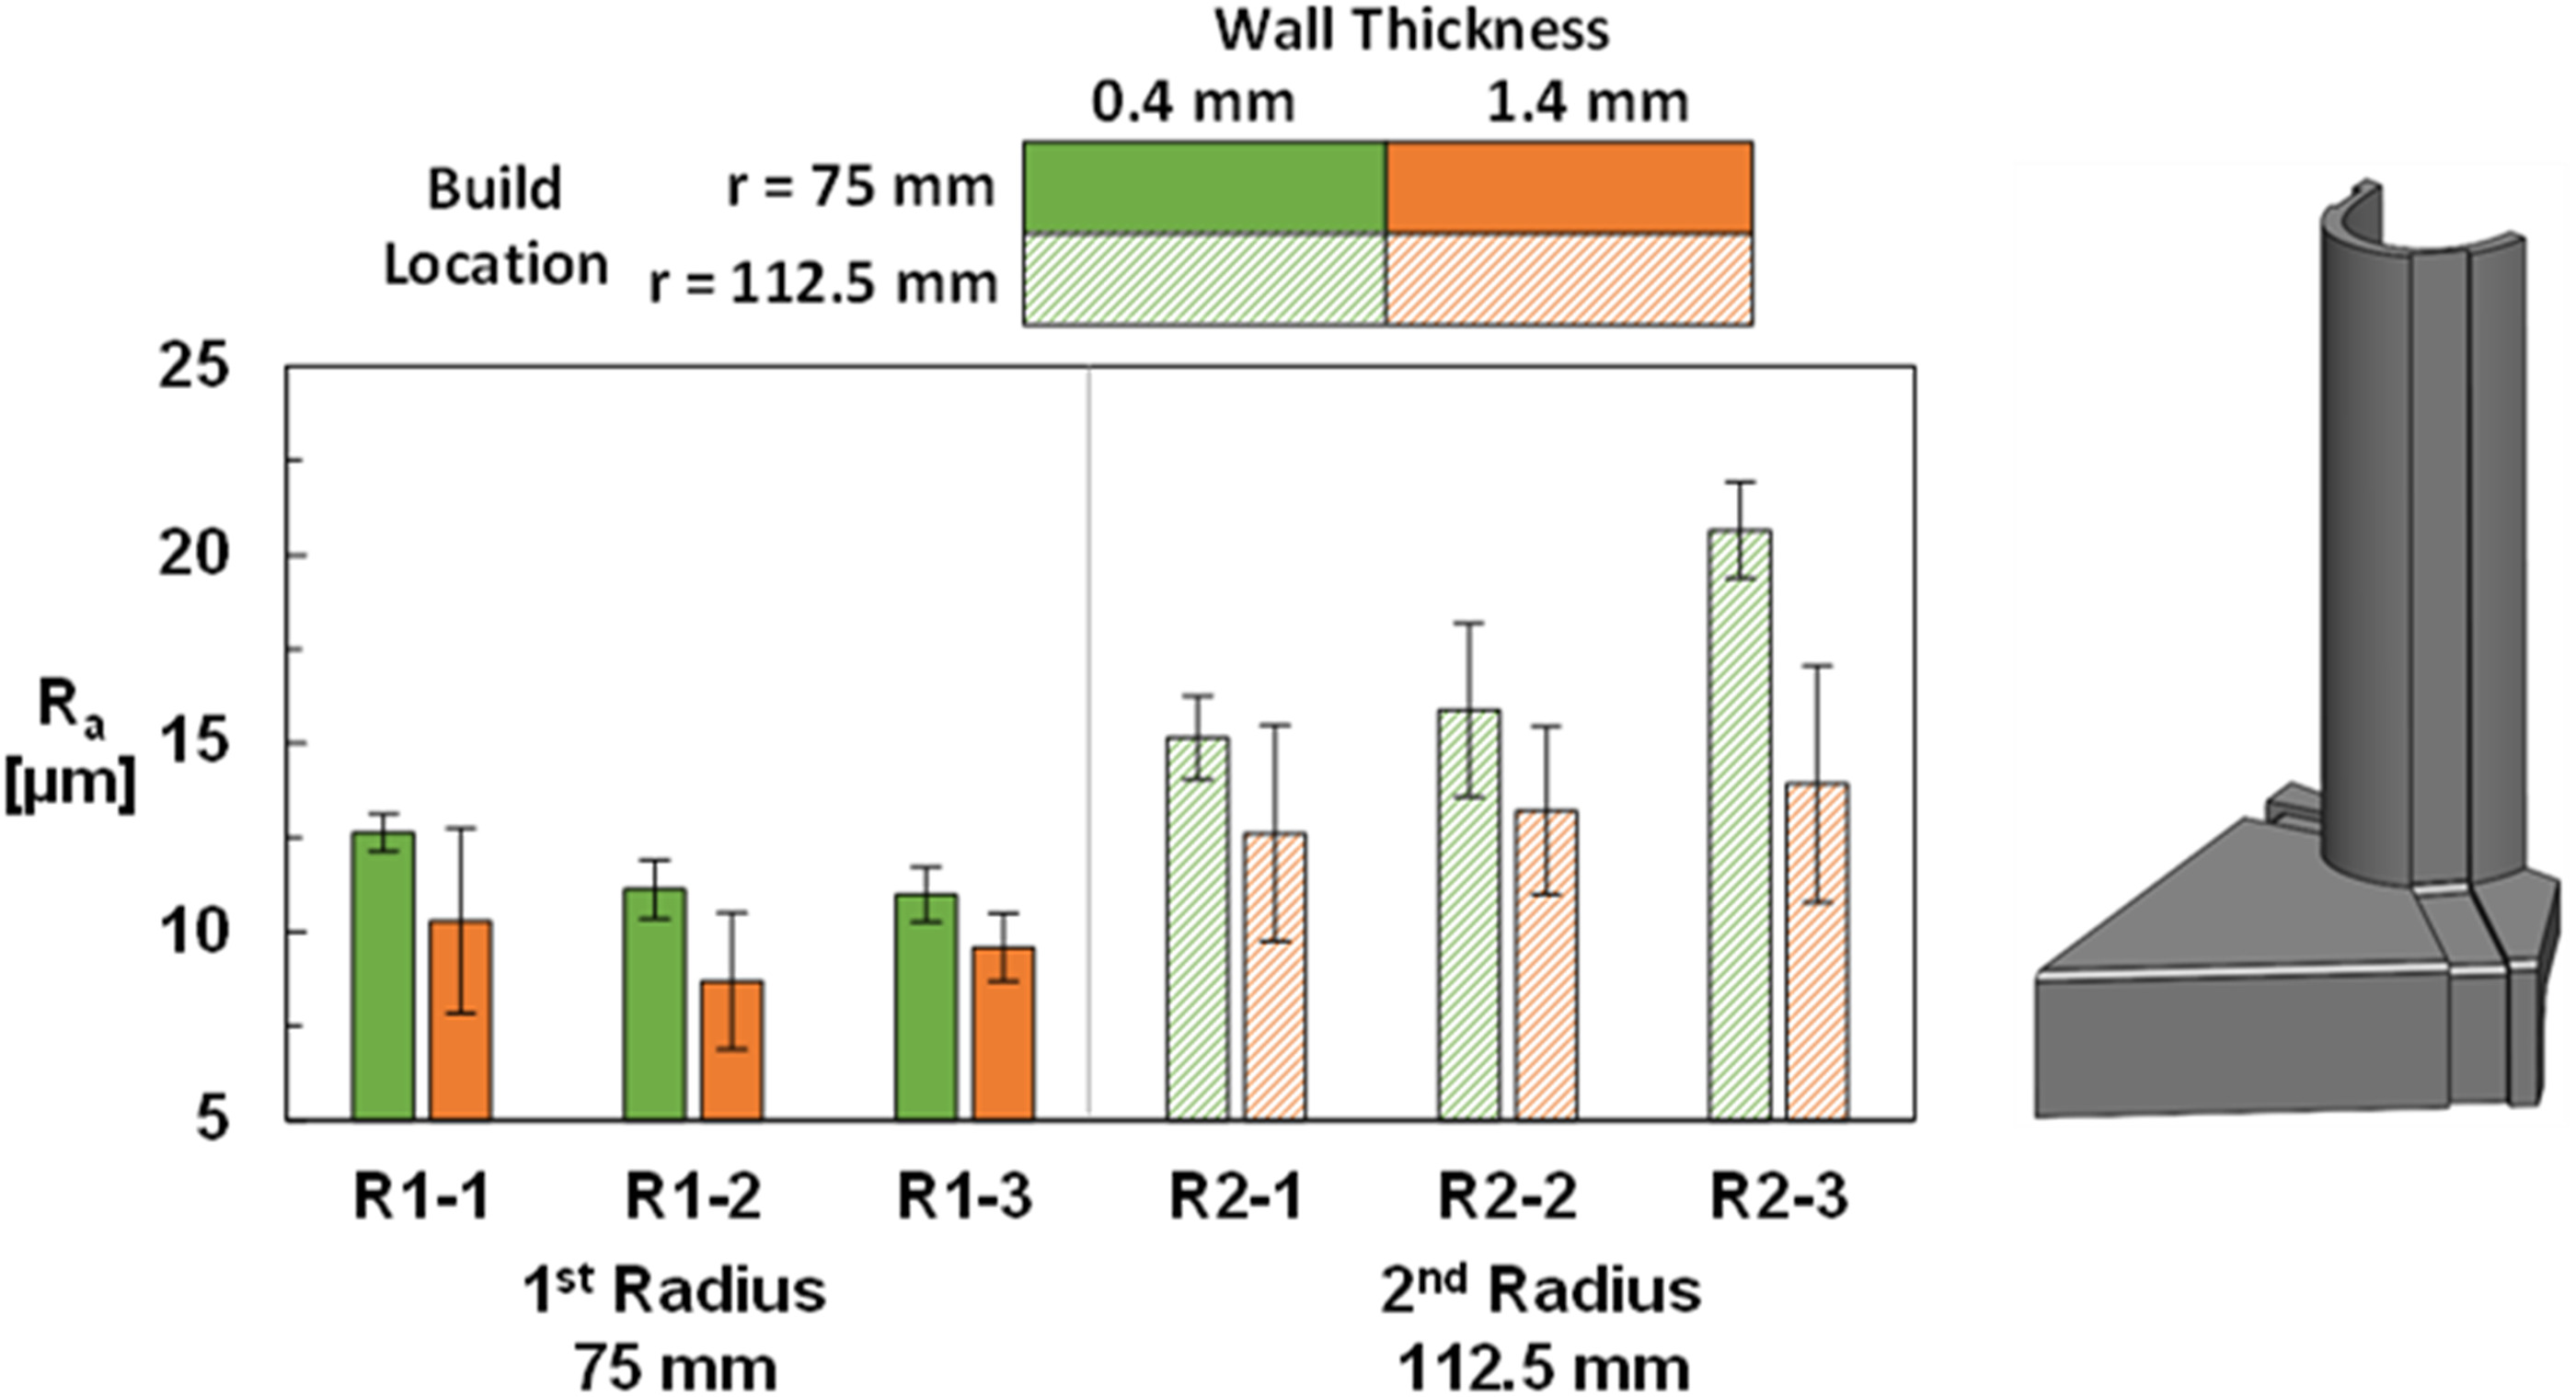
Matching prior results, (Wildgoose et al., 2022), the arithmetic mean roughness for both build locations increased at the lower 0.4 mm wall thickness relative to the 1.4 mm wall thickness. On average, there was a 22% increase in surface roughness from the 1.4 mm to the 0.4 mm wall thickness for the smaller radius while the increase for the larger radius was 30%. The implications of roughness being impacted by wall thickness highlights the potential influence of thin walled features such as the trailing edge of an AM vane or thin walled features of a fin heat exchanger having higher surface roughness relative to other regions of the part.
When investigating the part variability, there is a higher variation in roughness between samples for the larger radius which is consistent with the previously reported results. For a given build location such as the 1st radius, the difference in roughness between the three samples is 14% at the 0.4 mm wall thickness. While the roughness is 17% different for the samples containing a wall thickness of 1.4 mm. The percent difference in roughness between the different wall thicknesses increases the further a sample is from the laser source. The difference in roughness between the three samples for the larger radius (2nd radius) is at 31% for the 0.4 mm wall thickness while it is 48% for the 1.4 mm wall thickness. The results from Figures 5, 6 and 8 infer that regardless of part geometry, there is less variation in surface quality between parts when samples are closer to the laser source.
The ability to fabricate film cooling holes on a turbine airfoil using AM can save significant time and costs since the part would not need to go through an additional post-printing step. The producibility of film cooling holes on vanes was evaluated using the NExT vanes with film cooling holes on the pressure side for different build directions from the build plate. To cover a range of build directions, the vane was fabricated with the leading edge facing upwards (60°, 90°, and 120°) and with the leading edge facing downwards (300°, 270°, and 240°).
The midspan first row film cooling hole on the vane pressure side as seen in the highlighted region in Figure 4 and 7 for the 120° vane was selected for evaluation due to the importance in the ability to resolve the cooling feature because of the high heat load of the pressure side relative to the suction side. For this location, highlighted in the yellow region in Figure 4, the 7-7-7 film-cooling hole was the geometry of choice (Schroeder and Thole, 2022). The meter section diameter of the 7-7-7 hole was 0.53 mm while the thickness of the wall on the airfoil was 1.4 mm. The local surface orientation of the first row film cooling hole on the 120° vane is enlarged in Figure 7. Support structures were used in the internal cavities of the vane to prevent a build failure in the internal cavities of the vane. As opposed to cooled vanes in literature, the 7-7-7 film cooling holes were not scaled for the 40-micron Inconel 718 process.
The CT scans of the vane were fit to the design intent of the vane with cooling features and the deviation from design intent of the evaluated film cooling hole is recorded in Figure 9. Note that positive values of the color bar in Figure 9 indicate the surface was overbuilt meaning material is present when there was no intended material from the design while negative values in the color bar infer the surface was underbuilt. Also accompanied in Figure 9 are labels of the surfaces before the film cooling hole (windward direction) as well as after the film cooling hole (leeward direction).
Figure 9.
CT scans of the mid span first row 7-7-7 film cooling hole at the pressure side of the NExT vane fabricated at six different build directions.
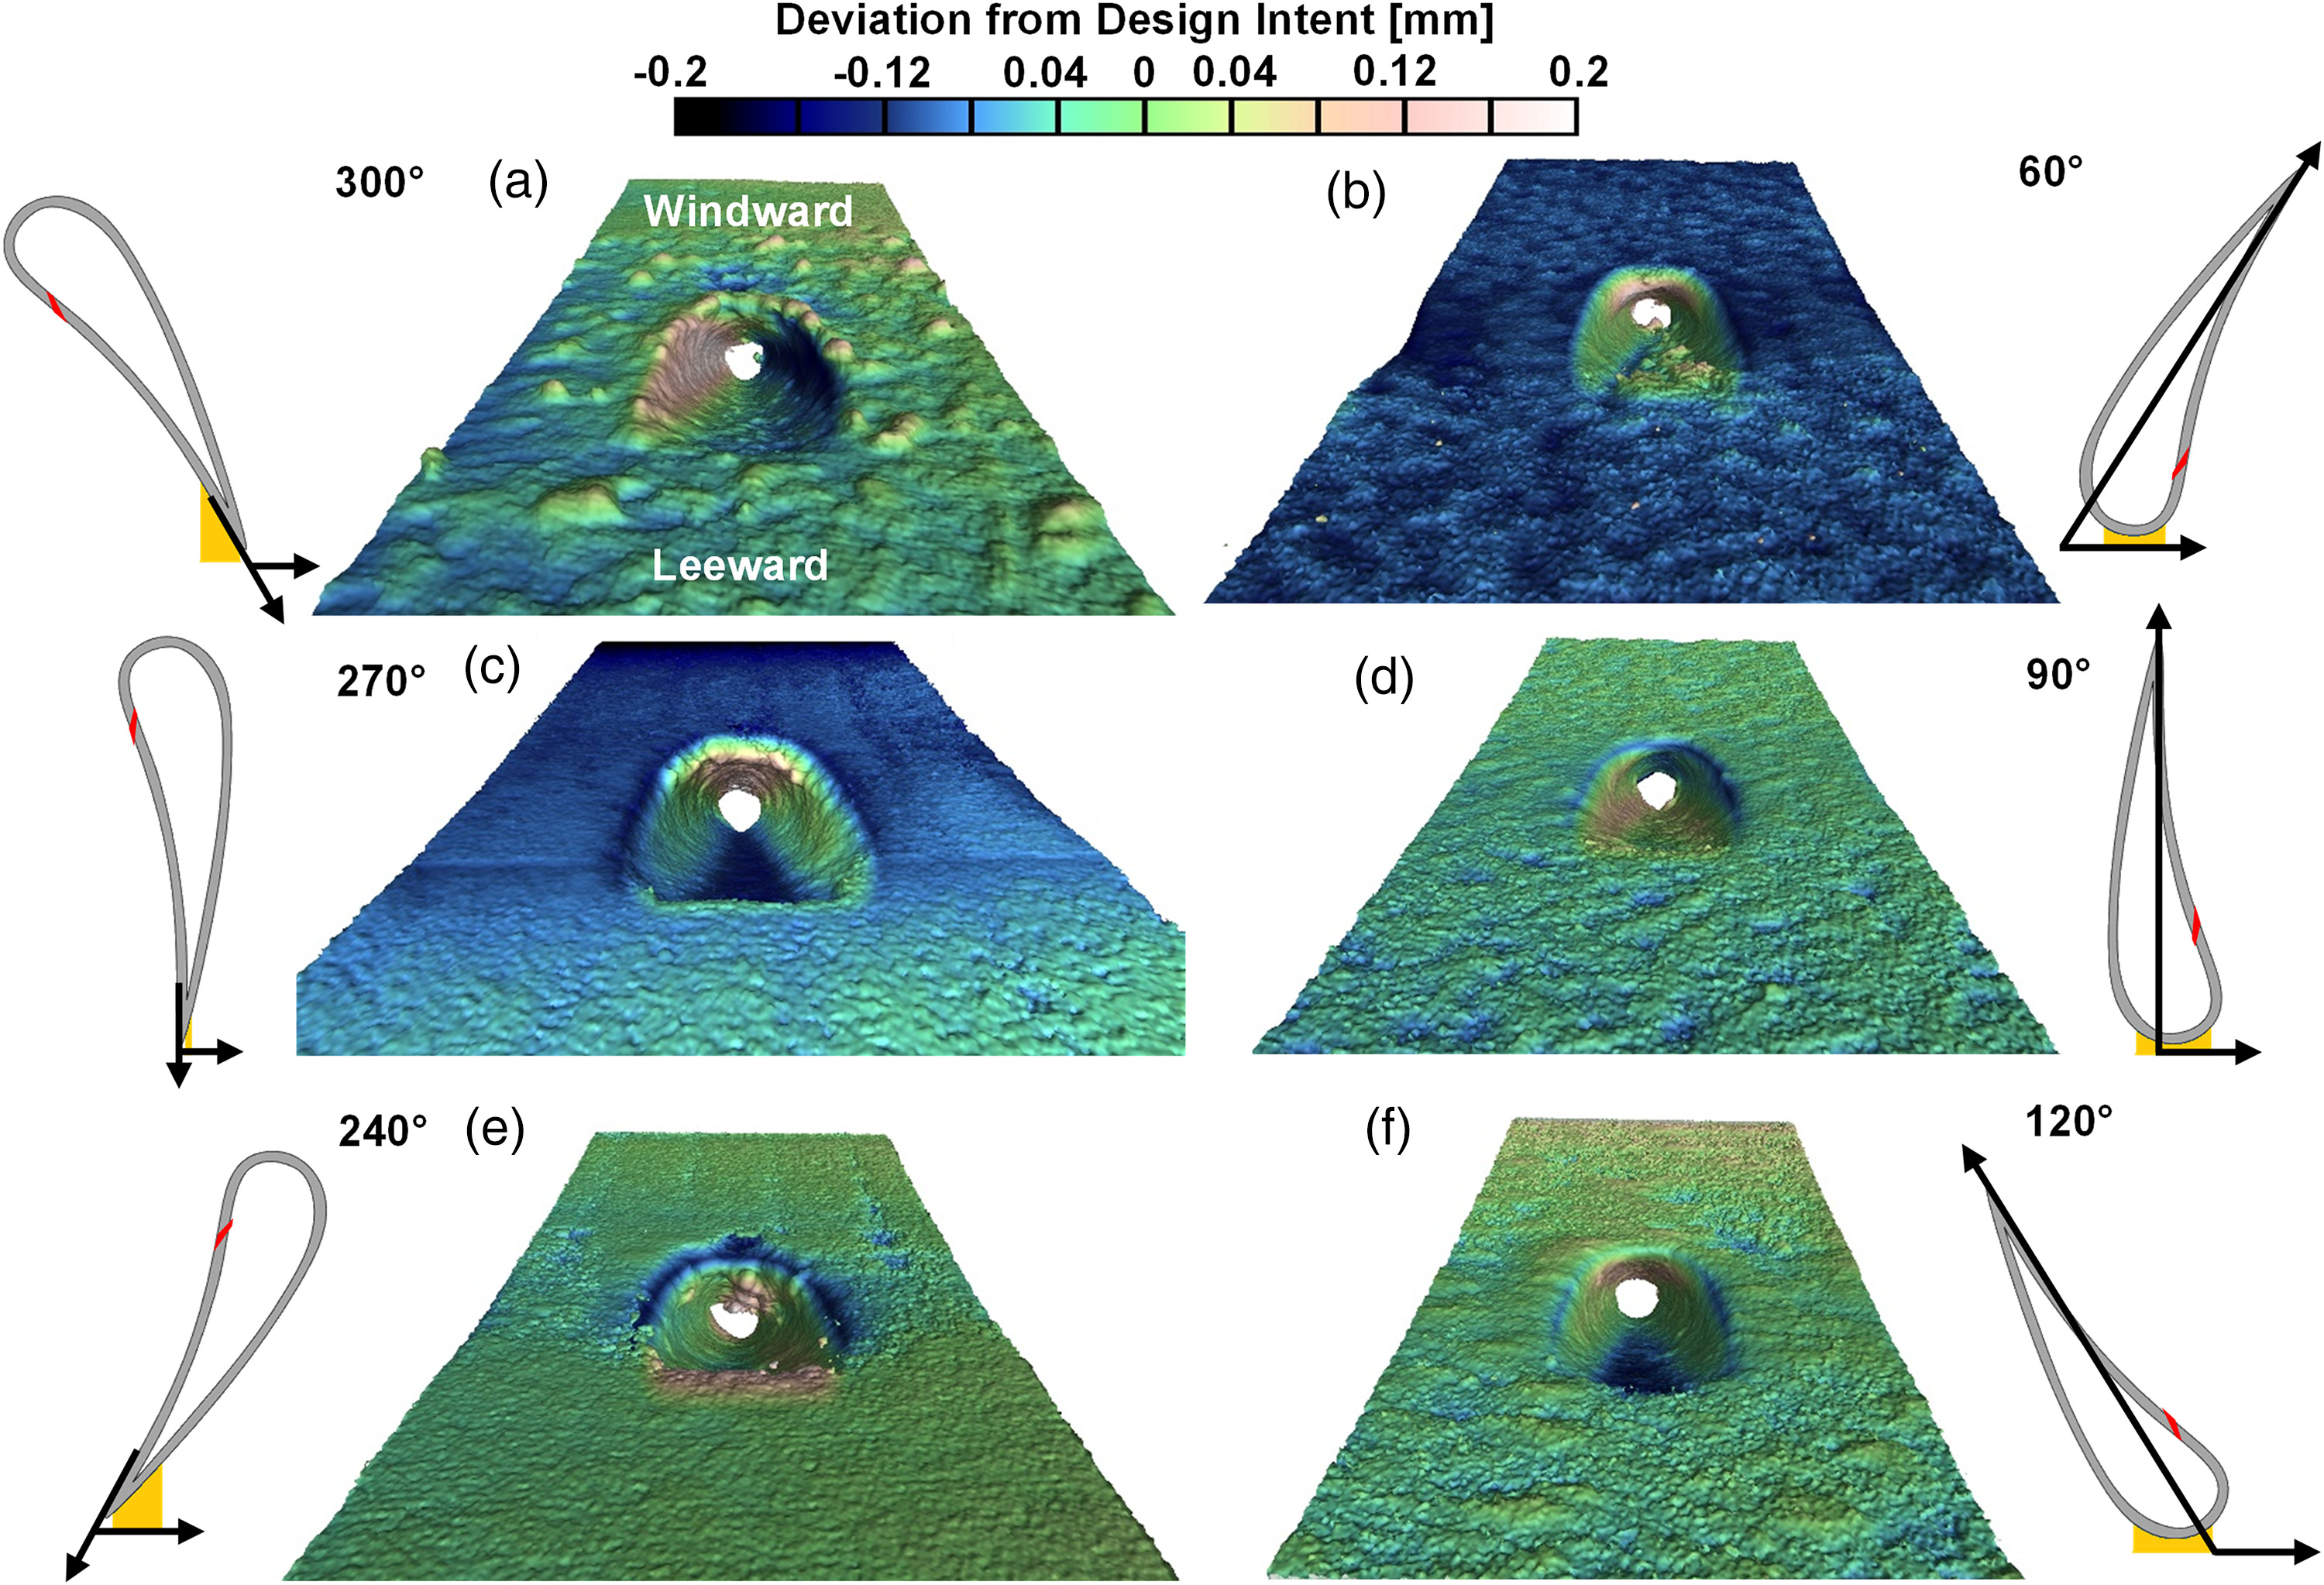
There is a wide range of deviations from design intent and differences in film cooling hole quality for the range of build directions evaluated. Pressure side surfaces that contained downward facing areas such as the 300° and 60° samples, showed the most variability in PS surface quality compared to all other build directions. As seen in the 60° sample, there are differences in the roughness of the pressure side as well as the roughness inside the 7-7-7 film cooling hole as a result of the local surface orientations being different between the hole and PS surface. The in-hole roughness of the 60° and 240° samples are highest compared to all other build directions due to local surface orientations within the holes being built closest to parallel with the build plate. Upon further investigation of the 60° sample, several film cooling holes on the first row were in some cases completely or partially blocked.
In contrast, despite the high surface variability in the 300° sample, the PS surface built closer to the design intent compared to the 60° sample. The surface quality on the PS is worst for the 300° sample compared to all other build directions, most likely due to the 300° sample containing the most severe downward facing surface.
Both the 270° and 90° build directions were able to resolve the entrance of the cooling hole better relative to the 300° and 60° samples. The downward facing windward side of the 270° hole contains more deviations from the design as seen by the different roughness features in Figure 9c. When comparing the printability of the 7-7-7 hole between the 270° and 90° build direction, the 90° contains less surface roughness within the hole since the metering axis of the cooling hole was greater than 45°. However as seen in Figure 6c and d, the entrance region of the hole differs from the circular design intent. There are also significant roughness features at the leeward side of the 240° sample, seen in Figure 9e, since the metering section axis was built less than 45° from the build plate.
The build direction that best resolved the film cooling hole and printed closest to the design intent was the 120° sample, as seen in Figure 9f, compared to all other build directions. Not only did the entrance of the film cooling hole print closest to the circular design intent but the PS surface contained minimal amounts of surface roughness relative to the other samples. In addition, both the leeward and windward sides of the film cooling hole were resolved and showed similar surface variations. Furthermore, there was no observable blockage in any of the other first row film cooling holes of the 120° sample.
Pressure loss and heat transfer resulting from build plate location
The AM process not only affects part quality and tolerances, but for cooling applications convective heat transfer and pressure loss are impacted. There has been extensive work in literature, summarized by Thole et al. (2021a,b), to show the impact of the surface roughness from AM on the heat transfer and pressure loss of cooling schemes. Effects of AM build parameters such as build direction can cause as much as a 78% difference in friction factor as seen in the work by Wildgoose et al. (2021) and Stimpson et al. (2016a). Apart from the work of Kirsch et al. (2017) few studies have investigated part-to-part differences in cooling performance of channels. Kirsch et al. (2017) found that different materials can cause friction factor to vary by as much as three times between samples that share the same design intent. When investigating the difference in cooling performance from part-to-part in other studies, the work of Stimpson et al. (2016a) stated that there was minimal difference in friction factor or Nusselt number between three test samples, however no statistical quantity was mentioned.
Experimental pressure loss and heat transfer test were performed on the cooling channel samples in Figure 4 to bring insight into the amount of variation in cooling performance between samples for each of the different locations on the build plate. Augmentations relative to smooth channels were calculated using the well-known Colebrook (Zigrang and Sylvester, 1985) correlation for the friction factor and Gnielinski (1976) correlation for heat transfer.
The results in Figure 10 indicate that the friction factor augmentation increases as the samples are built further from the laser source. For a given fully turbulent Reynolds number, such as 20,000 as seen in Figure 10b, there is on average a 9% increase in friction factor from the 75 mm radial build location to the 112.5 mm build location. There is not only an increase in friction factor when changing build locations but the difference in friction factors between samples at a given location increases the further a sample is from the laser source. More specifically, there is a 11% difference in friction factor between data at a Reynolds number of 20,000 for the 75 mm radial build location. The friction factor difference between samples increases to a 20% difference for samples built at the 112.5 mm build location. Similarly at a Reynolds number of 30,000, as seen in Figure 10b, the friction factor difference between data points is 10% at the 75 mm radial build location while there is an 18% difference for samples built at the 112.5 mm radial build location.
Figure 10.
Friction factor augmentation of square cooling channel samples across various Reynolds numbers (a) as well as friction factor augmentation of the channels at a Reynolds number of 20,000 and 30,000 (b).
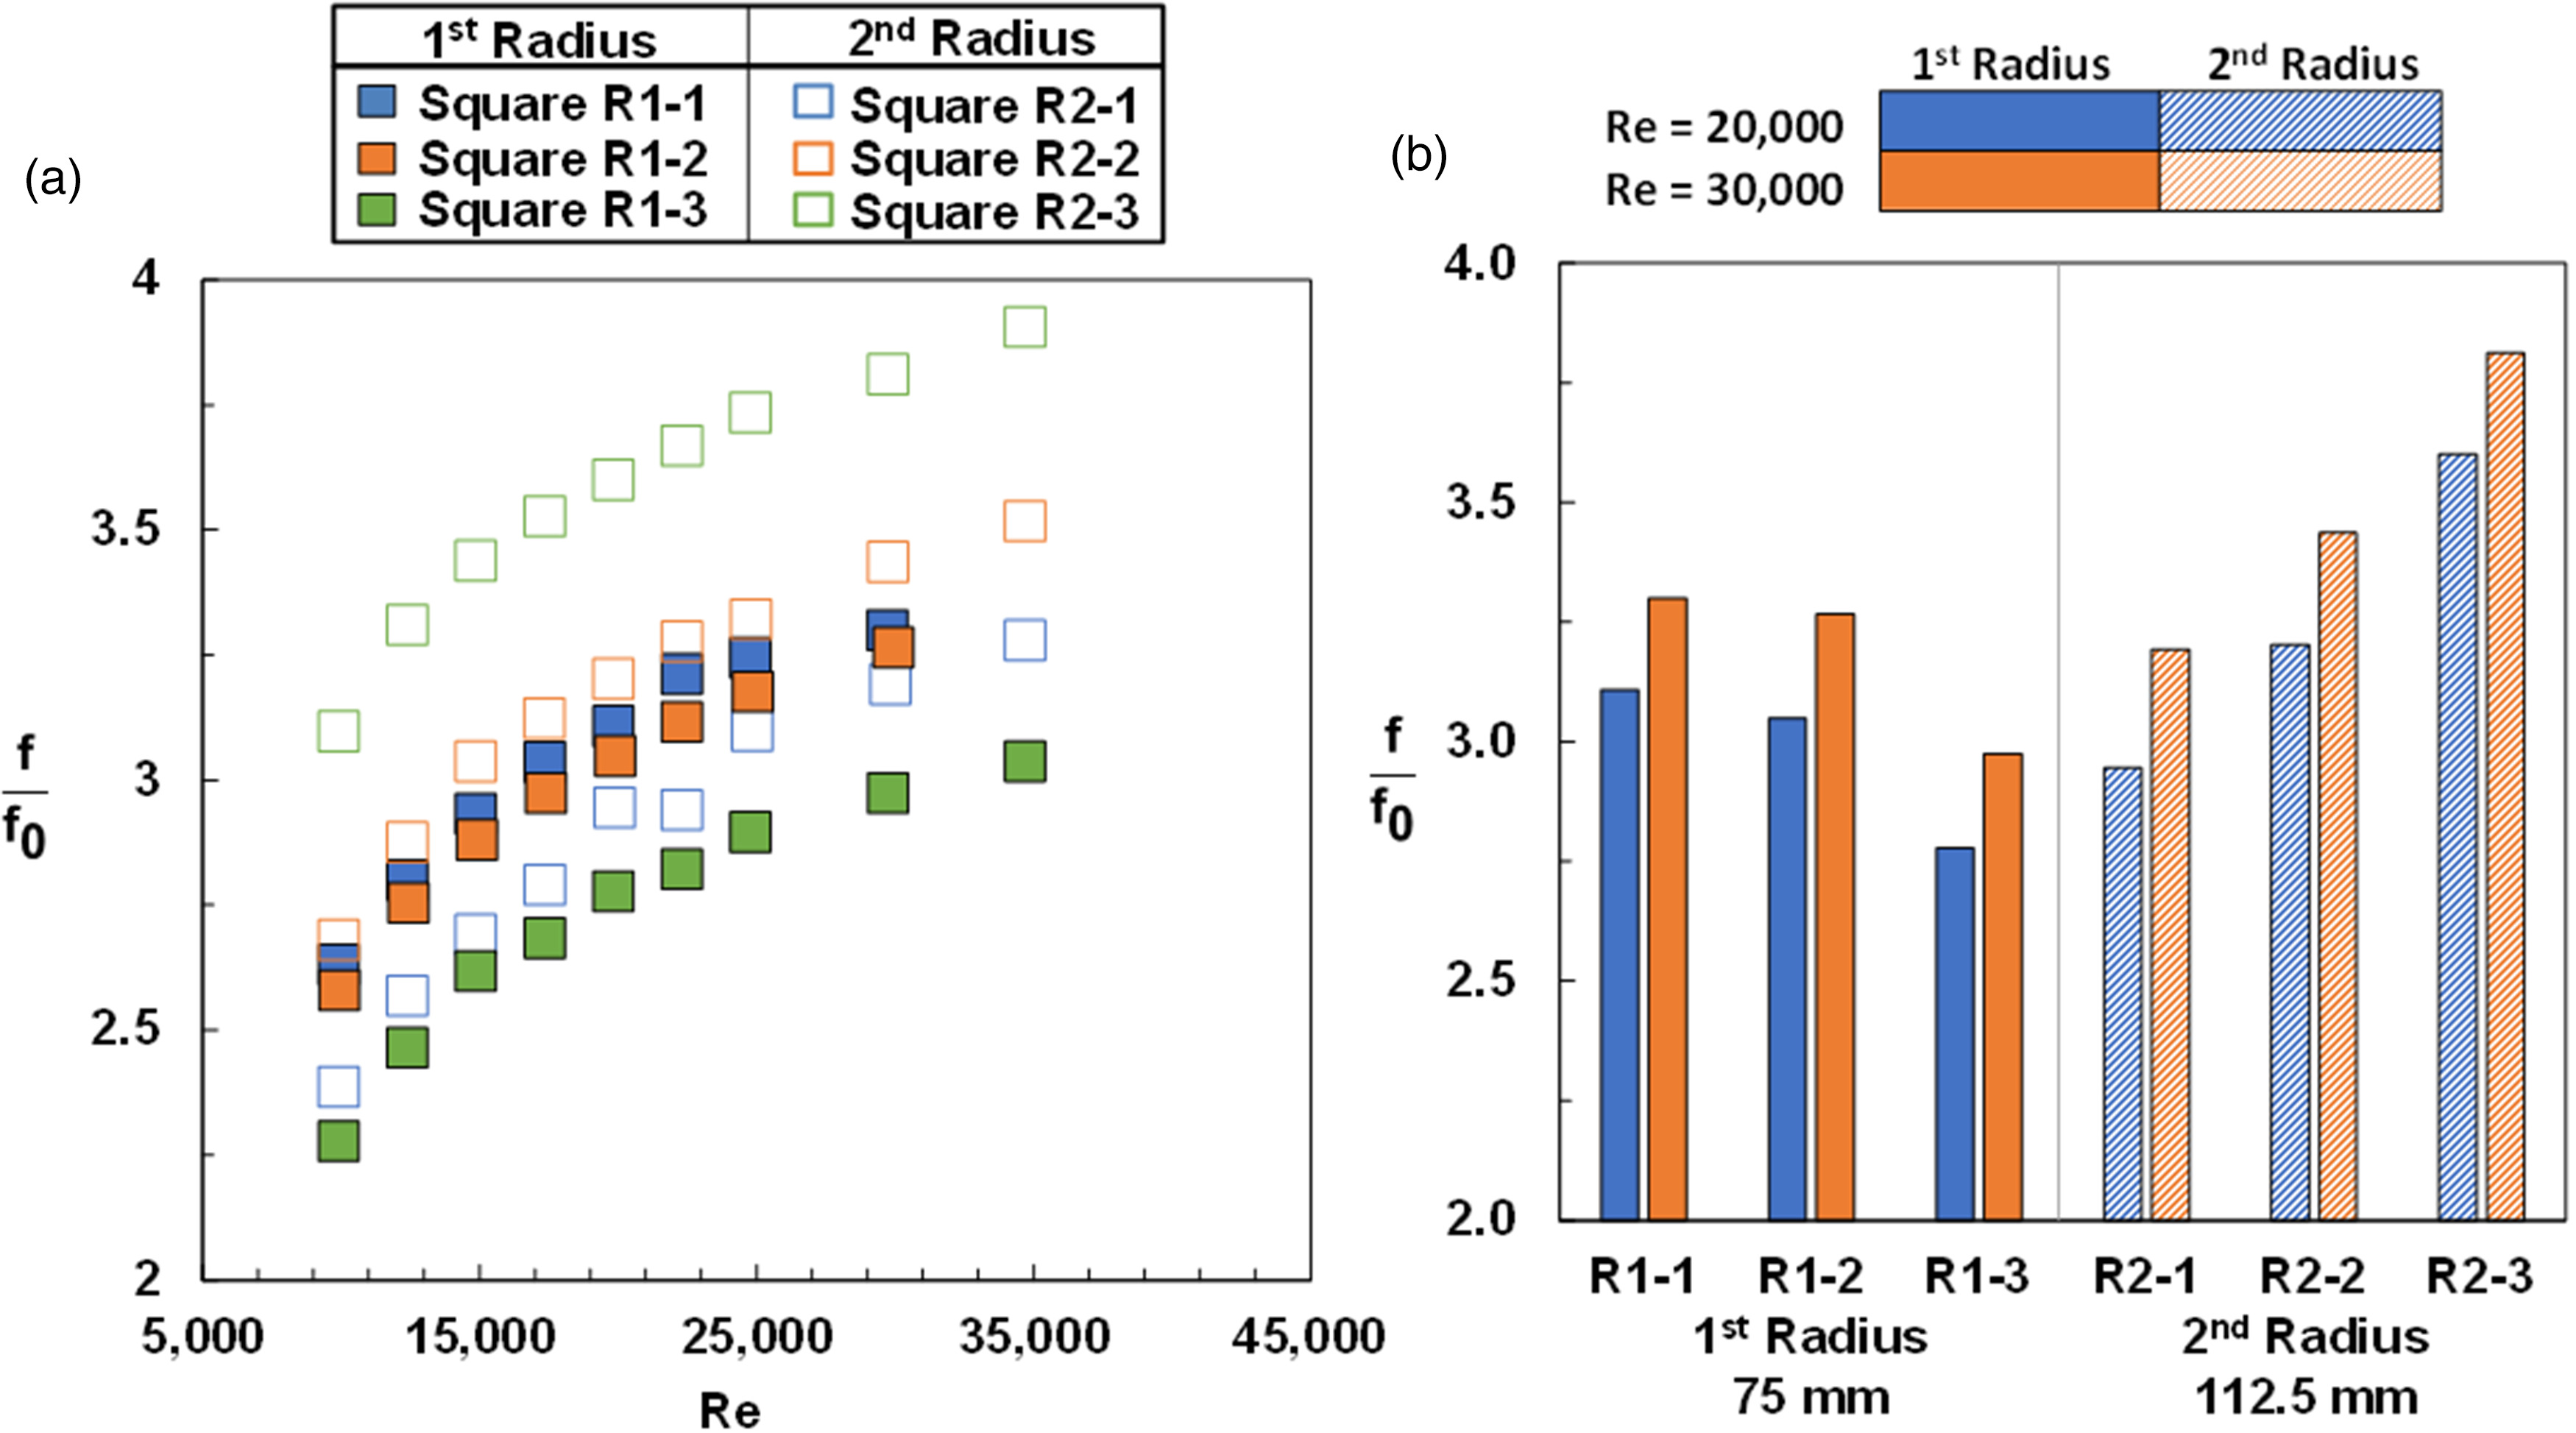
Despite being built at the 2nd radius, the R2-1 sample shows a lower friction factor relative to the R1-1 and R1-2 sample in Figure 10. This result emphasizes that there can be a range of friction factor observed even when samples share the radial build location and design intent. Overall, there is a 26% difference in friction factor between all the samples on the build plate at a Reynolds number of 20,000 and a 27% difference in friction factor between all the samples on the build plate at a Reynolds number of 30,000. As a result, there can be a wide variation in pressure loss between channels in complicated multi-channel cooling schemes that cover a large area on a build plate.
In addition to evaluating friction factor, the same experimental test rig measured bulk convection coefficients for the samples in Figure 10 in order to calculate a bulk Nusselt number using several heaters and thermocouples. Nusselt number was calculated using the hydraulic diameter measured from CT scans. Further detail regarding the specific convection heat transfer measurement technique is reported in Stimpson et al. (2016b). Nusselt number in Figure 11 is nondimensionalized by the Nusselt number of a hydraulically smooth channel, which was calculating using the Gnielinski's correlation using the friction factor from the Colebrook correlation with a sandgrain roughness of zero. Following the propagation of uncertainty analysis specified by Figliola and Beasley (2005) the uncertainty for Nusselt number was less than 7% across the range of Reynolds numbers evaluated.
Figure 11.
Nusselt number augmentation of square cooling channel samples across various Reynolds numbers (a) as well as Nusselt number augmentation of the channels at a Reynolds number of 20,000 and 30,000 (b).
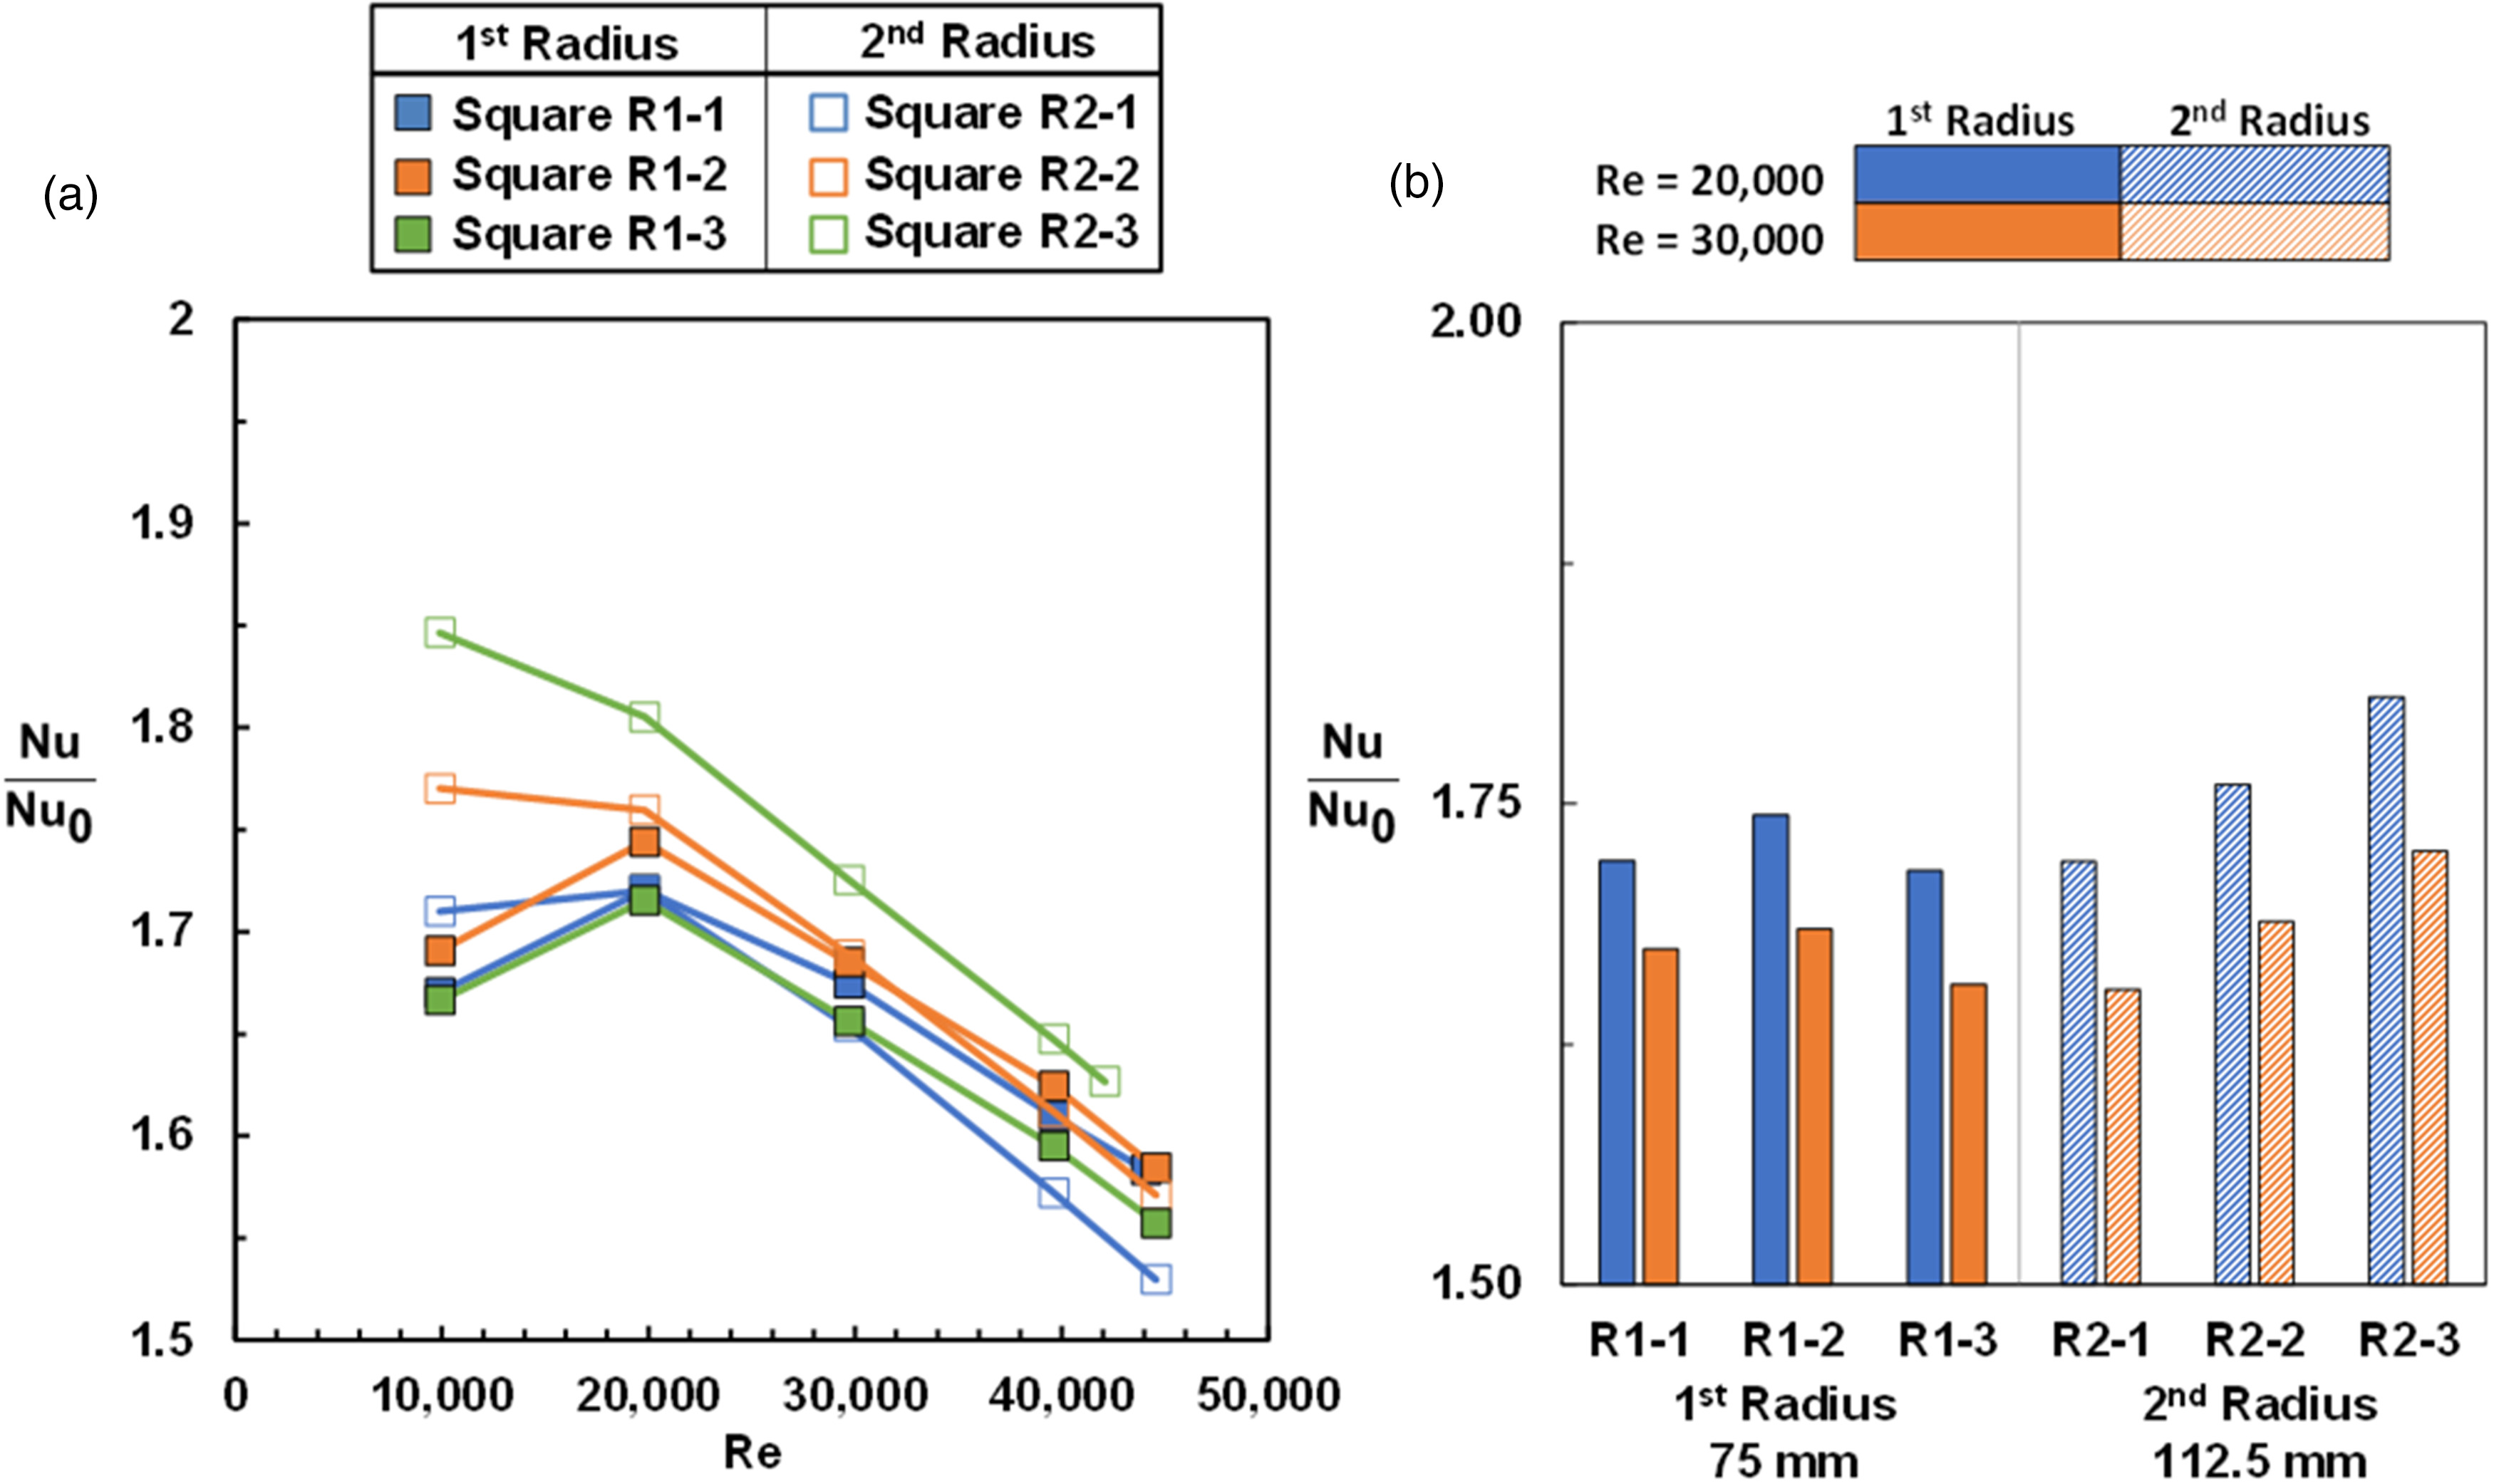
Comparable to the friction factor results, there can be a range of Nusselt numbers between samples on a build plate as seen in the 5% difference in Nusselt number between all the samples at Reynolds number of 20,000 as seen in Figure 11. The Nusselt number is on average 2% higher for samples at the 2nd radial build location relative to samples at the 1st radial build location. There is more variation in Nusselt number for samples built further from the laser source which is similar to: the friction factor, variation in hydraulic diameter, and area average arithmetic mean roughness results. The amount of difference in Nusselt number between samples doubled when going from the 1st radius to the 2nd radius for the two Reynolds numbers in Figure 11b. The spread in friction factor and Nusselt number of the 2nd radius samples is significant enough that some samples such as the R2-1, have friction factor and Nusselt number values that are equal to some of the 1st radius samples. When comparing the spread in friction factor values to Nusselt number values the relationships between samples are similar to Kirsch et al. (2017), where there is a greater spread in the value of friction factor relative to Nusselt number for all the samples on the build plate. Quantitively, there is a 26% difference in friction factor while there is a 5% difference in Nusselt number for all the samples on the build plate.
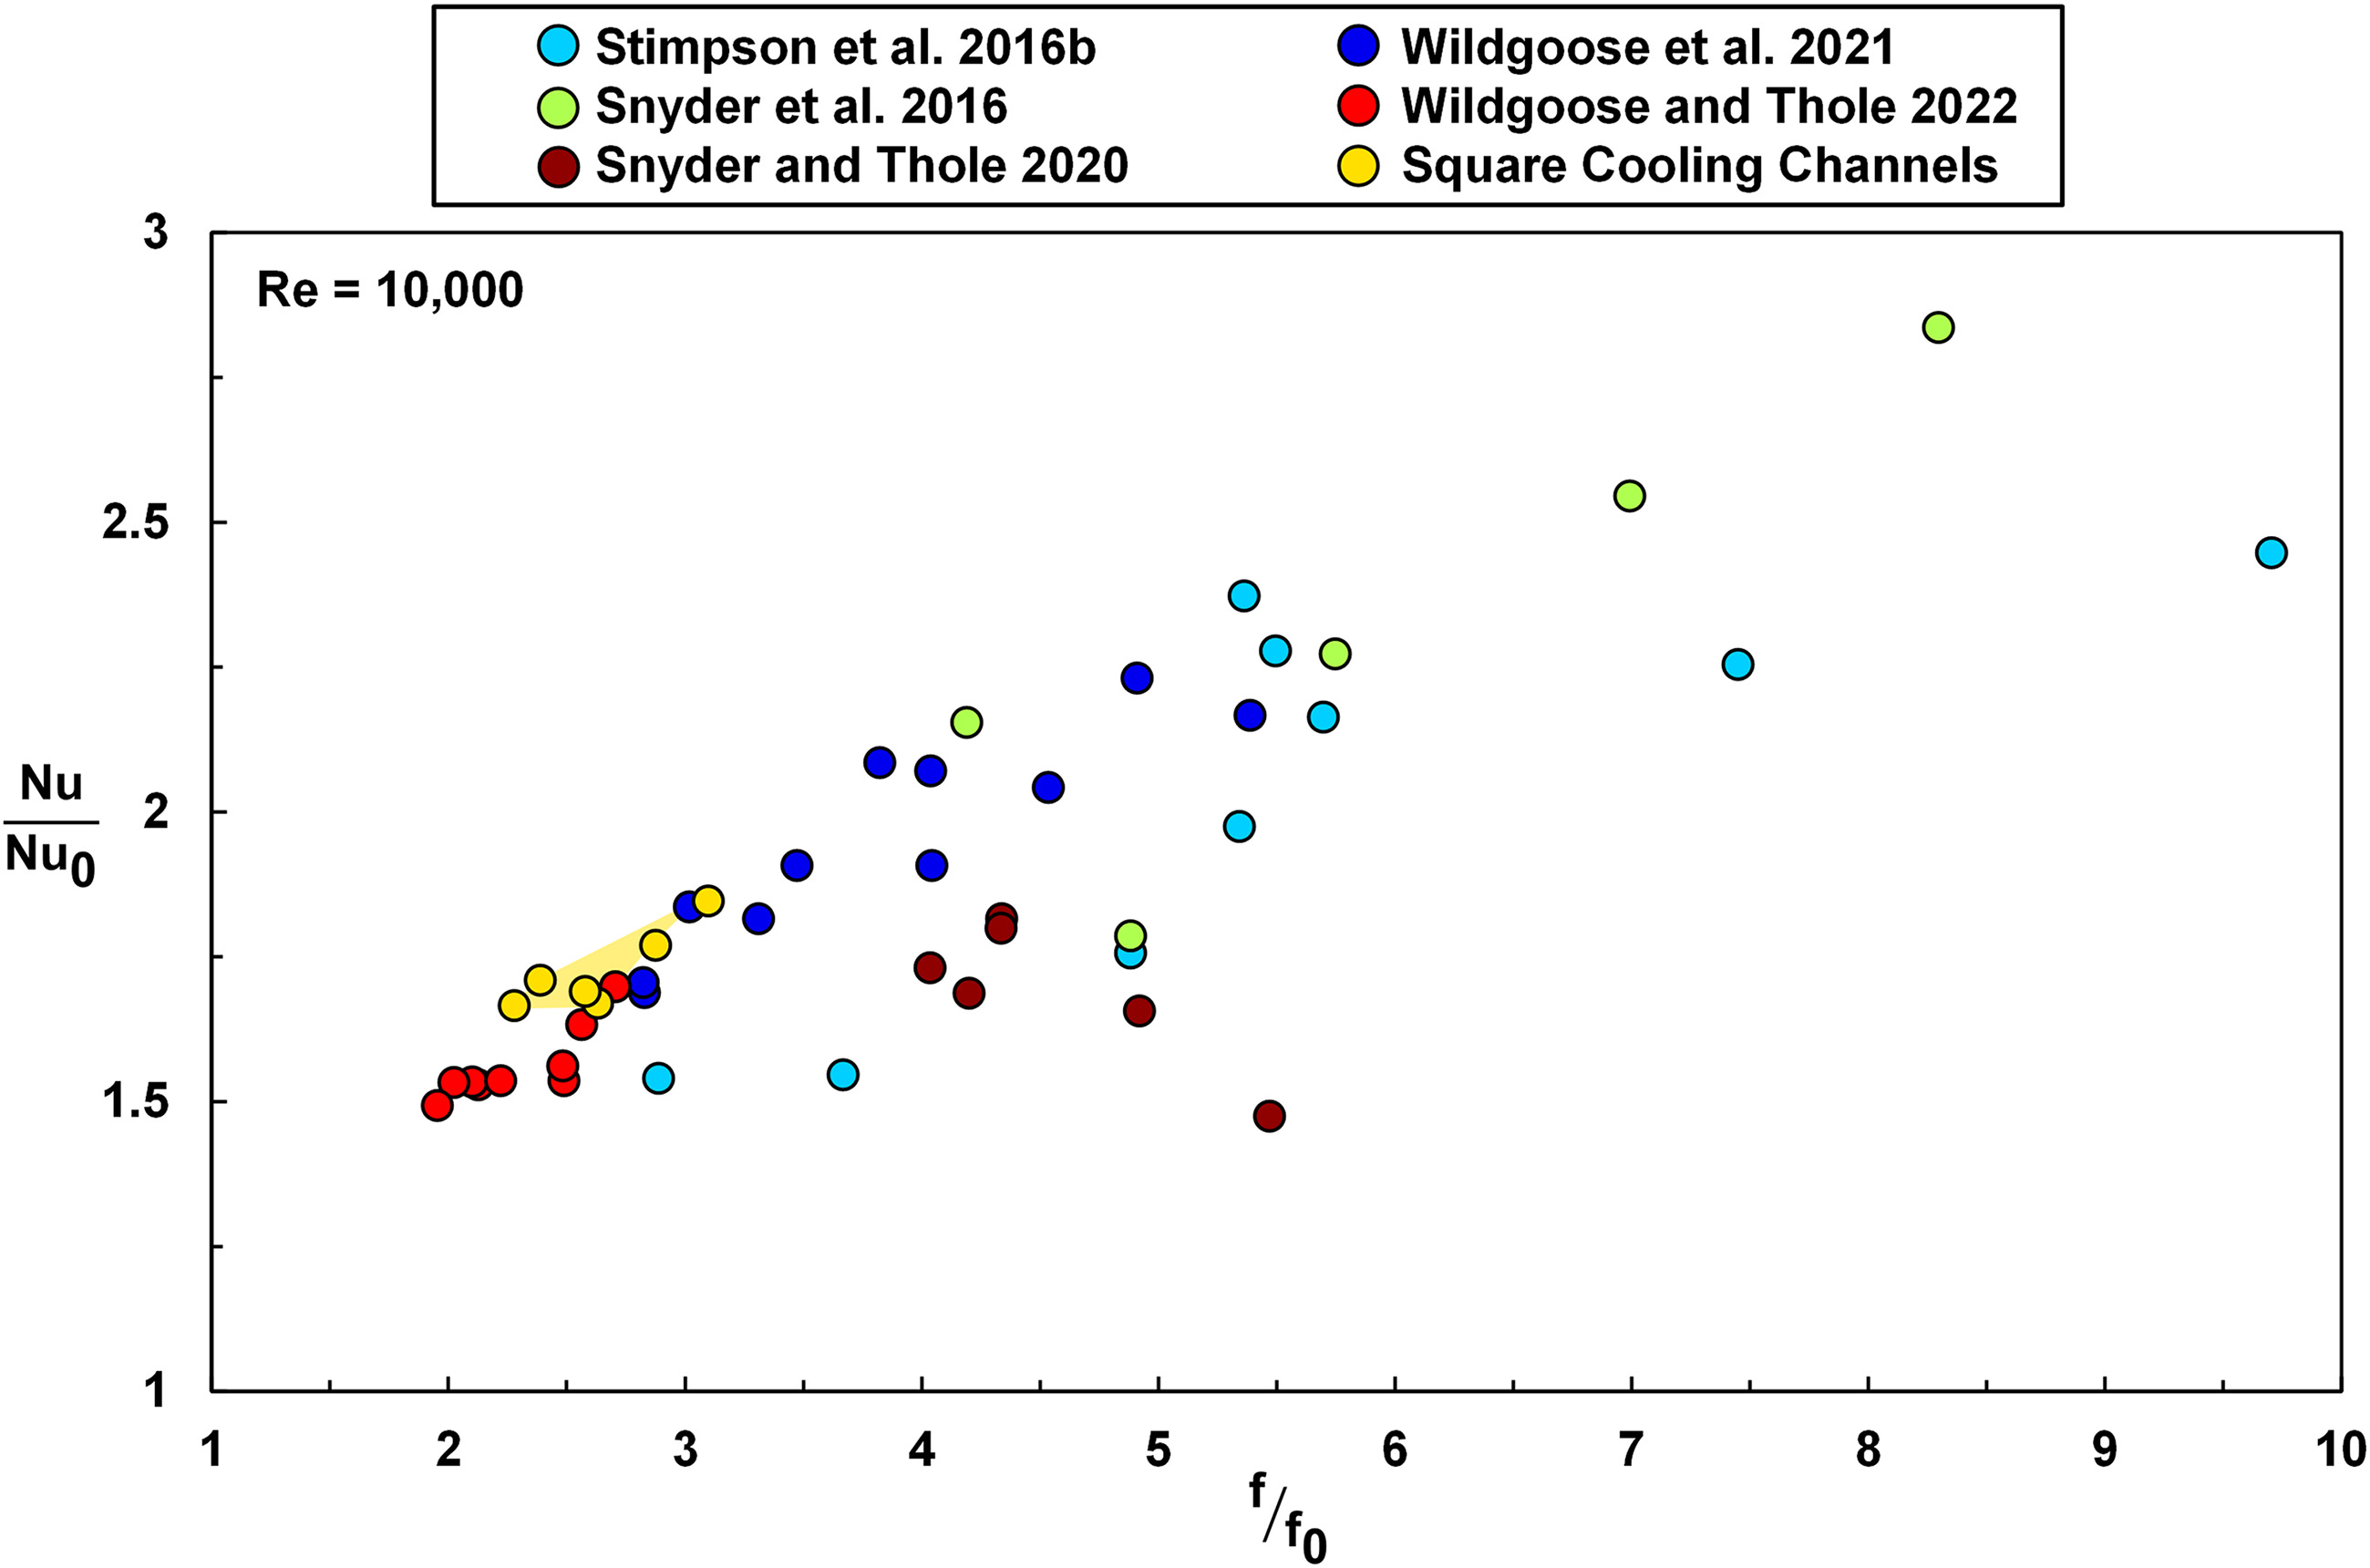
In an effort to compare the repeatability in cooling performance of the square cooling channels to AM channel literature, Figure 12 highlights the distribution in friction factor augmentation and Nusselt argumentation of the square cooling channels relative to several AM channels from literature at a Reynolds number of 10,000. The samples from literature include: square and rectangular samples built at different sizes (Stimpson et al., 2016b), circular channels built at different build directions (Snyder et al., 2016; Wildgoose et al., 2021), rectangular channels made with varying laser processing parameters (Snyder and Thole, 2020), and samples with different cross-sectional shapes (Wildgoose and Thole, 2022). It is important to note that the square cooling channels in Figure 12 are the only samples which all share the same design intent and build direction for evaluating part-to-part variation on the build plate. The square cooling channels from Figure 4 are shown with a yellow area giving importance to the amount of variation in friction factor and Nusselt number on a build plate for a shared channel design. For a given Reynolds number there is more variation in friction factor compared to Nusselt number for the square cooling channels, as seen by the shape of the highlighted yellow area in Figure 12. In more detail, there is a 30% difference in friction factor augmentation for the square cooling channels relative to a 10% difference in Nusselt number augmentation. The part-to-part differences in cooling performance of the square cooling channels emulates the possible differences in cooling performance for the samples in public literature.
Conclusion
There can be significant variability in geometry and surface quality for components that have been additively manufactured as result of the complex interaction between the laser and powder in the additive manufacturing process. The metal additive process enables the rapid prototyping and testing of turbine components. The reproducibility of a part is imperative for turbine components to guarantee expected part temperature and flow properties. The better understanding and development of AM process parameters over the years has improved the producibility and minimized blockages of internal and external vane cooling features such as film cooling holes and micro-sized channels. Even with the improved sets of process parameters over the years, hole blockages, particularly in engine scale film cooling holes are still present depending upon the hole orientation.
This paper has also explored the variability in geometry and part quality of engine scale cooled vanes as well as the variability in heat transfer and pressure loss from part-to-part of simple cooling channels. To assess variability in cooling channel designs, several cooling channel coupons were fabricated multiple times at two different build plate locations. The hydraulic diameter of the cooling channels was found to varied minimally between samples even at different build locations. In contrast, the standard deviation of hydraulic diameter increased the further the part was built from the laser source. Similar to the variation in diameter, the internal surface roughness of the square cooling channels increased the further the part was built from the laser source.
Experimental friction factor and Nusselt number tests were measured for the cooling channels printed multiple times on a build plate. Both the magnitude and differences in friction factor and Nusselt number between parts increased the further the samples were built from the laser source.
Turbine relevant geometries such as the leading edge portion of a vane airfoil was fabricated at the same build locations and multiple times as the cooling coupons. The leading edge samples also contained variable wall thicknesses that resulted in a higher surface roughness for surfaces built with a thin wall compared to surfaces built with a thicker wall. The surface roughness magnitude and variation in roughness of the leading edge vane samples increased the further the sample was from the laser source.
Full vane airfoils with internal and external cooling features were fabricated across multiple different build directions to investigate the printability of the pressure side film cooling holes as well as surface quality. Certain build directions such as orientating the leading edge of a vane 120° from the top of a build plate produced film cooling holes closest to their design intent while also producing the lowest variability in pressure side surface quality. The print quality of the overall component and its cooling features depends upon the local surface orientation of the features and airfoil.
Examining the variability in geometry and cooling performance of additively manufactured vanes and cooling channels provides insight and foundational development to enabling rapid prototyping and testing of AM turbine components. Positional effects on the build plate and local surface orientations within a part contribute to the printability and geometric variability of AM components.
Nomenclature
A
cross-sectional flow area
As
surface area
Dh
hydraulic diameter, 4A/p
f
friction factor,
h
convective heat transfer coefficient,
L
channel length
P
static pressure
kair
thermal conductivity of air
Nu
Nusselt number, hDh/kair
p
channel perimeter
Qin,heater
heat from heaters
Qloss
conduction loss
Ra
arithmetic mean roughness,
Re
Reynolds number, uDh/ν
Tinlet
inlet temperature
Toutlet
outlet temperature
Ts
channel surface temperature
Tlm
log-mean temperature,
u
mass average velocity
zref
reference surface height
zsurf
height of surface roughness features