
Introduction
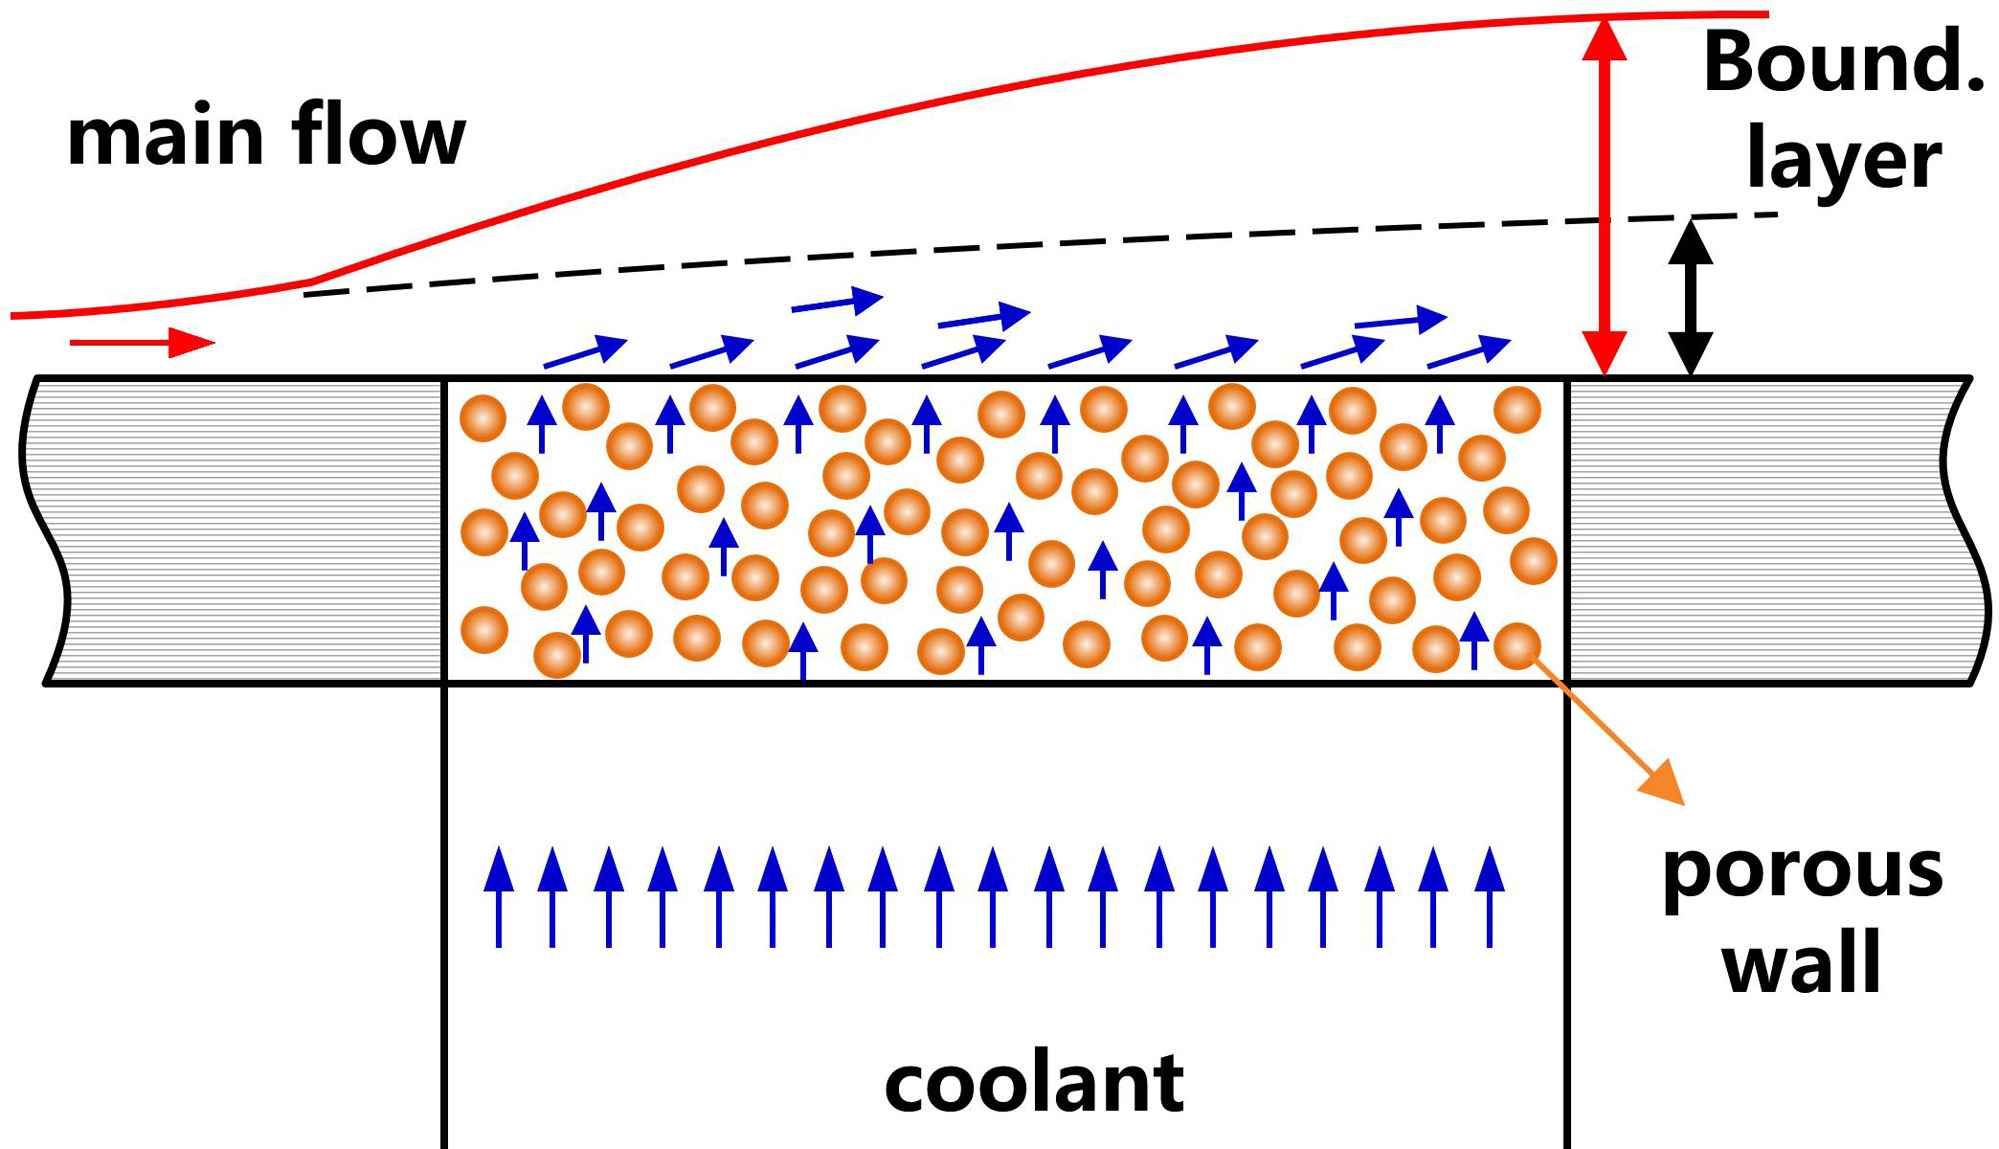
As significant increases in the flight Mach number and thrust, the thermal barrier has become one of the key technical bottlenecks that restrict the reliability and reusability of aerospace power systems in extreme environments. Due to its high cooling capacity [up to 1.4 × 10⁹ W/m2 (Glass et al., 2001)], low coolant consumption, compact structure, and flexible control, transpiration cooling (also known as effusion cooling) has been identified as one of the most promising technologies to satisfy the requirements for ultra-high heat flux and/or ultra-high temperature thermal protection. The principle of transpiration cooling is schematically illustrated in Figure 1, where the cooling fluid flows through the porous wall into the mainstream and forms a continuous thin film over the protected wall. The basic transpiration cooling mechanism involves strong convection within porous media between the coolant and solid matrix, and a continuous gas film attached to the hot wall blocks the transfer of heat between the hot stream and wall.
The earliest research into transpiration cooling can be traced back to the 1940s when it was used for rocket engine throat cooling (Weinbaum and Wheeler, 1949). Transpiration cooling has great potential for providing protection from ablation in key components of liquid rockets (Zhu et al., 2012), near space supersonic aircraft (Zhao et al., 2014), and aviation turbine engines (Krewinkel, 2013). Professor Jiang's research group has investigated transpiration cooling for more than 20 years, including fundamental research and applications (Jiang et al., 1999a,b, 2004, 2019; Yu et al., 2003; Meng et al., 2005, 2006; Yu and Jiang, 2007; Liu et al., 2013a,b; Zhu et al., 2013, 2018; Huang et al., 2014, 2015a,b, 2017, 2018a,b,c,d, Huang et al., 2019a, 2020a; Xiong et al., 2014; Hu et al., 2020; Xu et al., 2021; Cheng et al., 2023). Professor Jiang began to study transpiration cooling in 1999 (Jiang et al., 1999a,b) and recently published two reviews (Zhu et al., 2018; Xu et al., 2021) to summarize work related to transpiration cooling over the last 20 years. Other researchers (Foreest et al., 2009; Herbertz et al., 2012; Rong et al., 2016; Jiang et al., 2017a,b; Wu et al., 2018, 2019; Huang et al., 2020b; Liu et al., 2022) have also made great contributions to the field of transpiration cooling from the USA (Liu et al., 2022), China (Rong et al., 2016; Jiang et al., 2017a; Wu et al., 2018, 2019; Zhu et al., 2018; Liu et al., 2022), and Germany (Foreest et al., 2009; Herbertz et al., 2012).
However, the extremely high and non-uniform heat flux leads to a mismatch between the local thermal load and actual cooling capacity. Consequently, it is crucial to optimize the pore topology and flow parameters to achieve a reasonable coolant distribution in the porous structure under non-uniform heat flux conditions. Jiang and Chyu proposed the “active design of porous structure plus additive manufacturing technology” concept for transpiration cooling systems (Jiang et al., 2017b; Huang et al., 2019b, 2020b; Min et al., 2019a). The topology of porous media can be tailored according to this concept. In addition, the structural and mechanical properties can be strengthened by porous topology optimization and fabrication through active manufacturing. The field of additive manufacturing has become increasingly active over the last decade and various additive manufacturing technologies have emerged. In particular, research into rapid additive manufacturing has demonstrated the capacity for the rapid mass production of complex porous structures with micropores (Saha et al., 2019). Additive manufacturing will become an important method for fabricating microporous structures, thereby extending the approaches available for designing the porous media used in transpiration cooling. Important advances in additive manufacturing technologies for porous material applications were also described in previous studies (Wang et al., 2016; Cui et al., 2018; Tancogne-Dejean and Mohr, 2018; Guddati et al., 2019).
The available information regarding the key topics related to additive manufacturing technology in transpiration cooling is fragmented, so the authors provide a general overview and holistic discussion of the basics and applications of additive manufacturing-assisted porous materials for transpiration cooling systems in this review. In Section 2, the authors provide a general overview of the methods used for porous structure topology design, and for examining the heat transfer and strength performance of porous parts fabricated by additive manufacturing. In Section 3, the authors highlight the applications of three-dimensional (3D)-printed porous media in transpiration cooling with different regimes. In Section 4, the authors identify the current challenges and future outlook for the next generation of 3D-printed porous structures in transpiration cooling systems.
Additive manufacturing-assisted porous structures
Topology design of porous structure
Metal particle sintered porous materials are the most widely used porous materials for transpiration cooling according to previous studies. Parameters such as the pore diameter and porosity can be adjusted by changing the particle diameter or mold pressure. However, the porosities of sintered porous media vary slightly within the applicable particle diameter range. In particular, the porosity of an ordered packing structure remains almost unchanged (Yang et al., 2012; Bu et al., 2014), whereas the porosity of a randomly packed structure varies in the range of 0.36–0.40 (Wu, 2019). In addition, it is difficult to make the pore parameters change according to the given values when weaving wire mesh, welding plate layers, and forming metal foams, thereby greatly affecting the design of subsequent preparation techniques. In previous studies, the topology design methods investigated for porous media including computer-aided design (CAD), mathematical equation-based design, and topology optimization design. Table 1 lists some important methods used for designing the topology of porous materials in the field of transpiration cooling.
Table 1.
Approaches for topology design of porous materials.
| CAD-based design | |||
Micro-pore array (Huang et al., 2018e) 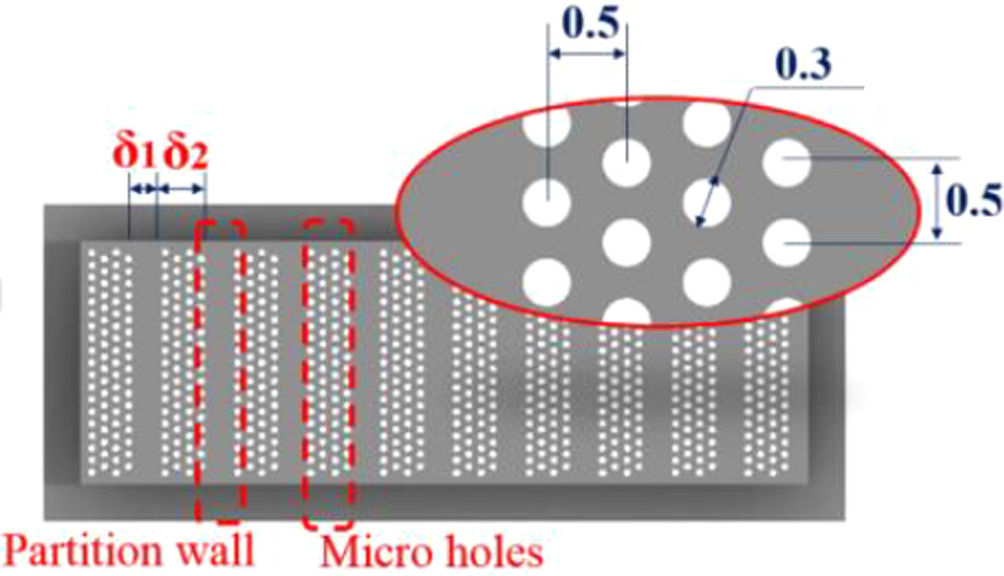 | Kelvin cell (Storm et al., 2016) 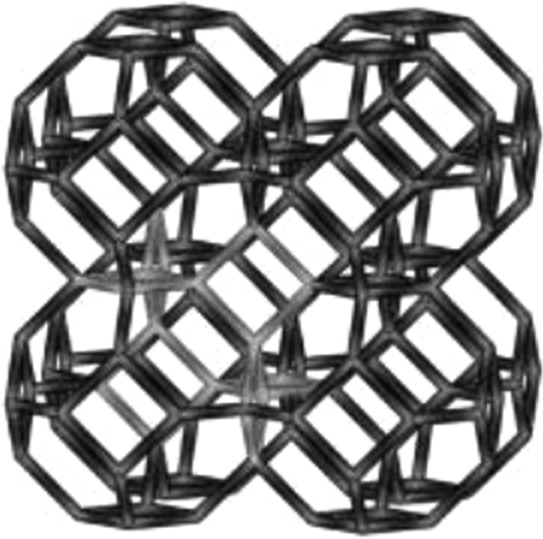 | Weaire–Phelan cell (Buffel et al., 2014) 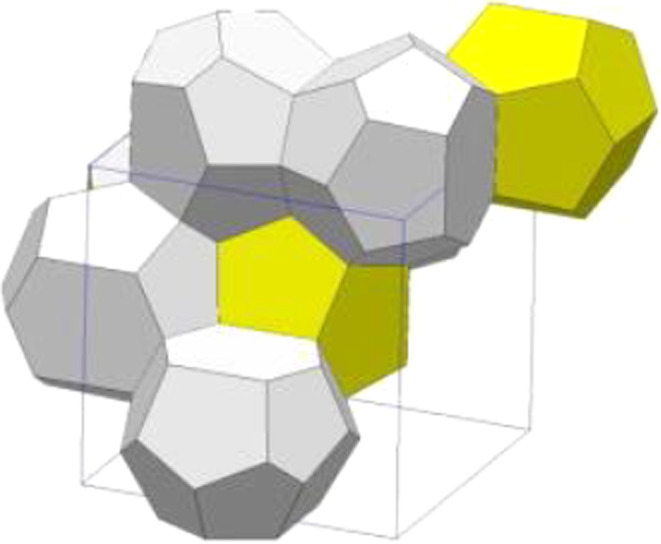 | Lattice structure (Guddati et al., 2019) 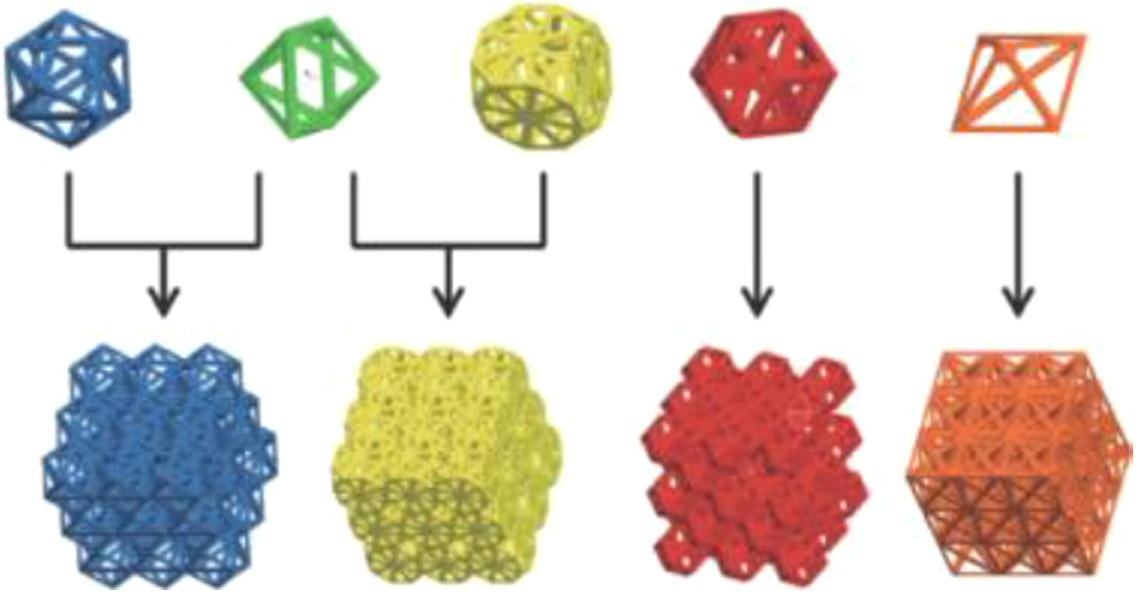 |
Triply periodic minimal surfaces | |||
iWP (W) type (Cheng et al., 2021a) 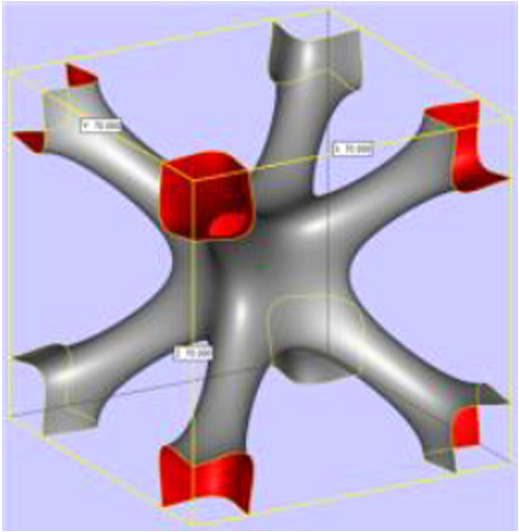 | Primitive (P) type (Cheng et al., 2021a) 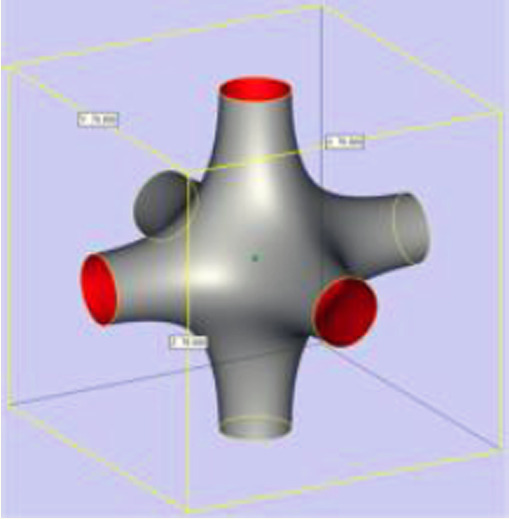 | Diamond (D) type (Cheng et al., 2021a) 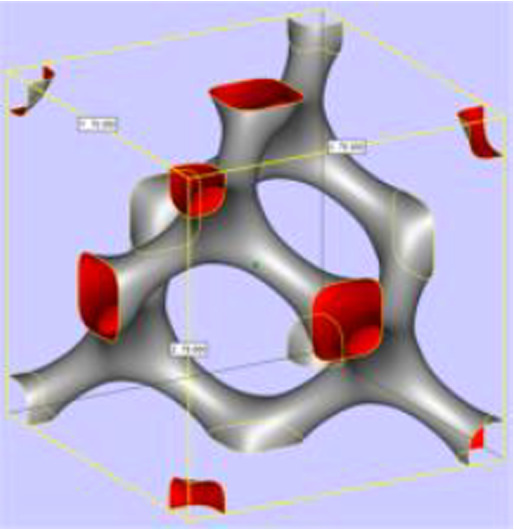 | Gyroid (G) type (Cheng et al., 2021a) 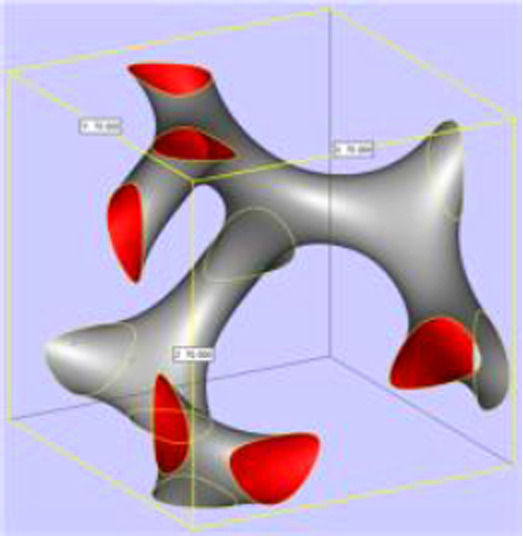 |
Topology optimization | |||
Maximum stiffness based (Huang et al., 2011) 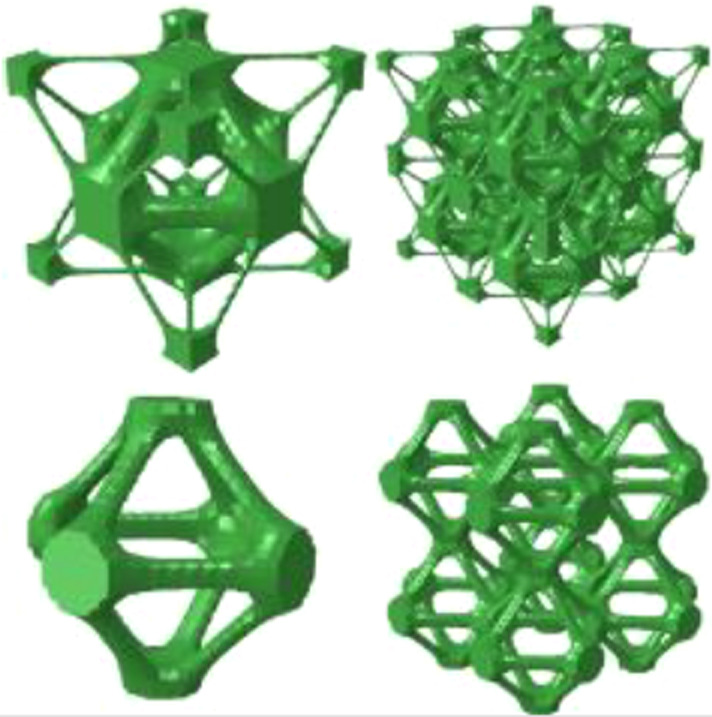 | Optimal thermoelasticity based (Deng et al., 2013) 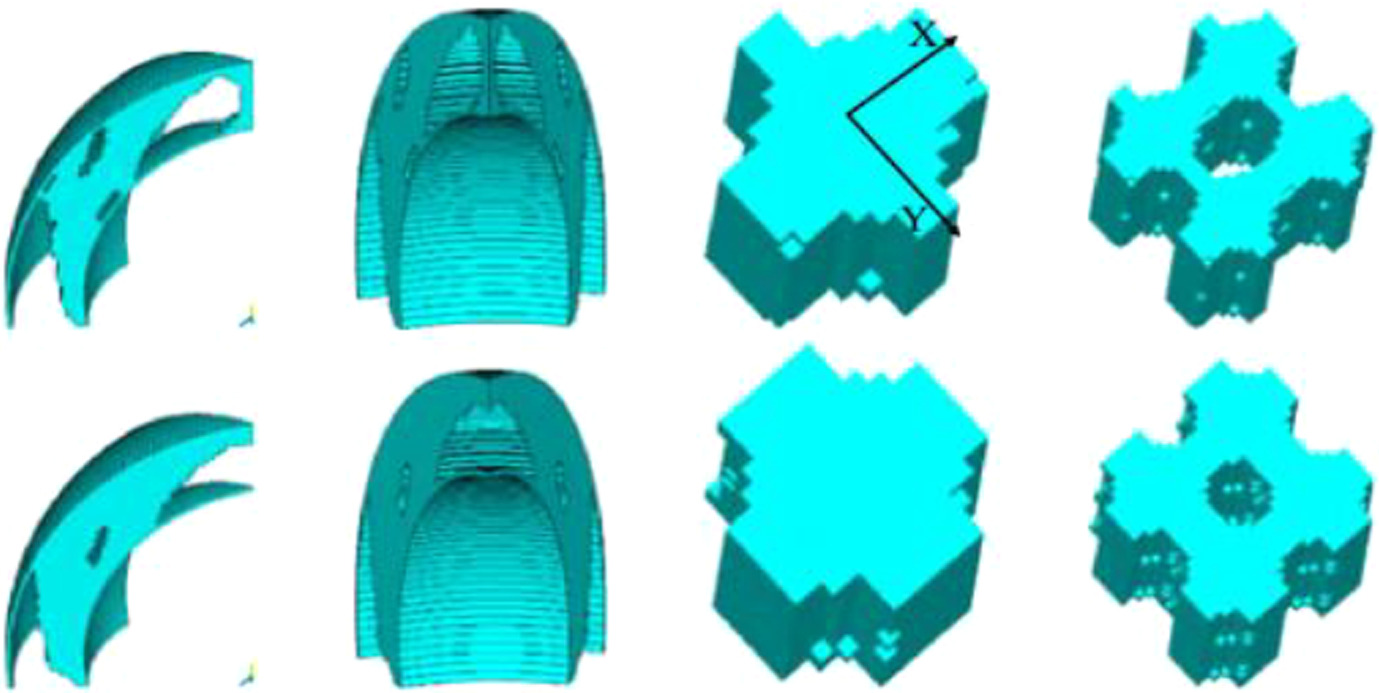 | ||
CAD-based design
Dense micropores array
A dense micropore array is the usual design method for porous media. Dense micropore arrays are characterized by no interface for flows in adjacent pores. Moreover, flexibility is allowed in the design of the distribution of micropores, arrangement of reinforcements, and control of the outflow angle. Huang et al. (2018e) designed a type of strip distribution porous medium with a staggered dense micropore array, pore diameter of 300 µm, and pore pitch of 500 µm. A tree-like structure with straight holes was also designed. The fluid was collected from the bottom of the pipe (with a diameter of 5 mm) and distributed to the capillary hole (with a diameter of 200 µm) in the top layer (six layers in total) (Huang et al., 2019b). In addition, different types of stiffeners and three flow angles (45°, 90°, and 135°) were designed. Li et al. (2014) designed three dense micropore structures by combining effusion cooling and impingement cooling. Wang et al. (2016) designed different porous structures for dense micropore arrays, such as different pore spacings, meshes, and vascular distributions. Researchers designed a dense micropore array structure on the nosetip with radial divergence and a pore diameter of 500 µm (Rong and Liu, 2010). Researchers used machine learning methods to optimize the pore distribution (Li et al., 2021).
Kelvin cell and Weaire-Phelan cell
The famous Kelvin problem is described as follows: if a three-dimensional (3D) space is divided into several small parts to ensure the minimum contact area, what is the shape of the smallest unit after segmentation? There are two classical answers to this question comprising the Kelvin cell and Weaire–Phelan cell. The Kelvin cell has a dectetrahedron structure, with eight square faces and six regular hexagonal faces (Rickenbach et al., 2014). The Weaire–Phelan cell comprises eight polyhedrons, with six decahedrons and two dodecahedrons (Buffel et al., 2014). A cylinder or cuboid is used to connect the vertices of a polyhedron to construct a porous structure. These structural units can be arranged in a 3D space, where the pore size and porosity are controlled by changing the length and thickness of the struts of the polyhedron. Researchers from Ireland introduced the detailed process for constructing a porous structure based on the Kelvin cell, and prepared porous media by using two additive manufacturing technologies called digital light processing and selective laser melting (SLM) (Rice et al., 2020). Researchers at The Royal Institute of Technology in Sweden implemented torsion, tilting, and stretching based on the Kelvin cell using mathematical methods (Mao et al., 2020), as shown in Figure 2a. The strength properties of the porous media were compared after deformation. Porous media based on the Kelvin cell and Weaire–Phelan cell are ordered periodic structures. Various algorithms have been developed to produce the Kelvin cell and Weaire–Phelan cell with a random distribution in the porous structure (Jang et al., 2010; Lucci et al., 2017), as shown in Figure 2b.
Figure 2.
Kelvin cell based structures. (a) CAD drawings of sample designs including unit cells (a) EISO (b) ES (c) ETS (d) ETT (Mao et al., 2020). (b) Randomized Kelvin cell lattice (Lucci et al., 2017).
Lattice structure
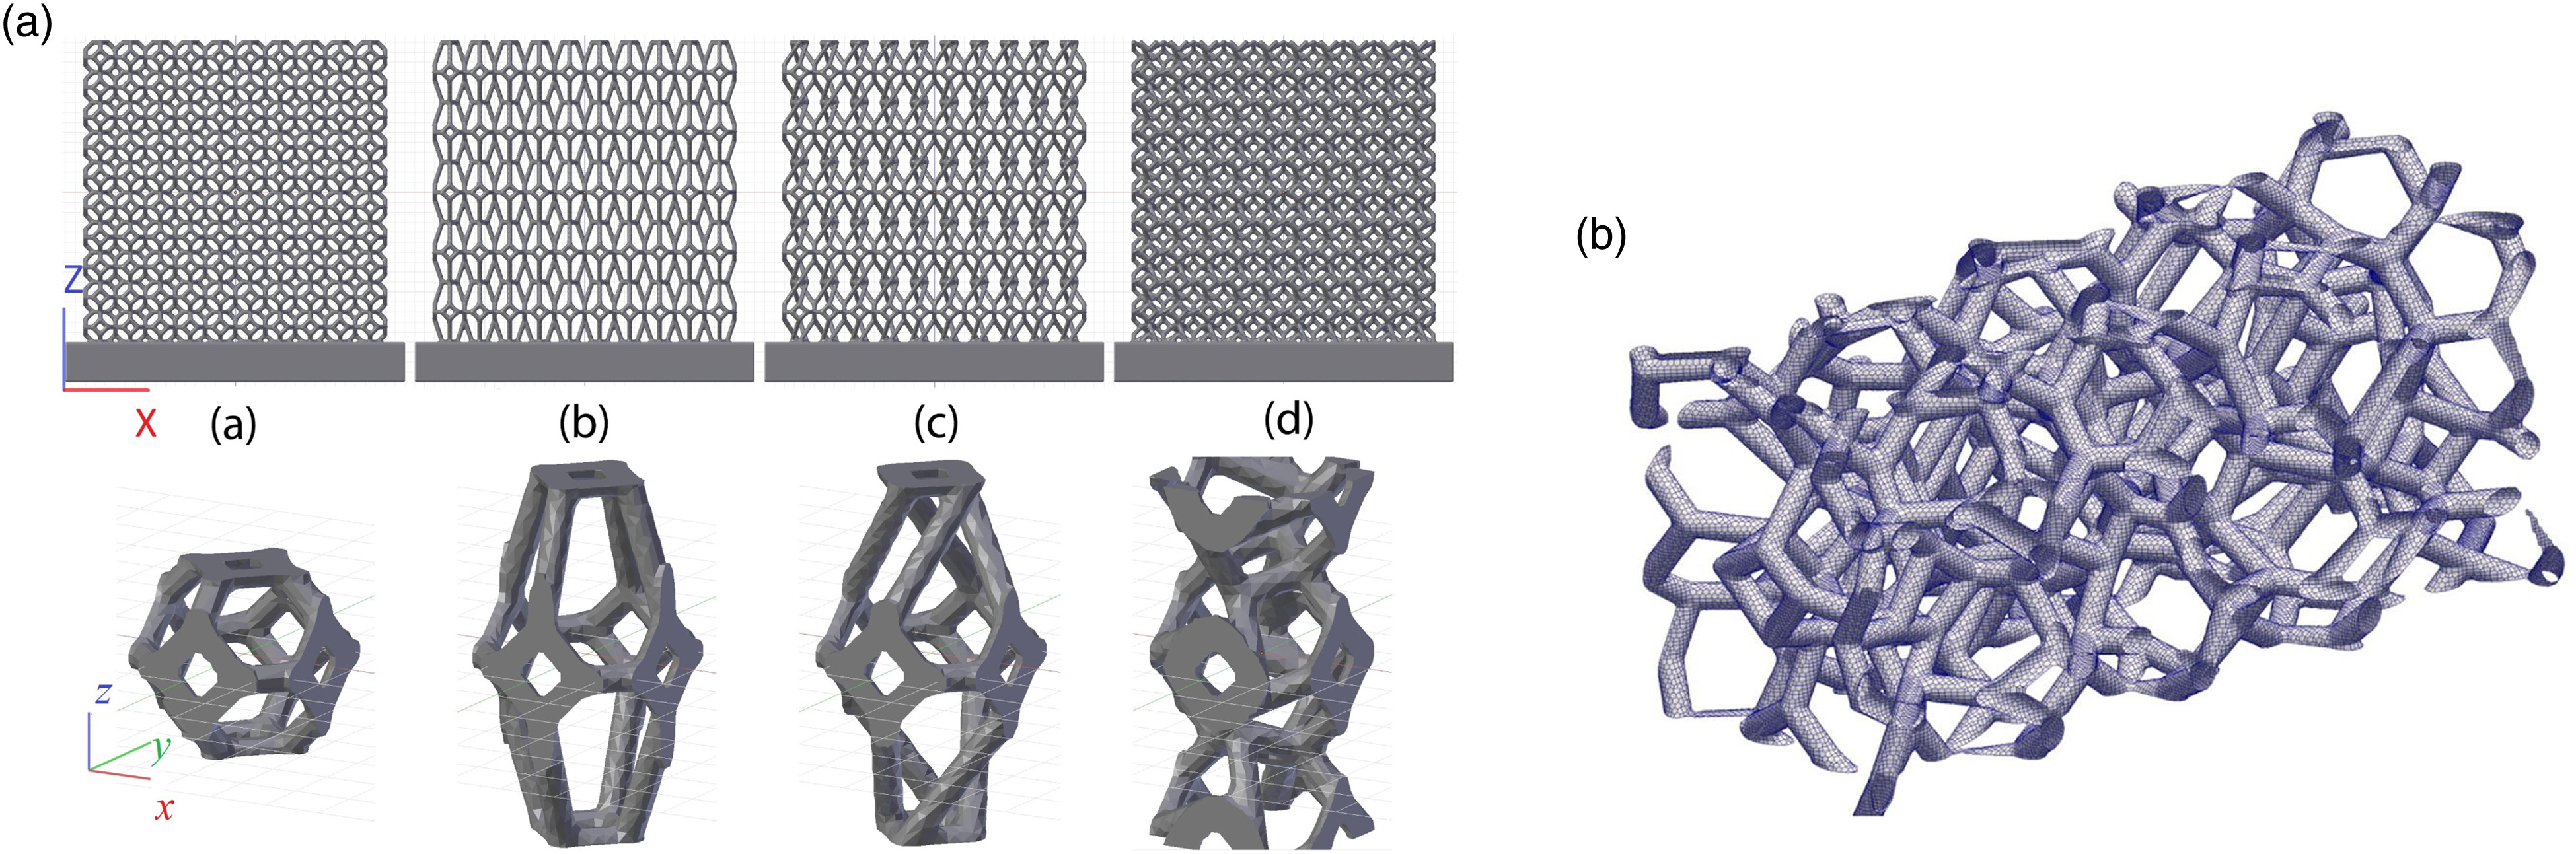
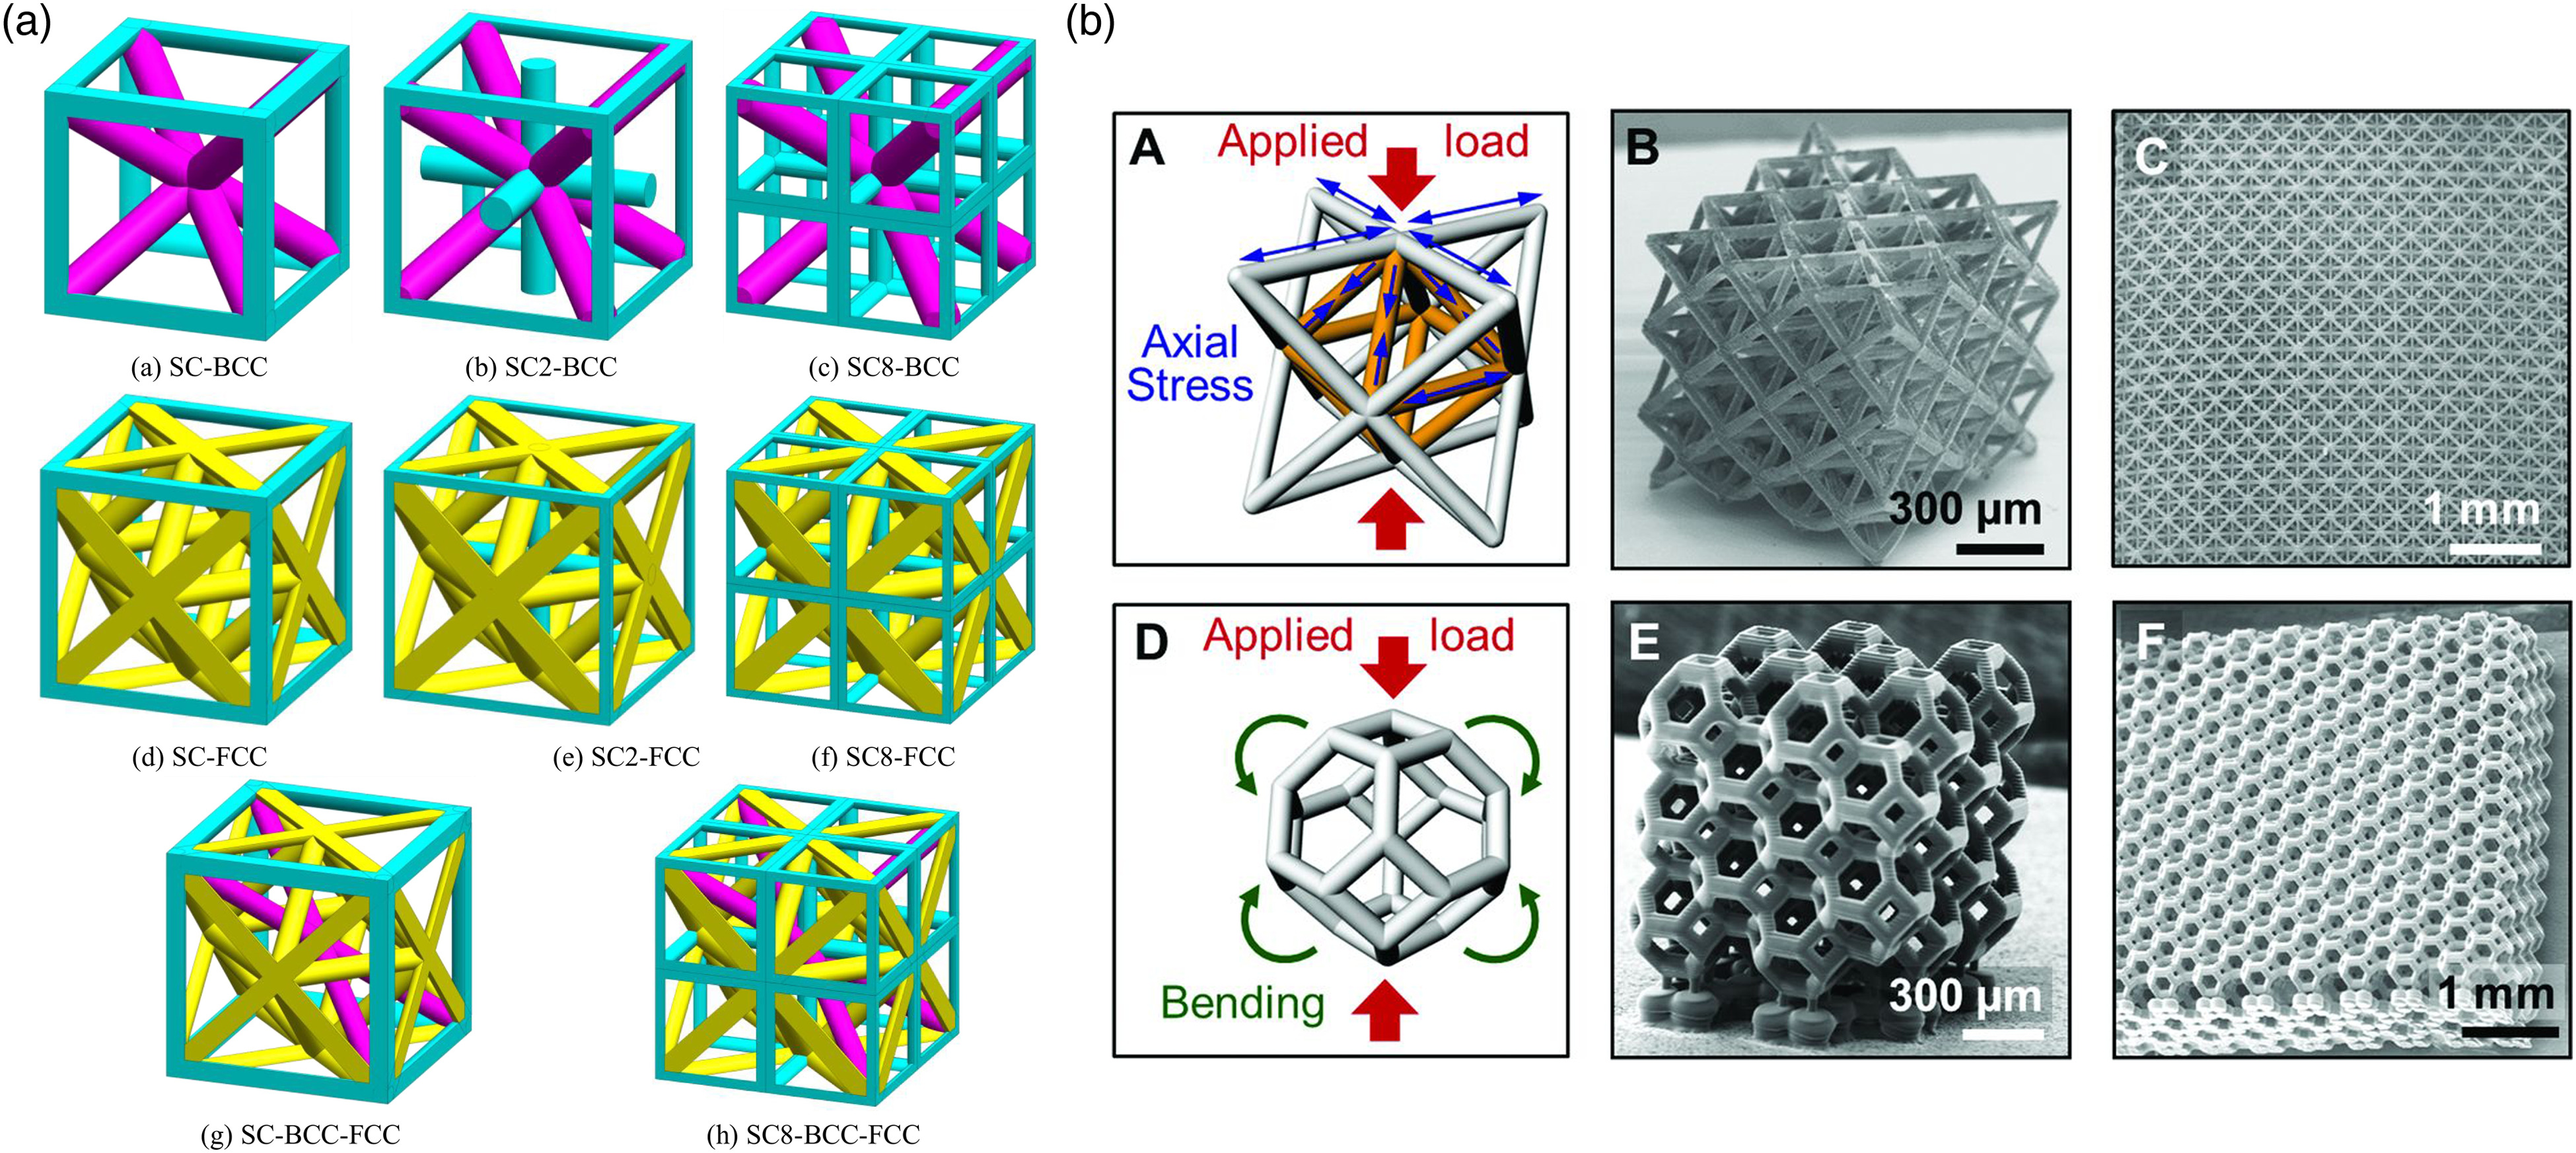
Lattice materials are obtained by arranging lattice cells at micron or millimeter unit scales and stacking them periodically in a certain manner (Tancogne-Dejean and Mohr, 2018; Yang et al., 2021), as shown in Figure 3a. Researchers at Lawrence National Laboratory analyzed the variations in the capillary force in rod-shaped porous structures at different heights within the pore unit, and found that the rod diameter was a key factor for determining the capillary force and liquid flow (Dudukovic et al., 2021). Essentially, the flow rate of the coolant in micro-/nanopores depends on the heat flux and capillary force of the heating surface (related to the pore size and contact angle) and flow resistance. Thus, researchers can topologically “program” the porous structure with the aid of micro-/nanoscale additive manufacturing technology. Researchers at Lawrence National Laboratory reported a type of microscale lattice porous material that maintains almost constant stiffness with ultra-low density (Zheng et al., 2014), as shown in Figure 3b. Researchers at Virginia Tech constructed octet-truss lattice and cuboctahedron lattice rod-like porous structures with square cross sections (Cui et al., 2018).
Figure 3.
Lattice structures. (a) Simple and hybrid unit cells (Tancogne-Dejean and Mohr, 2018). (b) Architecture of stretch-dominated and bend-dominated unit cells and lattices (Zheng et al., 2014).
Triply periodic minimal surfaces
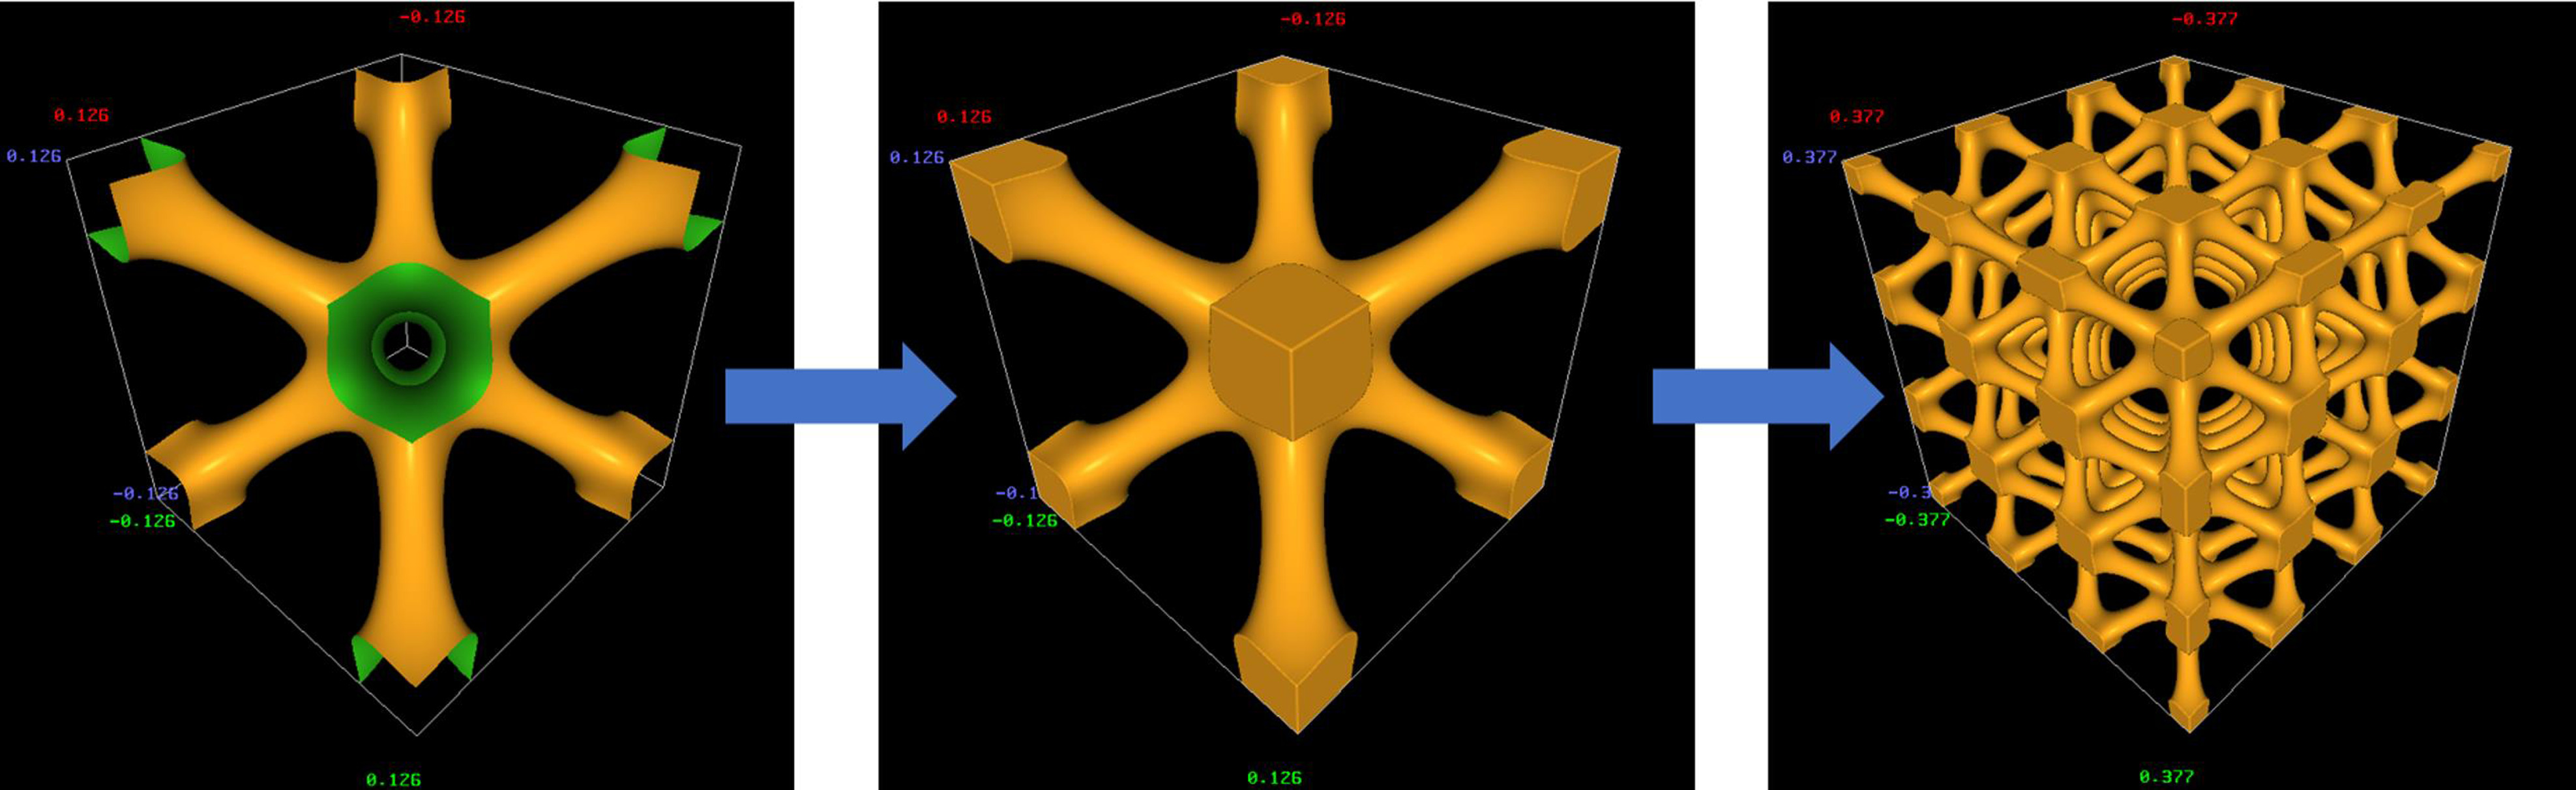
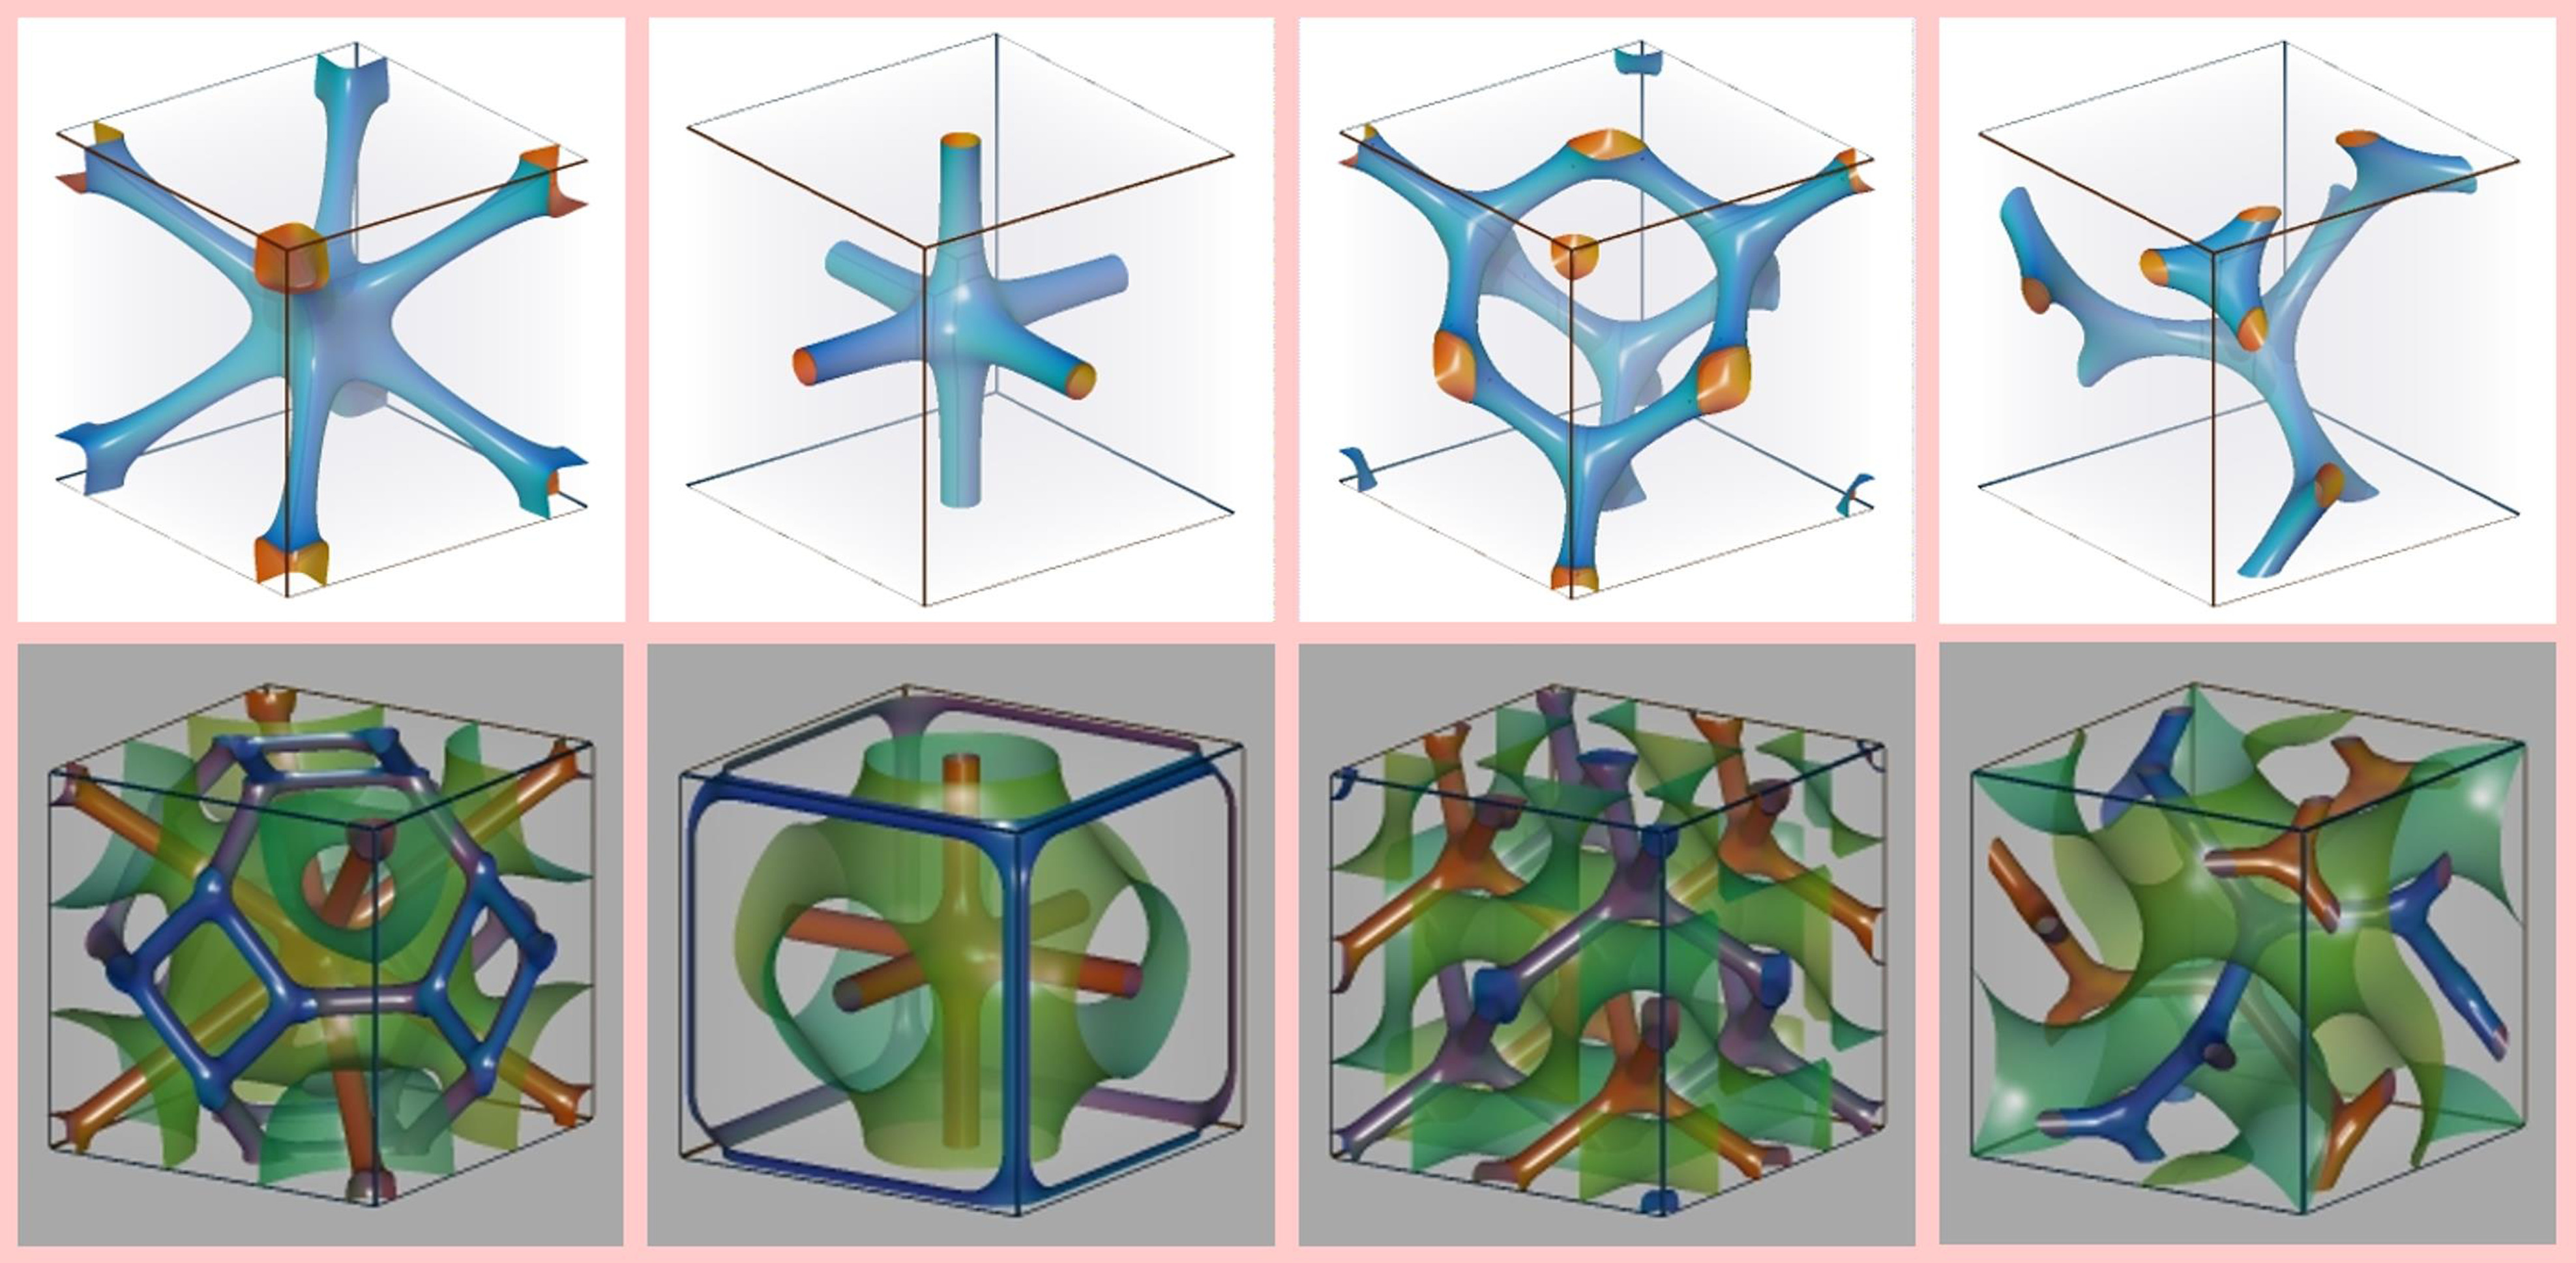
Periodic structures are common in nature, such as sea urchins, butterfly wings, seashells, and beetle shells, which all have TPMS structures (Hyde and Schroder-Turk, 2012; Han and Che, 2018). Many different types of TPMS surfaces have been identified since they were proposed by Schwarz in 1865 (Wohlgemuth et al., 2001), including Schoen I-WP (W), Schwarz primitive (P), Schwarz diamond (D), and Schoen gyroid (G) structures, as shown in Table 1. The surface equations for the W, P, D, and G types are shown in Equations 1–4. Mathematically, TPMSs minimize the area for a given closed contour using a combination of trigonometric functions and they are defined as surfaces with zero mean curvature anywhere, and thus the solid created by filling one side of the surface has a lower stress concentration under an applied load. Researchers propose that the key to using the TPMS method in porous structure design is constructing the interface between the pores and skeletons, and the quantitative design of pore structures can be achieved by controlling the characteristic parameters in the TPMS equation (Cheng et al., 2021a,b). Actually, F (x, y, z) = 0 represents the interface, F (x, y, z) < 0 represents the solid matrix, and F (x, y, z) > 0 represents the void. The pore units are then arrayed in the x, y, and z directions to obtain the desired porous structure, as shown in Figure 4. In addition, researchers can establish the quantitative relationships between the pore structure parameters (such as the porosity, pore size, and pore density) and characteristic parameters in the TPMS equations. Two variables comprising p and q are introduced into the general TPMS equation, as shown in Equation 5. Determining the characteristic parameters p and q in the TPMS equations is complicated and time-consuming using computational programs during the design process. Thus, the correlations between the characteristic parameters p and q, and porosity in the four TPMS equations (W type, P type, D type, and G type) are fitted based on a large amount of data, as shown in Equations 6–8. The method for constructing porous structures based on TPMS has been applied in many fields, such as biological scaffolds (Cai et al., 2019), regenerative cooling thermal protection (Wang et al., 2020), heat exchangers (Li et al., 2020), and membrane distillation (Thomas et al., 2018). In addition to customizing a single type of TPMS porous structure, a composite porous structure can be constructed by combining different pore types or different pore scales, as shown in Figure 5, thereby providing more options for using the TPMS method to customize the porous structure.
(3)
(6)
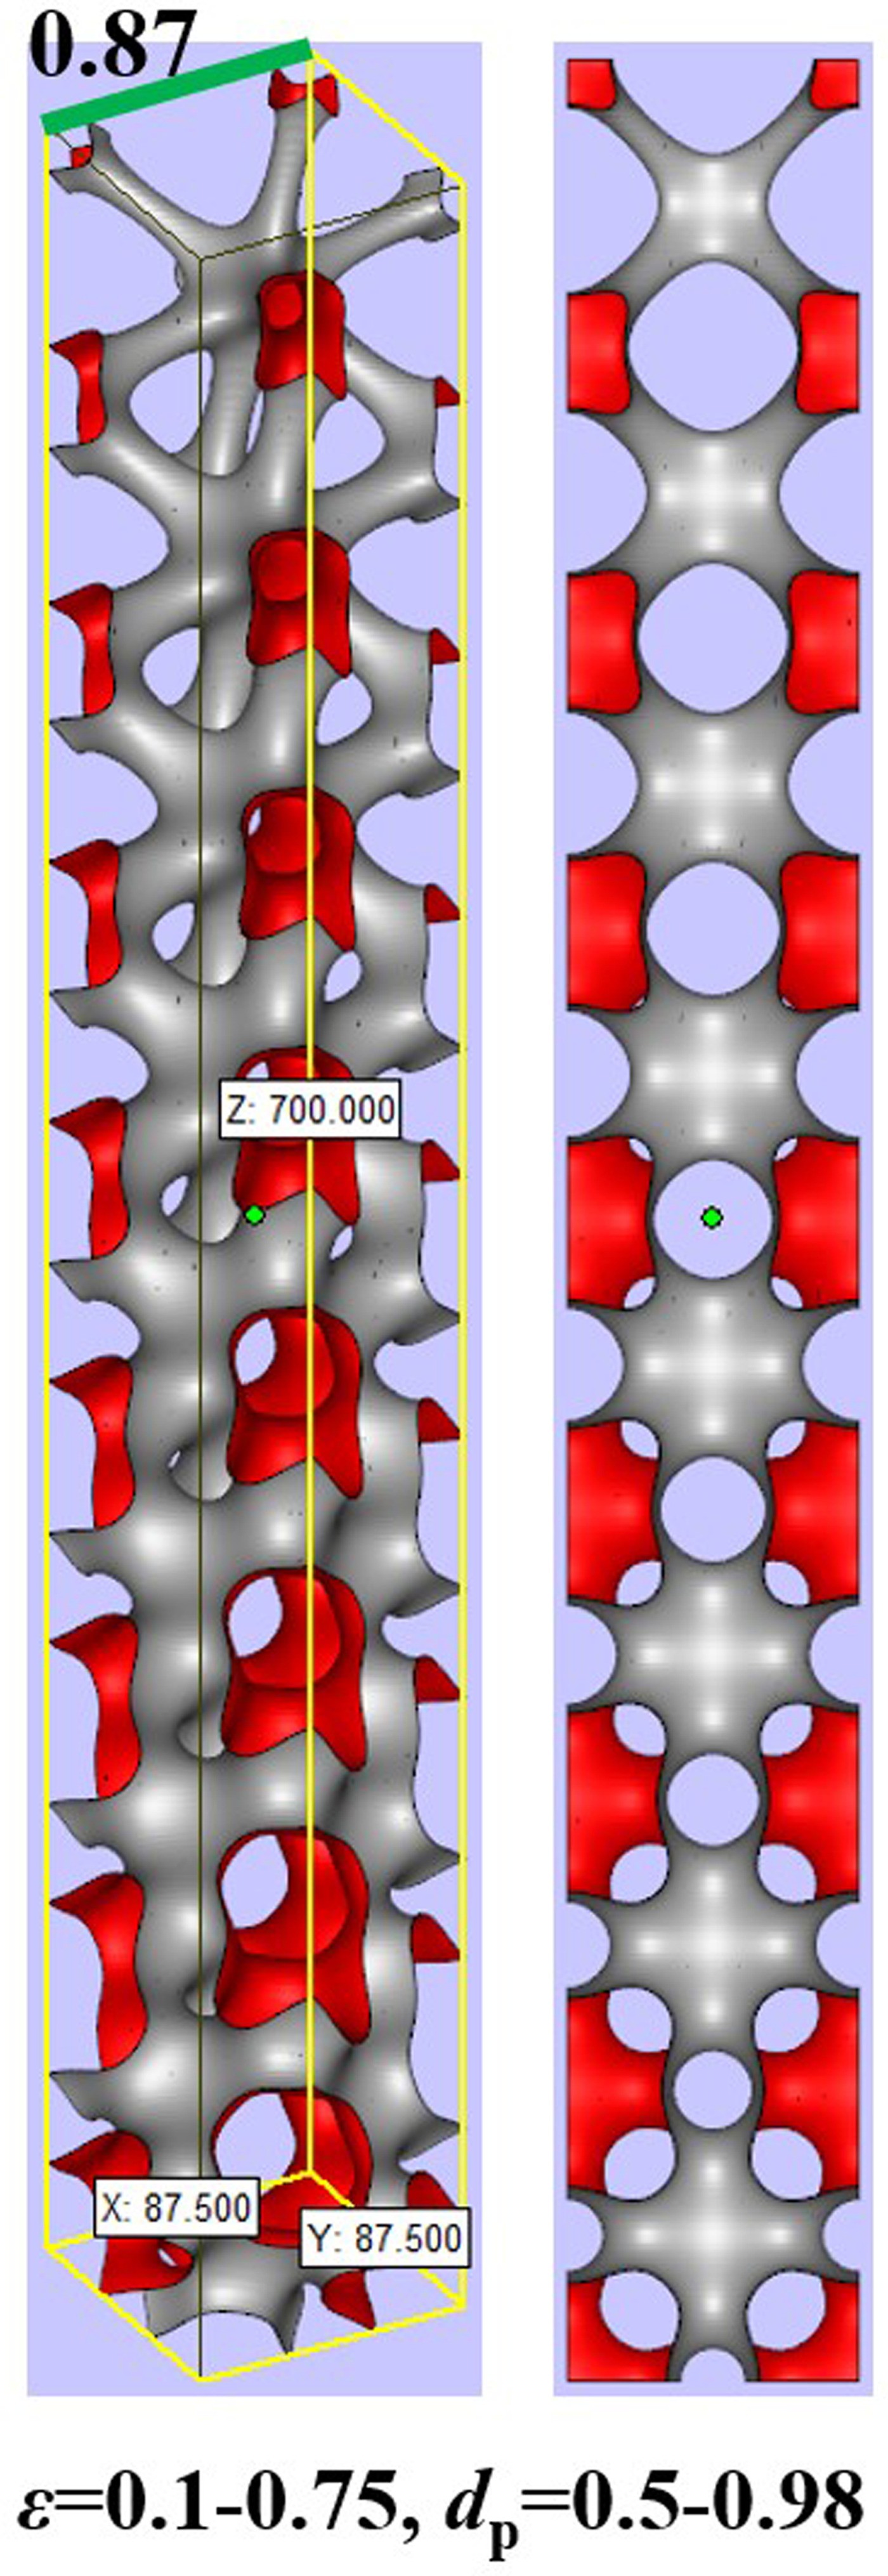
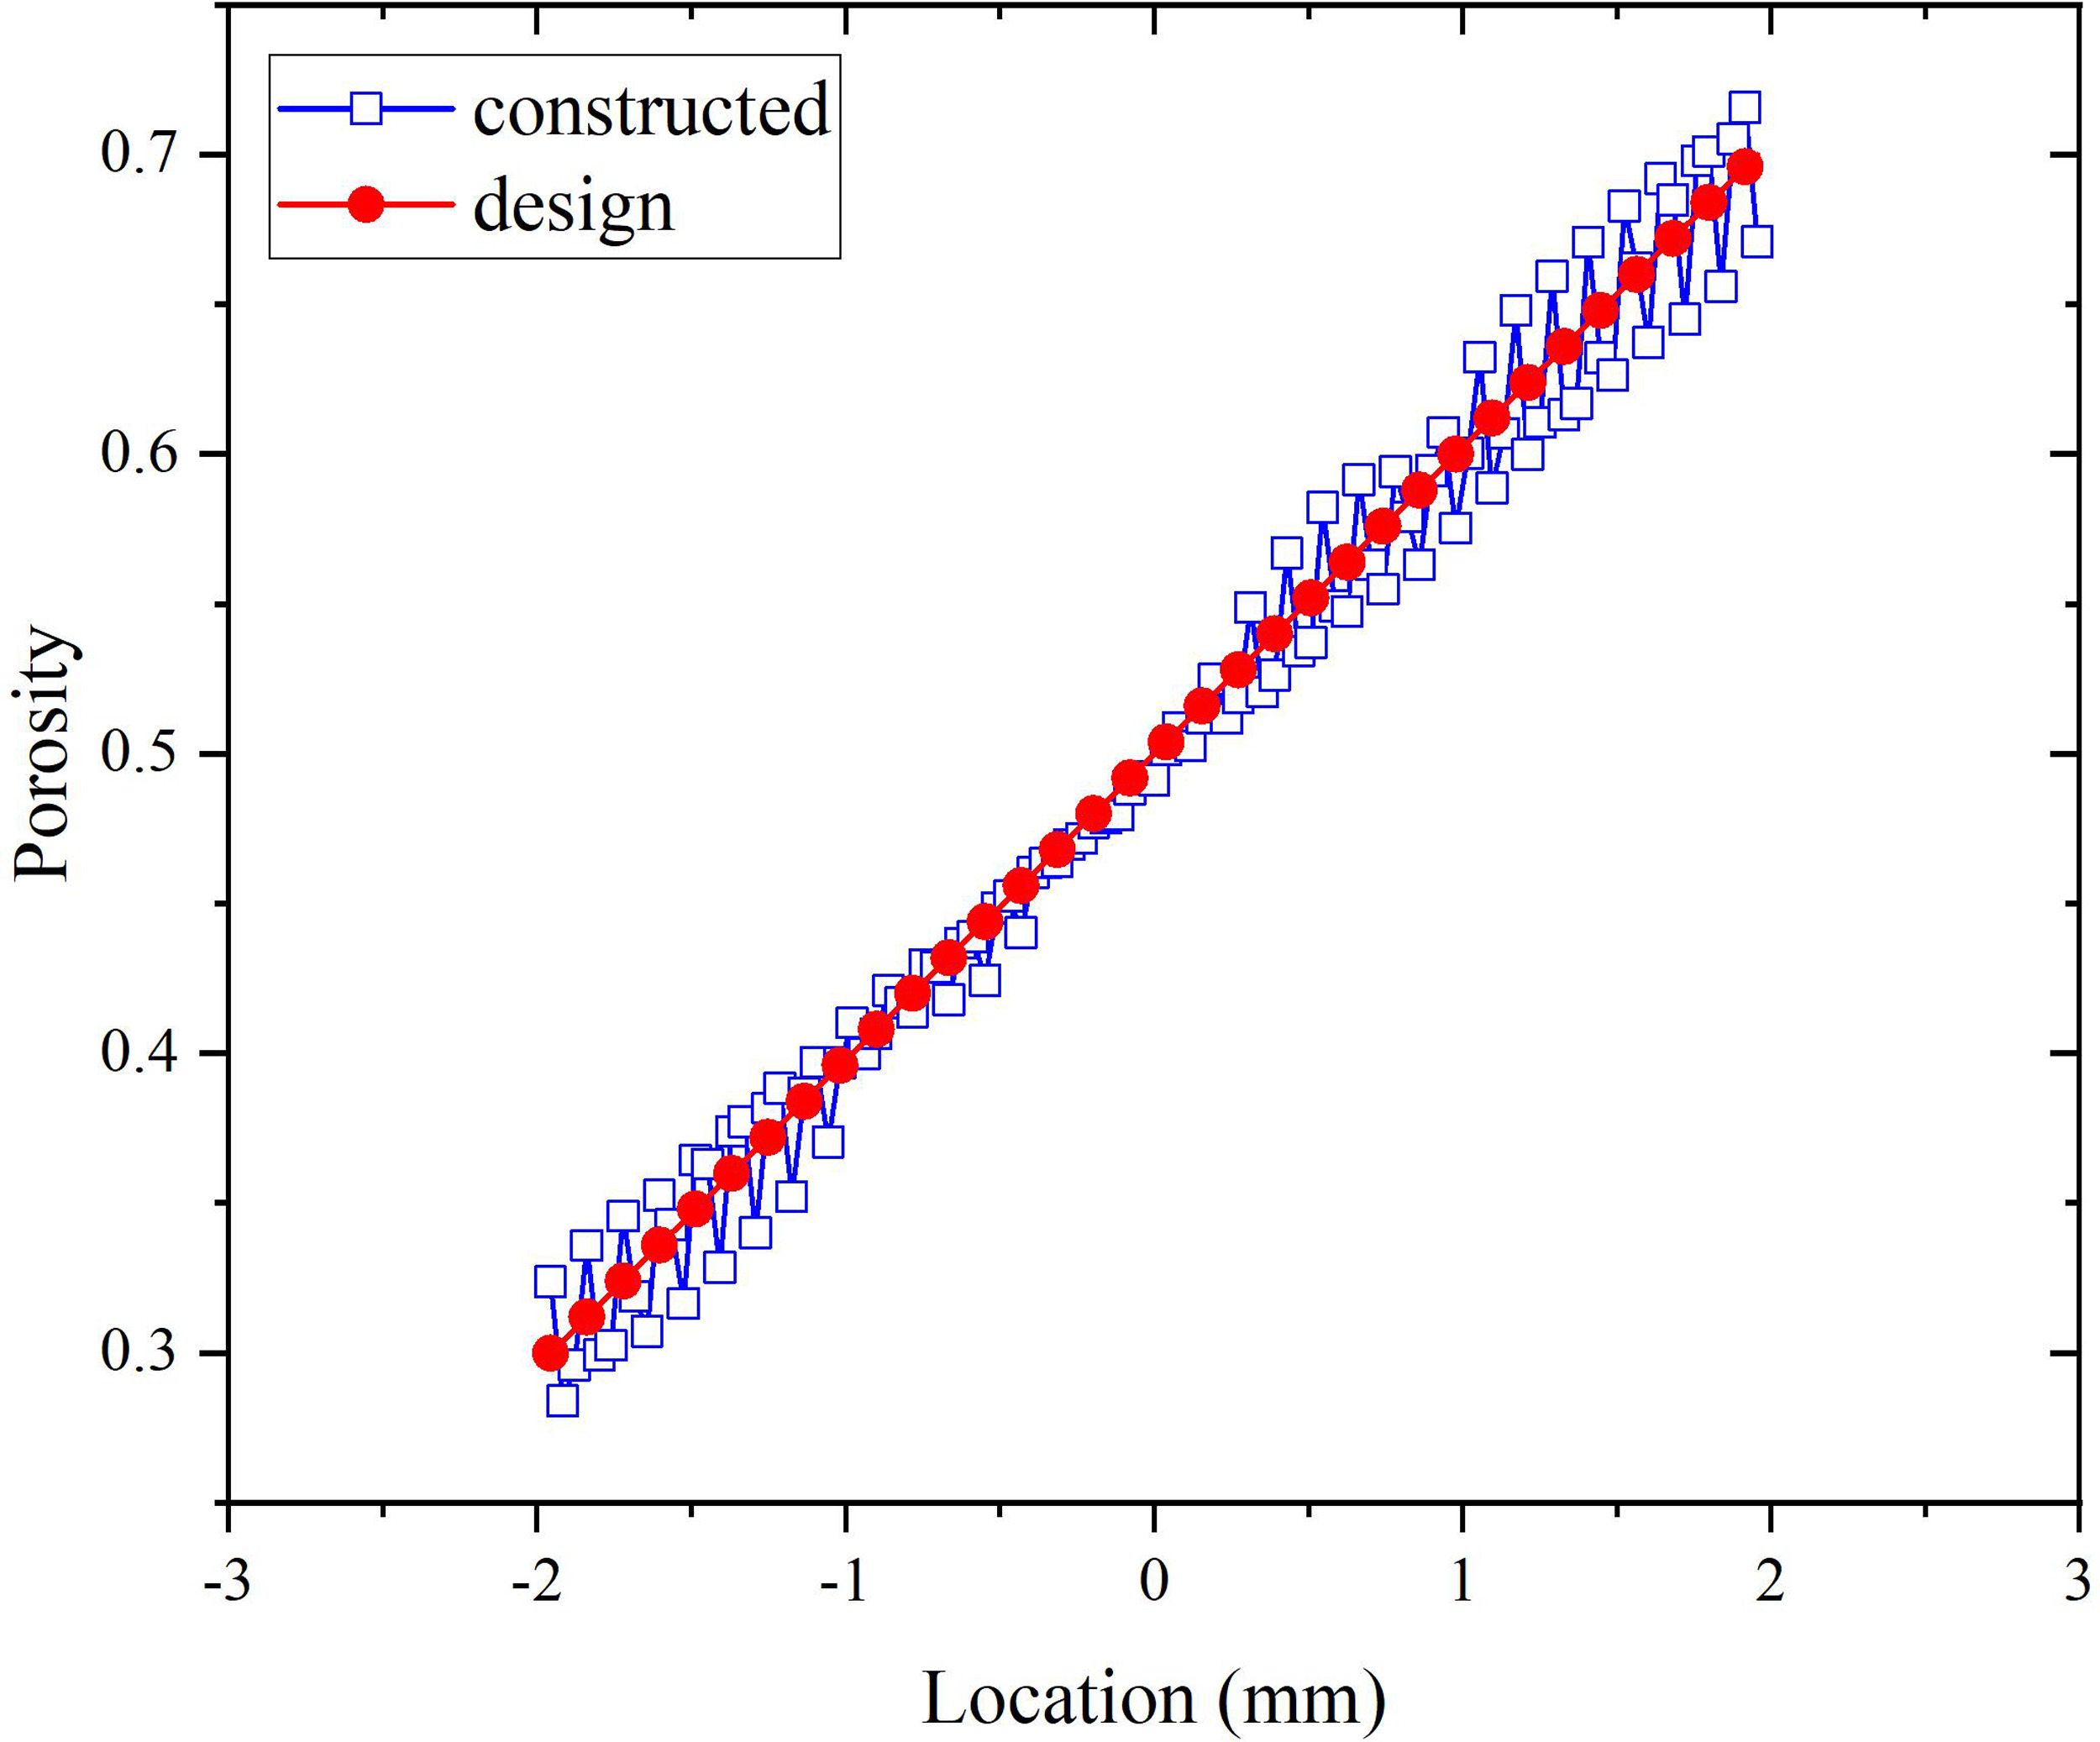
In a large number of engineering applications, porous materials need to be designed as gradient pores to satisfy specific requirements. As shown in Figure 6, the porous structure of bones is designed to vary along the axial direction and radial direction according to the loads on different parts (Gabbrielli et al., 2008), and variable pores can even be found in selected areas according to the strength distribution (Vijayavenkataraman et al., 2020). Researchers also explain the design process for functionally graded porous media in detail (Cheng et al., 2021a). When constructing porous structures with variable porosity, the parameter q in Equation 6 can be fitted as a polynomial according to the design parameters in order to obtain higher accuracy. However, in practical applications with a narrow range of porosity, a linear relationship is assumed between the porosity and characteristic parameter q. Thus, continuously varying graded porous structures can be readily customized mathematically by defining q values that are linearly dependent on the spatial coordinates. Figure 7 shows the variations in porosity in a gradient porous structure (0.3 < ε < 0.7, PPI = 52, G type), where the porosity of the constructed structure is very close to the design value. The small gap in the figure is due to the inevitable variations in porosity within a single pore unit at different positions. However, the average value in each pore unit is exactly the same as the design value.
Topology optimization
CAD software and the TPMS method can be used to construct complex geometries, but these two methods have the same problem because they cannot comprehensively control the performance of the structure. Topology optimization at the macroscopic structure level aims to obtain the optimal distribution of the material forms to significantly improve the structural performance. At the microscopic level, a microstructural single cell configuration can be obtained with very high performance to fully exploit the potential of the material. However, the potential of materials may not be fully utilized when applying material cells with extreme properties to form macrostructures because the topological form and boundary conditions of macrostructures have important effects on the optimal configuration of microstructures. Macrostructural optimization is based on previously prepared materials (such as solid materials and lattice materials) and their optimized distribution forms. The structural performance can be further improved because the potential of these given materials has not been fully utilized. Thus, macro-level structural optimization and micro-level material optimization are mutually coupled. In order to obtain porous structures with excellent performance, it is necessary to consider the combined optimization of the macro-level structure and micro-level material, which is called multi-scale topology optimization. In recent years, due to the rapid development of additive manufacturing technology, it has become possible to manufacture porous structures with complex geometric shapes. Therefore, multi-scale topology optimization has again attracted widespread attention as an effective design method for porous structures.
Zhang and Sun (2006) proposed a material/structure integrated design model, where the optimized macro-structure has many different layers and each layer is composed of a type of microstructure. The influence of the cell size in the microstructure on the performance of the porous structure was also studied. Zhang et al. (2019) proposed a multi-scale parallel topology optimization method based on the idea of microstructural gradient stratification, which allows the parallel optimization of macro- and micro-design variables. The macro-design variables represent the macro-distribution of microstructures and the micro-design variables represent the topological configuration of micro-cells. Gao et al. (2019) studied multi-scale topology optimization for structures and materials. Sivapuram et al. (2016) proposed multi-scale parallel optimization of the macro-structure topology and multi-class microstructure configuration based on the macro-partition optimization strategy. In this method, the macro- and micro-coupling optimization problems are decoupled to facilitate parallel optimization, and the method is extended to the design of flexible mechanisms. Nakshatrala et al. (2013) proposed an improved multi-scale topology optimization method that considers the nonlinear properties of material microstructures. The optimized porous structure contains various locally periodic microstructures, and an extensible parallel framework is applied to reduce the computational cost of nonlinear analysis.
Heat transfer and strength performances of porous parts
The heat transfer and strength properties of porous materials are important indexes for assessing the thermal protection effect of an effusion cooling system. The flow resistance, heat transfer coefficient, and strength of different types of porous structures are comprehensively described in this section. Table 2 shows images and the flow/heat transfer correlations for a porous structure with a micro-straight hole array, lattice structure, Kelvin cell porous structure, and TPMS porous structure (Wu, 2004; Krishnan et al., 2006; Yang and Tao, 2006; Kumar and Topin, 2014; Iasiello et al., 2017; Moon et al., 2018; Shen et al., 2018; Ekade and Krishnan, 2019; Kaur and Singh, 2020; Cheng et al., 2021b). The design and preparation of porous structures with micro-straight hole arrays is simple (Huang et al., 2018e), but the fluid only flows in an independent micro-channel without disturbance or mixing between adjacent channels, and the convective heat transfer coefficient is similar to that of a tube. During the 3D printing process, metal powder will adhere to the micro-channel wall at high temperature and positively influence the heat transfer due to the pin effect. The influence of particles adhering to the channel's surface is obvious when the channel's diameter is very small. Krishnan et al. (2006) performed a direct numerical simulation of transport phenomena in porous structures in a BBC lattice at the pore scale. Spheres were located at the vertices and centers of the cube, and the porous structure was obtained by a Boolean operation using the sphere and cube. The effective thermal conductivity, pressure drop, and local convective heat transfer coefficient were obtained by numerical simulation. Kaur and Singh (2020) studied the flow and heat transfer characteristics of four lattice porous structures (TKD, cube, FD-cube, and octet). The results showed that the Nusselt number (Nu) was significantly higher for the octet structure than the other three structures, and the pressure drop was slightly higher for the octet structure compared with the other three types of rod-lattice porous structures. Shen et al. (2018) compared the flow and heat transfer characteristics of single-layered Kagome and wire-woven bulk Kagome (WBK) sandwich panels under the same Reynolds number and porosity. The results showed that the area-averaged Nusselt number on the ligaments of the Kagome sandwich panel was about 42% lower than that for the WBK sandwich panel. In addition, for a given pumping power, the heat dissipation performance of the Kagome sandwich panel was 30% superior to that of the WBK sandwich panel. Kumar and Topin (2014) explored the effects of different rod shapes (circle, square, rhombus, ellipse, regular hexagon, star, and rectangle) on the flow resistance of a Kelvin cell-based porous structure. Min et al. (2019b) obtained the convective heat transfer coefficient for the fully developed section in a Kelvin cell-based porous structure and fitted the Nusselt number correlations. Cheng et al. (2021b) conducted a numerical simulation study of the flow and heat transfer in TPMS porous structures, and discussed the mechanisms that influence the hydraulic Reynolds number Reh and Nusselt number Nusf. In general, the magnitudes of the relationships with the convective heat transfer coefficients for the four W, P, D, and G structures were as follows: hW > hD > hG > hP. The branch structure gradually extended from the central position to the periphery of the pore unit, which increased the flow disturbance and the specific surface area was high. The flow direction within the W/G type porous structures changed continuously to enhance the heat transfer performance but without significantly increasing the pressure drop. In addition, the correlations were obtained between the flow resistance and convective heat transfer coefficients for the four TPMS porous structures. Finally, the relationships with the comprehensive heat transfer performance (j/f) were determined as: W > P/G > D (P type and G type structures had similar values).
Table 2.
Flow resistance and heat transfer correlations of typical porous structures.
| Type | Picture | Pressure drop | Nu |
|---|---|---|---|
| Pores array | --- | ||
| BBC | --- | ||
| TKD | 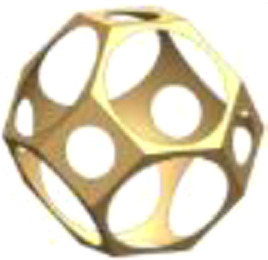 (Kaur and Singh, 2020) (Kaur and Singh, 2020) | ||
| Cube | 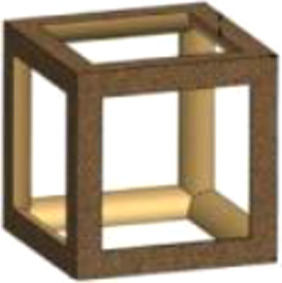 (Kaur and Singh, 2020) (Kaur and Singh, 2020) | ||
| FD-Cube | 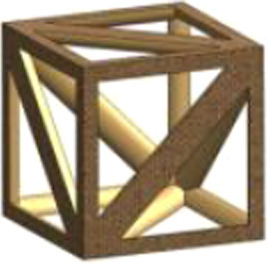 (Kaur and Singh, 2020) (Kaur and Singh, 2020) | ||
| Octet | 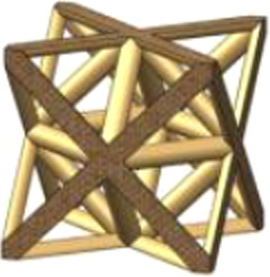 (Kaur and Singh, 2020) (Kaur and Singh, 2020) | ||
| Kelvin cell | 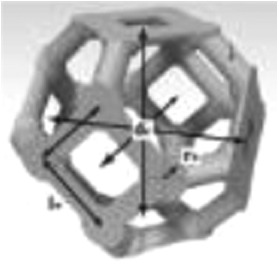 (Moon et al., 2018) (Moon et al., 2018) | ||
| TPMS-W | 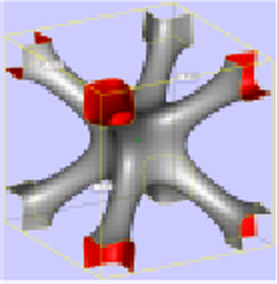 (Cheng et al., 2021b) (Cheng et al., 2021b) | ||
| TPMS-P | 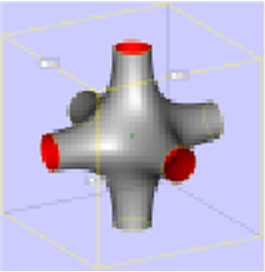 (Cheng et al., 2021b) (Cheng et al., 2021b) | ||
| TPMS-D | 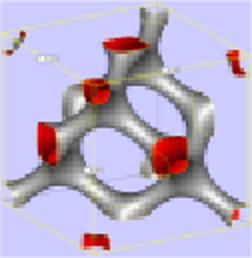 (Cheng et al., 2021b) (Cheng et al., 2021b) | ||
| TPMS-G | 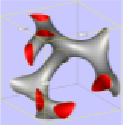 (Cheng et al., 2021b) (Cheng et al., 2021b) |
Huang et al. (2018e) compared the tensile strength of micro-straight hole array porous structures under different reinforcement rib areas, and also compared them with metal particle sintered samples. The tensile stress–strain curves were tested for sintered porous materials and SLM printed porous materials with different reinforcement plugging rates. As shown in Figure 8, the tensile mechanical performance was clearly higher for 3D printed materials compared with traditional sintered porous materials. Previous studies showed that the mechanical properties of solid materials produced using the SLM printing process were close to those of materials fabricated by casting molding. The maximum tensile strength of metal 3D printed porous materials with BR = 60% was very close to that of metal 3D printed solid materials. The maximum tensile strength of the traditional sintered porous material was 0.175 GPa, while the maximum tensile strength of the 3D printed porous material without reinforcement was 0.685 GPa, and the maximum tensile strength of the porous material with 60% reinforcement increased to 0.95 GPa, which was very close to that of the solid material. The maximum tensile strength of the porous material with 60% reinforcement was 4.4 times higher than that of the traditional sintered porous material.
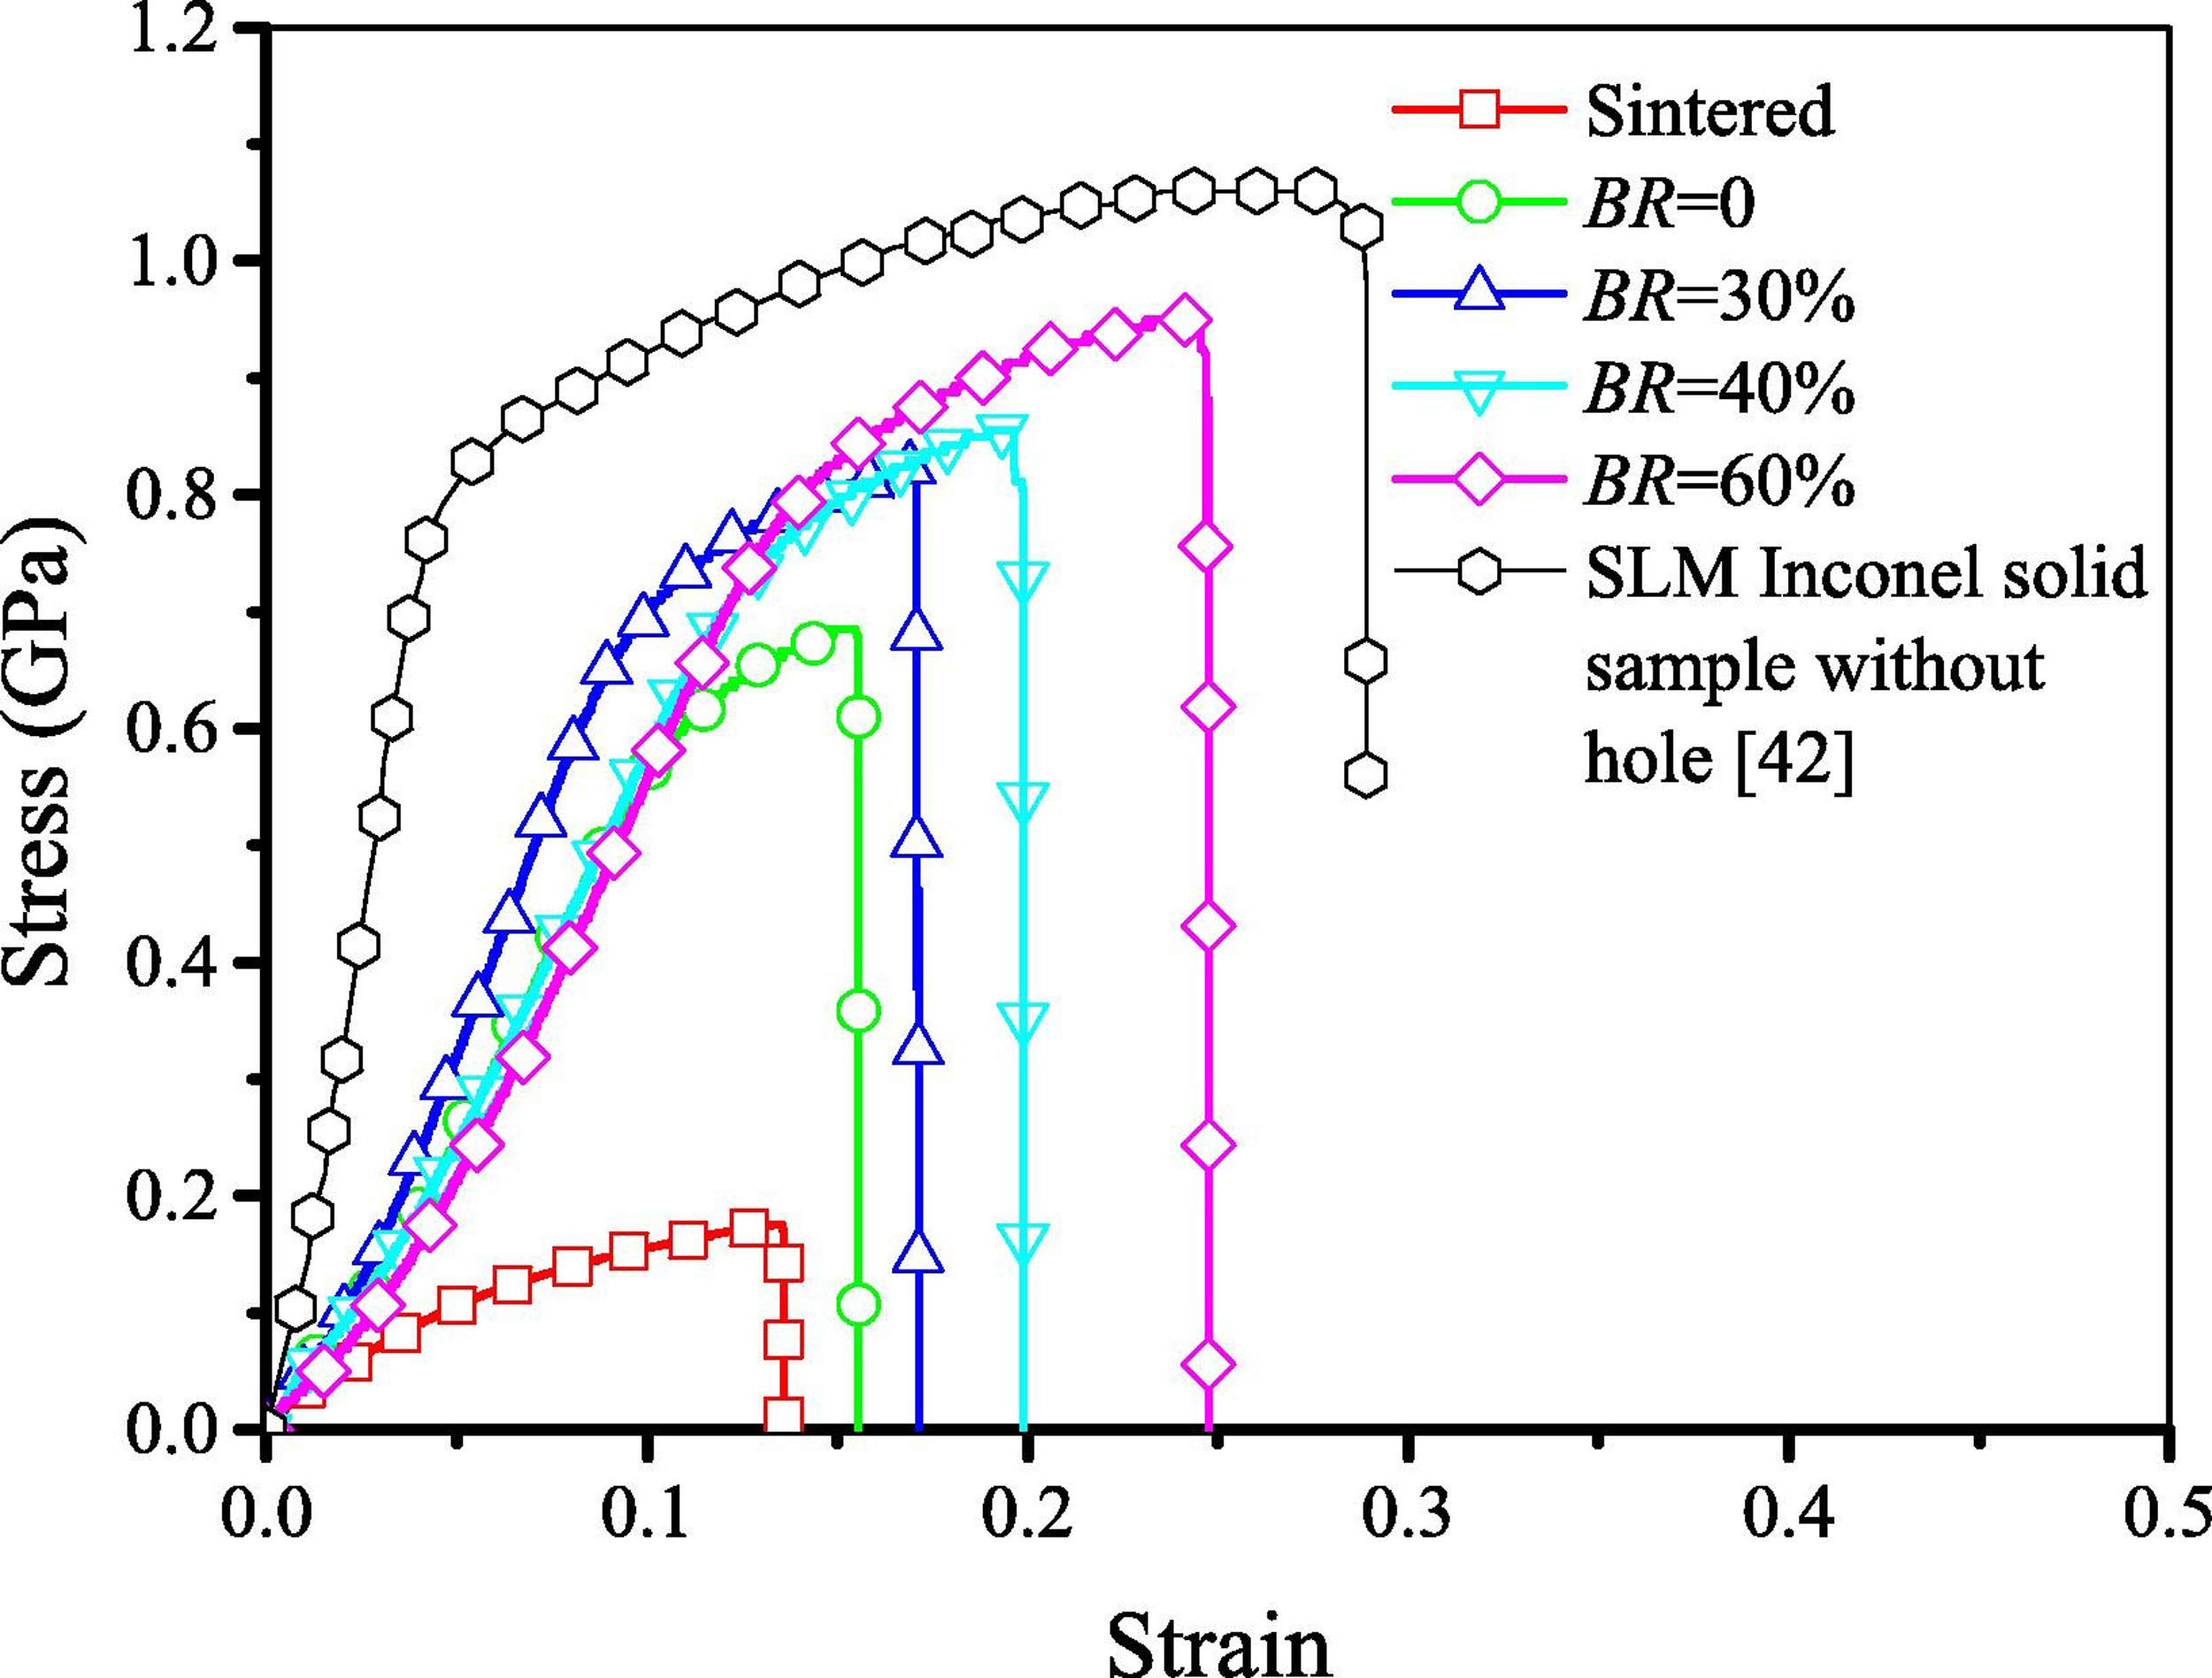
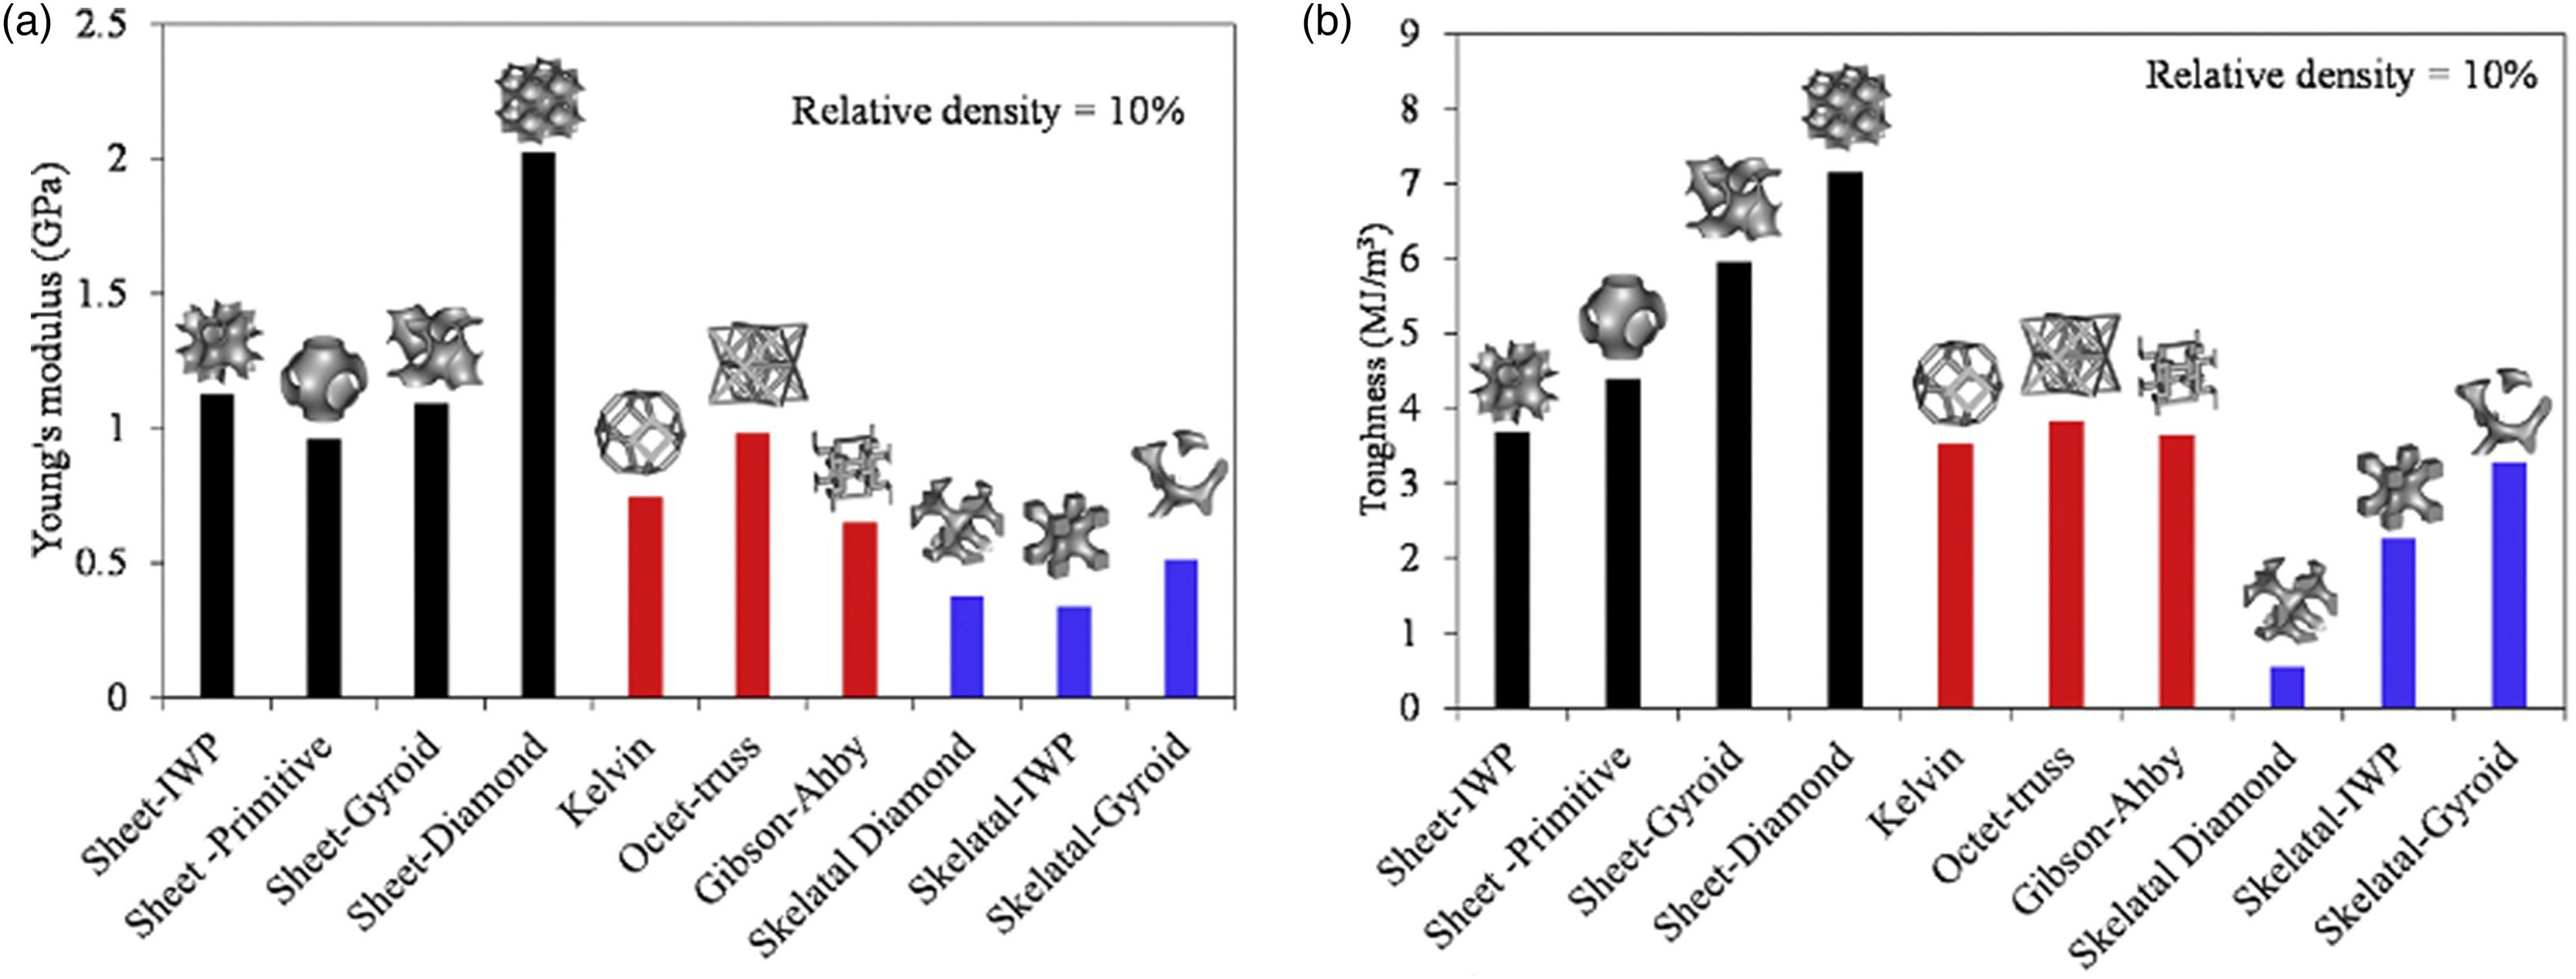
Min et al. (2019b) conducted tensile strength tests for different micro-straight pore array structures to determine the effects of the pore diameter, pore interval, and pore distribution. The results showed that the tensile strength was higher when the pore size was larger due to the smaller stress concentration. The strength of a staggered arrangement was higher than that of an aligned arrangement. A larger pore interval was beneficial for the strength. Al-Ketan et al. (2018a) compared the mechanical performance of three structures, as shown in Figure 9. The compressive load was applied along the printing direction and the strength test results indicated that the deformation behavior was dominated by the tensile strength for the shell TPMS porous structure, whereas the deformation behavior was dominated by bending for the skeleton TPMS. The stiffness of the D type shell porous structure was almost independent of the relative density. In fact, the D type shell porous structure exhibited the highest mechanical performance. As shown in Figure 10, the rod porous structure based on Kelvin and Gibson-Ashby exhibited mixed deformation behavior. Overall, the shell-based TPMS porous structure had better mechanical properties than the other structures.
Figure 9.
3D printed cellular structured samples with different topologies (Al-Ketan et al., 2018a). (a) Strut-based cellular structures.(b) Skeletal-TPMS based cellular structures. (c) Sheet-TPMS based cellular structures.
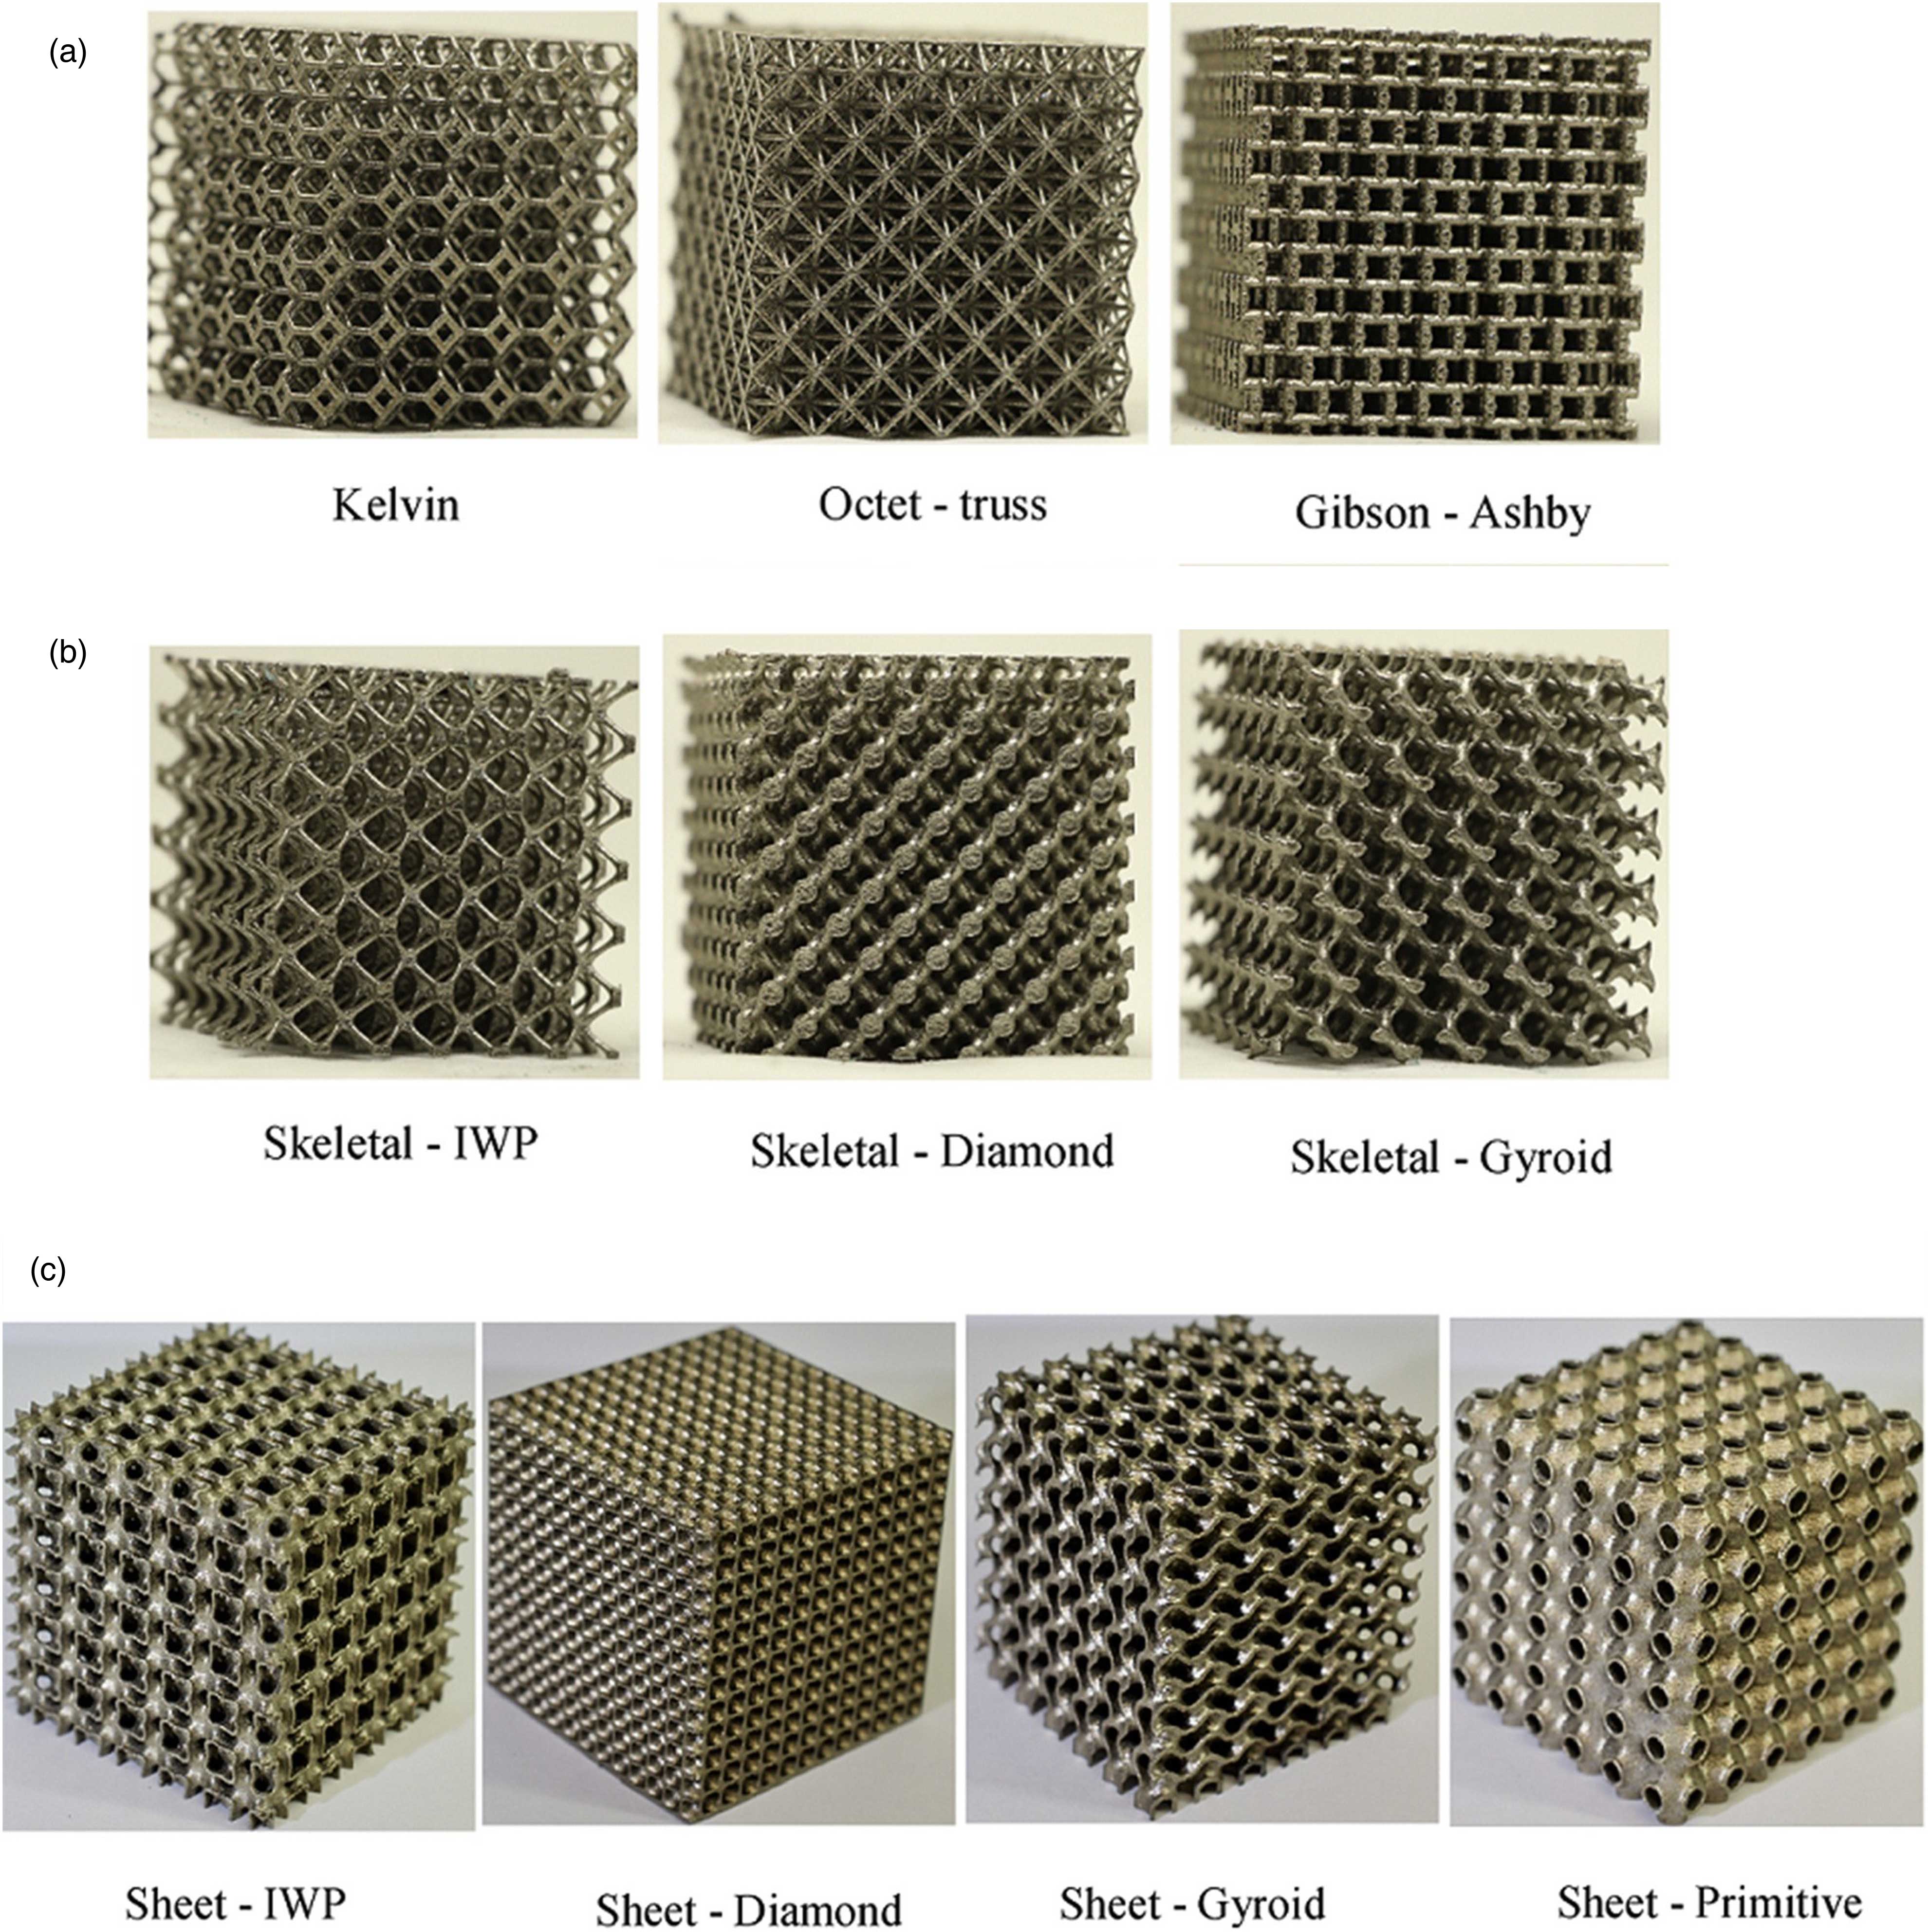
Figure 10.
Young's modulus and toughness of the studied cellular structures (Al-Ketan et al., 2018a). (a) Young's modulus. (b) Toughness.
Zheng et al. (2014) proposed ultra-light and ultra-stiff porous materials based on the octet-truss lattice and Kelvin cell lattice, as shown in Figure 3b, which provided a new idea for the design of functional materials in the aerospace field, especially porous structures used in transpiration cooling system. The Kelvin cell based rod-shaped porous material exhibited different structures in the 3D space and its stress distribution varied with the load direction. Mills (2007) studied the stress distribution of a Kelvin cell in different force directions. Maskery et al. (2018) indicated that the P type structure had the highest stiffness (elastic modulus). They showed that the P type is recommended for high rigidity and high strength structures under a determined load direction. Types D and G were recommended if the structure needs to undergo considerable deformation before failure. Al-Ketan et al. (2018b) constructed shell-core cellular composite structures based on TPMS (with a soft core wrapped by a hard outer shell). The materials and proportions in the two structures can be adjusted according to different application requirements. In their study, a 3D printer could print the two materials simultaneously (one soft material and one hard material).
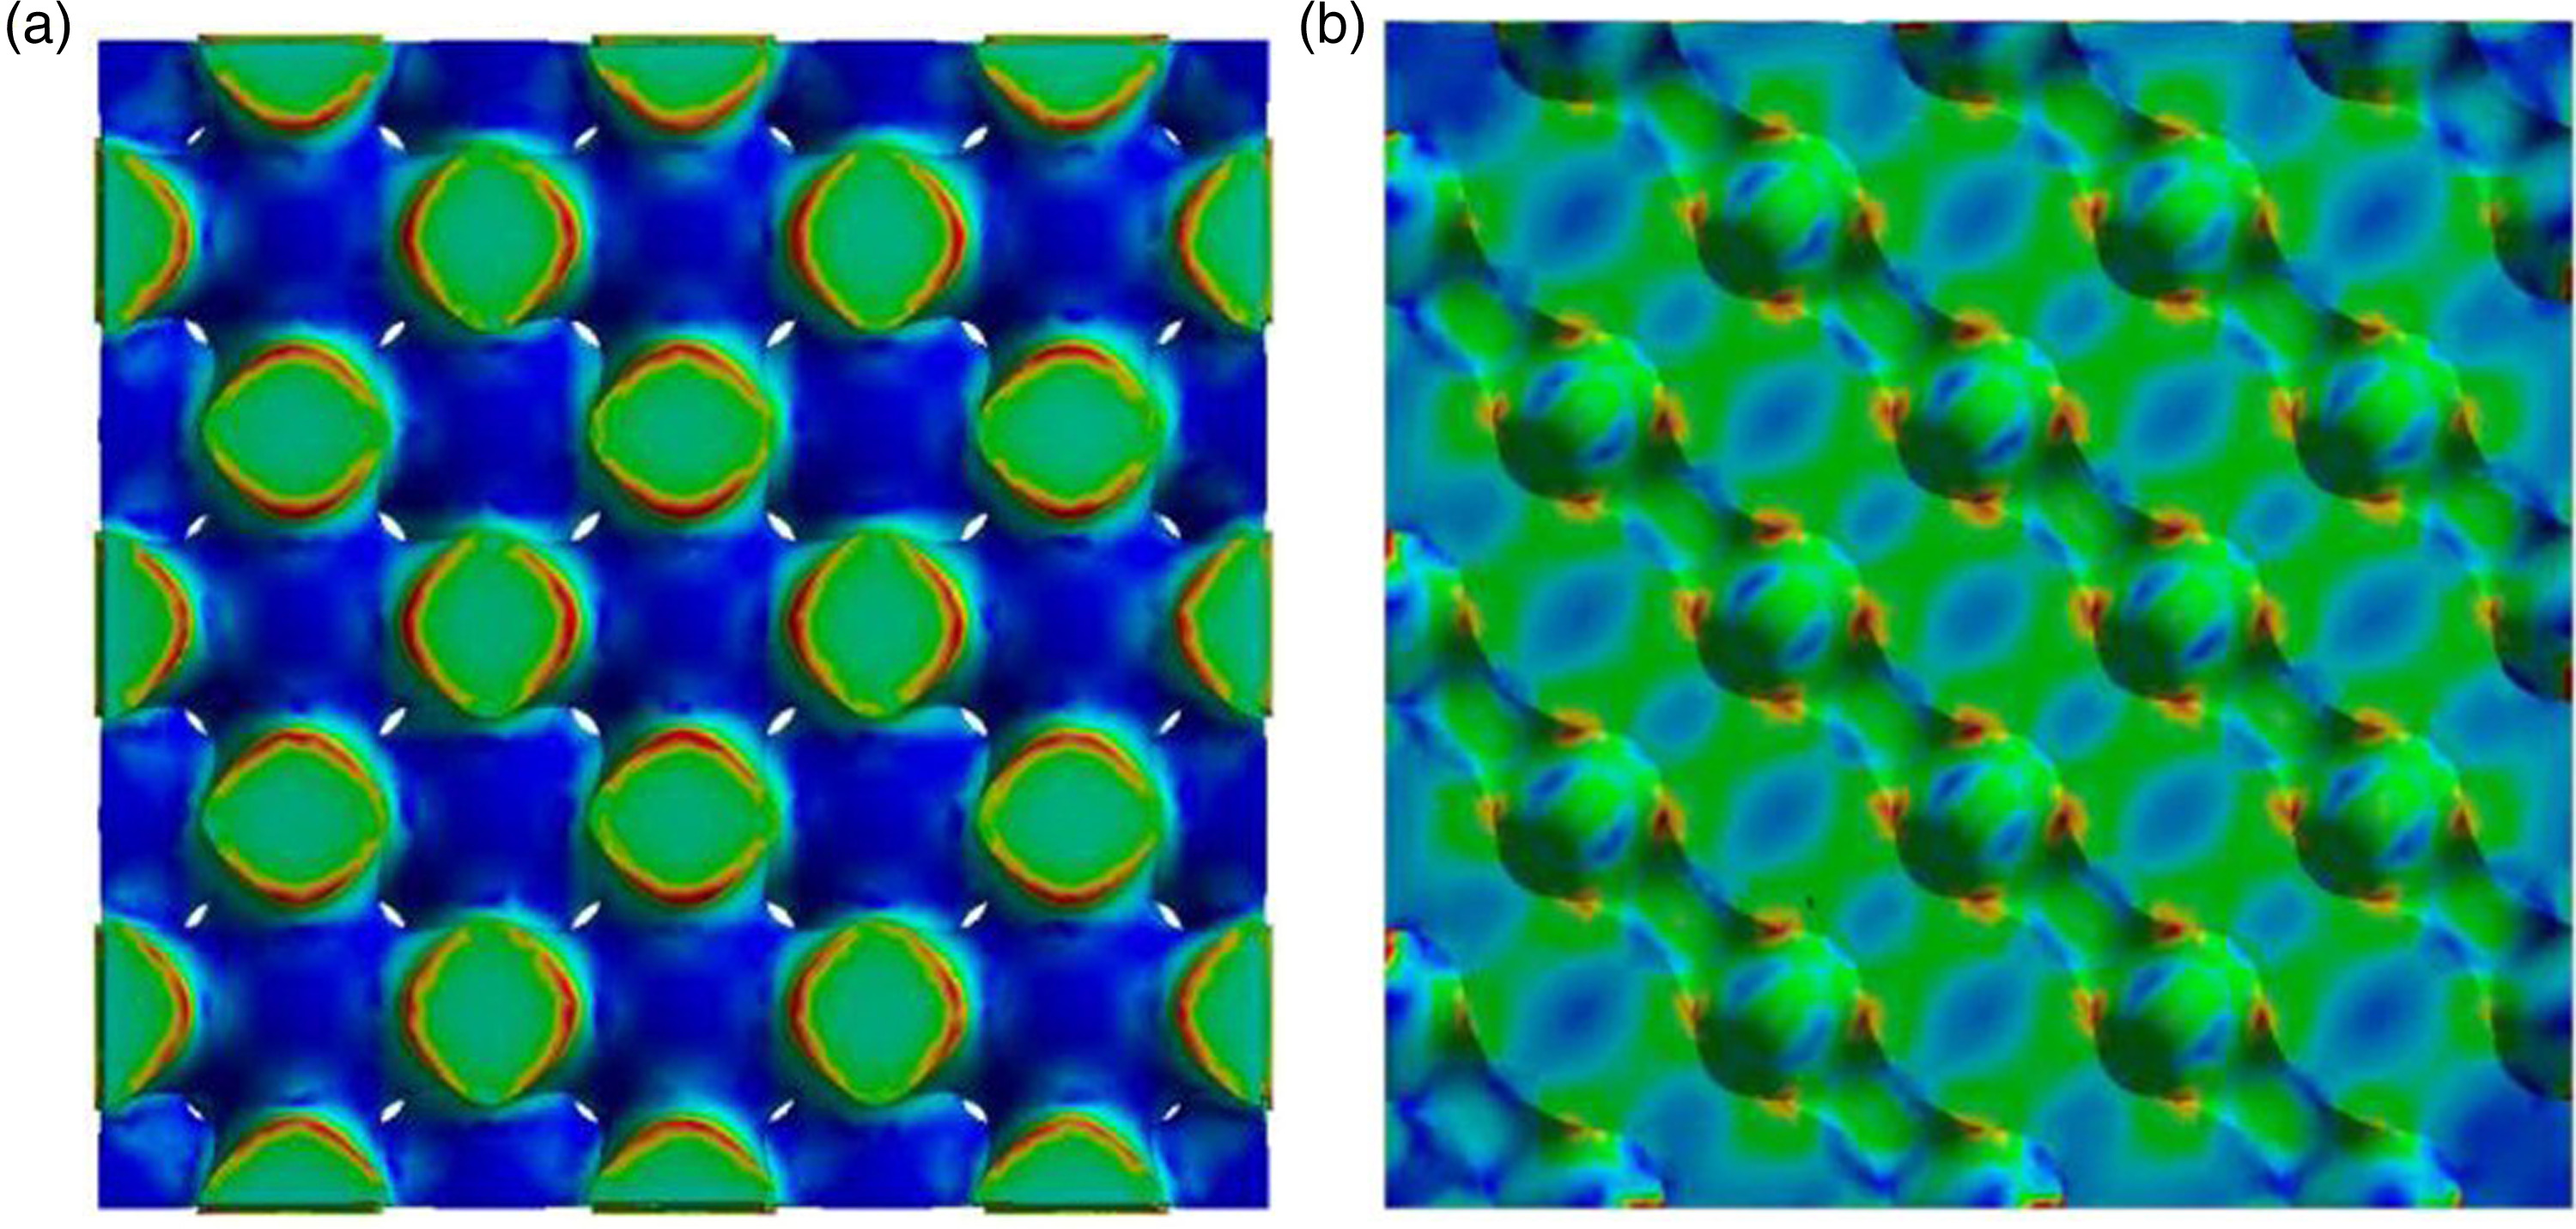
Cheng et al. (2021b) conducted tensile and bending experiments using TPMS porous structures. Five types of printing structures were tested comprising W type, P type, D type, G type, and a solid structure printing material made of high temperature-resistance photosensitive resin. The results showed that the bending strengths of the four porous structures followed the order of: σb,G > σb,D > σb,W > σb,P. The strength of the G type porous structure was highest and much higher than that of the P type structure. The tensile test results also satisfied the relationship given above. The tensile strengths of the W type and D type structures were 4.81 and 5.83 MPa, respectively. In both the tensile strength and bending experiments, the porous media samples carried the load with a solid skeleton, and its failure usually occurred in the section with the weakest bearing capacity. Considering the P type unit as an example, multiple slices were extracted from a pore unit along one direction, as shown in Figure 11, where the red part is the solid area and the green part is the pore area. The ratios of the solid area relative to the cross-sectional area (Ss/Sc) were calculated at 20 positions in four TPMS pore units, as shown in Figure 12. The Ss/Sc values for P type and W type structures varied significantly from 0.19 to 0.82 and 0.28 to 0.69, respectively. The Ss/Sc values for D and G structures varied within a very narrow range (0.52–0.57). Figure 13 compares the von Mises stress distributions in the weakest cross sections of the W type and D type structures. According to the analysis, the minimum effective bearing area (Ss/Sc) values were determined as 0.28 for the W type structure and 0.52 for the D type structure. Under the same load displacement, the von Mises stress was much more uniform in the D type structure than the W type structure. The maximum stress occurred near the edges of the separated branches in the W type structure but near the edges of the connecting struts in the D type structure. The profile clearly shows that the red area (high stress area) was larger in the W type structure.
Figure 11.
Effective bearing area and pore area at different locations within a type P unit (Cheng et al., 2021b).
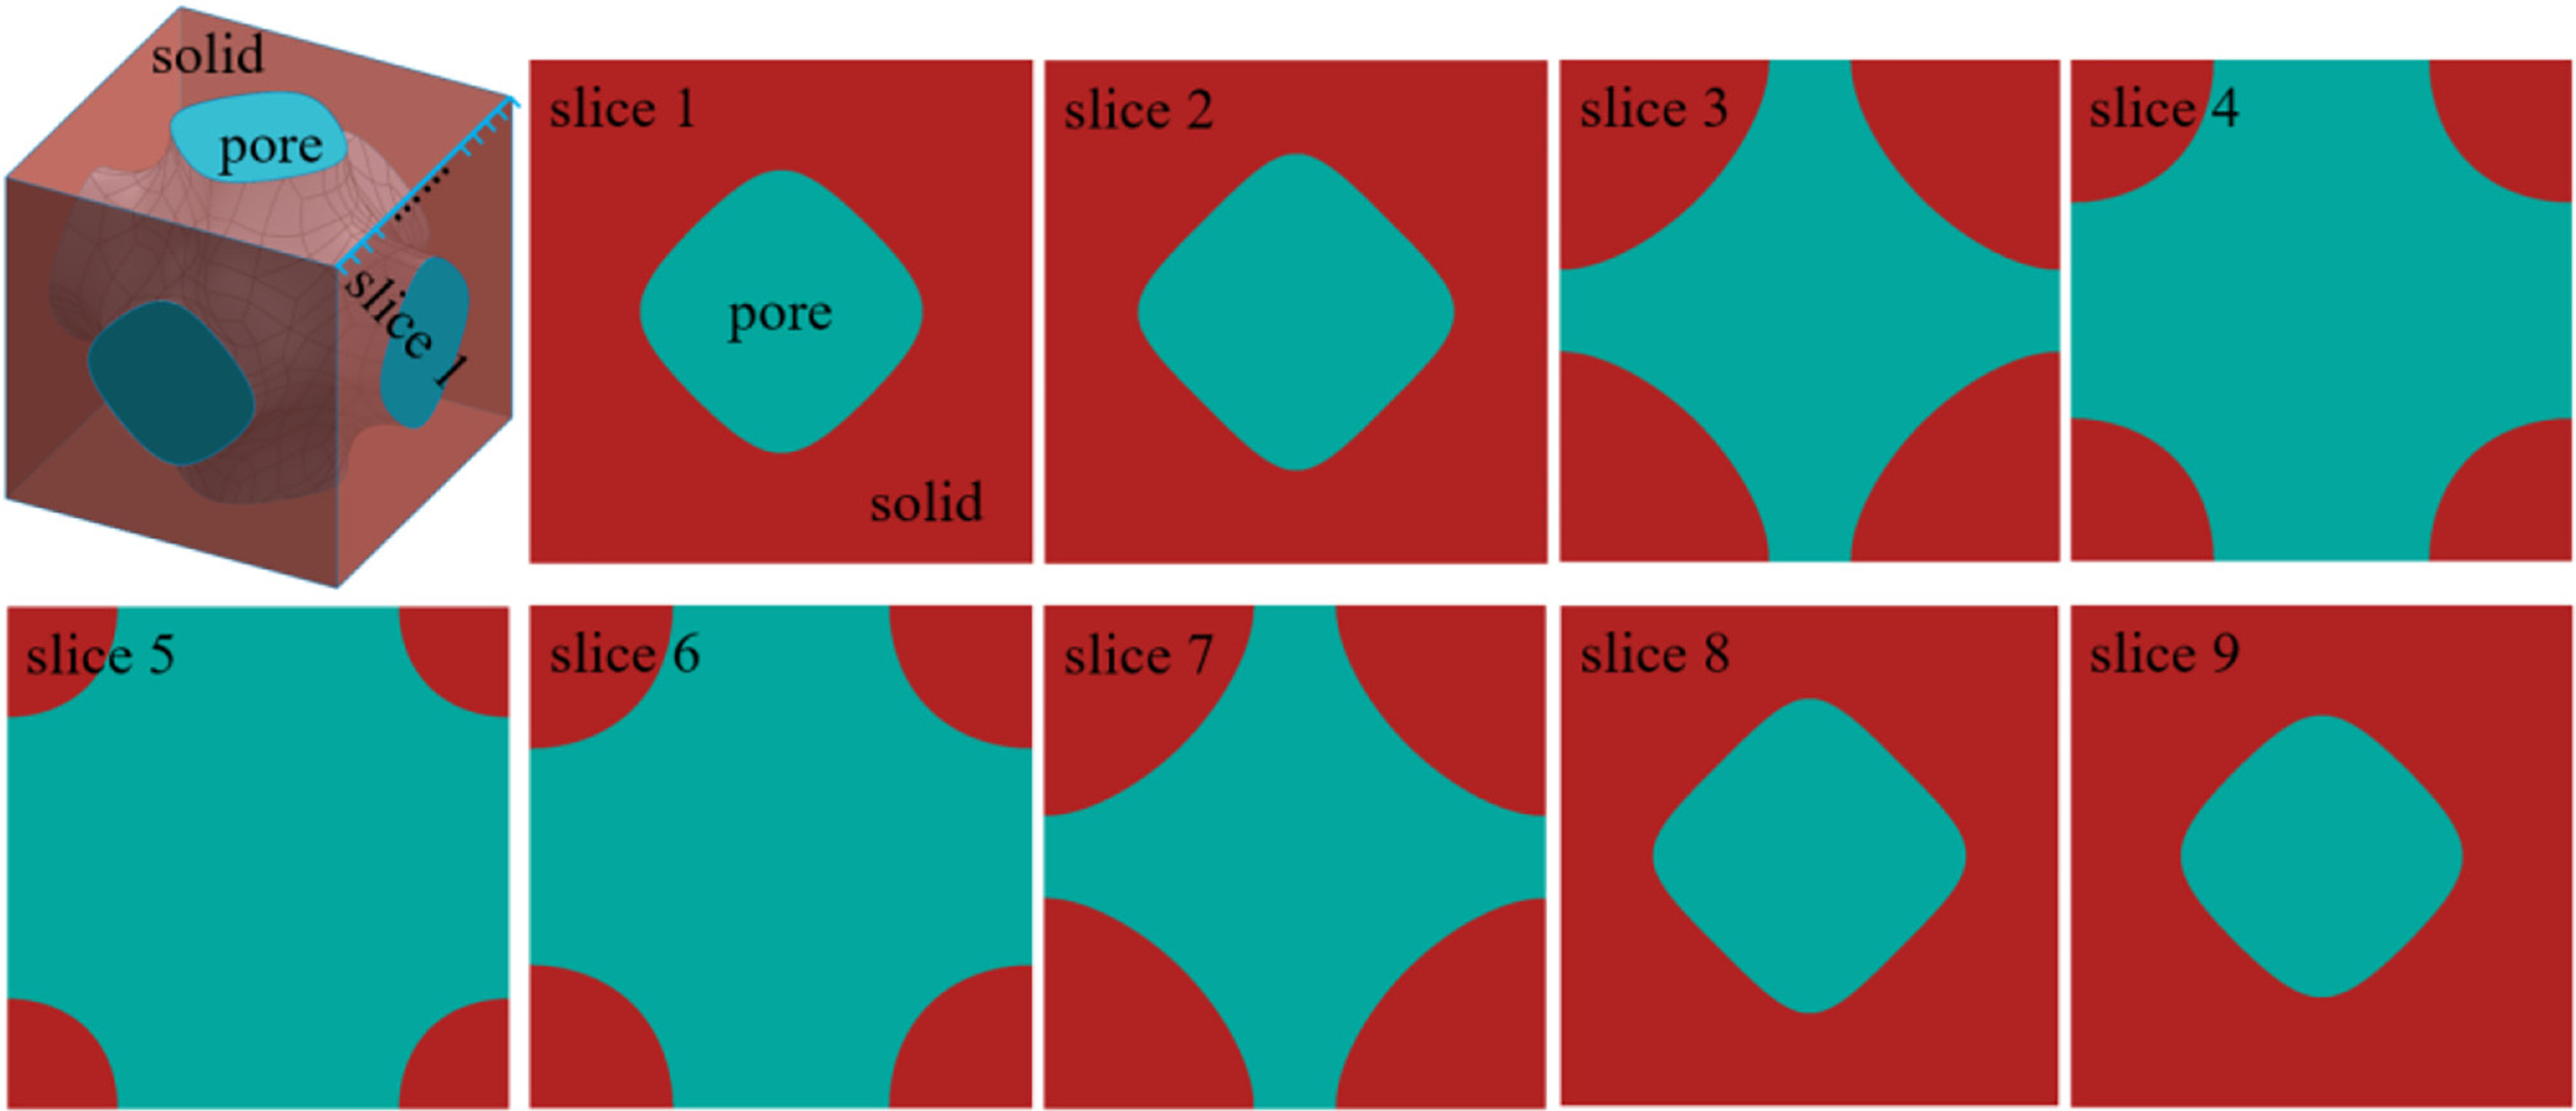
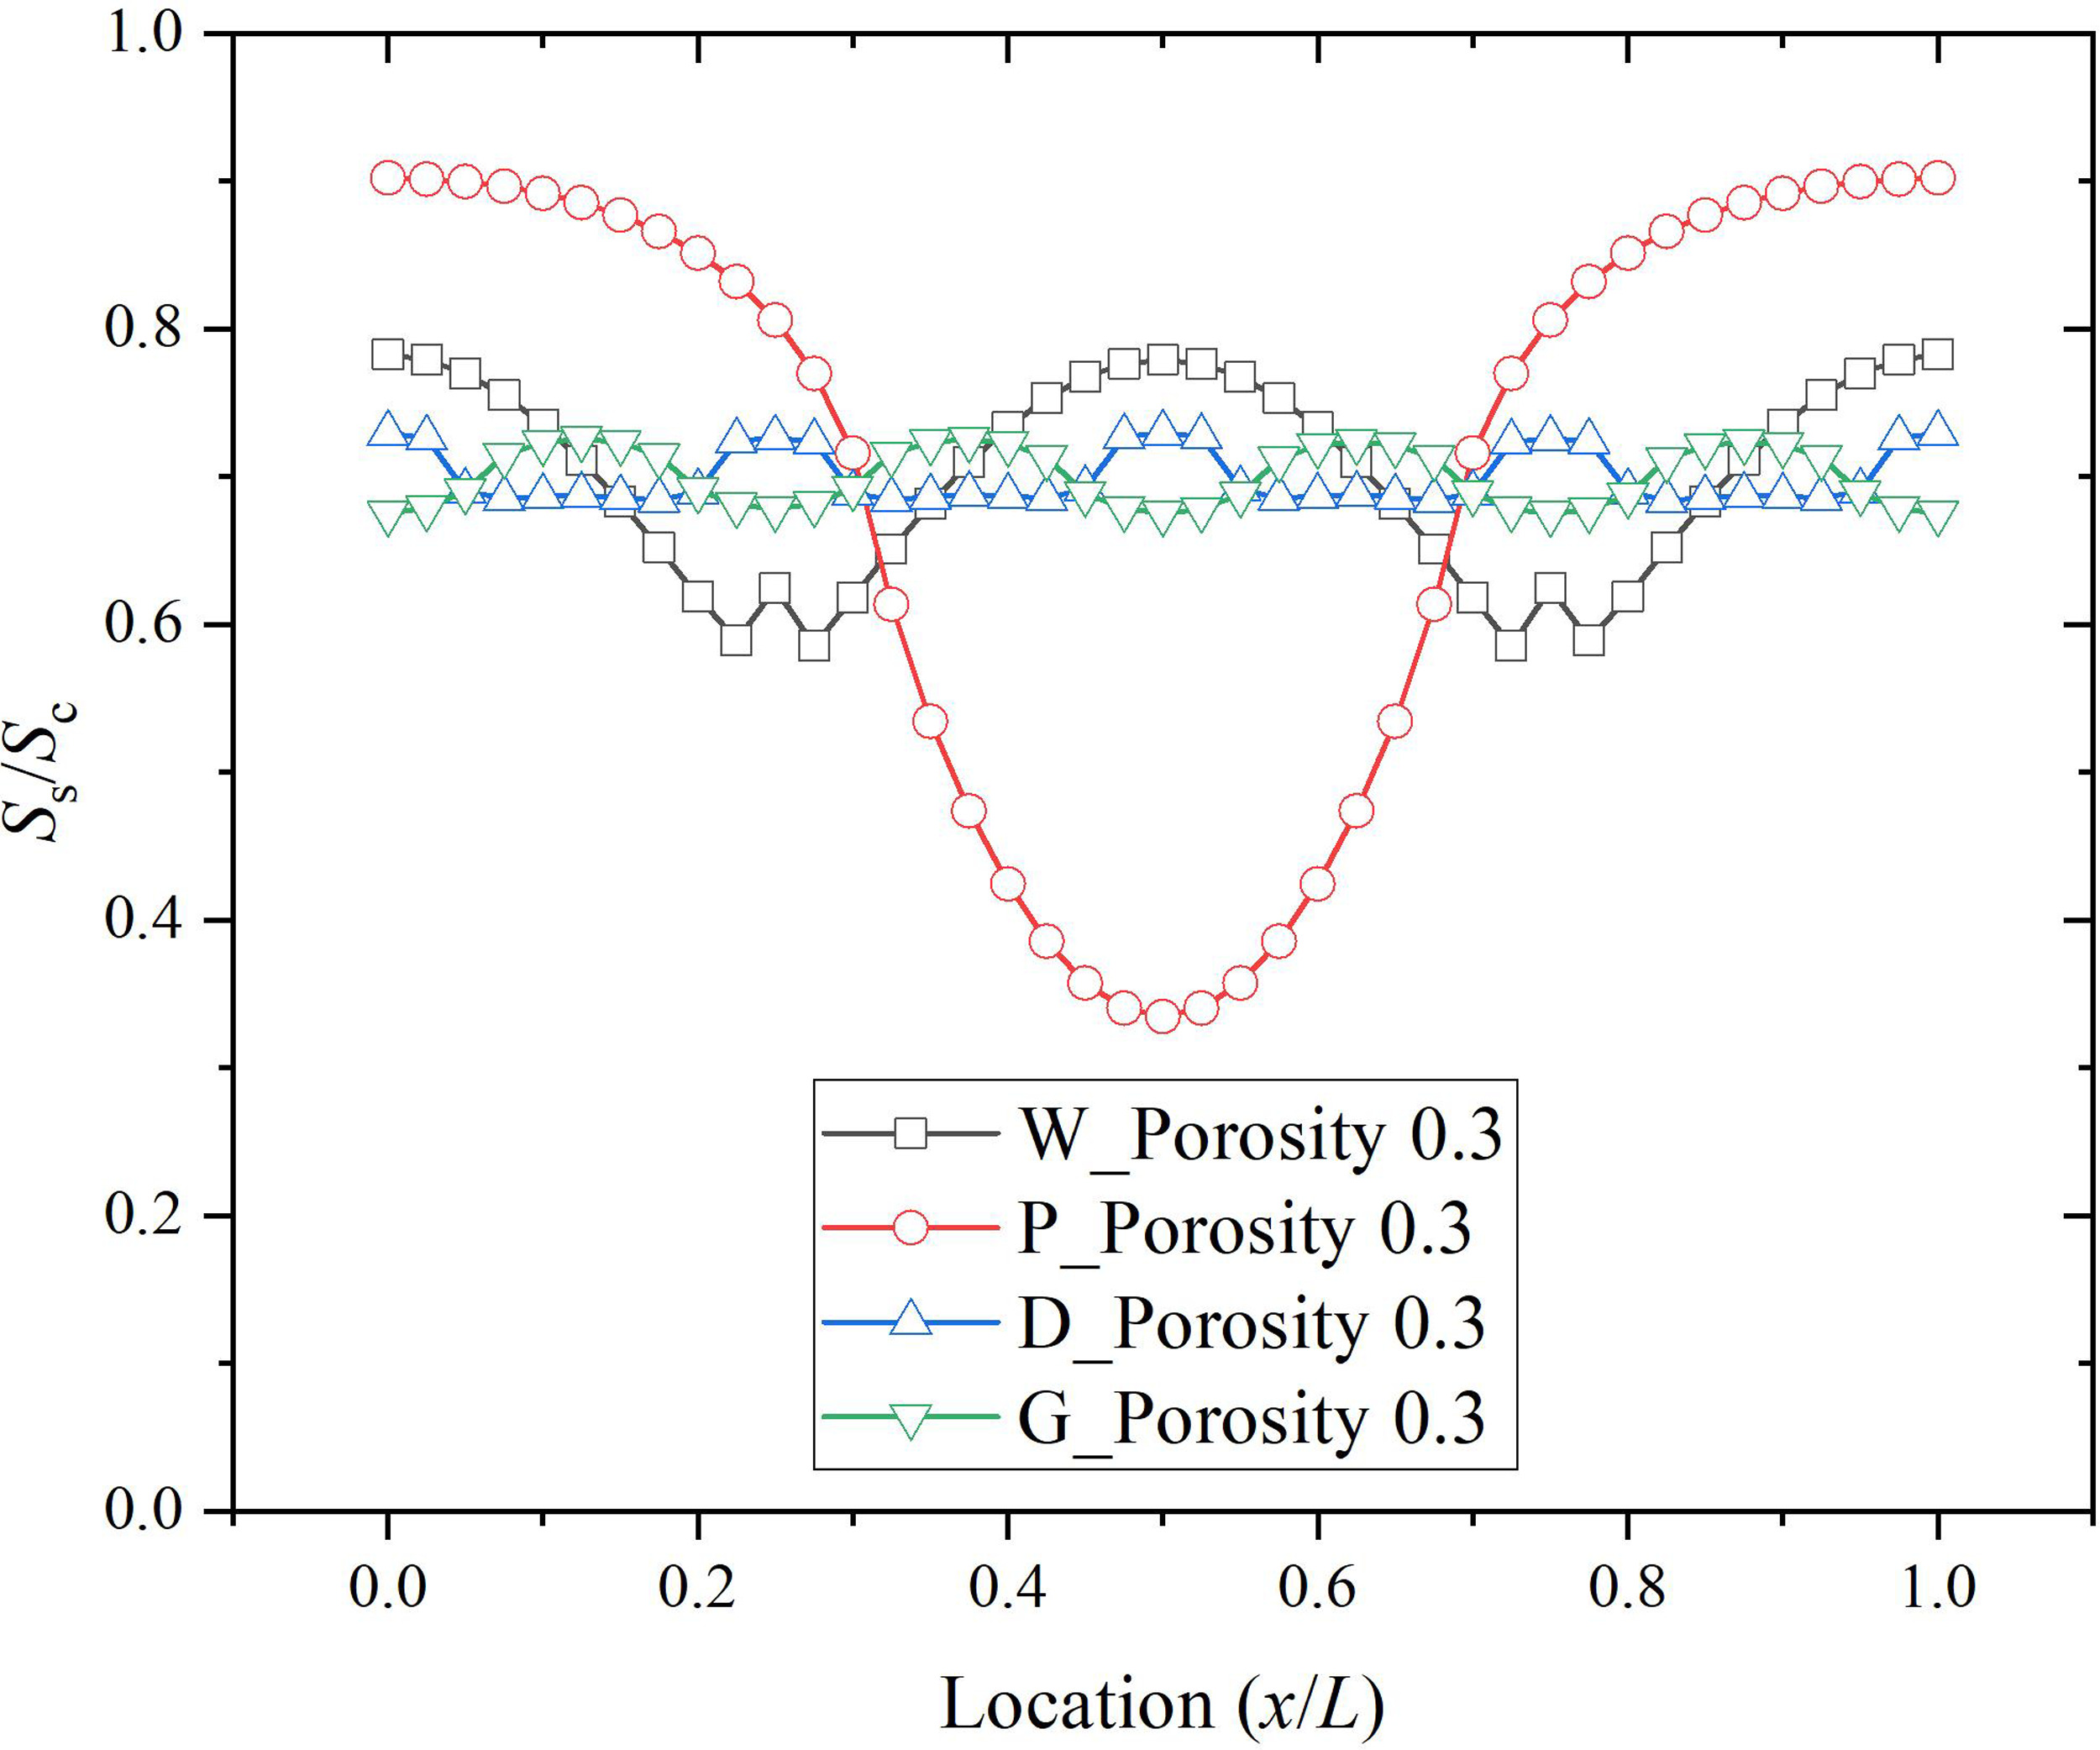
Figure 13.
Stress contours in the weakest cross sections (Cheng et al., 2021b). (a) W type. (b) D type.
Thermal protection applications of additive manufacturing-assisted porous part
Single phase transpiration cooling
Additive manufacturing was linked to transpiration cooling in a previous study and experimental investigations were conducted in a subsonic wind tunnel (Huang et al., 2018e). Metal porous plates were prepared by selective laser sintering and the required geometric structure was finally obtained after selective melting sintering using Inconel 718 as the material. The authors found microscopic metal particles measuring 10–20 µm attached to the inner wall in small holes due to the presence of a heat-affected zone during selective sintering with a laser leading to the melting and adhesion of some unsintered microscopic metal particles in the small holes. These microparticles may be considered equivalent to microribs and they help to increase the specific surface area for heat transfer, enhance the disturbance of the surface, strengthen the heat transfer process, and they could potentially have beneficial impacts on transpiration cooling.
Due to the limitations of traditional manufacturing technology, it is difficult to control the outflow angle of the cooling fluid in the traditional transpiration cooling process for porous materials. Using metal 3D printing, the cooling fluid can be effectively injected into the mainstream at three different angles of 45°, 90°, and 135°. When the injection rate F = 1%, 2%, and 3%, the temperature of the porous surface is slightly lower at θ = 90° than those at θ = 45° and 135°. Thus, when the cooling fluid is injected perpendicular to the mainstream direction, the transpiration cooling effect is better than those with forward injection at 45° and reverse injection at 135°. Figure 14 shows the distribution of the cooling efficiency along the surface of a porous plate under different cooling fluid injection rates and injection angles. The transpiration cooling efficiency is better with a vertical injection angle of θ = 90° than a forward injection angle of θ = 45°, and the cooling efficiency is lowest with a reverse injection angle of θ = 135°. The difference in the cooling efficiency with different injection angles is particularly obvious when the injection rates are F = 1% and 2%. The maximum and minimum transpiration cooling efficiencies of the porous plate surface are higher at θ = 90° than those at θ = 45° and 135°. Thus, injecting the cooling fluid perpendicular to the mainstream is better for transpiration cooling than forward injection and reverse injection.
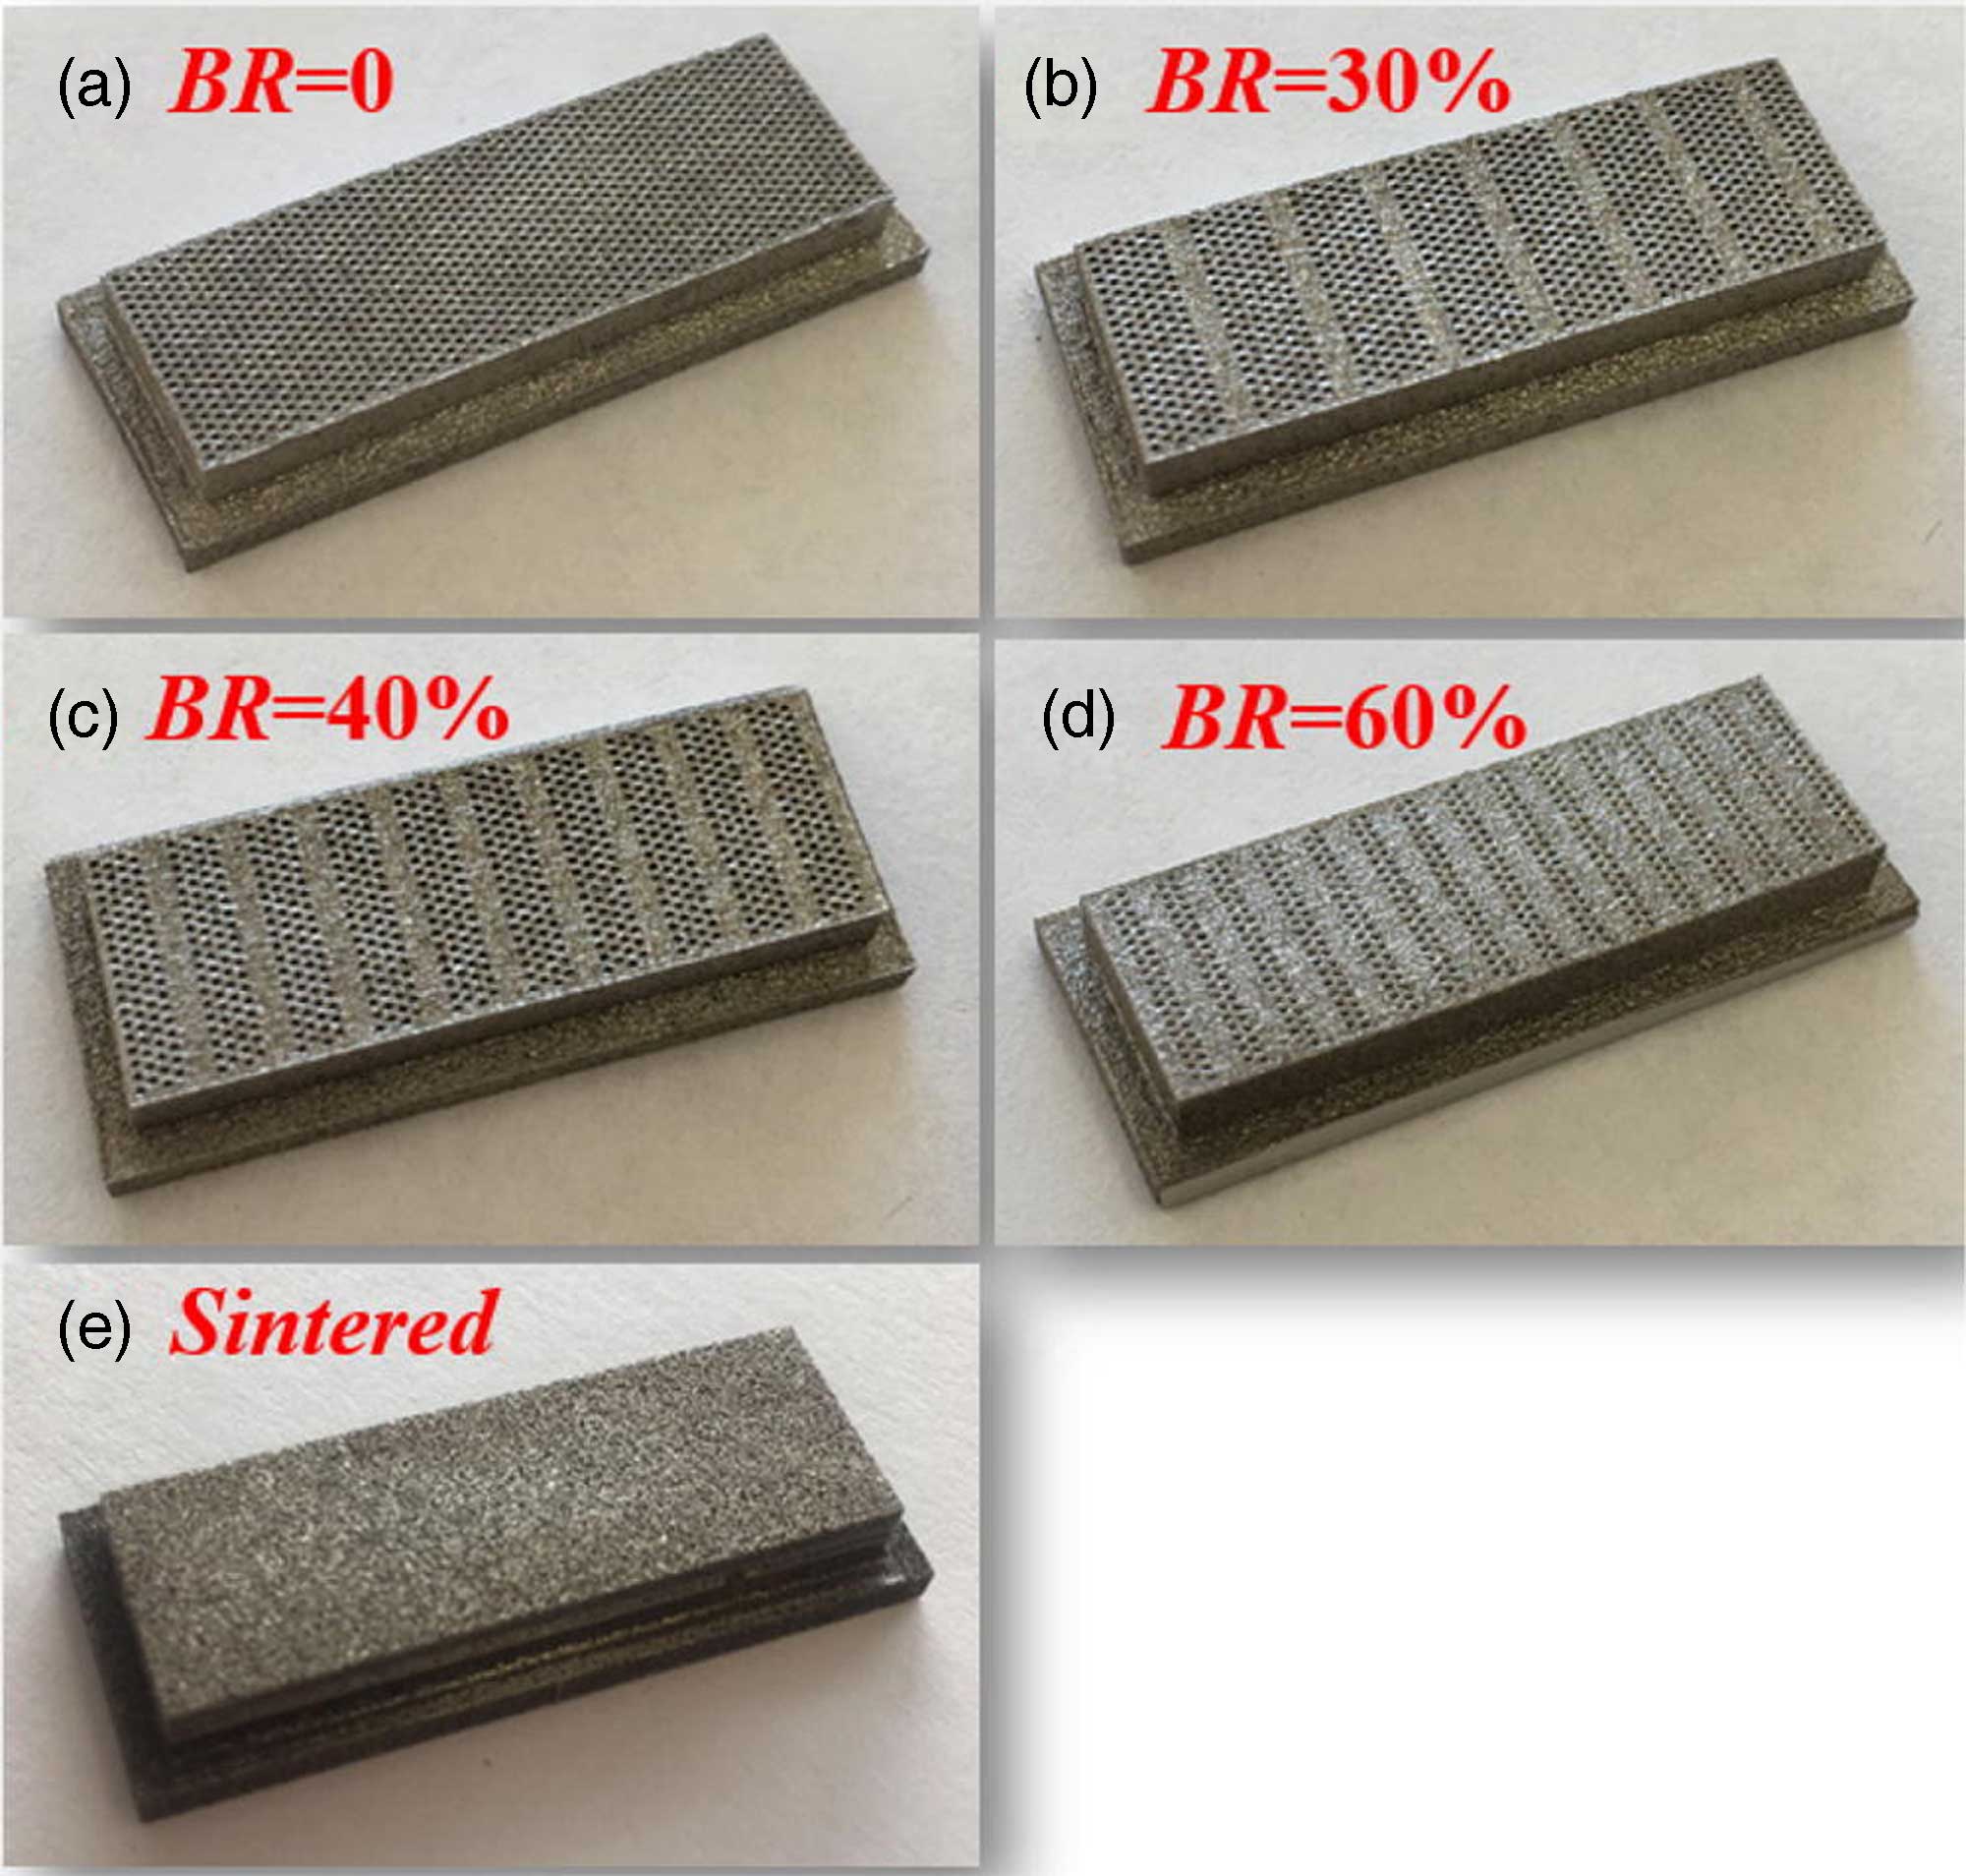
The researchers investigated the transpiration cooling effect for 3D printed porous plates with stiffeners that had different stiffener densities, i.e., blocking ratios (BRs) of 30%, 40%, and 60%, and compared them with porous plates without stiffeners (BR = 0%) and traditional sintered porous plates. BR indicates the density of the stiffener, where the stiffener is denser when BR is larger. When the coolant blowing ratio was F = 1%, the temperature distribution on the porous plates was very similar with different BRs, and the surface temperatures of the porous plates did not increase when BR increased for the stiffeners. When the coolant blowing ratio increased to F = 2%, the surface temperatures of the porous plates decreased, and the surface temperature of the porous plate was slightly lower with BR = 0% compared with the other porous plates. When the coolant blowing ratio increased to F = 3%, the surface temperature of the porous plate decreased further. The surface temperatures of the porous plates increased slightly as the BR of the stiffener increased but the temperature distributions were relatively uniform on the surfaces of all the porous plates. For the porous plates with stiffener BRs up to 60%, no striped local high-temperature area was found in the stiffener area on the surface of the porous plate, mainly because the upstream cooling gas film covered the surface of the stiffener better. In addition, heat conduction by the metal material allowed heat to radiate around the stiffener area to fully cool the stiffener part.
where Tw is the wall temperature of the porous plate, T∞ is the mainstream flow temperature, Tc is the inlet coolant temperature, ρc is the coolant density, uc is the average coolant velocity, ρ∞ is the mainstream flow density, u∞ is the average mainstream flow velocity, δ1 is the width of the partition wall, δ2 is the interval between two nearby partition wall.
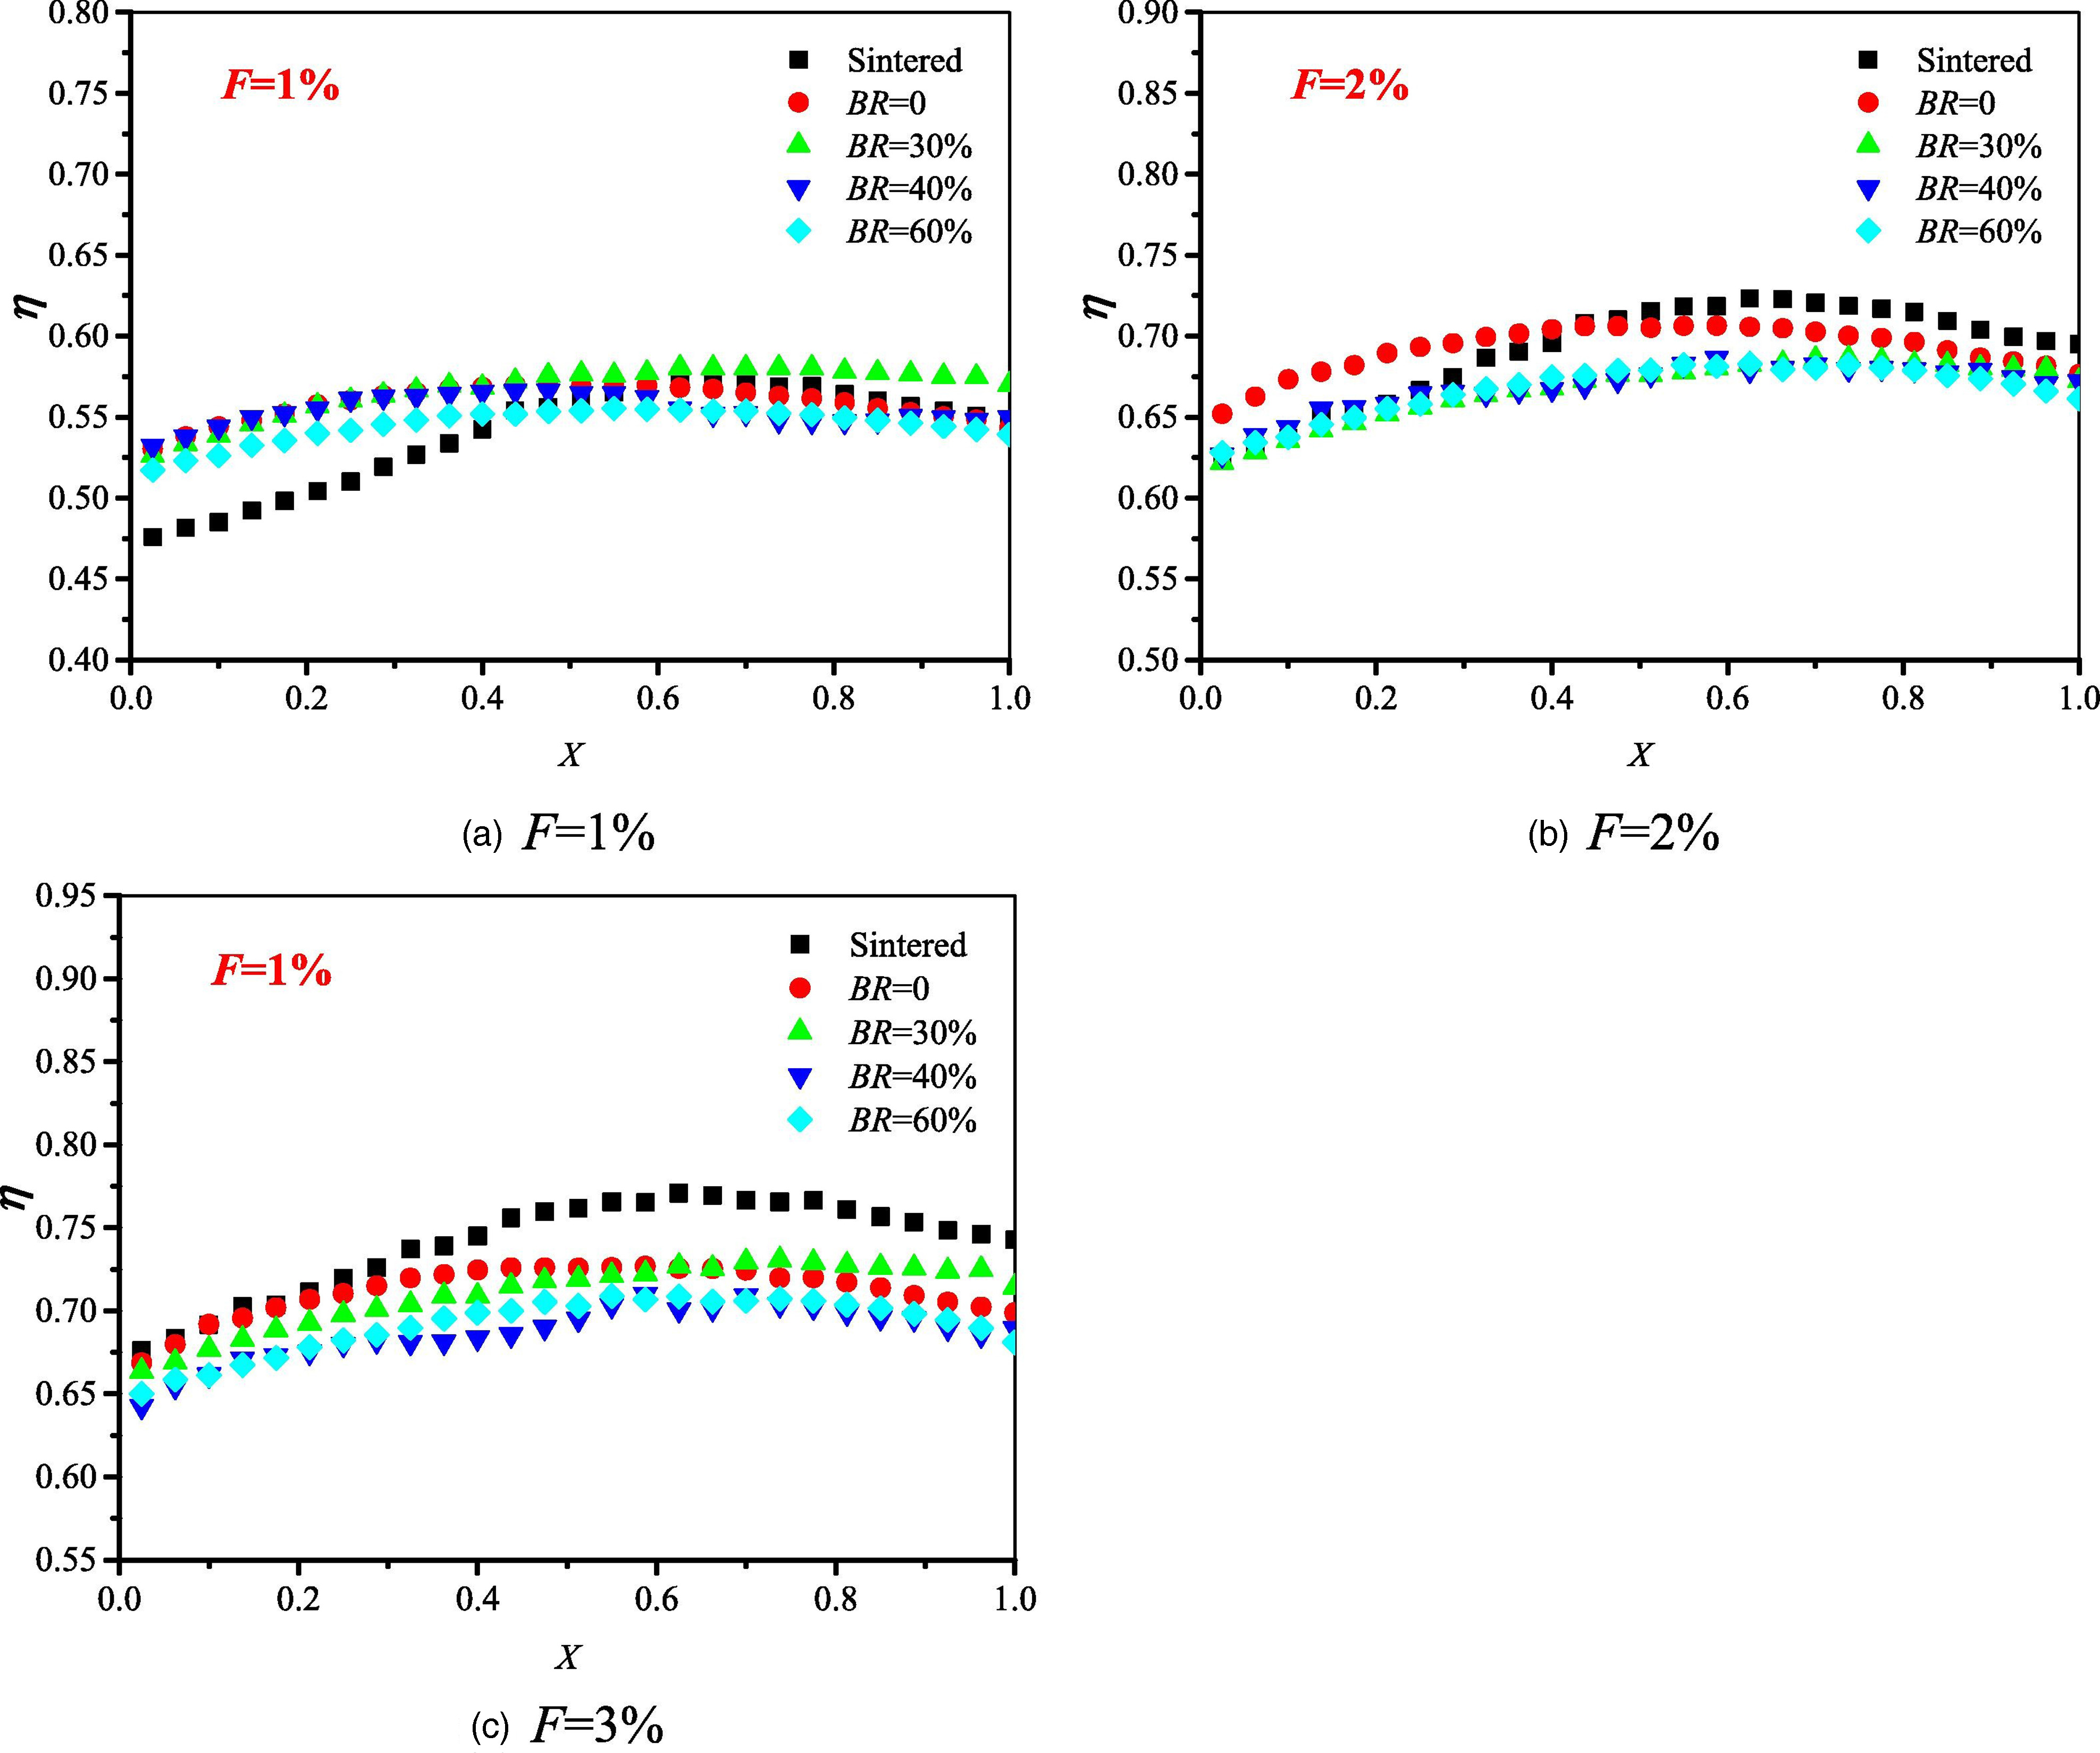
Figure 15 shows the distributions of the transpiration cooling efficiency along the surfaces of porous plates with BR = 0%, 30%, 40%, and 60% at coolant blowing ratios of F = 1%, 2%, and 3% compared with the transpiration cooling efficiency of traditional sintered porous plates. When the coolant blowing ratio was F = 1%, the stiffener BR had little effect on the cooling efficiency. Due to the good heat conduction effect of the 3D-printed porous plate, the cooling efficiency distribution was highly uniform, and the cooling efficiency of the front end of the 3D-printed porous plate was slightly higher than that of the sintered porous plate. When the coolant blowing ratio was F = 2%, the cooling efficiency of the porous plate with BR = 0% was similar to that of the sintered porous plate but slightly higher than that of the porous plates with stiffeners. When the coolant blowing ratio was F = 3%, the stiffener BR had little effect on the transpiration cooling efficiency and the overall temperature distribution was more uniform. In addition, the cooling efficiency of the sintered porous plate was slightly higher than those of the 3D-printed porous plates with stiffeners. When the stiffener BR increased from 0% to 60%, the transpiration cooling efficiency of the 3D-printed porous plates changed little.
Figure 15.
Transpiration cooling efficiency distributions for sintered and 3D printing porous plates (Huang et al., 2018e).
In the past 50 years, film cooling technology has improved significantly but transpiration cooling has still been not achieved for turbine airfoil cooling. Transpiration cooling can provide high cooling efficiency and consume less coolant but the preparation of appropriate porous materials has hindered its application. In recent years, the rapid development of additive manufacturing has provided a new approach to address this challenge. Maskery et al. (2018) used additive manufacturing technology to prepare transpiration cooling and gas film cooling structures with Inconel 718, including two types of porous plates with differences in the pore spacing, metal particle accumulation, metal mesh, and vascular channels for transpiration cooling, as shown in Figure 16 (Min et al., 2019a). All the cooling structures were built in the thin Inconel wall with dimension of 30 mm × 12 mm × 3.2 mm. The flow velocity of heating air was kept constant at 11 m/s (Re = 98,000). The temperature of the mainstream flow was set to be 45°C, 50°C, 55°C and 60°C. The secondary coolant flow was provided by a compressed air supply source at room temperature (21°C) and three different inject ratios (F), 1.2%, 2.4% and 3.6% were chosen as three different working conditions. The porous structures for transpiration cooling were shown in Figure 18, including round holes with pitch of 3D (RH-3D), round holes with pitch of 2D (RH-2D), spheres packing (SP), wire mesh (WM) and blood vessel shaped (BV), which were compared with the film cooling plate (FM). A rear fan-shaped film cooling test piece was also prepared using the same printing process for use as the control. Heat transfer tests were conducted at three different coolant mass flows and four different mainstream temperatures to evaluate the cooling performance of the printed samples. In addition, the effects of geometric parameters were studied, such as the porosity, outlet area ratio, and specific surface area of the porous structure. The results showed that the cooling efficiency of the transpiration cooling structure was higher than that of the film cooling structure. Analysis of the morphological parameters showed that the internal solid–liquid interface area ratio was the main factor that affected the transpiration cooling effect. These findings demonstrate that transpiration cooling by additive manufacturing may be a promising alternative to turbine blade cooling, and thus further research is merited.
Figure 16.
Illustration of the C3X blade test specimen: (a) dimensions of the exterior, (b) configuration of the internal cooling channel. Features of the fabricated surface for (c) effusion cooling and (d) transpiration cooling (Kim et al., 2021).
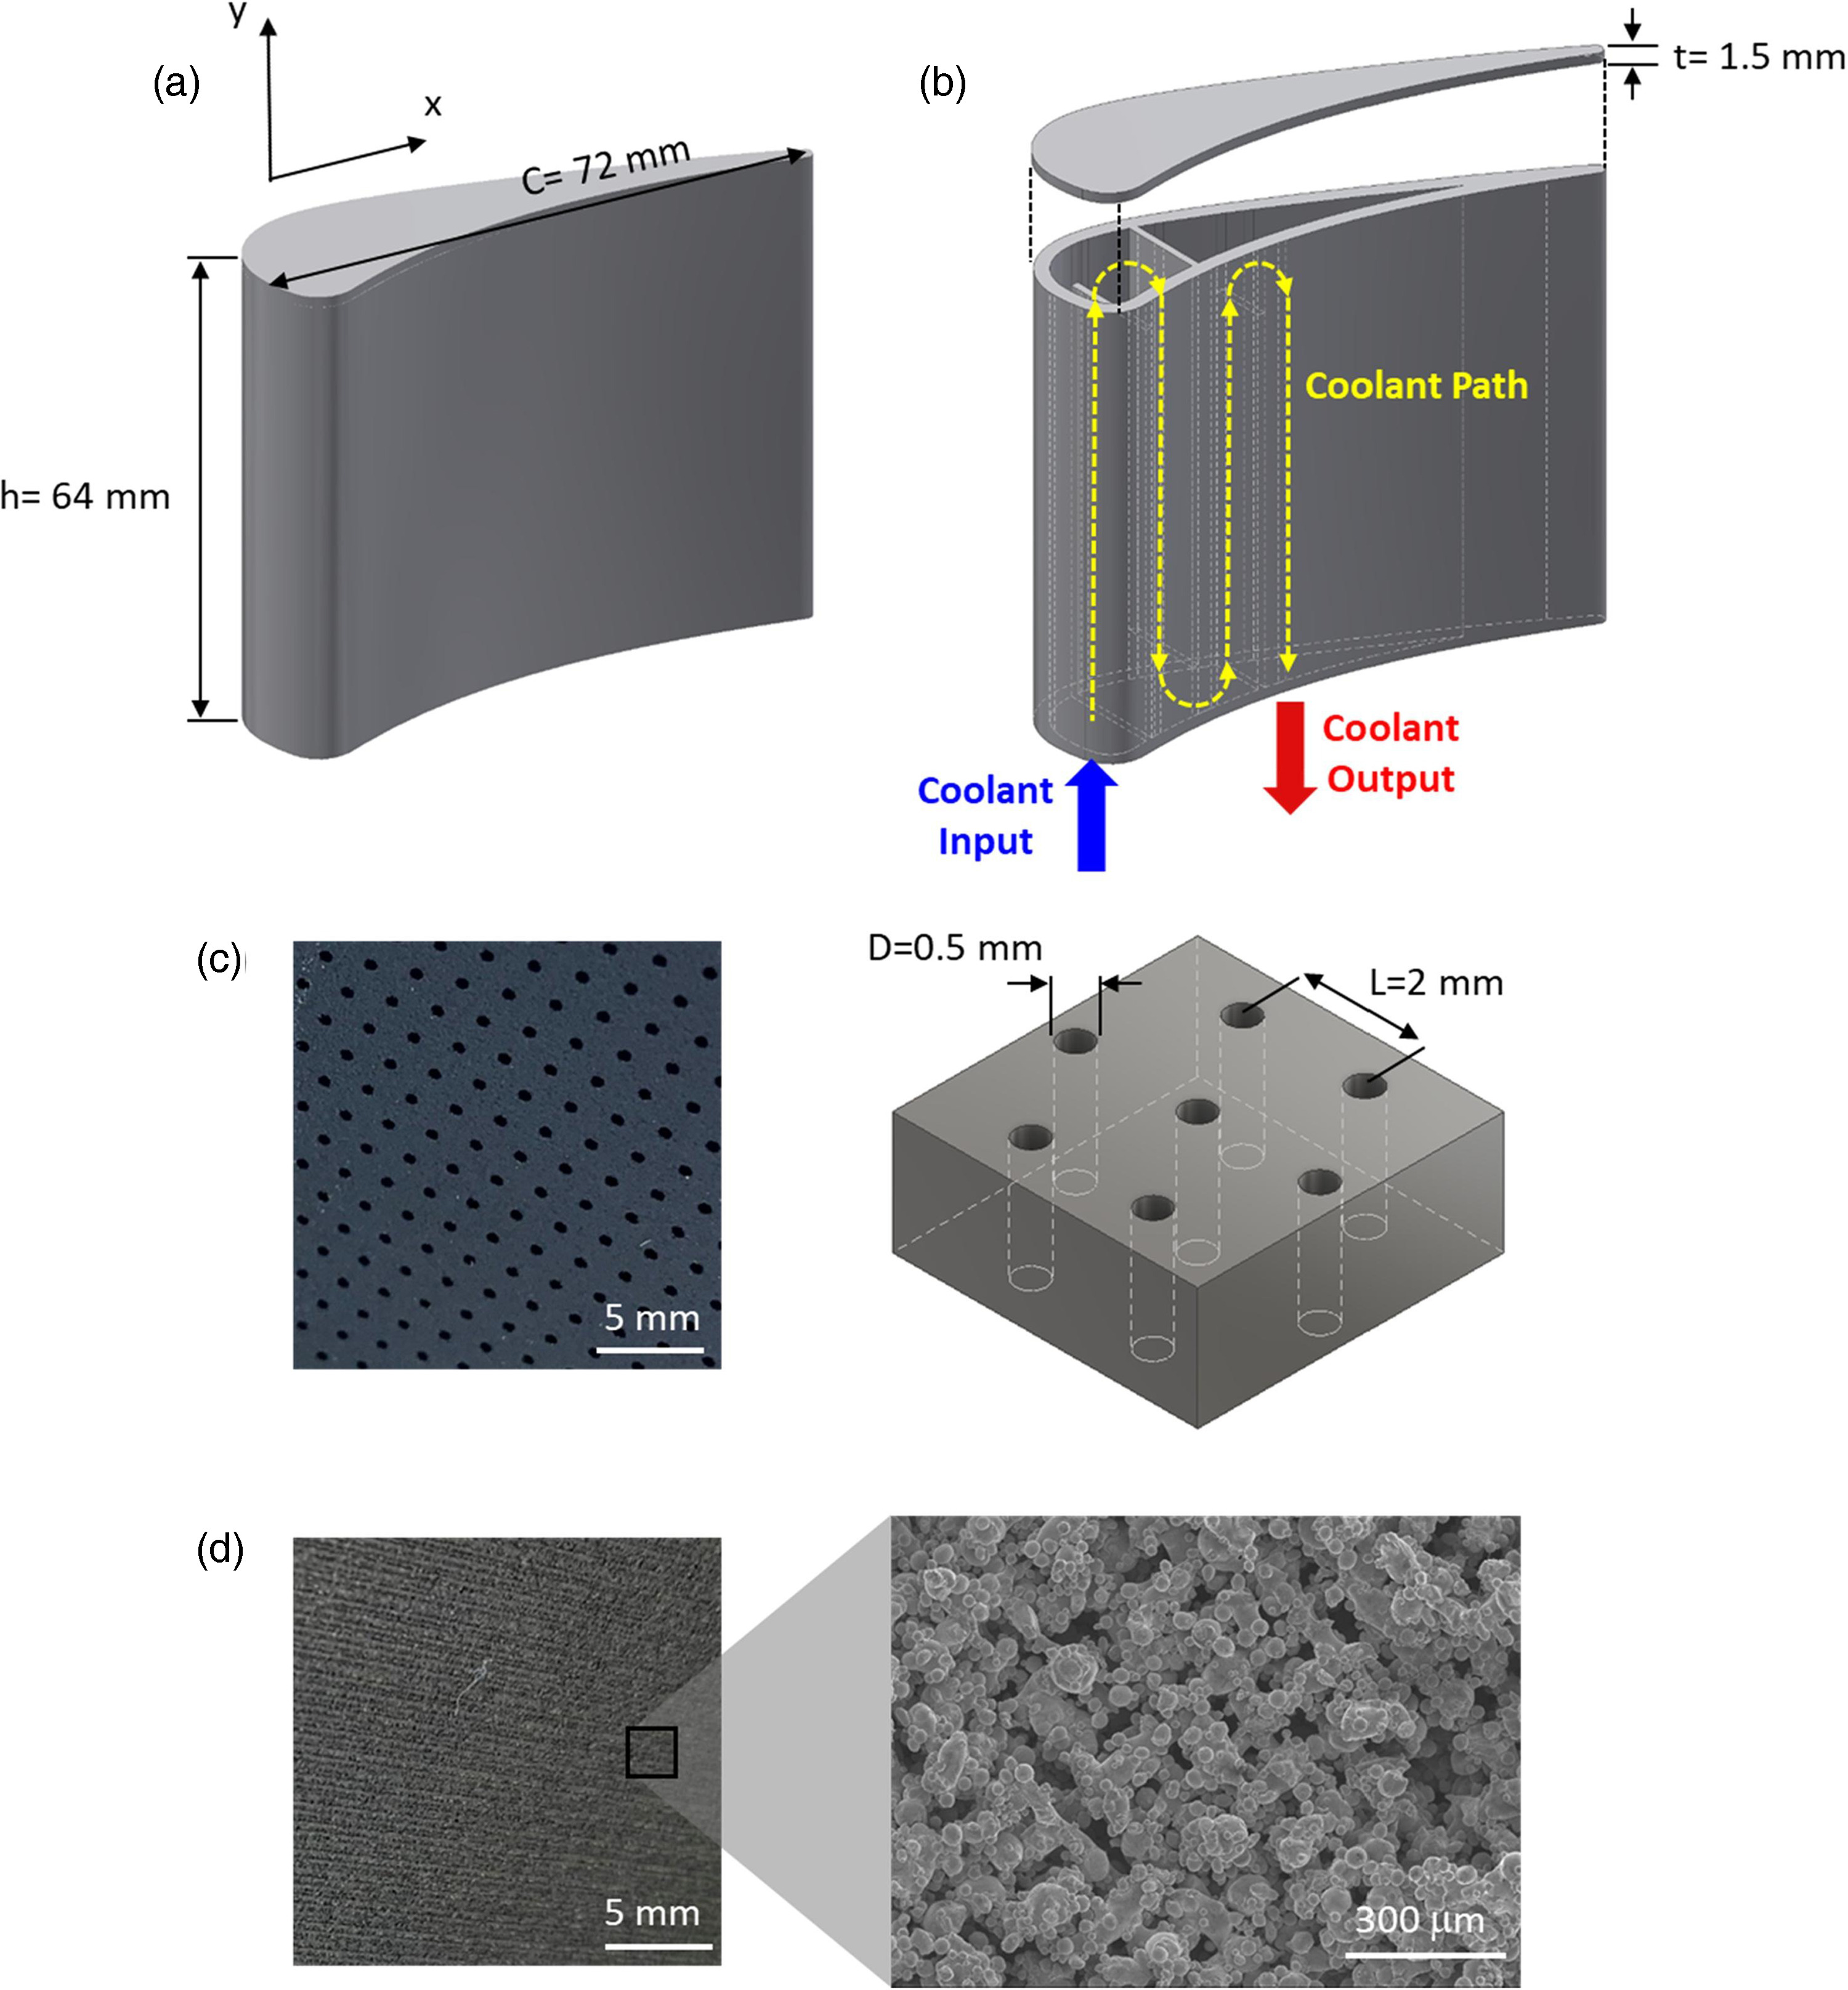
Figure 18.
The overall cooling effectiveness distribution of the transpiration cooling at different coolant volume flow rates: (a) the pressure-side, (b) the suction-side, and (c) the leading-edge (Kim et al., 2021).
As described in previous studies (Kim et al., 2021, 2022a,b), a porous array with a diameter of 0.5 mm was prepared by electrical discharge machining and an equivalent aperture of 40 µm was obtained using the metal additive manufacturing method, as shown in Figure 16, before investigating divergent and transpiration cooling for a single turbine C3X blade. The experiment was conducted in a high-temperature subsonic wind tunnel with a free flow temperature of 100°C, and the results showed that the cooling efficiency of transpiration cooling was 34% and 25% higher than those of divergent cooling and internal cooling, respectively.
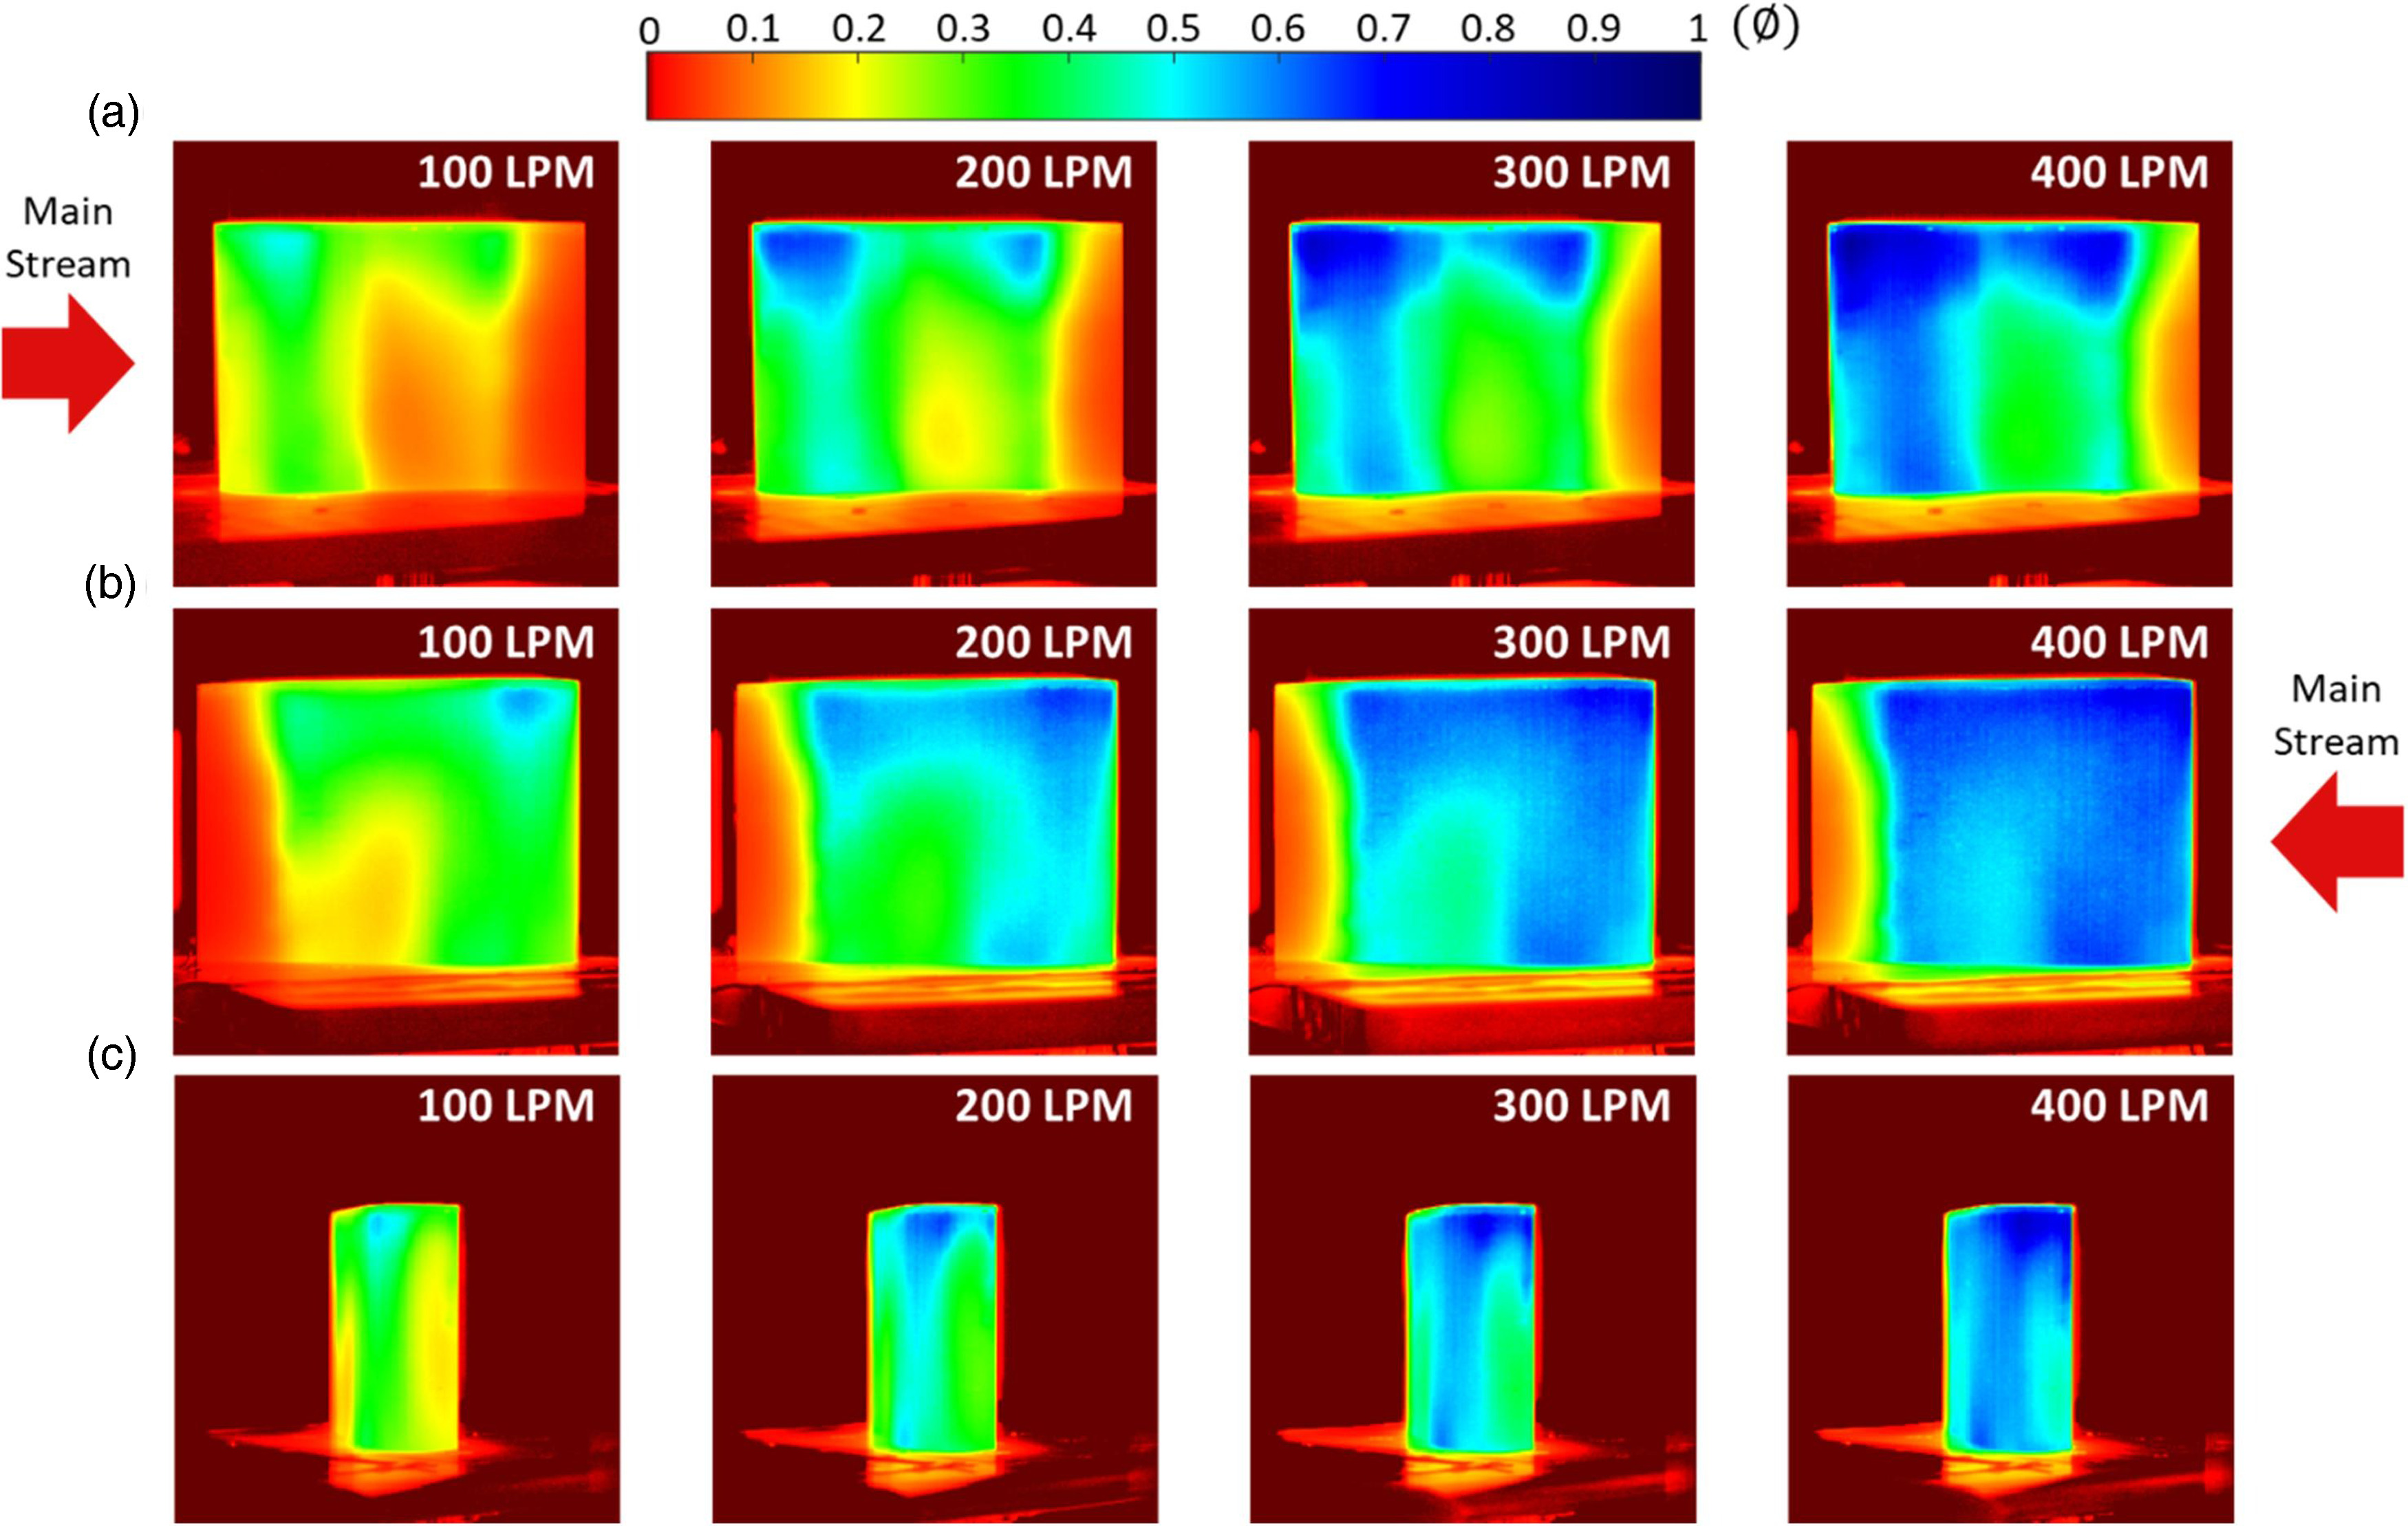
As shown in Figure 17, divergent cooling obtains high and concentrated overall cooling efficiency around the leading edge of a large amount of cooling air. Therefore, a high level of air convection in the cooling hole will improve the cooling effect. The overall cooling effectiveness distribution of the effusion cooling at different coolant volume flow rates was experimentally investigated. The flow speed of the heating air was set to be 20 m/s (Re ≈ 1,00,000). The temperature of the mainstream was set to be 100°C. The volume flow rate of cooling air released from the blade surface was set to be 100, 200, 300 and 400 LPM. For effusion cooling, multiple arrays of the cooling holes were patterned on the surface of the blade. Cooling holes with a diameter of 0.5 mm are hexagonally arranged with the hole-to-hole distance of 2 mm intervals. The cooling air is not retained along the internal cooling channel, so the cooling efficiency of exudation cooling decreases rapidly toward the trailing edge of the blade. In addition, cooling occurs in a slightly wider area on the suction side than the pressure side. The pressure level on the suction side is lower than that on the pressure side, and thus more cooling air flows out through the suction side. In addition, despite the severe heat load on the leading edge, the cooling efficiency is high due to the convection effect because a large amount of cooling air flows through the seepage hole. However, when the flow momentum of the coolant increases as the flow velocity increases, the region where cooling occurs actively moves upward and concentrates near the blade tip.
Figure 17.
The overall cooling effectiveness distribution of the effusion cooling at different coolant volume flow rates: (a) the pressure-side, (b) the suction-side, and (c) the leading-edge (Kim et al., 2021).
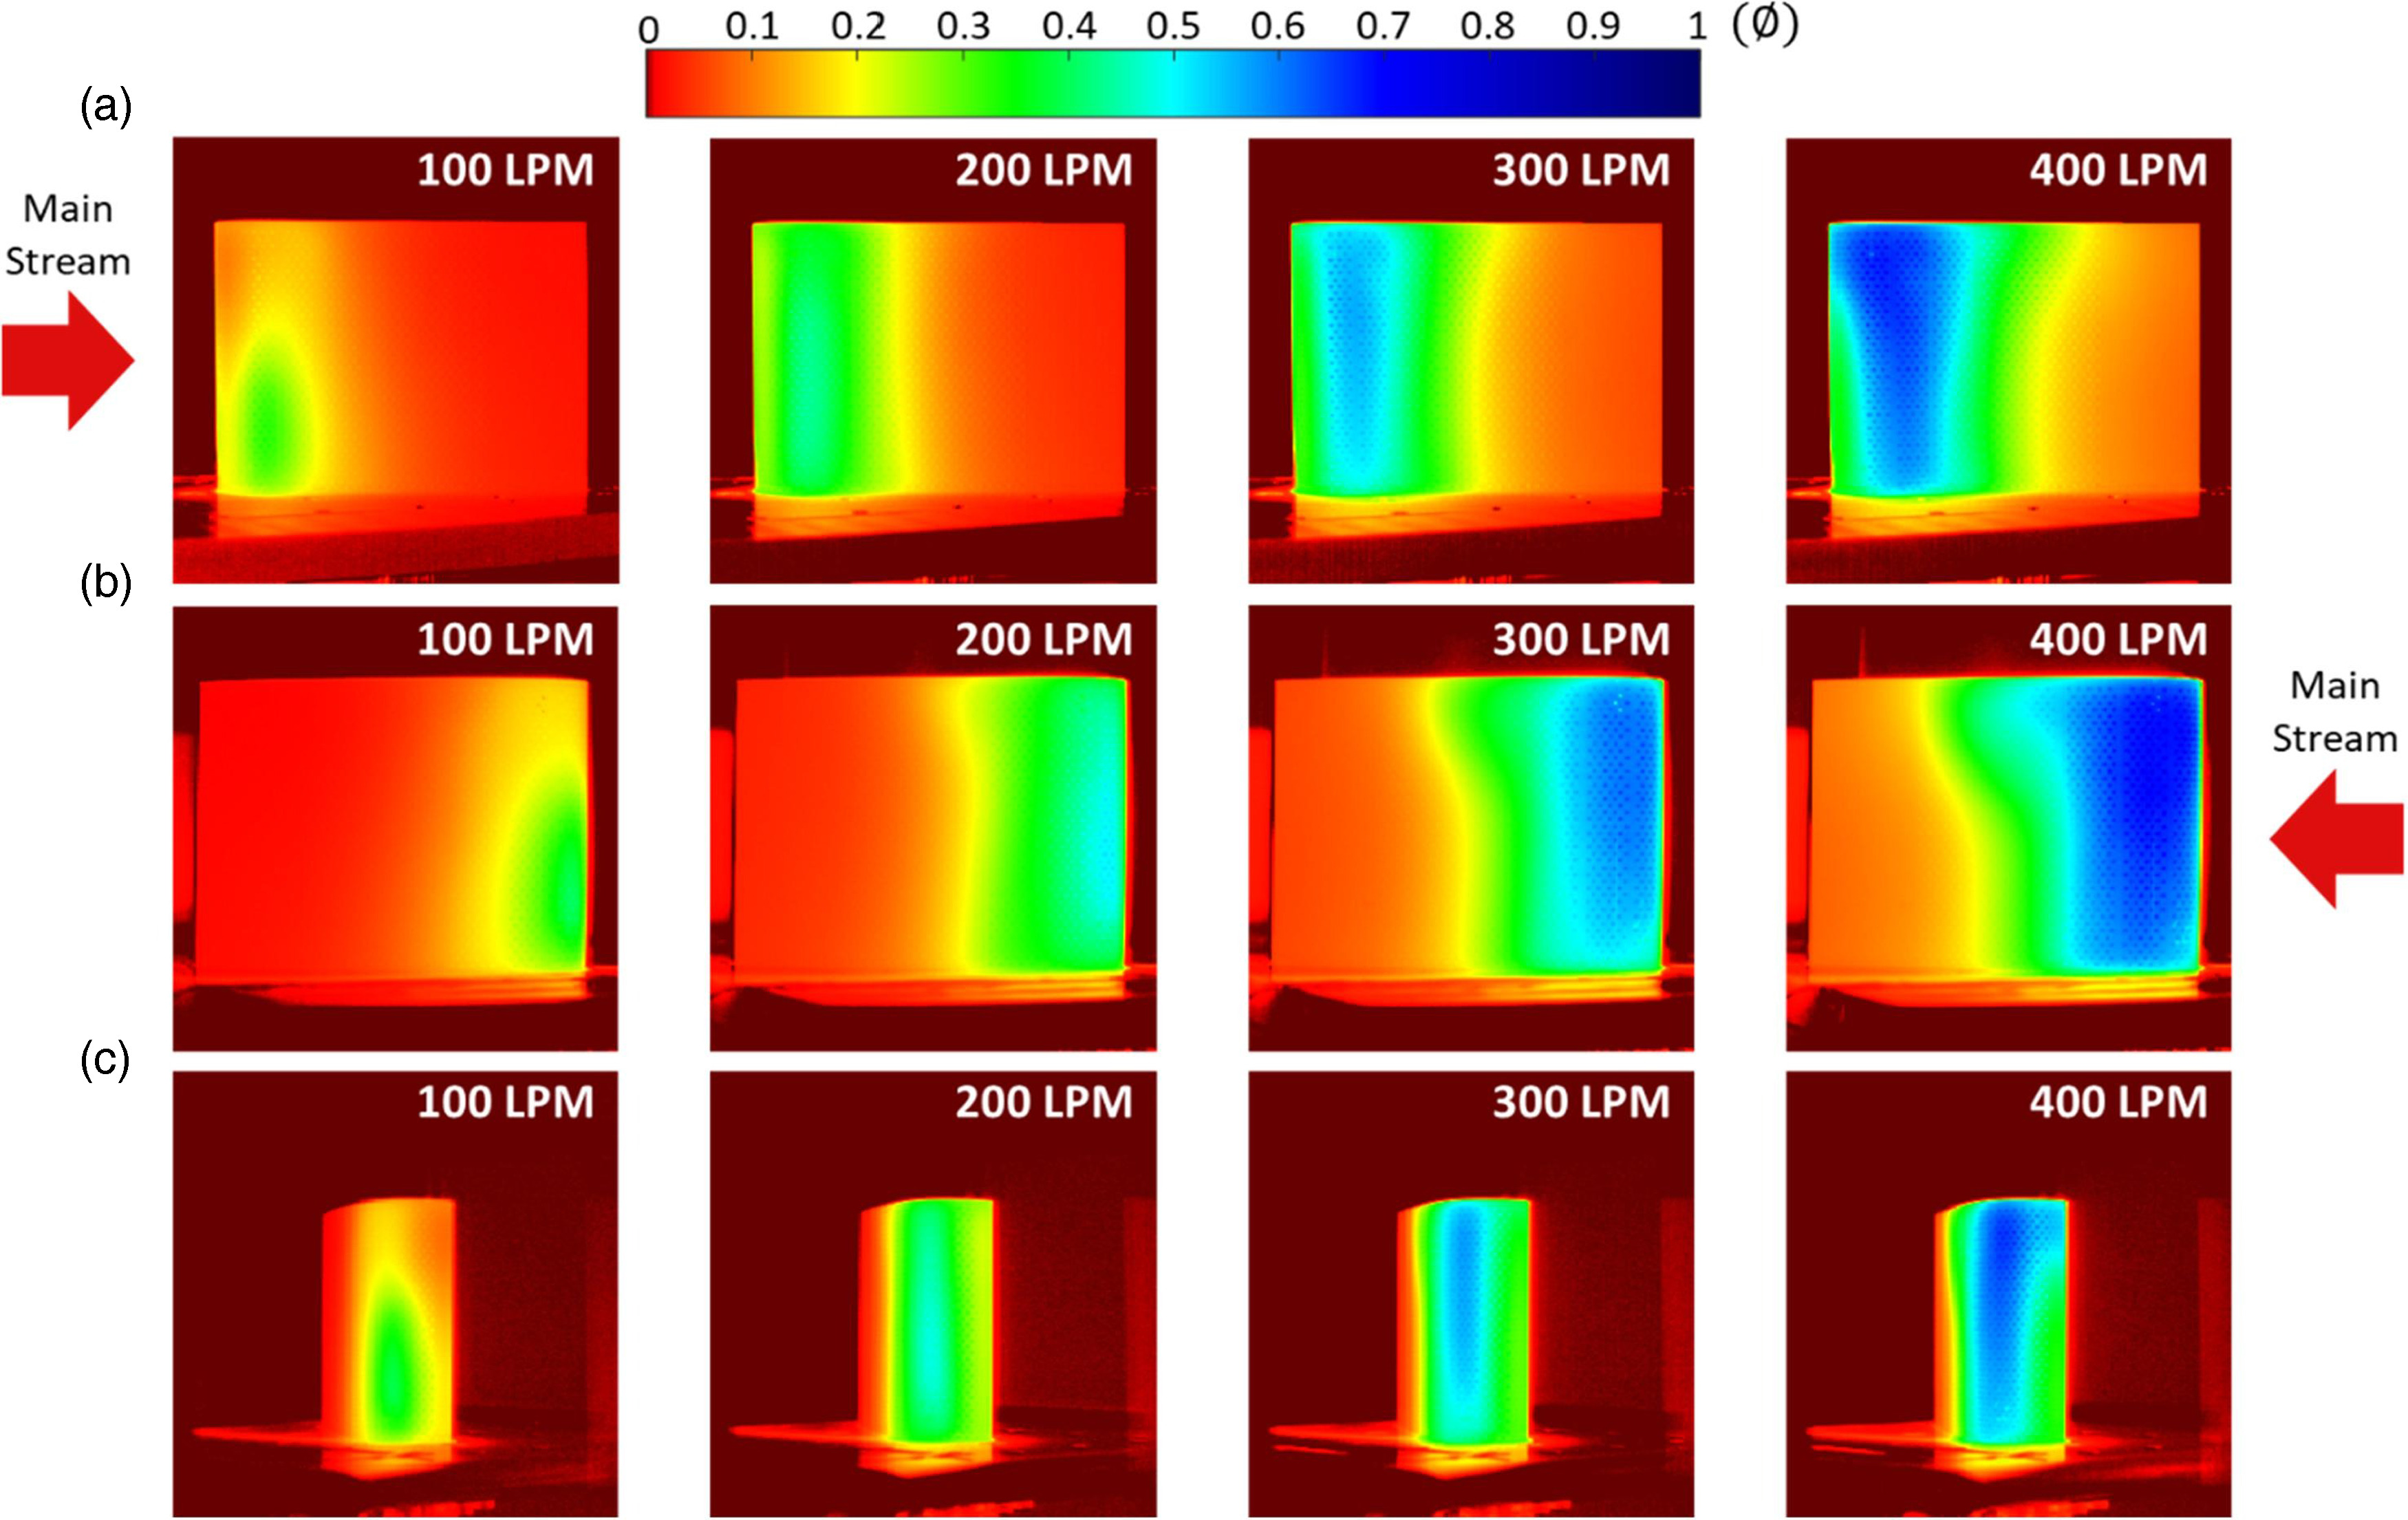
According to Figure 18, transpiration cooling of a porous structure significantly improves the overall cooling efficiency. This enhancement is due to convective heat transfer through the internal solid–liquid interface when the cooling air flows through the complex porous structure. Complex and randomly distributed pores help to disperse the cooling air over a larger area. The porous structure has a larger cooling air channel area than the exudation surface, which is advantageous for increasing the heat transfer area. Therefore, transpiration cooling achieves higher overall cooling efficiency over a larger area of the blade than internal and exudation cooling. In particular, on the suction side, the cooling efficiency is high and evenly distributed in the area where the internal cooling channel is located. At the leading edge, cooling mainly occurs on the suction side when the flow rate of cooling air is low, but as the flow rate increases, cooling occurs uniformly over a wider area of the leading edge compared with internal cooling and exudation cooling.
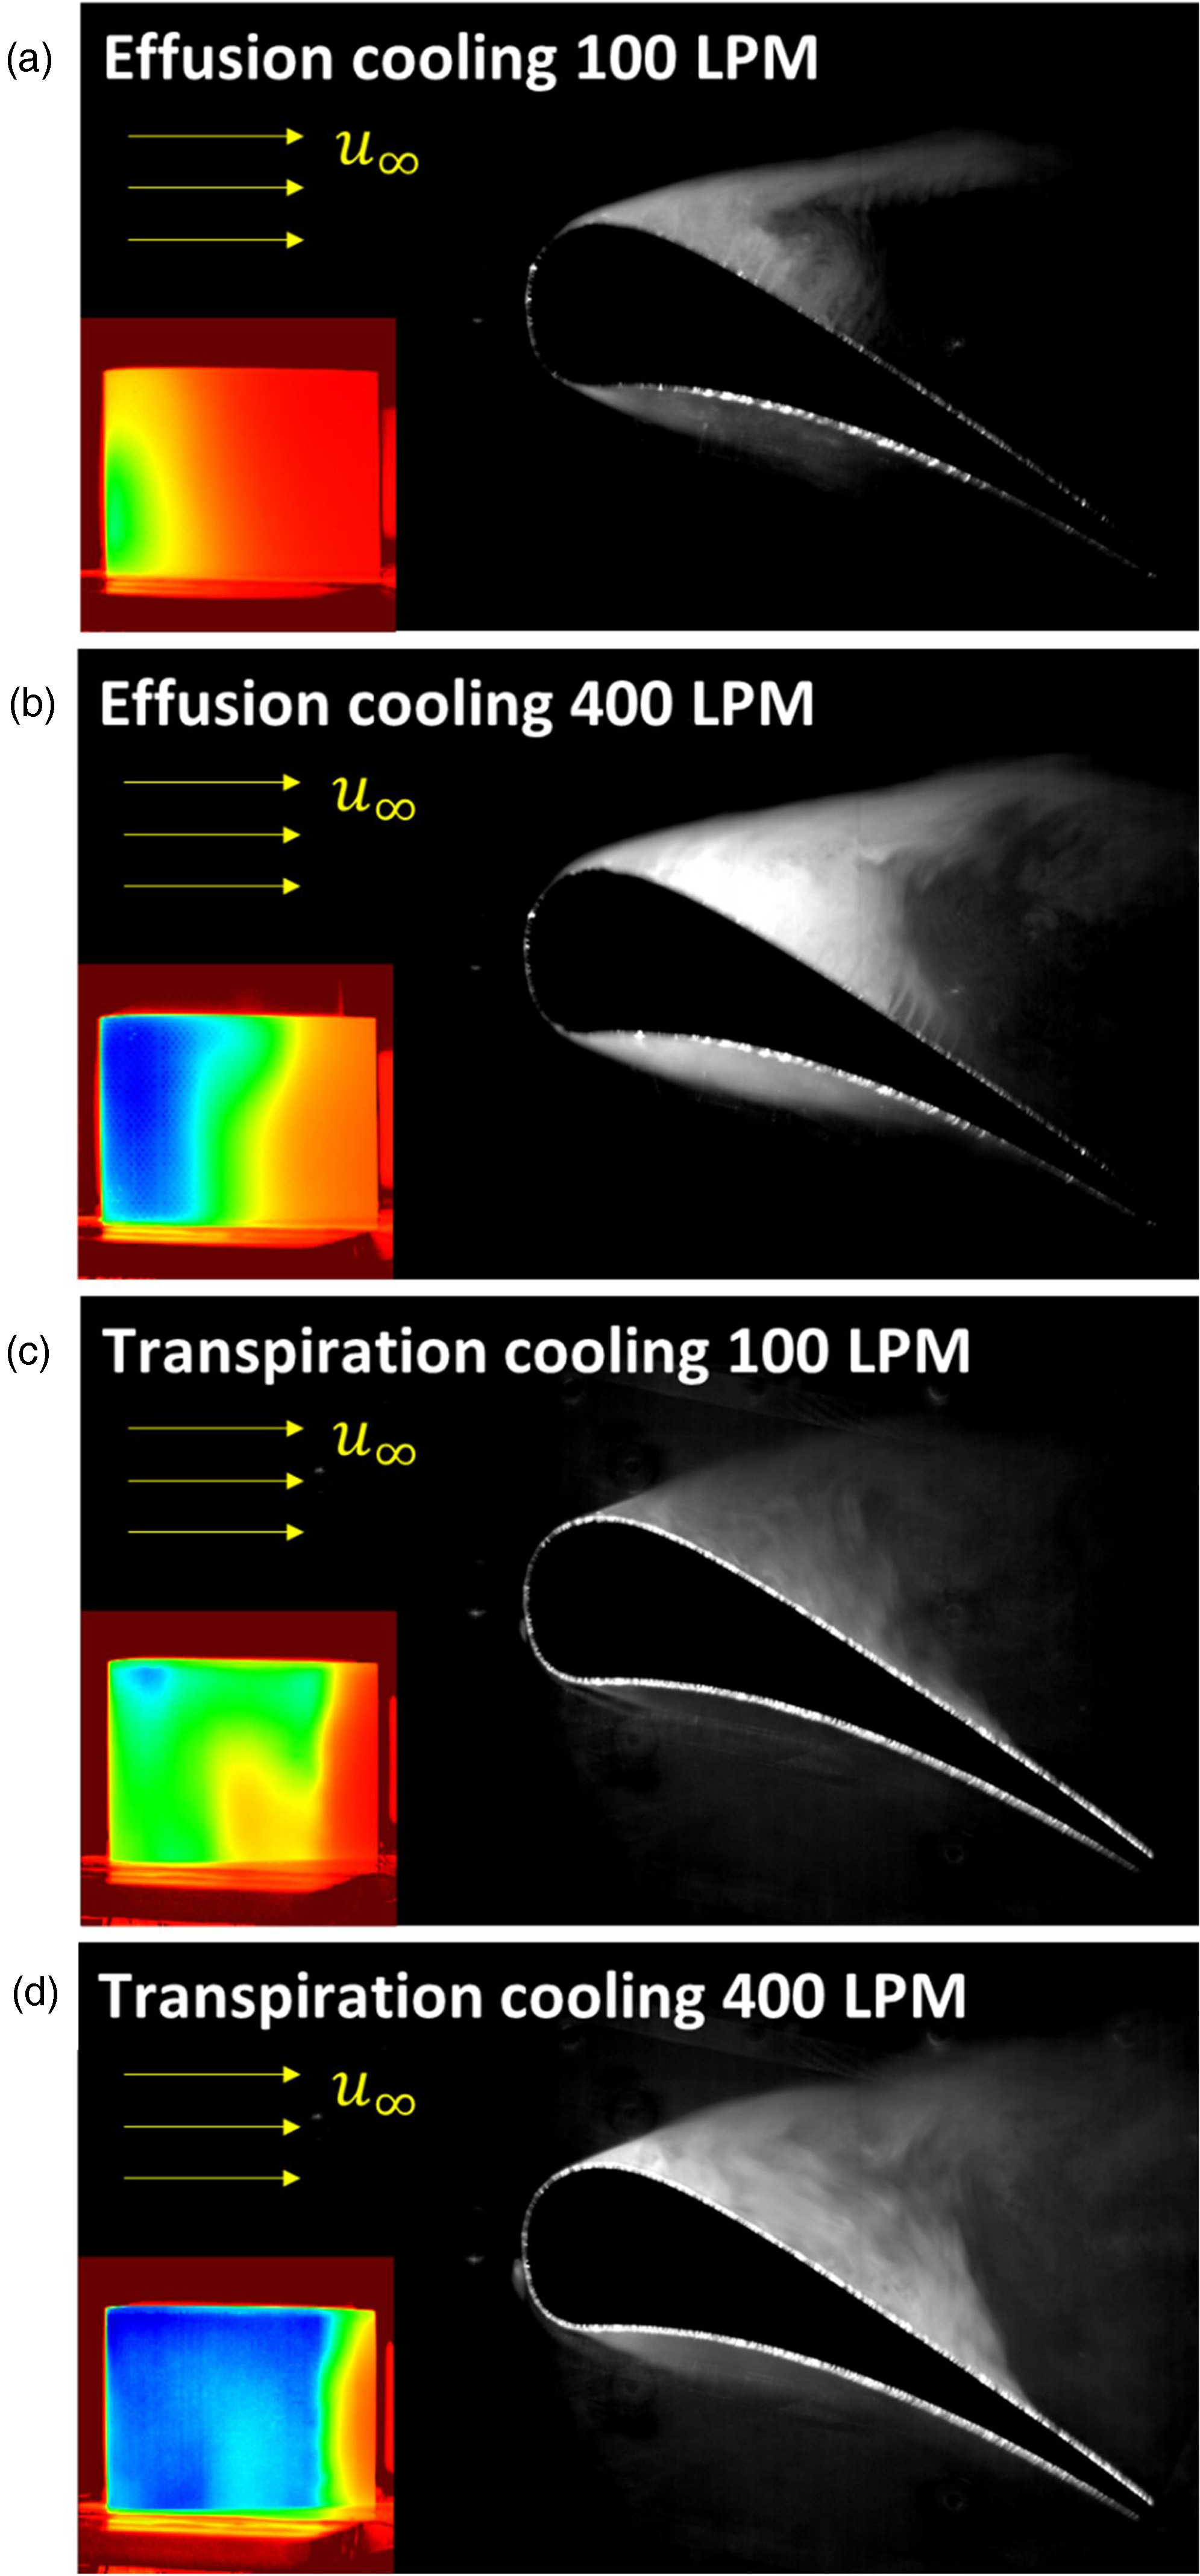
Figure 19 shows an image of the flows around structures with divergent cooling and transpiration cooling. When the coolant flow rate is 100 LPM, the coolant outflow occurs in the restricted area of the front half of the suction side and matches well with the cooling that occurs in the restricted area shown in the illustration of the effectiveness profile. With a coolant flow rate of 400 LPM, the coolant that flows out through the seepage hole expands near the trailing edge and the area of the cooling air flowing out increases. However, due to the large momentum of the coolant flowing out of the hole, a large recirculation flow is generated at the rear end of the suction side; therefore, the exuded coolant is limited to the front half area shown in the bright part of the figure. Therefore, even if the coolant flow rate increases in the case of exudation cooling, the cooling area is limited and it is biased toward the first half. Transpiration cooling achieves a wider and more uniform cooling distribution on the blade's surface. In addition, the coolant passes through the porous structure and it is discharged with low momentum, so the coolant covers almost the entire surface of the blade in an even and stable manner without generating a large recirculation flow at the rear of the suction side. As the cooling flow rate increases, the coolant layer on the pressure side becomes thicker. The length of the cooling air covering layer increases in the case of exudation cooling.
Figure 19.
Visualization of coolant flow released from the blade surface and inset of the overall cooling effectiveness contour on the suction-side: effusion cooling with a coolant flow rate of (a) 100 LPM and (b) 400 LPM, transpiration cooling with a coolant flow rate of (c) 100 LPM and (d) 400 LPM. (Kim et al., 2021).
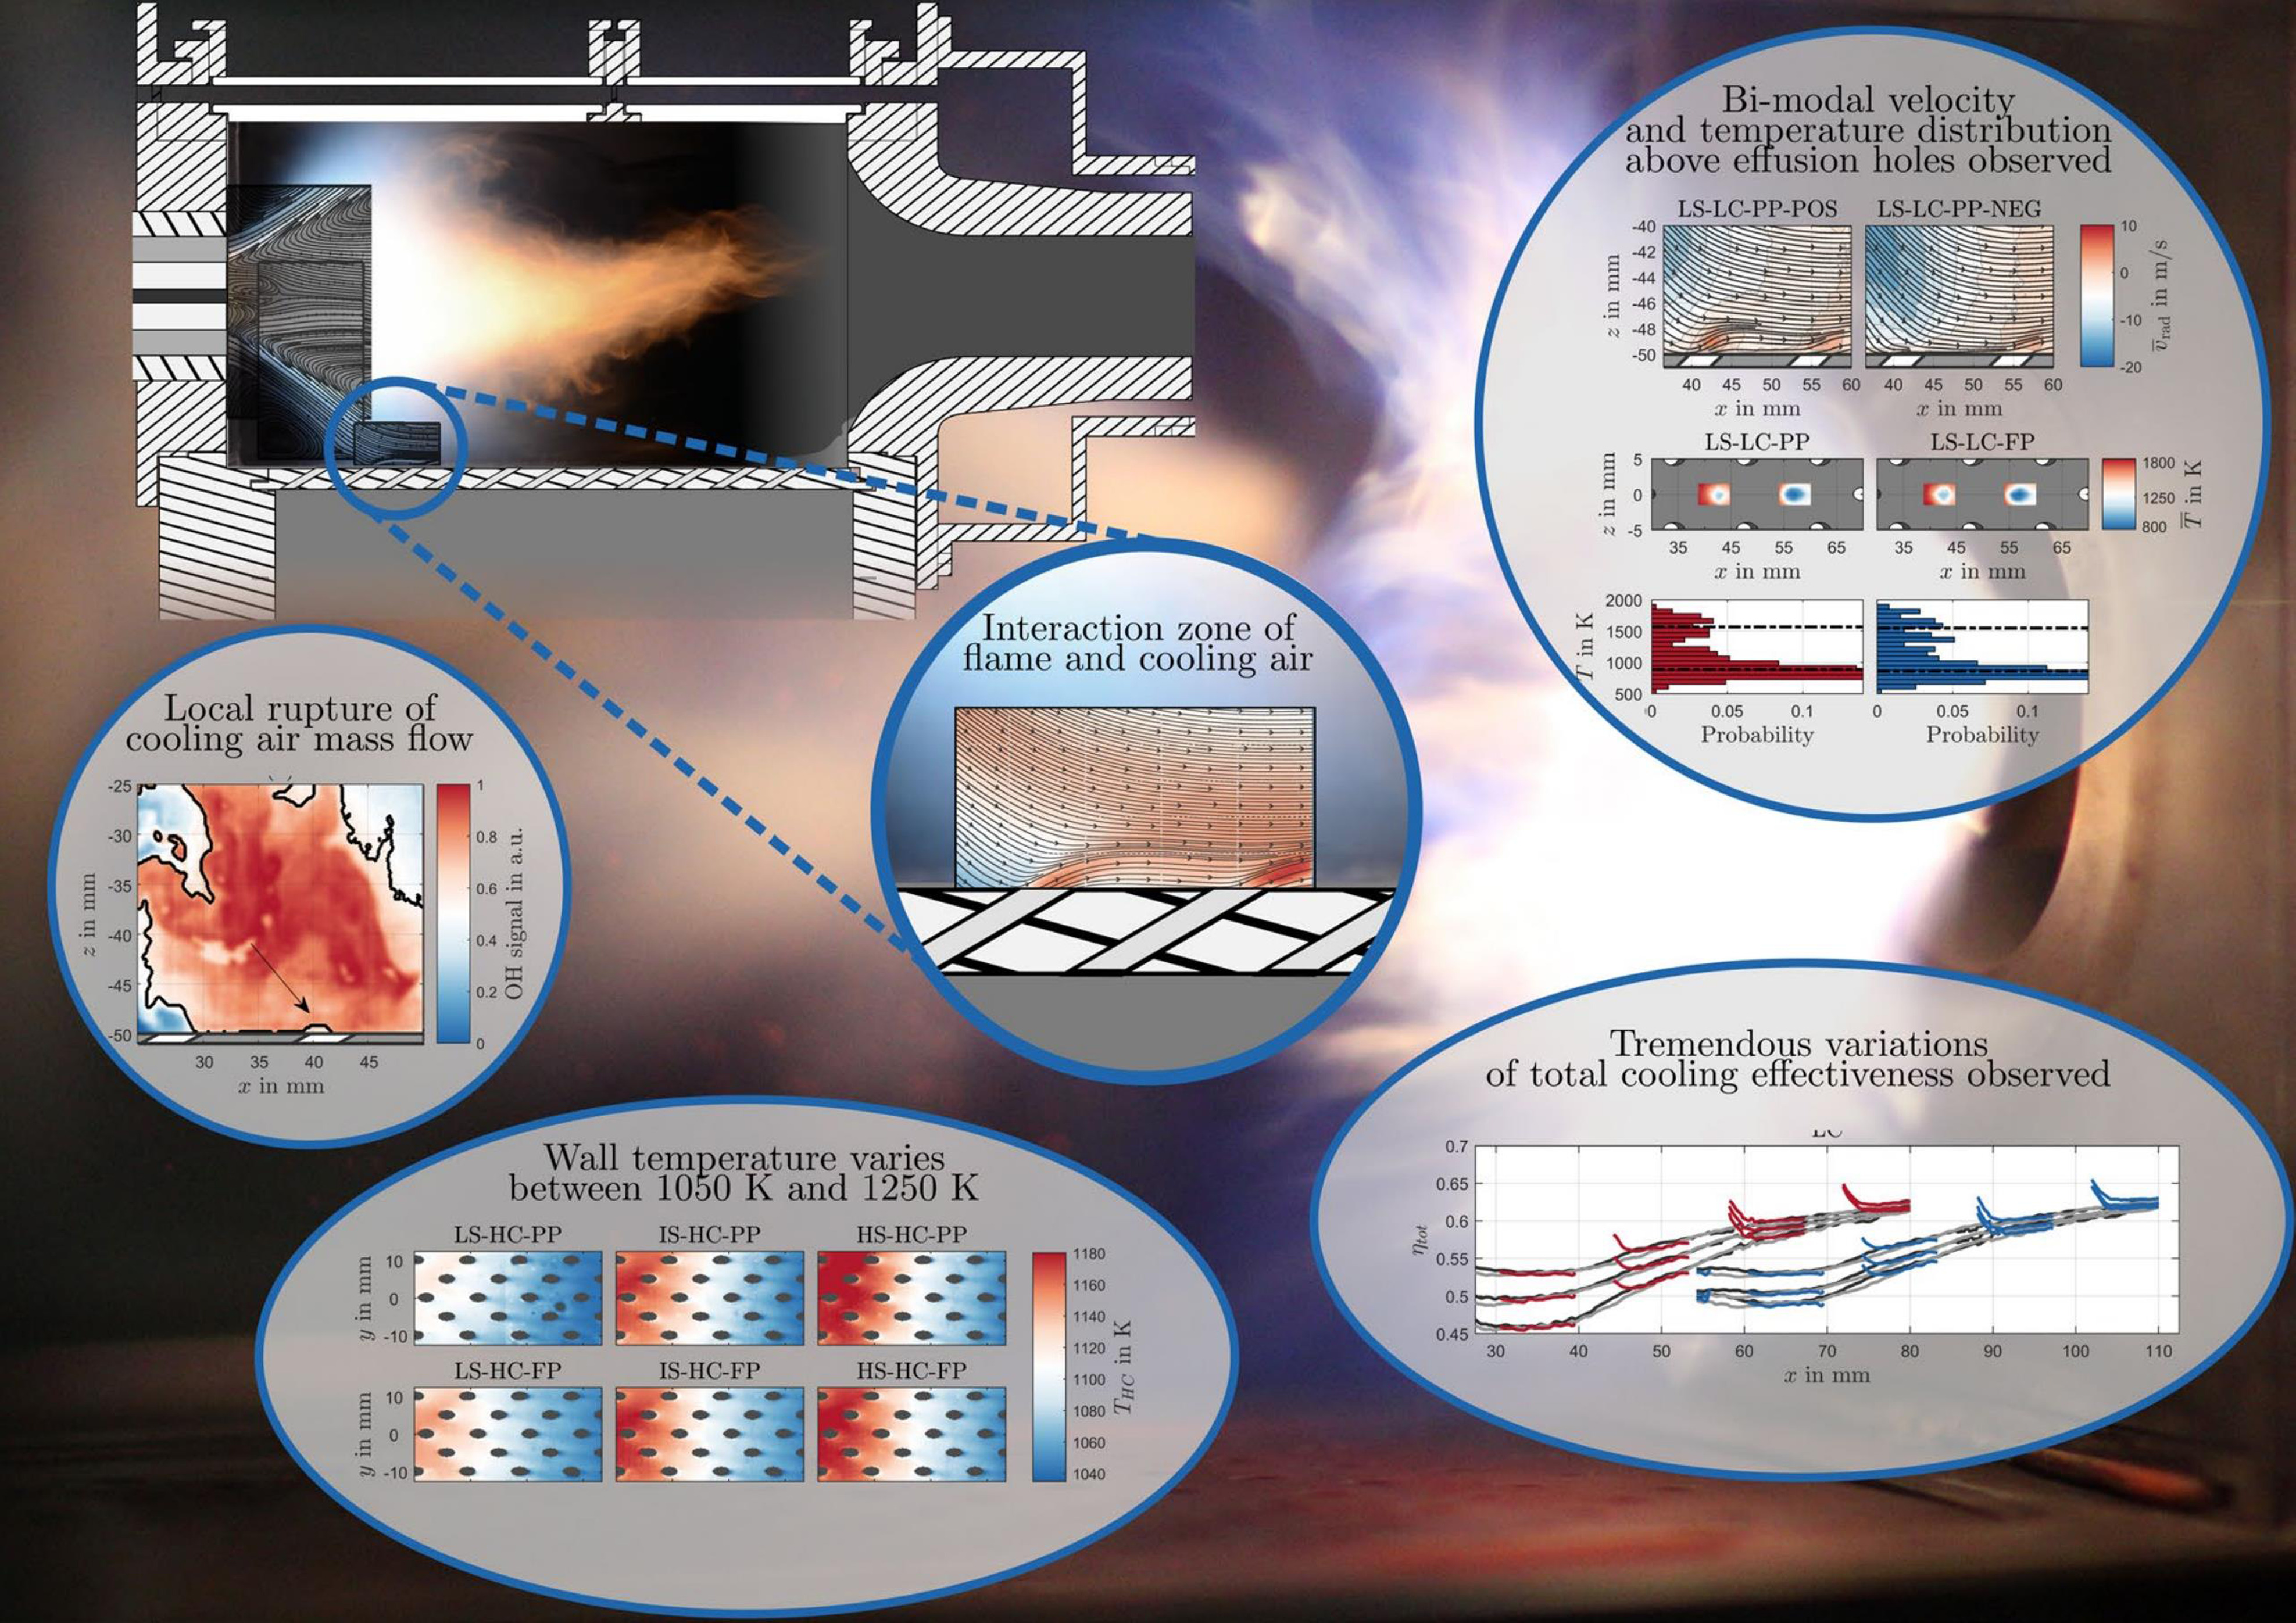
The researchers (Greifenstein et al., 2019) also investigated the interaction between the flame and cooling air flow in a gas turbine combustion chamber, as shown in Figure 20. The mass flow rate of oxidizer is 30 g/s and the temperature is 623 K. The effusion cooling mass flow is set to be 15 and 7.5 g/s. The total fuel mass flow is 1.128 g/s. The pressure is set to be 0.25 MPa. The swirl number is set to be 0.7, 1.0 and 1.3 respectively. The staging ratio is defined as the ratio of pilot fuel mass flow to combined fuel mass flows of the pilot and main stage, which is set to be 0% and 10%. The test system operated under near actual conditions, where the inlet temperature of the combustion chamber and the system pressure increased. The important parameters were varied to investigate their effects on the total cooling efficiency. In addition, the dimensionless flow cooling air interaction intensity parameters were derived from OH-PLIF data. The results showed that the intensity of the interaction in the complete premixed operation was higher at a low vortex number, whereas the opposite trend was found at a high vortex number, and some premixed combustion modes led to increases in the intensity. This trend was reflected in the wall temperature and the resulting film cooling effect. In the test ranges for all parameters, the peak wall temperature was as high as 150 K under specific conditions and the peak axial wall temperature with diffusion cooling bushing was as high as 200 K, where these results corresponded to total film cooling efficiencies of 0.45–0.57 and 0.45–0.62, respectively.
Figure 20.
Interaction of transpiration cooling and flame in the combustor (Greifenstein et al., 2019).
Additive manufacturing technology provided an effective solution to fabricate transpiration cooling porous structures with the active-designed parameters. However, the inhomogeneity of porosity and pore size are non-negligible owing to the limited accuracies of metal additive manufacturing technology. Huang and He (2019) investigated the influence of inhomogeneous porosity on transpiration cooling. The results indicated that the inhomogeneous porosity significantly affected the cooling effects of the surface film and the internal holes. However, the inhomogeneous porosity had a very slight effect on both global and local effusion cooling efficiency (less than 1%) even when the non-uniformity reached 20%. Additionally, the inhomogeneous porosity had a remarkable effect on cooling efficiency when a low-thermal-conductivity Thermal Barrier Coating (TBC) covered the surface. Lower thermal conductivity would further aggravate the inhomogeneous problem.
Self-pump transpiration cooling
Studies have shown that transpiration cooling can effectively cool the wall with heat fluxes up to 1.1 MW/m2, and the cooling flow can be self-adaptively adjusted according to the change in the heat flux (Huang et al., 2019b). Compared with self-suction external transpiration cooling, self-suction internal transpiration cooling is affected less by the environment and it saves more cooling water. However, the structure of the self-suction internal transpiration cooling system described in the previous section is highly complex, where it includes a fin cover plate, porous sheet, and water delivery channel, and contact thermal resistance occurs when the fin and porous sheet make contact. In order to further simplify the system's structure and improve the reliability of the system, an integrated bionic transpiration cooling module was proposed based on metal 3D printing technology. Figure 21 shows a 3D model of the bionic transpiration cooling module. According to the perspective view in Figure 21, the interior of the module was a tree-shaped fractal water channel and the 3D printing material was nickel chromium alloy.
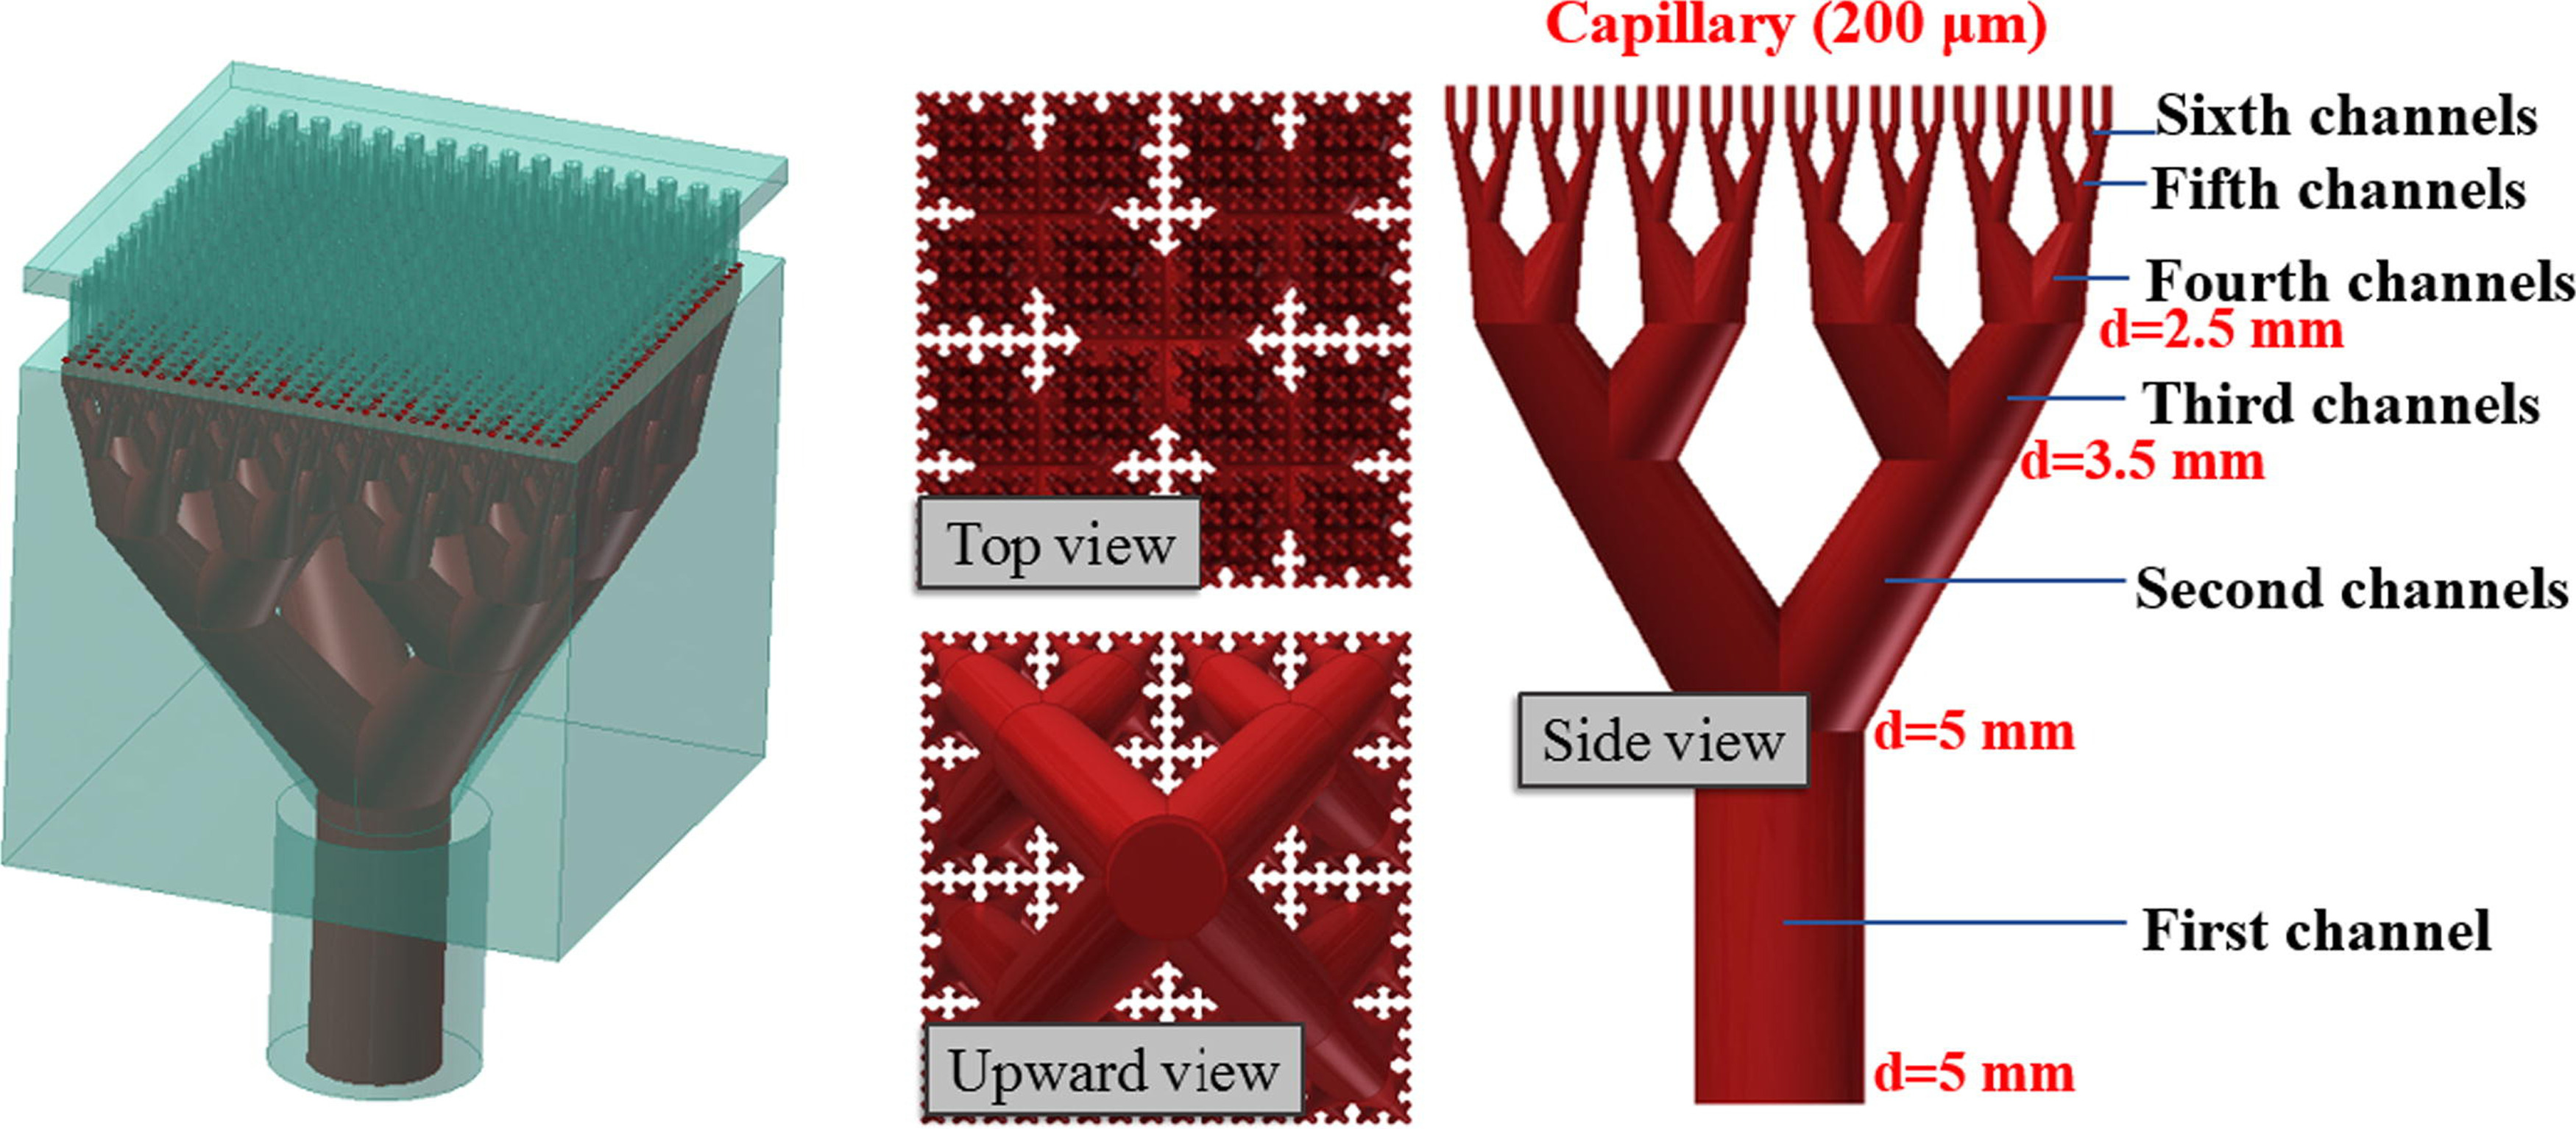
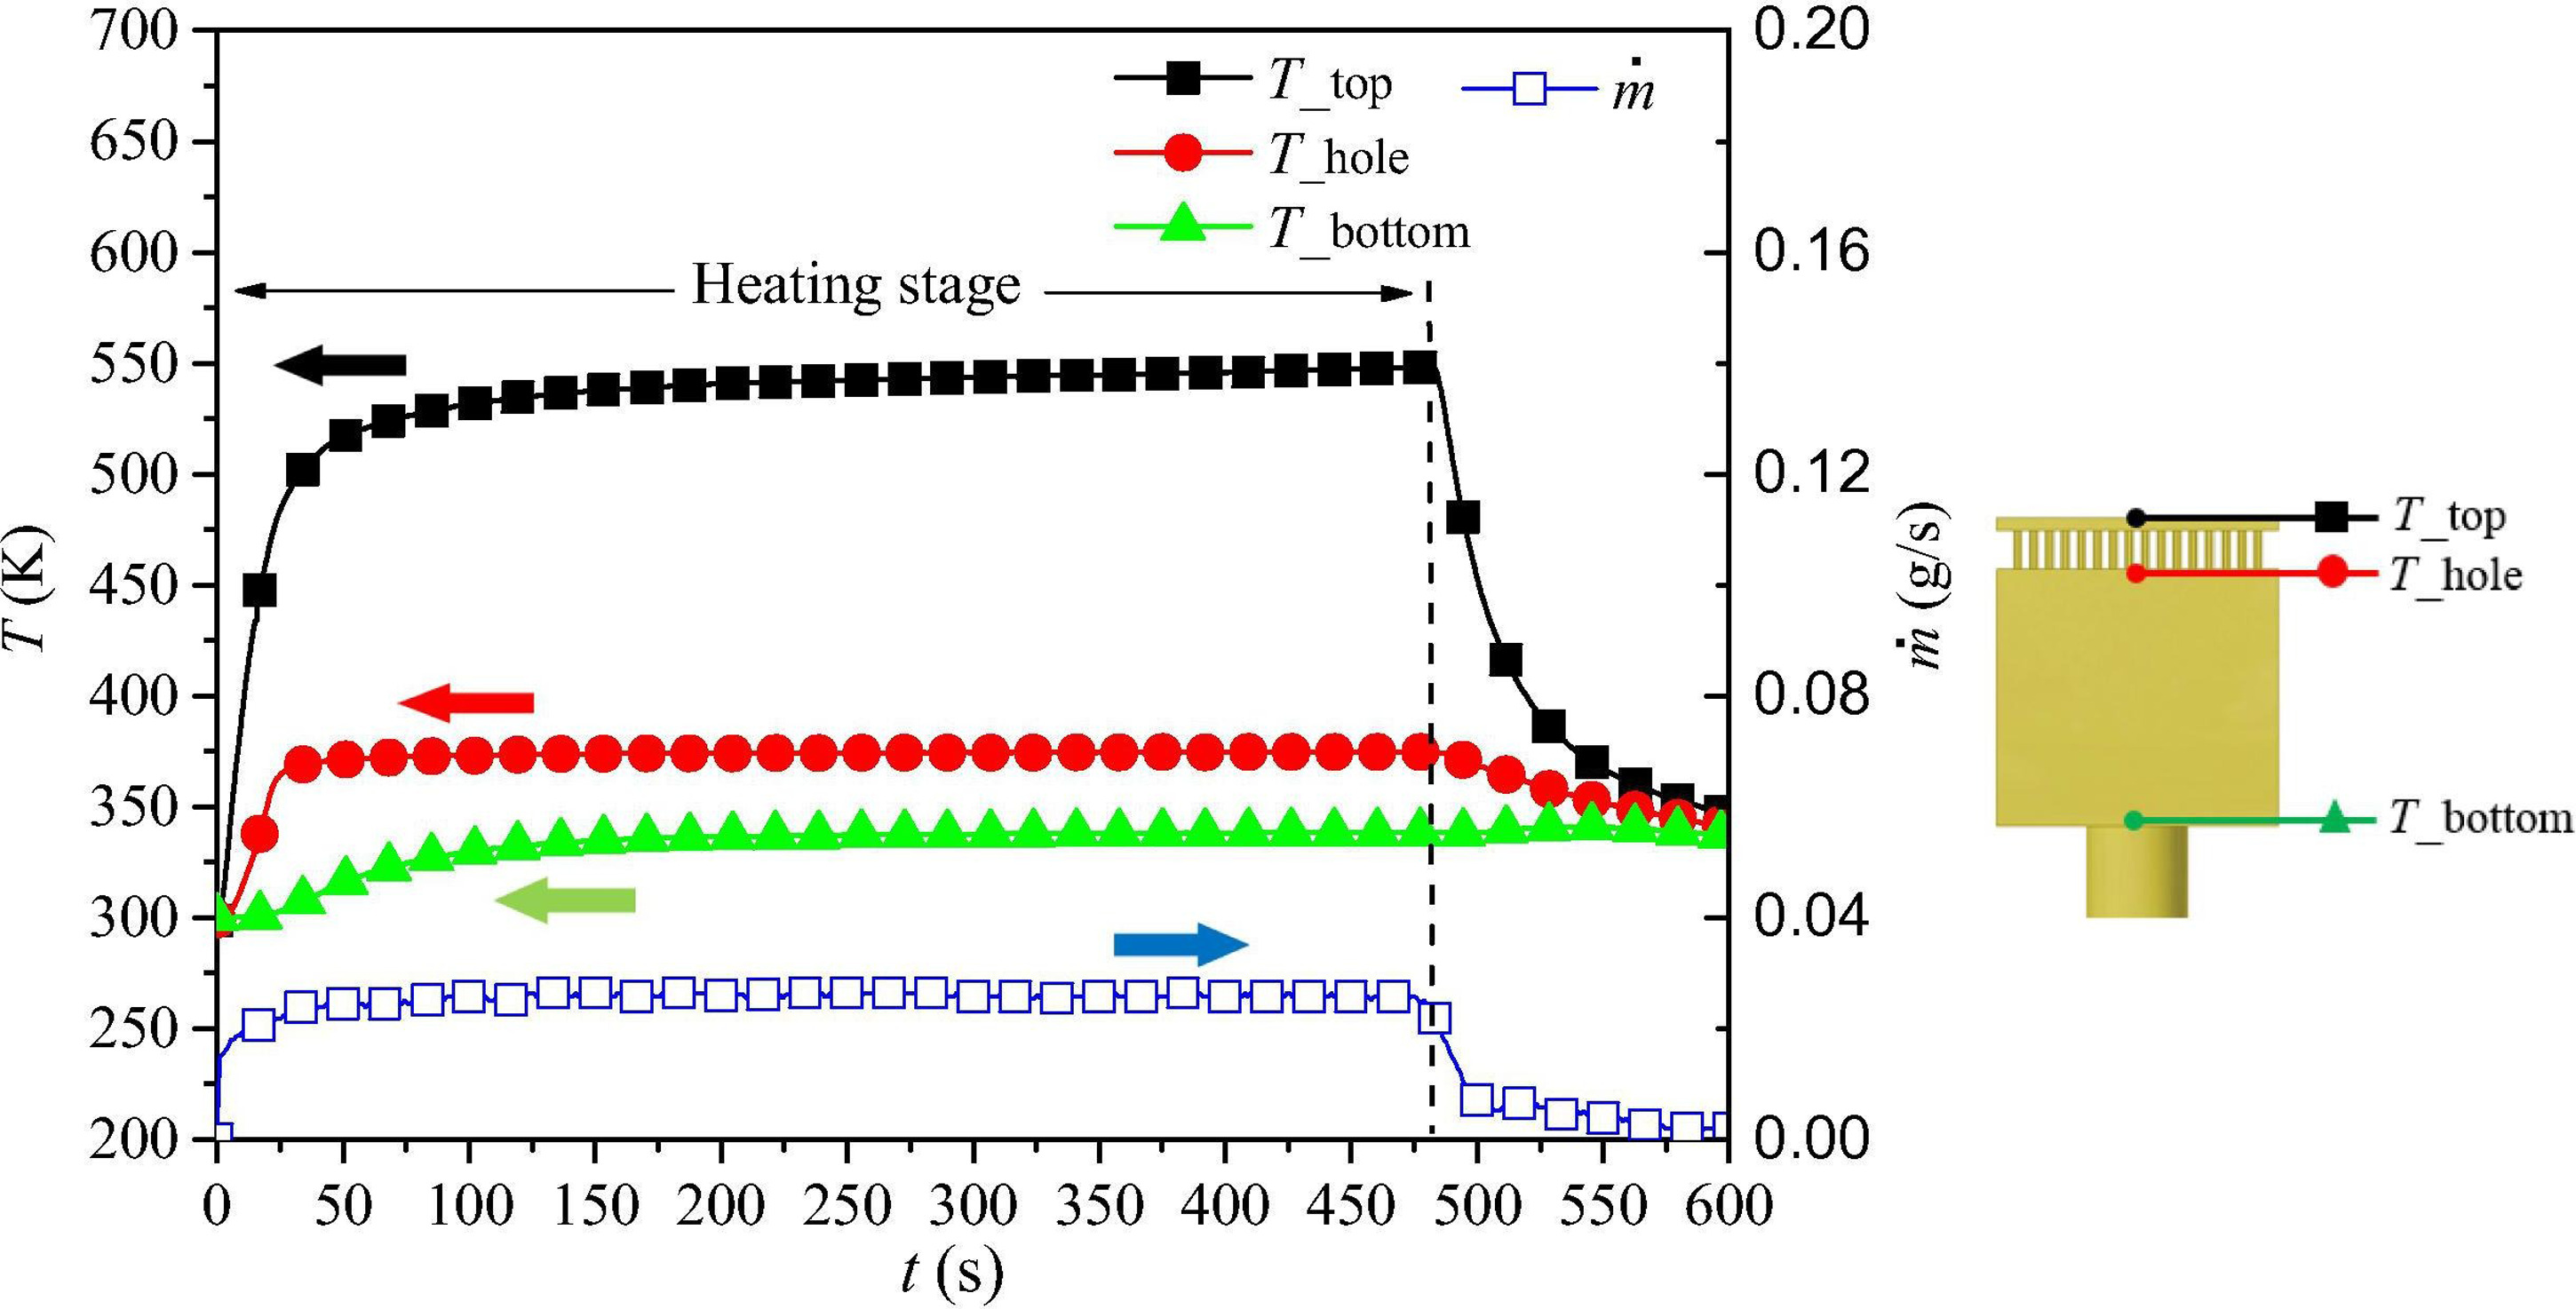
The transpiration cooling module comprised a cooling water inlet section, tree-shaped fractal channel, and cover plate with fins. As shown in the sectional view of plane A in Figure 21, after entering from the bottom, the cooling water was evenly transported to the whole heating surface through the tree-shaped fractal channel. According to the sectional view of plane B, a microporous layer was present at the end of the tree-shaped fractal channel and micropores with a diameter of 200 µm and interval of 600 µm was evenly distributed in the microporous layer. The diameter of the trunk channel was 5 mm, while the diameters of the micro-holes on the end of the tree-like channel were 200 µm. The diameter ratios between adjacent two-level channels were 0.7–0.8. The top surface of the porous module was heated with a heat flux of 0.2 MW/m2 and the water mass flow rate remained approximately 0.026 g/s. The micropores could provide capillary force to pump cooling water from the water tank to the microporous layer for transpiration cooling. The most important part of the self-suction transpiration cooling integrated module is the tree-shaped fractal channel because it transported the cooling water evenly and with low resistance, but the capillary force generated at the end was also the power source for water transmission.
Before starting the experiment, the tree-shaped fractal channel inside the porous block was pre-filled with liquid water. Figure 22 shows the variations in temperature at different positions in the porous block. In the steady stage, the temperature of the micropore layer was kept at around 373 K and the mass flow rate of the cooling water was 0.026 g/s. Without a pump, the 3D-printed porous block could smoothly pump the cooling water into the microporous layer for internal transpiration cooling. Steam was generated due to the phase transformation of the cooling waste after absorbing heat. The steam then flowed in the fin gap and secondary convective cooling occurred. The block surface temperature was about 544 K, which fully tested the heat resistance performance of the materials. The heat flux was constant so the block surface temperature was dependent on the thermal conductivity of the materials and structure of the fin plate. In the steady stage, the temperature and cooling water flow were constant, thereby indicating that the self-pumping transpiration cooling process was stable and sustainable.
Figure 22.
Temperatures and coolant water mass flow rate for a heat flux of 0.2 MW/m2 (Huang et al., 2019b).
The upper surface of the 3D-printed porous block was heated at three different heat fluxes, i.e., 0.1, 0.15, and 0.2 MW/m2. Figure 23 illustrates the variations in the surface temperature, microporous layer temperature, and cooling water. The variations in the heat flux had little effect on the microporous layer temperature, which always remained around 373 K. The mass flow rate of the cooling water increased in a linear manner with the heat flux and the heated surface was fully cooled. Without a control unit, the cooling water flow rate could be automatically adjusted by the external heat flux in the 3D-printed porous block. According to Fourier's law of heat conduction, the surface temperature increases with the heat flux. At a heat flux of q3 = 0.2 MW/m2, the upper surface temperature was around 544 K, which approximately reached the temperature limit of the materials.
Figure 23.
Response of the temperature and coolant mass flow rate to the step-changed heat flux (Huang et al., 2019b).
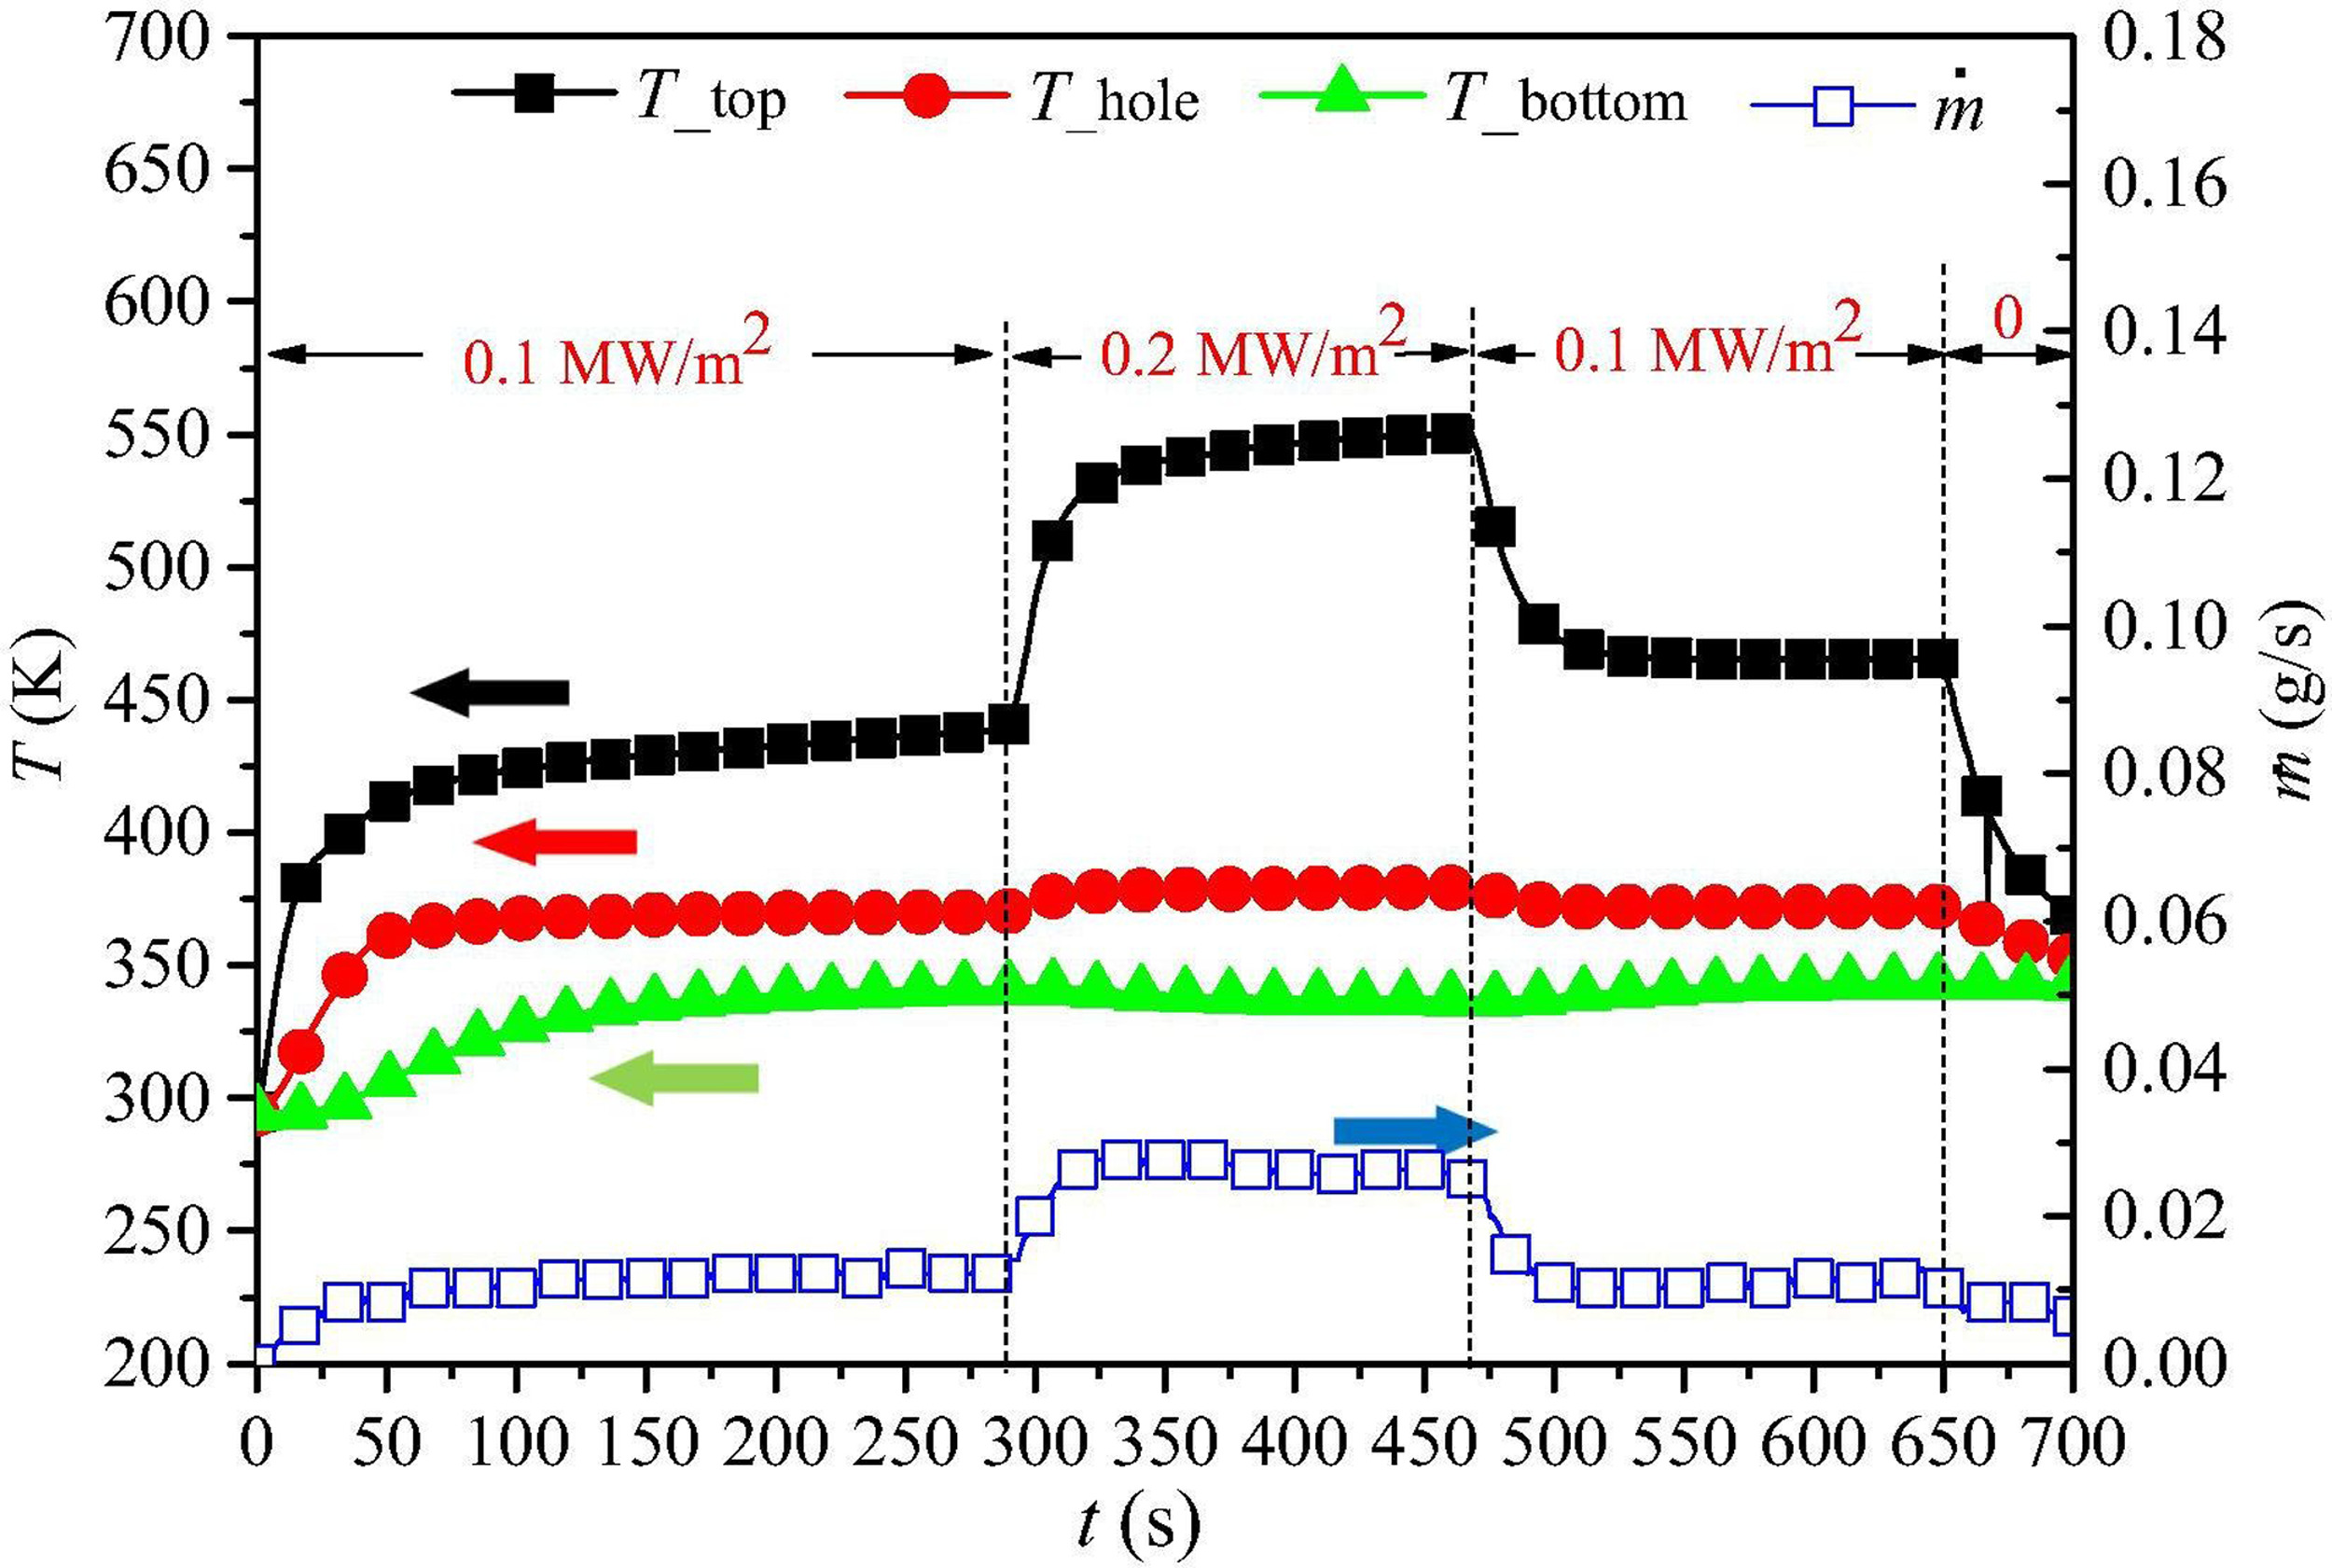
In the working conditions for actual applications, an aircraft's velocity will change with time, and thus the aerodynamic heat flux of the external shell fluctuates. To fully cool the surface in a timely manner, the flow rate of the cooling water must be rapidly and accurately adjusted according to the external heat flux in the cooling system, and a self-pumping transpiration cooling system can play a significant role in achieving this goal. Figure 23 shows the variations in the system temperature and cooing water flow rate with step changes in the heat flux. The heat flux was equal to 0.1 MW/m2 when t ranged between 0 and 280 s, and it increased to 0.2 MW/m2 at t = 280 s. The heat flux was maintained at 0.2 MW/m2 when t ranged between 280 and 470 s, but it decreased again to 0.1 MW/m2 at t = 470 s. When t = 470–650 s, the heat flux remained at 0.1 MW/m2. As the heat flux increased from 0.1 to 0.2 MW/m2, the mass flow rate of the cooling water automatically varied from 0.012 to 0.026 g/s. In addition, the opposite trend occurred as the heat flux decreased at t = 470 s. Without an additional control unit, the bionic transpiration cooling system could rapidly and accurately adjust the cooling water flow rate based on the external heat flux. The results showed that the heat flux had little effect on the microporous layer temperature and bottom surface temperature. The upper surface temperature increased with the heat flux to fully utilize the heat resistance characteristic of materials.
Due to the advantages of simple structures and adaptive cooling, the self-pumping transpiration cooling system has great potential for applications thermal protection for high speed aircraft. The current author's team proposed a thermal protection method based on a self-pumping transpiration cooling system (Huang et al., 2019b; Liao, 2021) to provide thermal protection for the leading-edge components of aircraft. The thermal conductive cover plate made of superalloy was located near the stagnation point of the leading-edge component. The high-temperature and high-speed oncoming flow was aerodynamically heated and conducted to the self-pumping transpiration cooling porous layer, and the absorbed cooling water evaporated continuously under the external heat flow conditions. Due to the capillary effect of porous materials, the cooling water was continuously pumped from the water storage cell. Moreover, it was added to the self-pumping transpiration cooling layer through the optimized tree-shaped fractal channel to achieve efficient thermal protection. The steam formed by the evaporation of cooling water allowed secondary heat exchange between the fin structures of the cover plate, and the superalloy cover plate was cooled further. Next, due to the transpiration cooling of steam on the side of porous media, a protective gas film formed to thermally protect the downstream area of the leading edge. The self-pumping transpiration cooling porous layer arranged inside the leading-edge component limited the effects of pressure increases caused by incoming flow stagnation on the self-pumping transpiration cooling performance, thereby improving the stability. In addition, the steam generated by the phase transformation of cooling water in the self-pumping transpiration cooling process was conducted to allow secondary transpiration cooling in the downstream area of the leading-edge components and facilitate the efficient utilization of cooling water.
Researchers (Dudukovic et al., 2021) designed a tree-shaped structure comprising porous cells immersed in a reservoir of stained water. The reservoir is sealed between the “trunks” and the water can only be transported through the porous tree-shaped structure. As the water flows up the porous structure under the action of capillary force and evaporates through the external surfaces of the structures on the air side, the liquid level drops in the tank. Based on this process, a more ordered version was designed and the simple concept was extended to the transpiration cooling process. Force balance analysis was applied to obtain the parameters for the elements. The dimensionless parameters comprising L* = 0.55 and D* = 0.33 corresponded to the expected rise of Hrise* ≈ 5 in each capillary column. The whole structure was subjected to a heat source and thermal imaging was utilized to explore three transpiration cooling processes with water as the coolant, where the completely dry structure (3) was heated almost immediately and only the wet structure (1) was then heated. Finally, the structure with storage tanks (2) was continuously cooled until the storage tanks were exhausted. The evaporation rate was related to the temperature gradient and the size of the gas–liquid interface. Greater cooling continued at the top layer until the evaporation rate exceeded the liquid replenishment rate. At this critical point, the liquid front receded gradually from top to bottom and each layer was heated accordingly. To treat the evaporation flux as a function of the position, researchers used Schlieren imaging to capture the small change in the refractive index caused by the density gradients. The relative water evaporation rates were derived by analyzing the steam front for each layer in the Schlieren image.
Summary and outlook
Transpiration cooling has great potential for applications in thermal protection in aero engines, liquid rocket engines, and hypersonic vehicles. Additive manufacturing technology is emerging as an effective method for fabricating porous structures with minipores/micropores to greatly facilitate the improved design of transpiration cooling systems. Additive manufacturing-assisted porous materials are expected to further improve the maximum heat flux and reliability of transpiration cooling systems. This review summarizes the key issues related to additive manufacturing in transpiration cooling from the following two perspectives: (1) the fundamental features of additive manufacturing-assisted porous materials (i.e., pore topology design, heat transfer coefficient, and mechanical strength performance); and (2) examples of the application of transpiration cooling with additive manufactured porous structures (i.e., single-phase transpiration cooling and self-pumping transpiration cooling with phase change).
Comprehensive investigations have been conducted of additive manufacturing-assisted porous structures for transpiration cooling systems in terms of their fundamental features and applications but the following very important issues still need to be addressed further:
a 3D printing method is required for porous parts with a pore diameter less than 50 µm using high temperature-resistant metal and ceramic materials;
transpiration cooling experiments should be conducted using realistic shaped porous parts fabricated by 3D printing under real-world conditions;
the design and preparation of pore topologies that can alleviate the unreasonable match between the coolant supply and spatial thermal load to further improve the maximum heat flux for transpiration cooling;
optimizing the design and preparation of metamaterials with multiscale pores to overcome the problem of unsteady heat transfer (i.e., temperature oscillation and temperature delay).
Nomenclature
c
specific heat capacity, J·kg−1·K−1
hv
volumetric heat transfer coefficient, W·m−3·K−1
h
heat transfer coefficient, W·m−2·K−1
t
time, s
dp
equivalent pore diameter, m
dh
hydraulic diameter, m
uD
Darcy velocity, m·s−1
V
superficial fluid velocity, m·s−1
Ss
solid zone area, m2
Sc
cross-section area, m2
ac
specific surface area, m−1
Nu
Nusselt number
Nuv
volumetric Nusselt number
Nusf
interstitial Nusselt number
NuT
thermally developed Nusselt number
Re
Reynolds number
Rec
critical Reynolds number
Pr
Prandtl number
j
Colburn factor
f
friction factor
F
coolant blowing ratio
BR
the blockage ratio of the partition wall
p
feature parameter in TPMS structure
q
feature parameter in TPMS structure
Hrise*
dimensionless liquid height
L*
dimensionless pore size
D*
dimensionless relative strut size
Ac
wetted area of cross section normal to flow direction (m2)
dc
cell diameter (m)
K
permeability (m2)
P
wetted perimeter based on fluid area at inlet (m)
Sv
surface area of TPMS (m2)
Abbreviations
AM
additive manufacturing
CFD
computational fluid dynamics
3D
three-dimensional
CAD
computer aided design
DLP
digital light processing
SLM
selective laser melting
TPMS
triple periodic minimal surface
PPI
pixels per inch
BBC
body-centered-cubic
SC
Simple-cubic
FCC
Face-centered-cubic
TKD
Tetrakaidecahedron
BR
the blockage ratio of the partition wall
LPM
liter per minute