Introduction
The endeavor to mitigate CO2-emissions in electrical power generation leads to an increasing share of renewable energy sources in the electrical grid. The supply by those renewables is inherently intermittent and meets a less variable demand. Efficient and flexible gas turbines are supposed to compensate for the remaining power requirement instantaneously. The future use of synthesized hydrogen or methane as carbon-neutral fuel is the subject of current research.
However, this new use case for gas turbines leads to high cycle numbers of the VIGV mechanism, which is used to control the mass flow rate and thus the power output. Potential failure modes of this mechanism are described by McAlpin et al. (2003). They lead to deviations of single or multiple vanes from the intended angle of attack and consequently cause a rotationally non-symmetric compressor inflow. Potential consequences are losses in performance and compressor stability as well as a resonant excitation of the rotor blades, which poses the risk of compressor damage.
Inlet distortions
Any deviation from a homogeneous inflow field, e.g. in pressure, temperature or flow angle, is considered an inlet distortion. Distortions in total pressure are the most thoroughly investigated form, whereas for swirl distortions no comprehensive database of test results exists (SAE Aerospace, 2010; Sheoran et al., 2012). Depending on the shape of the distorted area, radial and circumferential distortions are distinguished. In the present study, the effects of circumferential swirl distortions are investigated. This kind of distortion is also relevant for jet engines. Stocks and Bissinger (1981) emphasize the influence of swirl on the compressor stability margin of the Tornado aircraft. A VIGV has a damping effect on the resulting variations in absolute circumferential flow angle α (SAE Aerospace, 2010). This highlights the importance of the present investigation, where the VIGV itself causes the distortion. Therefore, no damping can occur before the distorted flow impinges on the rotor.
The influence of a rotationally non-symmetric swirl has been investigated by different methods. Sheoran et al. (2012) and Rodriguez et al. (2013) carried out CFD simulations of a compressor facing a variety of distortion patterns. Frohnapfel et al. (2018) performed tests on an aero engine with the goal to determine the reductions in inlet swirl distortion amplitude by the fan. Franke (2023) experimentally investigated different intended asymmetric VIGV patterns with the goal of suppressing non-synchronous vibrations prior to stall. Werner et al. (2022) measured the influence of a gas turbine inlet manifold and the developing vortex pair on compressor behavior. In addition, the influence of swirl distortions has been modelled, e.g. via a 1D Mean Line Code (Fredrick and Davis, 2012) using the Parallel Compressor Model (PCM).
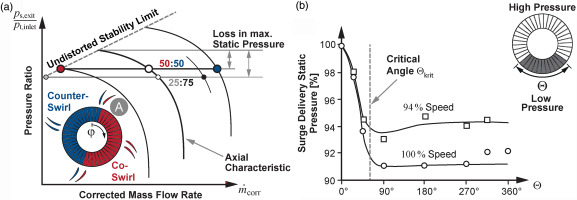
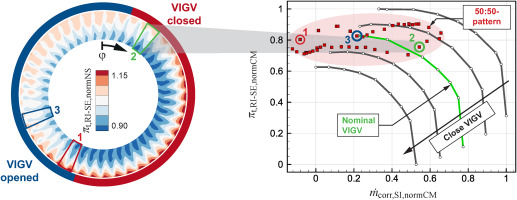
The PCM assumes that the distorted compressor can be treated as an area average (aa) of multiple identical compressors operating with different but homogeneous inlet conditions and the same exit condition of constant static pressure ps,exit. In the original version, the PCM was intended for pressure distortions. The model provides qualitative agreement with experimental data (Cumpsty, 2004; Reutter et al., 2020). The application for swirl distortions is proposed by Bouldin and Sheoran (2002). A corresponding schematic illustration of the model is provided in Figure 1a for a compressor with a 50:50-distribution of co- and counter swirl at the inlet. Each half is working on its own ps,exit/pt,inlet-characteristic. The aa-global operating point is located on the characteristic with axial inflow. The distorted compressor will reach its stability limit as soon as the half with co-swirl, VIGV closed respectively, becomes unstable. According to the PCM, a loss in maximum static pressure occurs compared to the axial case. For a constant magnitude of swirl variation, this loss increases if the circumferential extent Θ of the co-swirl area is decreased (compare schematic of the 25:75-distribution). However, Reid (1969) performed systematic experiments for pressure distortions at the inlet and found that there is a critical angle Θcrit as shown in Figure 1b. For smaller distorted areas, the compressor can tolerate more severe distortions than would be assumed from the PCM. It locally operates beyond its nominal stability limit. This is attributed to the time constant of blade response (Cousins, 2004).
Figure 1.
Parallel compressor model. (a) Schematic model for Swirl distortions and (b) Influence of the Distorted Sector Width from Reid (1969).
Methodology
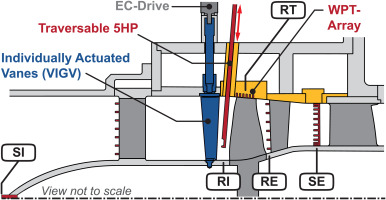
The measurements are performed at the Transonic Compressor Darmstadt 2 test rig (TCD2). The rig is shown in Figure 2. It features an open loop configuration and is powered by a 1.8MW AC-motor, which enables Mach similarity. The test object comprises the first 1.5-stages of a gas turbine compressor, designed by Siemens Energy AG. The mass flow rate (up to approx. 28kg/s) and thus the total pressure ratio (up to approx. 1.7) can be controlled via a traversable throttle ring downstream of the stage exit. To perform measurements with VIGV-induced swirl distortions, the rig is modified. EC-drives enable the simultaneous adjustment of the angle of attack on each individual vane. A cross section of the compressor module is shown in Figure 3. The rig features extensive instrumentation in the different axial measurement planes. A 5-hole probe (5HP) at the rotor inlet measurement plane (RI) facilitates the measurement of absolute flow angles, total and static pressure as well as derived quantities, e.g. mass flow densities or relative flow angles. The probe can be traversed in radial direction to cover different relative channel heights. An axial array of 23 piezoresistive flush-mounted wall pressure transducers (WPTs) in the rotor ring enables the rotor relative measurement of static pressure at the rotor tip (RT). At the rotor exit (RE) and the stage exit (SE) total pressures and temperatures are measured via Kiel rakes and a 5HP-rake. A more detailed description of the rig and its instrumentation is given by Kunkel et al. (2019).
Figure 2.
TCD2 test rig.
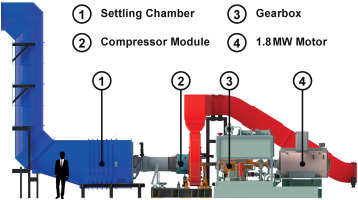
Figure 3.
Cross section of the compressor module.
To gather systematic data on the influence of swirl distortions on compressor behavior, multiple patterns of mis-staggered VIGVs have been tested. To set a specific pattern, the compressor with symmetric VIGV is operated at peak efficiency (PE) mass flow rate. Next, a specific pattern is set, e.g. a 50:50 ratio of closed to nominal vanes. Then, all vanes are adjusted uniformly in angle to obtain the mass flow rate of the undistorted flow at PE without changing the throttle. That is, to allow comparability to a gas turbine with VIGV mis-stagger. The resulting deviations between the mean of all VIGV angles and the nominal angle are relatively small and are not the cause for the effects described in this paper.
The investigation of rotationally non-symmetric flow requires measurements of the whole annulus in all axial planes. This is achieved by circumferentially traversable instrumentation. All elements depicted in yellow in Figure 3 can be rotated accordingly. In combination with the possibility to position the single vanes individually, 360∘-measurements relative to the VIGV pattern are feasible while maintaining the clocking between VIGV and stator. For more information regarding the measurement procedures and the ability to resolve deviations in VIGV angle, see Karl et al. (2023).
Results and discussion
In the following, the influence of swirl distortions at the compressor inlet caused by different VIGV patterns is investigated with respect to aerodynamics. The focus is on a varying count of mis-staggered adjacent vanes that are closed with respect to the nominal angle. The similarity to pressure distortions and the applicability of the PCM are discussed. In addition, the effect on the operating range of the compressor is analyzed and described using swirl distortion indices.
Global influence
Compressor map
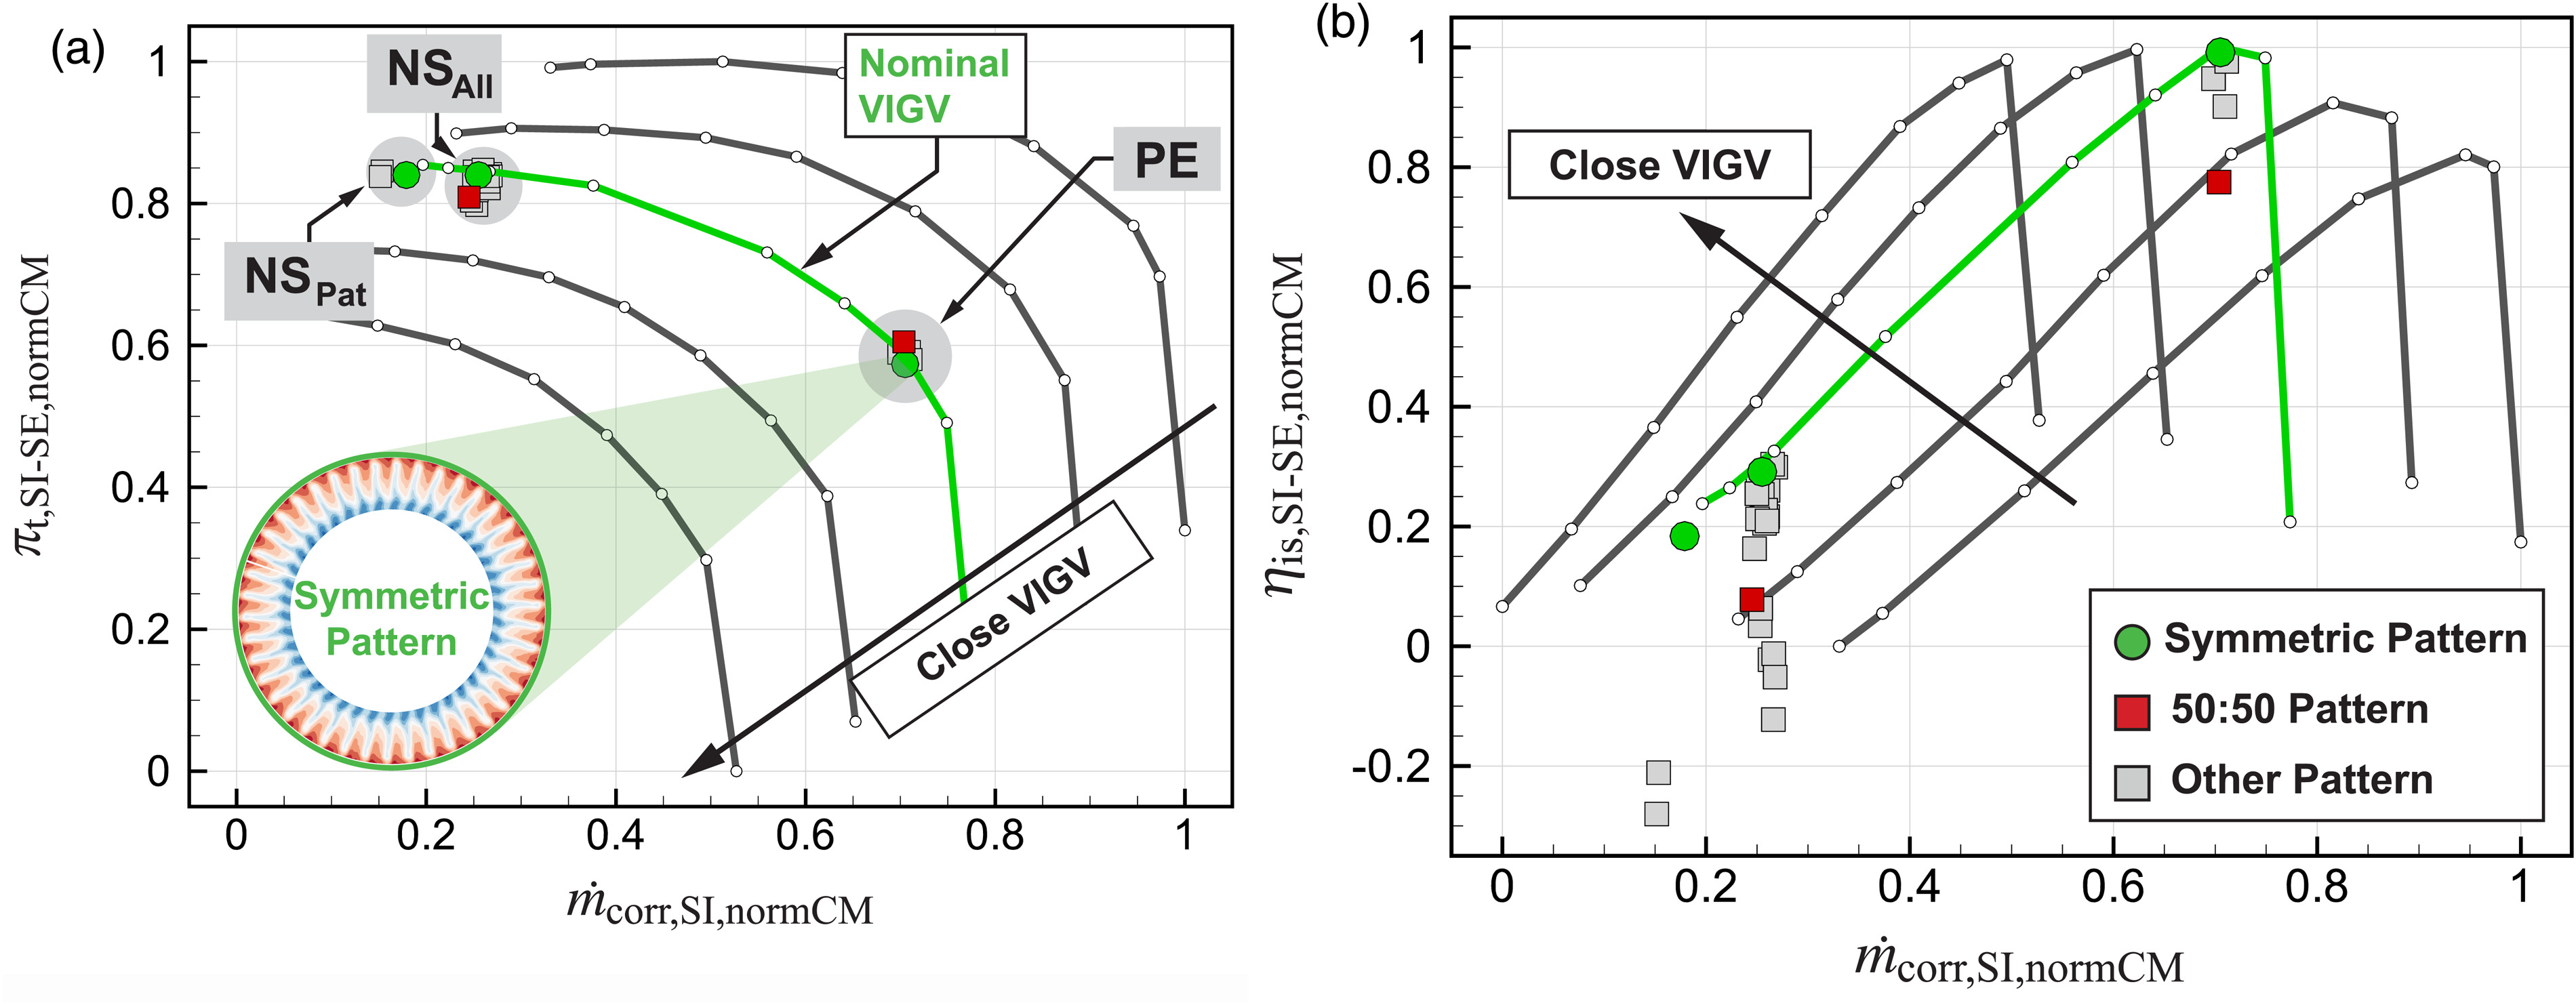
In Figure 4 the compressor characteristics are shown for 5 different, undistorted VIGV settings at the same corrected speed. The range of the different VIGV angles approximately reflects the stagger angle variation of the 50:50-pattern, which is later investigated in further detail. The nominal characteristic is depicted in green. Along all characteristics, the two-dimensional flow field of a single stator passage was acquired at 9 different corrected mass flow rates. In Figure 4a, the relative aa-total pressure ratio πt is shown and in Figure 4b the relative isentropic efficiency ηis. The stage inlet SI is used as reference for all flow quantities and the values are normalized with respect to the range of the compressor map. All characteristics are of the same shape, which emphasizes that the flow behaves similarly for this magnitude of VIGV variation and that no additional non-linear flow phenomena occur. This allows for a passage-wise view of the flow field, which is presented later.
Figure 4.
Compressor map. (a) Total pressure ratio and (b) Isentropic efficiency.
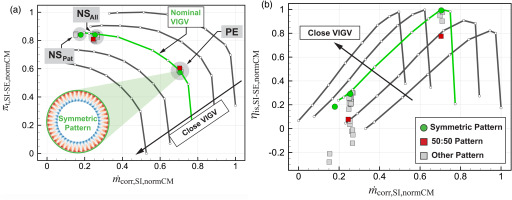
Besides of the undistorted characteristics, the aa-results of 360∘-measurements of various asymmetric VIGV patterns are depicted as squares. For comparison, the green symbols indicate the respective aa-results of the symmetric pattern. At the peak efficiency operating point (PE) the mass flow rate is constant due to the above described procedure of setting the patterns and the total pressure ratio is barely changed by the distorted flow (<1%). The measurements concur with the PCM assumption: The total-to-static pressure rise ps,SE/pt,SI at PE (not shown here) is almost identical for all patterns and the circumferential variation of static exit pressure is negligible. Closer to the stability limit all patterns show a slight decrease in pressure ratio at the near stall operating point representative for all patterns (NSAll), indicating additional losses and a reduced operating range compared to the undistorted case. The minimal mass flow rate for each individual pattern (NSPat) depends on the shape of the distortion and can be higher or even lower than for the nominal case. For all VIGV patterns, the isentropic efficiency of the compressor is significantly decreased compared to the undistorted case. For the 50:50-pattern the reduction is >3% at PE and at NSAll.
If the stage exit SE is used as reference plane for all flow quantities and the inlet pressure is taken from the 5HP at the rotor inlet, then the development of the swirl distortions is excluded from the control volume. However, the results (not shown here) are similar to the ones presented above. The parallel shift of the curves in Figure 4 leads to an almost identical range in exit mass flow for all characteristics. At PE, the distortion has again little influence on the global operating point. The operation of downstream stages is therefore only influenced by the spatial variation of the flow at the stage exit. At NSPat all patterns have a similar mass flow rate, in contrast to the described results with the inlet as reference plane.
Operating range
The observed changes in operating range are systematically investigated at the NSPat operating points of all different patterns. The corresponding measurements are carried out with a coarser angular resolution to save measurement time. However, the trends are consistent with the finer resolved 360∘-measurements that were only performed for selected patterns. Figure 5a shows the relative aa-stage exit static pressure at NSPat for a varying count of mis-staggered adjacent vanes and thus different sizes of the area with increased co-swirl. For distortions of small circumferential extent, the pressure decreases linearly with a gradient that depends on the magnitude of the distortion. The medium and small magnitude distortions feature 50% and 25% deviation in VIGV stagger angle compared to the primarily investigated large distortion of the 50:50-pattern. This linear behavior is in agreement with the results for the critical angle in the case of pressure distortions in Figure 1b (Reid, 1969). The angle can be determined to Θcrit≈85∘. For larger angles, the trend also corresponds with Reid’s results: At NSPat the 50:50-pattern and the 25:75-pattern exhibit a similar static pressure at the same minimum mass flow rate. This is somewhat unexpected, as it contradicts the model concept in Figure 1a. For Θ>Θcrit the PCM suggests a reduced loss in maximum static pressure. Possible reasons for this deviation will be discussed later.
Figure 5.
Influence of swirl distortions on global operating range. (a) Relative static pressure and (b) 0D-Distortion Parameters.
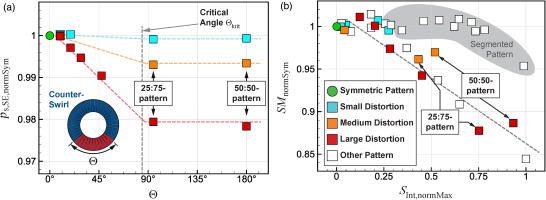
To describe inlet distortions and their influence on the stability limit, typically 0D-parameters are used. For pressure distortions, the DCΘ-coefficient was found to correlate with the loss in static pressure at the stability limit (Hynes and Greitzer, 1987). For the present investigation, the static exit pressure is no ideal descriptor as the minimum mass flow rate also varies. Therefore, the Stability Margin SM (Cumpsty, 2004),
which uses the corrected exit mass flow rate m˙corr,SE, and therefore considers both quantities, is used. Multiple swirl descriptors have been proposed to describe not only the intensity but also the shape of the distortion. For the presented data, a good correlation was found using the descriptor Swirl Intensity SInt from SAE Aerospace (2010). It quantifies the effective magnitude of the flow angle α with its integral over the whole circumference. In Figure 5b, a linear trend between both normalized quantities is observed. The SM of the 50:50- and the 25:75-patterns are similar, which is consistent with the previous observations. However, the respective values of the Swirl Intensity differ, as the definition of SInt neglects the critical angle. Additionally, deviations from the linear trend occur for patterns consisting of multiple segments (gray area). This might be attributed to a combination of the blade response time constant, which quantifies the sensitivity of the compressor blade to inlet distortions (Cousins, 2004), and the duration each blade spends in the distorted regions. For the segmented patterns, the time in the distorted sectors is apparently too small to affect the SM significantly.
Other descriptors as the Swirl Coefficient (Guo and Seddon, 1983) provide similar results. An improvement of the correlation by including the sensitivities to other distortion descriptors as proposed by SAE Aerospace (2010) was not achieved. The DCΘ-coefficient of all patterns has a maximum value of 0.07, which is considered to be low (Pazur and Fottner, 1990). Therefore, no large influence of non-linear coupling between pressure and swirl distortion is expected. This is confirmed by the fact, that no strong correlation between SM and DCΘ is observed.
Local influence
To extend the understanding regarding the observed variations in operating range, the local flow at the different axial measurement planes is considered. The investigated configurations are the patterns with a varying count of mis-staggered adjacent vanes and a large magnitude of the distortion. The focus is on the corresponding 50:50-pattern.
Rotor Inlet (RI)
The 360∘-flow field downstream of the VIGV is measured with the 5HP. The circumferential variation in aa-total pressure for the single passages is in the order of ±1%. The minimum value is located downstream of the diverging VIGV passage (see marker “A” in Figure 1a). Its magnitude does not change with the count of mis-staggered adjacent vanes. The absolute circumferential flow angle α varies strongly, i.e. ±50% for the 50:50-pattern. For an area of mis-staggered vanes greater than Θ=22.5∘, the flow deflection is fully developed and the difference in α equals the difference in VIGV angle. Therefore, neither the variations in total pressure nor in flow angle can explain the linear trend in Figure 5b or why the 50:50-pattern has the same SM as the 25:75-pattern.
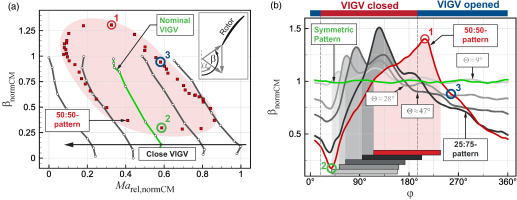
For tip critical rotors, compressor instability originates at the blade tip. The relative circumferential flow angle β and the relative Mach number Marel influence the shock topology. Their passage-wise aa-values can be calculated from the 5HP data. In Figure 6a both quantities are depicted for the same undistorted characteristics as in Figure 4. All near stall values of β are in the same order of magnitude, defining the critical incidence of the airfoil, and Marel varies with the respective VIGV- and throttle setting. The individual passages of the 50:50-pattern at NSAll are shown as well. A large variation in relative flow angle can be observed. As expected, the compressor locally operates at different operating points at different characteristics. However, the local operating points vary more than would be suggested from the VIGV pattern with only two distinct vane angles (compare Figure 1a). This is due to the developing mass flow redistribution. Single passages already operate beyond the critical incidence of the symmetric configurations. The maximum incidence is observed downstream of converging VIGV passage (see red markers “1” in all following figures). The minimum incidence develops downstream of the diverging VIGV passage and leads to operation close to the PE mass flow rate of the nominal configuration (see green markers “2”). In Figure 6b, the circumferential distribution of β at the rotor tip is depicted for 360∘-measurements of different counts of mis-staggered adjacent vanes. The measured flow angles at NSAll are extrapolated to the values at the respective last stable operating points NSPat. This is possible due to the relation between mass flow rate and relative flow angle (not shown here), which is strictly linear over the whole characteristic, and the small differences in mass flow rate. It is evident, that all different patterns locally operate beyond the maximum incidence of the symmetric configuration. While the minimum mass flow rates of the patterns change, that respective portion (see rectangular markers) of the circumference remains similar in size. Its circumferential extent at the stability limit is about 105∘, hence close to the determined critical angle. This is remarkable, as it cannot be derived from literature. It also explains the linear trend in Figure 5b, e.g. that for smaller distorted areas smaller mass flow rates and thus larger static pressure can be achieved until this circumferential extent, hence instability, is reached. However, both the 50:50- and 25:75-pattern, exhibit a distorted area of this size at NSPat at an identical mass flow rate. This is due to the local variation of mass flow at the rotor tip region, which influences the local value of β. An increasing count of mis-staggered vanes leads to a greater circumferential and radial redistribution of mass flow. Only for these two patterns this variation affects the entire circumference. In rotational direction, the mass flow rate continuously decreases downstream of the closed vanes and increases downstream of the opened vanes. This results in identical amplitudes of the local mass flow variation for both patterns and thus to an identical SM.
Figure 6.
Relative flow angle at the Rotor Inlet (RI). (a) Compressor map with aa-Values and (b) Circumferential distribution at the blade tip at NSPat.
Rotor Tip (RT)
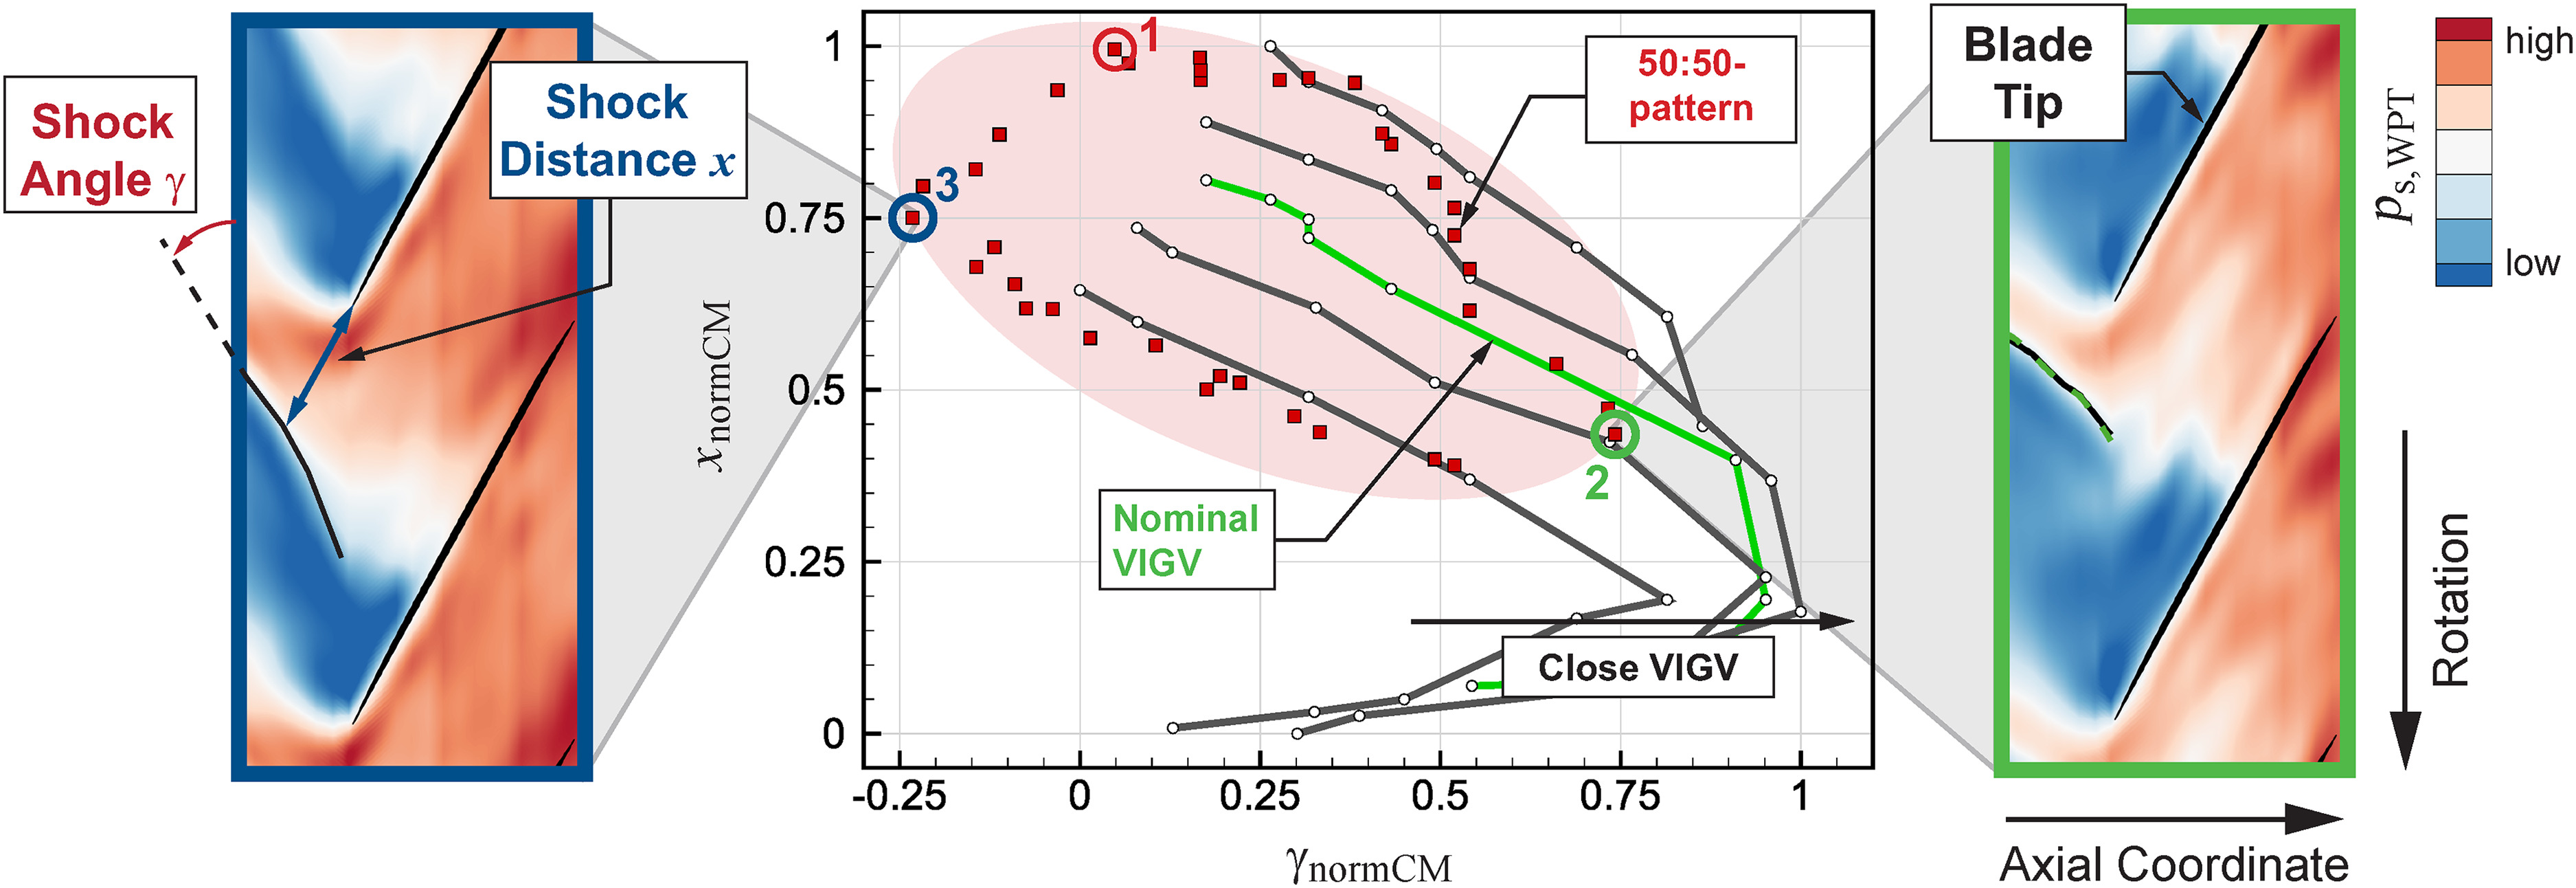
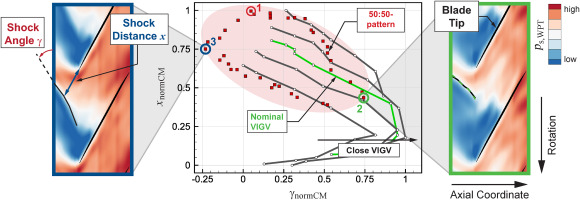
To confirm the aa-results from measurement plane RI, the 360∘-data from the axial WPT-array at the rotor tip is used to analyze the developing shock topology. In Figure 7 (right) the ensemble averaged flow field at the circumferential position with minimum incidence is shown for the 50:50-pattern. The shock position (black line) is similar to the undistorted characteristic with the same mass flow rate (dashed green line). The shock is already detached from the blade, its angle γ and distance x to the leading edge are indicated on the left side. For the undistorted characteristics and all passages of the 50:50-pattern, these derived quantities are plotted in Figure 7 (center). A variation of the operating point along and beyond the different characteristics is observed. Its amplitude matches the respective changes in mass flow and local VIGV characteristic, which confirms that the aa-5HP results are valid. The compressor can locally operate beyond the undistorted stability limit if a large enough portion of the annulus remains in stable operation. The passage with maximum incidence exhibits the largest shock distance (see red markers “1”). However, most operation beyond the stability limit is due to comparably small shock angles (see blue markers “3,” compare flow field in Figure 7 (left)). In contrast to Reid’s results this behavior not only occurs for Θ<Θcrit. Consequently, the PCM assumption of the global stability limit, i.e. maximum static pressure for the co-swirl characteristic in Figure 1a, is not valid. This is supported by the observation of mass flow redistribution at measurement plane RI and might explain the constant static pressure for large distorted areas from Figure 5a.
Figure 7.
Static pressure field (outer parts) and shock quantities (center) at the Rotor Tip (RT).
Rotor Exit (RE) and Stage Exit (SE)
At measurement plane SE, data is acquired via a 5HP- and two Kiel rakes. Downstream of the stator, the absolute flow angle α locally varies by only ±1% around its mean value, which is similar to the mean value at the rotor inlet. This is a significant reduction in amplitude compared to the rotor inlet measurement plane (RI) and shows the damping effect of upstream vanes also described by SAE Aerospace (2010). Instead, the variations in total pressure and temperature increase to ≈±3% at RE and SE. In Figure 8 (left) the measured 360∘-flow field of πt,RI−SE for the 50:50-pattern is shown. All values are normalized with the global aa-mean value. The areas of opened and closed vanes are clearly distinguishable. As expected, the aa-pressure ratio per passage is lower for the closed area. However, the local maximum values are also located in this region at the blade tip. In general, larger radial gradients develop downstream of the closed VIGV, which indicates local operation close to the stability limit (Karl et al., 2023). The corresponding operating points for all individual passages are shown in Figure 8 (right). The respective mass flow rate is determined from the 5HP data at the rotor inlet. The matching between local mass flow and pressure at measurement plane SE was achieved via preliminary measurements of the phase difference in pressure and temperature between the two measurement planes. It is evident, that the local operating points follow the shape of the symmetric characteristics and fit the results from the measurement planes at the rotor inlet (RI) and the rotor tip (RT), especially for the passages downstream of the closed VIGV. The drop close to the stability limit in the opened section (see blue markers “3”) points toward additional losses and could explain the reduced pressure ratio of the 50:50-pattern in Figure 4a. It is mainly caused by the flow at the rotor tip, see 2D-field data in Figure 8 (left), and potentially related to the local shock topology: The data from measurement plane RT indicate the smallest shock angles at the respective circumferential position. A reduced efficiency resulting from this pronounced off-design operation is likely.
Figure 8.
Flow field and compressor map per passage at the stage exit (SE).
Due to the attenuation of the swirl variation, the difference between the characteristics of the local operating points is smaller compared to measurement plane RI. However, the variation in mass flow rate is similar to what can be inferred from the WPT data. Even at the stage exit, parts of the circumference are beyond the stability limit of the undistorted compressor. This is mainly the case for the area downstream of the closed VIGV, which explains the large radial gradients in Figure 8 (left).
Conclusions
This study presents the results of a systematic test of generic VIGV-induced swirl distortions with respect to their global influence on compressor behavior and their local development through the stage. The study further assesses the applicability of the Parallel Compressor Model on swirl distortions. It was found that deviations in VIGV angle of attack globally lead to a reduction in isentropic efficiency and pressure ratio. Swirl distortions are attenuated through the stage and eventually develop into pressure and temperature distortions. The operating range is influenced by the magnitude and the shape of the distorted flow. A linear trend between the 0D-parameters Stability Margin and Swirl Intensity is observed. In general, the effects of swirl distortions can qualitatively be described by means of the Parallel Compressor Model: The single passages of the distorted compressor locally operate along the undistorted characteristics with the respective VIGV angle. There is a critical angle above which the global static pressure at the stability limit no longer changes when increasing the distorted area. However, a considerable mass flow redistribution occurs, so that the PCM cannot be used as a stability criterion. At the stability limit, all VIGV patterns show a local exceedance of the undistorted case, e.g. in relative flow angle. As long as the respective share of the circumference is small enough, stable operation is ensured. Influencing parameters are the mass flow rate and the count of mis-staggered vanes. The relation between the critical angle and this share of the circumference of about 105∘ has yet to be determined. However, its constant value explains the linear trend in Stability Margin.
Nomenclature
Latin Symbols
Distortion Coefficient (-)
Corrected Mass Flow Rate (kg/s)
Greek Symbols
Absolute Circ. Flow Angle (∘)
Relative Circ. Flow Angle (∘)
Isentropic Efficiency (-)
Circumferential Extent (∘)
Circumferential Coordinate (∘)
Abbreviations
Normalized to Compressor Map
Norm. to Symmetric Pattern
Near Stall Operating Point
Parallel Compressor Model
Peak Efficiency Operating Point
Rotor Exit Measurement Plane
Rotor Inlet Measurement Plane
Rotor Tip Measurement Plane
Stage Exit Measurement Plane
Stage Inlet Measurement Plane
Transonic Compressor Darmstadt 2
Variable Inlet Guide Vane