
Introduction
The design of gas turbines is likely to play a large role in the drive towards global decarbonization. They will be crucial in systems used in the transition to sustainable fuels and for enabling flexible operation power stations to compensate for gap between power demand and renewable energy supply. Across all applications, increasing gas turbine efficiency is beneficial for both environmental and economic reasons. Among other methods, designers seek to improve gas turbine efficiency by reducing cooling air mass flow rate and increasing the turbine inlet temperature, which results in high temperature ratios between the metal temperature and cooling air. Hence, to achieve higher efficiencies, it is key to improve the effectiveness of cooling in order to reduce cooling air mass flow rate and enable higher turbine inlet temperatures.
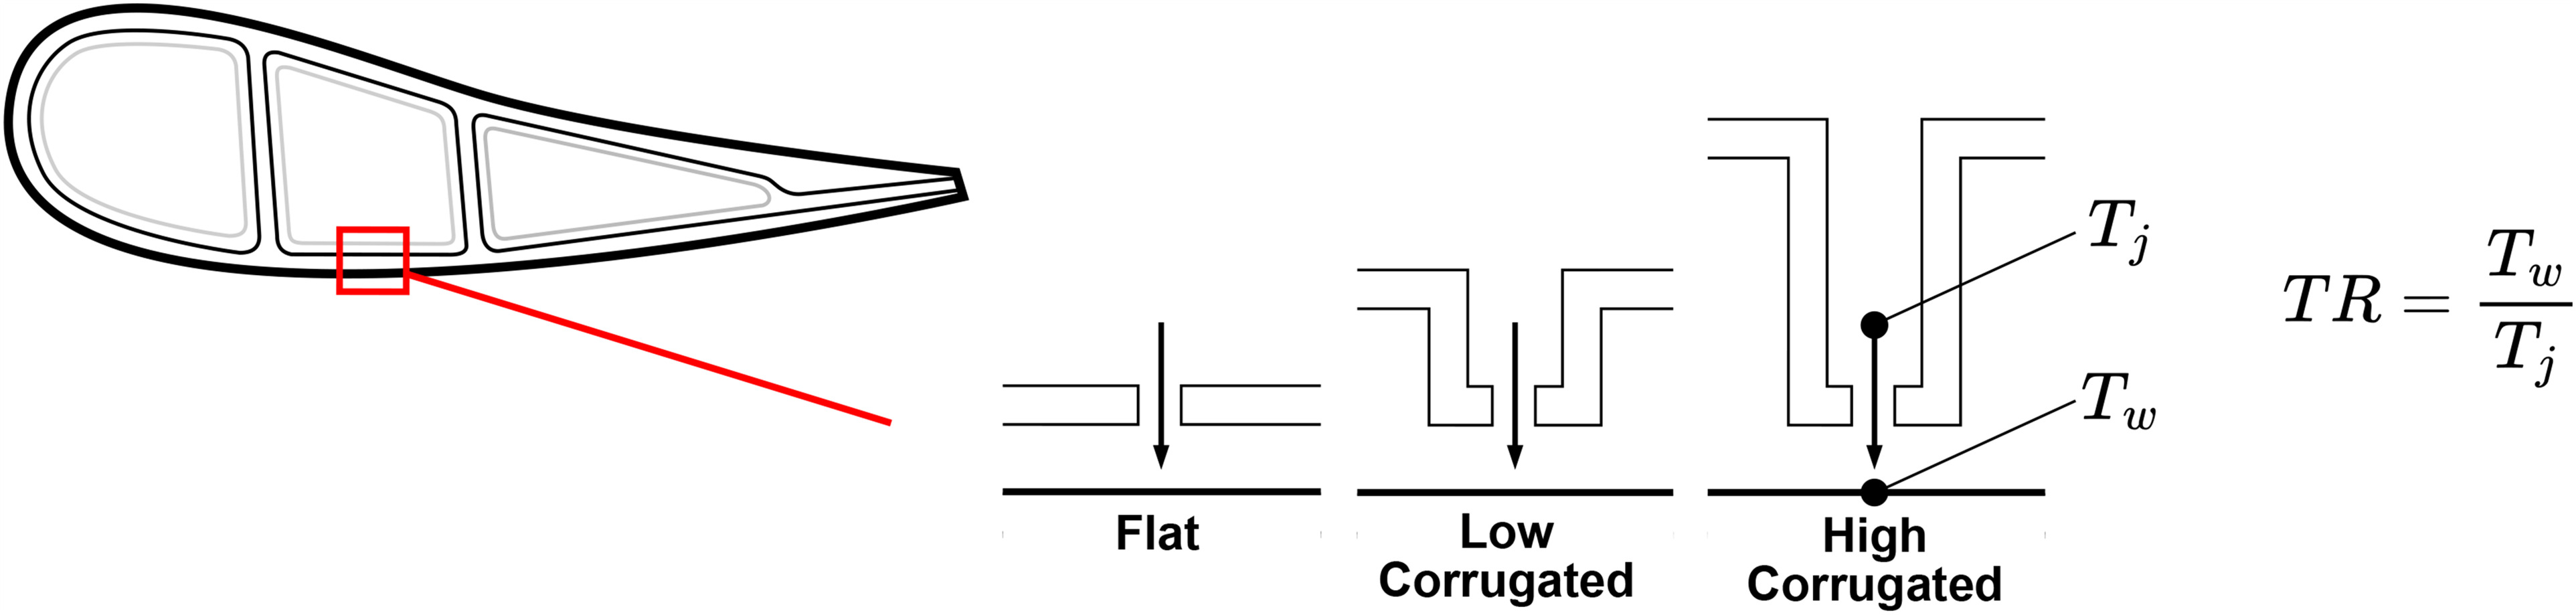
Impingement cooling is a well established method to internally cool high temperature turbine components. Figure 1 shows the impingement cooling inserts within a gas turbine vane. The high temperature turbine components used in modern cycles pose a challenge because they require increased cooling, which often comes at the expense of efficiency due to the increased cooling air demand. Hence there is an interest to explore mechanisms which increase the effectiveness of impingement cooling, enabling high temperature components to be cooled with smaller cooling air mass flow rates to increase turbine efficiency. Furthermore, by increasing the effectiveness of internal cooling methods such as impingement cooling, the dependence on film cooling can be reduced. This is hugely beneficial, since eliminating film cooling holes could reduce manufacturing cost, decrease stress concentrations and increase the life of the blade.
Figure 1.
Typical internal structure of gas turbine vane and different corrugated height configurations.
Research on impingement cooling is well established and the experimental correlations developed in early studies are commonly used in impingement cooling design. A study by Guzlntner et al. (1970) investigated the flow characteristics of a single turbulent jet impinging on a flat plate, categorising the impingement into four distinct regions: flow establishment region, established flow region, deflection region and wall jet region. Correlations for impingement jet arrays were developed experimentally by Kercher and Tabakoff (1970) - they found that hole spacing to diameter ratio, jet Reynolds number and crossflow mass flow rate are key factors for heat transfer. Florschuetz et al. (1981) studied the effect of momentum ratio between crossflow and the impingement jet using an experimental rig for inline and staggered jet array configurations and they developed correlations. To replicate impingement at the leading edge of a turbine airfoil, Chupp et al. (1969) experimentally investigated impingement cooling with concave target walls and developed correlations. Furthermore, other studies explore and present correlations for geometries with staggered holes (Behbahani and Goldstein, 1982) and different exit configurations (Obot and Trabold, 1987; Garimella and Schroeder, 2001), as well as optimising jet to jet pitch (San and Lai, 2001) and the distance between the impingement and target plates (Brevet et al., 2002). Physics, correlations and numerical modelling for jet impingement heat transfer were reviewed by Zuckerman and Lior (2006). The numerical studies highlight the challenge of modelling impingement jet flows, which are characterised by large velocity gradients and property changes, as well as the limitations of RANS based turbulence models in predicting such flows. Considering solution speed and accuracy, Zuckerman and Lior recommended the use of v2–f and SST turbulence models.
One of the key problems for impingement jet arrays is accumulated crossflow. Spent air from upstream jets proceeds downstream as crossflow, and negatively affects heat transfer by distorting downstream jets (Florschuetz and Su, 1987; Miao et al., 2009). To mitigate the detrimental effects of crossflow, many studies explore new geometrical configurations. Modern typical crossflow countermeasures in literature are summarised on Table 1. The key aim across all geometries is to protect the impingement jet by diverting crossflow, to maintain effective heat transfer. As presented by Esposito et al. (2007), Chi et al. (2013), Ito et al. (2023) and Hatta et al. (2024), one promising geometry is the corrugated wall configuration, which is explored in this paper. The geometry provides cavities either side of the impingement hole. This increases cross-sectional flow area, which reduces crossflow velocity and allows crossflow to lift up and travel downstream with reduced interaction with downstream jets. Literature shows that the geometry is effective: it can provide a 10–15% heat transfer improvement (Esposito et al., 2007) and maintains a more uniform heat transfer distribution (Chi et al., 2013). The corrugated geometry is shown to be particularly effective for enhancing heat transfer under high crossflow conditions, providing up to a 20% Nusselt number enhancement compared to a flat plate geometry (Ito et al., 2023; Hatta et al., 2024).
Table 1.
Summary of crossflow countermeasures in literature.
| Reference | Geometry | Type of study | Parameters | Key findings | |
|---|---|---|---|---|---|
| Madhavan et al. (2020) | Impingement: FlatTarget: Flat with Diverter | 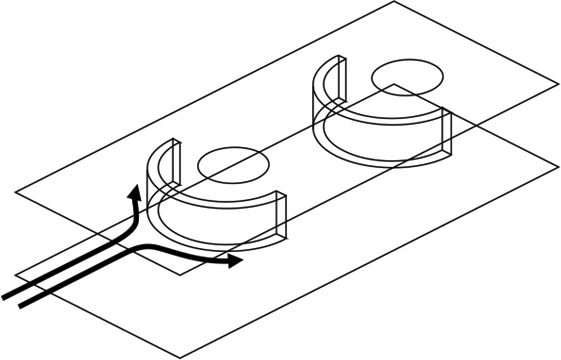 | Experimental/Numerical | Re = 3,500–12,000 Jet spacing p/d = 6 Jet to target spacing z/d = 2 | At the same pumping power, crossflow diverters provided 9–15% higher heat transfer |
| Tang and Acharya (2020) | Impingement: Flat with return hole Target: Flat | 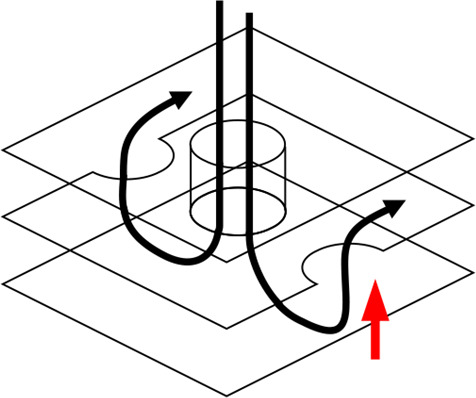 | Experimental | Re = 20,000 Jet spacing p/d = 5 Jet to target spacing z/d = 1–9 | At small jet to target spacing, return holes have significant influence on the degradation effects by crossflow |
| Esposito et al. (2007) | Impingement: Corrugated wall Target: Flat | 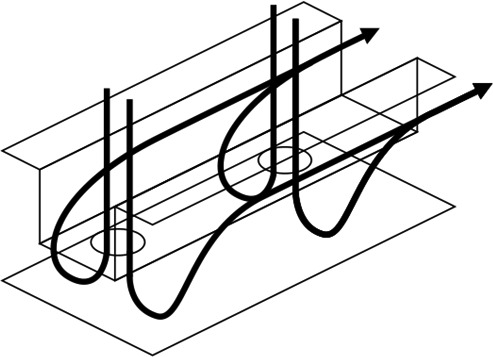 | Experimental | Re = 20,000–60,000 Jet spacing p/d = 5 Jet to target spacing z/d = 3 Corrugated height h/d = 3 | 10–15% higher heat transfer at downstream jets were produced using corrugated walls. |
| Esposito et al. (2007) | Impingement: Extended port Target: Flat |  | Experimental | Re = 20,000–60,000 Jet spacing p/d = 5 Jet to target spacing z/d = 3 Extended port height h/d = 3 | At high Reynolds numbers, extended port geometries produced similar heat transfer benefits to corrugated wall. |
| Tepe et al. (2020) | Impingement: Extended port Target: Flat | 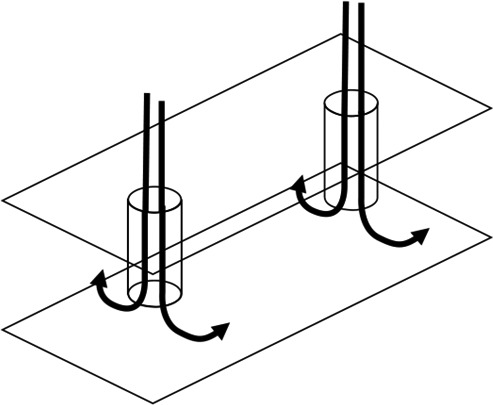 | Experimental/Numerical | Re = 16,250–32,500 Jet spacing p/d = 5 Jet to target spacing z/d = 1–6 Extended port height h/d = 0–5 | At h/d = 4, The highest average Nu numbers of extended port were obtained. |
| Chi et al. (2013) | Impingement: Corrugated wall Target: Flat |  | Experimental/Numerical | Re = 5,000–40,000 Jet spacing p/d = 8 Jet to target spacing z/d = 1–3 Corrugated height h/d = 3 | More uniform heat transfer on the target surface were provided by corrugated structures. |
| Kim et al. (2021) | Impingement: Corrugated wall Target: Flat with rib | 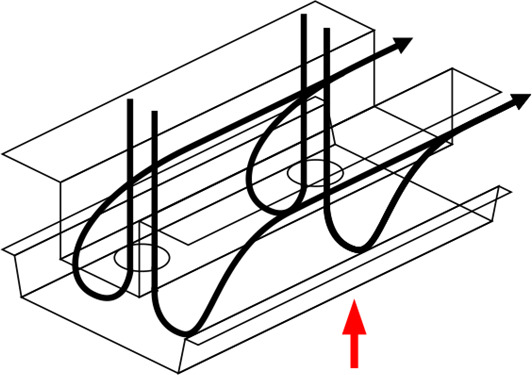 | Experimental/Numerical | Re = 5,000–30,000 Jet spacing p/d = 4 Jet to target spacing z/d = 3 | 5–20% higher Nusselt number were shown by corrugated structure with ribs. |
| Kim et al. (2023) | Impingement: Corrugated wall with wing Target: Flat | 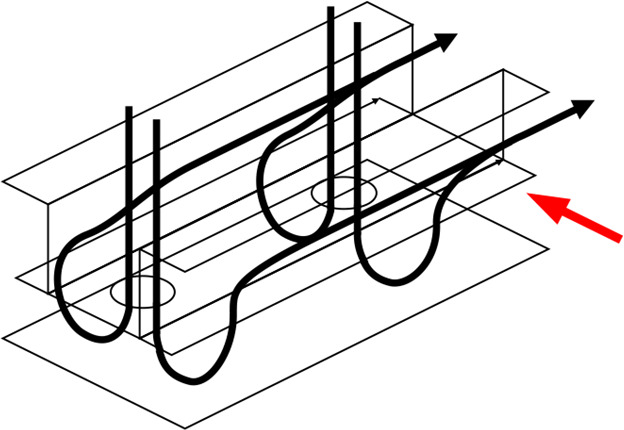 | Experimental | Re = 10,000 Jet spacing p/d = 5 Jet to target spacing z/d = 1 Corrugated height h/d = 3 | 6% higher Sherwood number were obtained by corrugated wall with anti-crossflow wing |
| Ito et al. (2023) | Impingement: Corrugated wall Target: Flat | 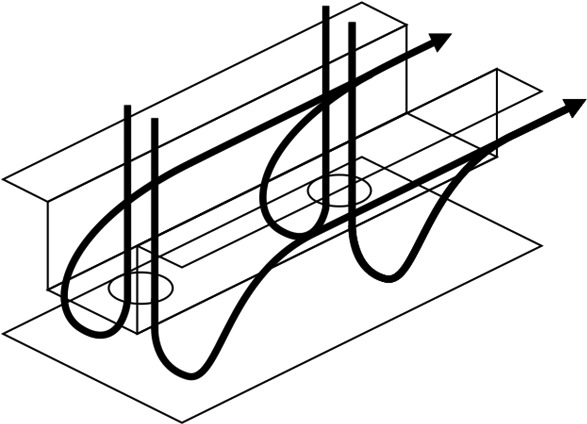 | Experimental | Re = 10,000 Jet spacing p/d = 12.5 Jet to target spacing z/d = 3.5 Corrugated height h/d = 9 | Even though high crossflow conditions, impingement heat transfer coefficient does not change significantly using corrugated wall. |
| Hatta et al. (2024) | Impingement: Corrugated wall Target: Flat |  | Numerical | Re = 10,000 Jet spacing p/d = 8 Jet to target spacing z/d = 2 Corrugated height h/d = 3,9 | At high crossflow conditions, 20% higher Nusselt number were provided by corrugated structures. |
Meanwhile, another key problem in the design of high temperature gas turbines components is that a high temperature ratio between the target wall and impingement jet can negatively impact jet performance. Goodro et al. (2007) experimentally studied effect of temperature ratio on jet array impingement heat transfer and developed a power law correlation relating the decrease in Nusselt number to temperature ratio, up to TR 1.73.A numerical study on effect of temperature ratio by Lu et al. (2021) obtained a good agreement with the correlations of Goodro et al. (2007). Soghe et al. (2019) conducted a numerical study on effect of temperature ratio using either the wall temperature or film temperature as the reference for calculating the thermal conductivity and obtained a different power law trend to Goodro et al. (2007), highlighting that the importance of selecting an appropriate reference temperature when calculating a thermal conductivity in the Nusselt number evaluation.
Additive manufacturing presents an opportunity to explore new design configurations to improve impingement cooling effectiveness and to overcome the detrimental effects of high temperature ratios. Corrugated geometries are shown to be a promising approach to mitigating crossflow and additive manufacturing offers the possibility to manufacture corrugated inserts more easily and to be designed with variable height. Hence, this paper explores the potential of corrugated geometries with different heights as a method to enhance impingement cooling for next generation gas turbines.
To reduce cooling air temperature, a pre-cooler can be introduced for industrial gas turbines to enable a reduced cooling air mass flow rate and increased turbine inlet temperatures, whilst maintaining a suitable wall temperature. Both mechanisms aim to increase overall turbine efficiency, however, they result in increased temperature ratio. Experimentally, it is challenging to obtain data for the high temperature ratios (TR 2.0) that would be found in high temperature gas turbine components. Furthermore, there is no literature exploring the use of corrugated geometries in a high temperature ratio setting and little literature which considers the high crossflow conditions that result from reduced film cooling and in vanes with larger hole arrays (more than 10 inline jets).Therefore, this paper numerically explores the application of corrugated geometries for a range of high temperature ratios (up to TR 2.0) and crossflow conditions. Firstly, the numerical setup is presented and validated against experimental and numerical results from literature. Then, the effect of temperature ratio is studied without initial (inlet) crossflow; fluid properties and momentum ratio are analysed to understand key mechanisms by which temperature ratio impacts crossflow accumulation. Finally, a range of temperature ratios and initial crossflow conditions are studied to understand the overall enhancement provided by the corrugated geometry across different possible design scenarios.
Numerical simulation method
In this study, a 10 hole inline impingement array is used. Figure 2 shows the geometrical configuration and boundary locations of the modelling domain. For all geometries, the hole diameter is set to d = 5 mm, streamwise and spanwise hole pitch are set to p/d = 8, impingement plate thickness is set to t/d = 1, distance from the impingement plate to the target plate is set to z/d = 2 and corrugated wall width is set to w/d = 4. It has been shown by Hatta et al. (2024) that heat transfer enhancement becomes saturated beyond height ratios of h/d = 9. Therefore, in this study, only corrugated wall heights of h/d = 3 and 9 are investigated, which are defined as low and high corrugated cases. The h/d = 3 and 9 geometries have 1.75 and 3.25 times the cross sectional flow area of the flat case, respectively.
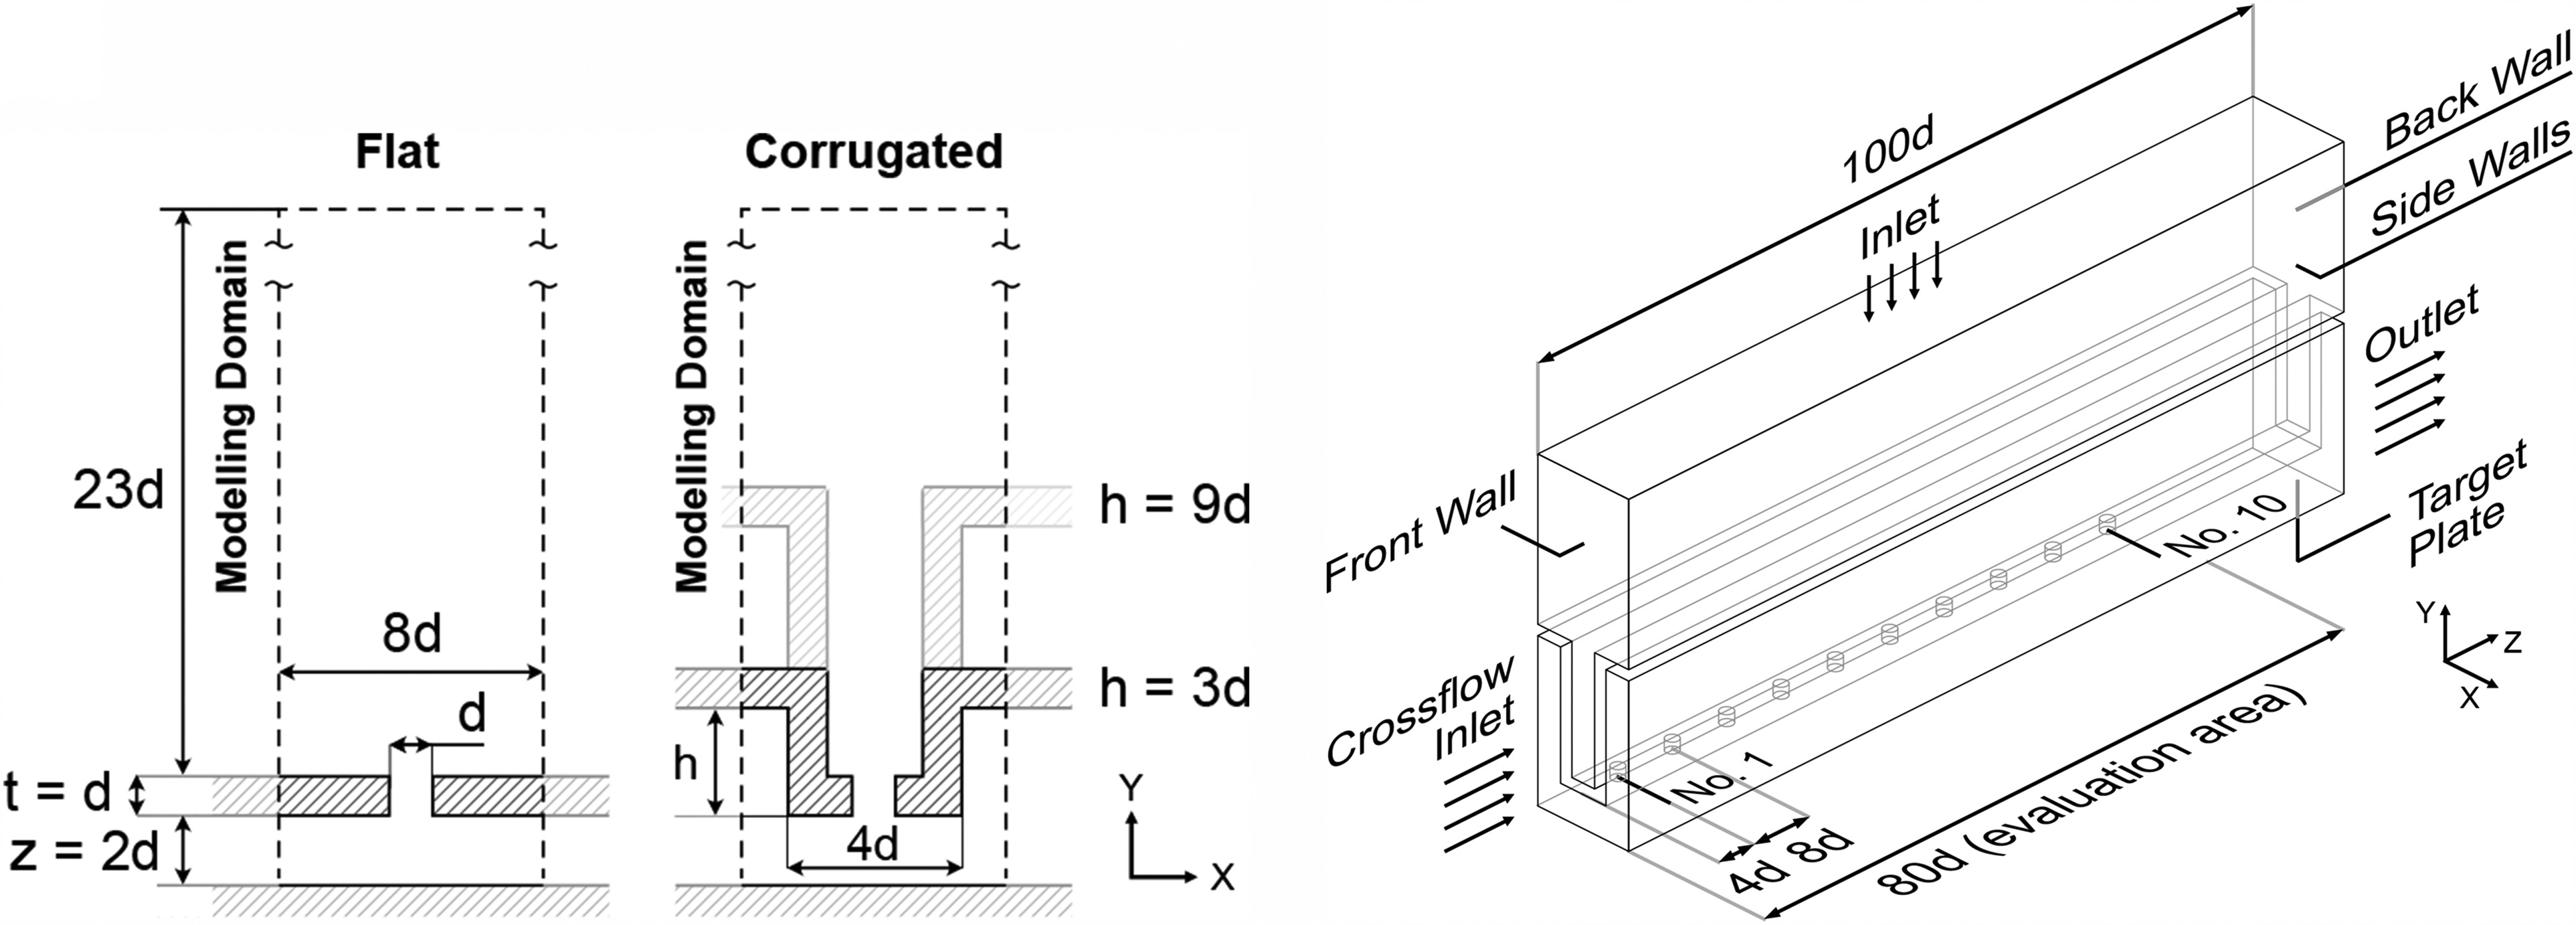
At the inlet, a mass flow boundary type is set to ensure a jet Reynolds number ≈104 (based on the hole diameter), with a temperature of 293 K. At the outlet, a fixed static pressure boundary condition of 1 atm is applied. It was chosen to use temperature ratios of 1.1, 1.3, 1.6 and 2.0 between the target wall and impingement jet, corresponding to target plate wall temperatures of 323, 381, 469 and 586 K, respectively. To account for the effect of adjacent hole arrays, the side walls of the domain have a periodic boundary condition. All other surfaces have an adiabatic condition. The crossflow inlet has a mass flow boundary type, with a temperature equal to the average of the jet and target wall temperatures. To simulate the effect of larger hole arrays, 3 different initial (inlet) crossflow ratios (CR = 0.03, 0.3 and 0.6) are used, with initial crossflow ratio being defined as the ratio of the initial crossflow to the inlet mass flow rate. This methodology allows multiple design configurations to be explored for each using a single mesh for each geometry. For all simulations, air is used as the fluid and temperature dependent thermophysical properties are considered.
In this study, ANSYS Fluent 2023 R1 is used to solve the steady three-dimensional Reynolds Averaged Navier Stokes (RANS) equations. Following the recommendation by Zuckerman and Lior (2006), an SST k-ω turbulence model is selected and the mesh size near the target wall is set to y+ ≈ 1.
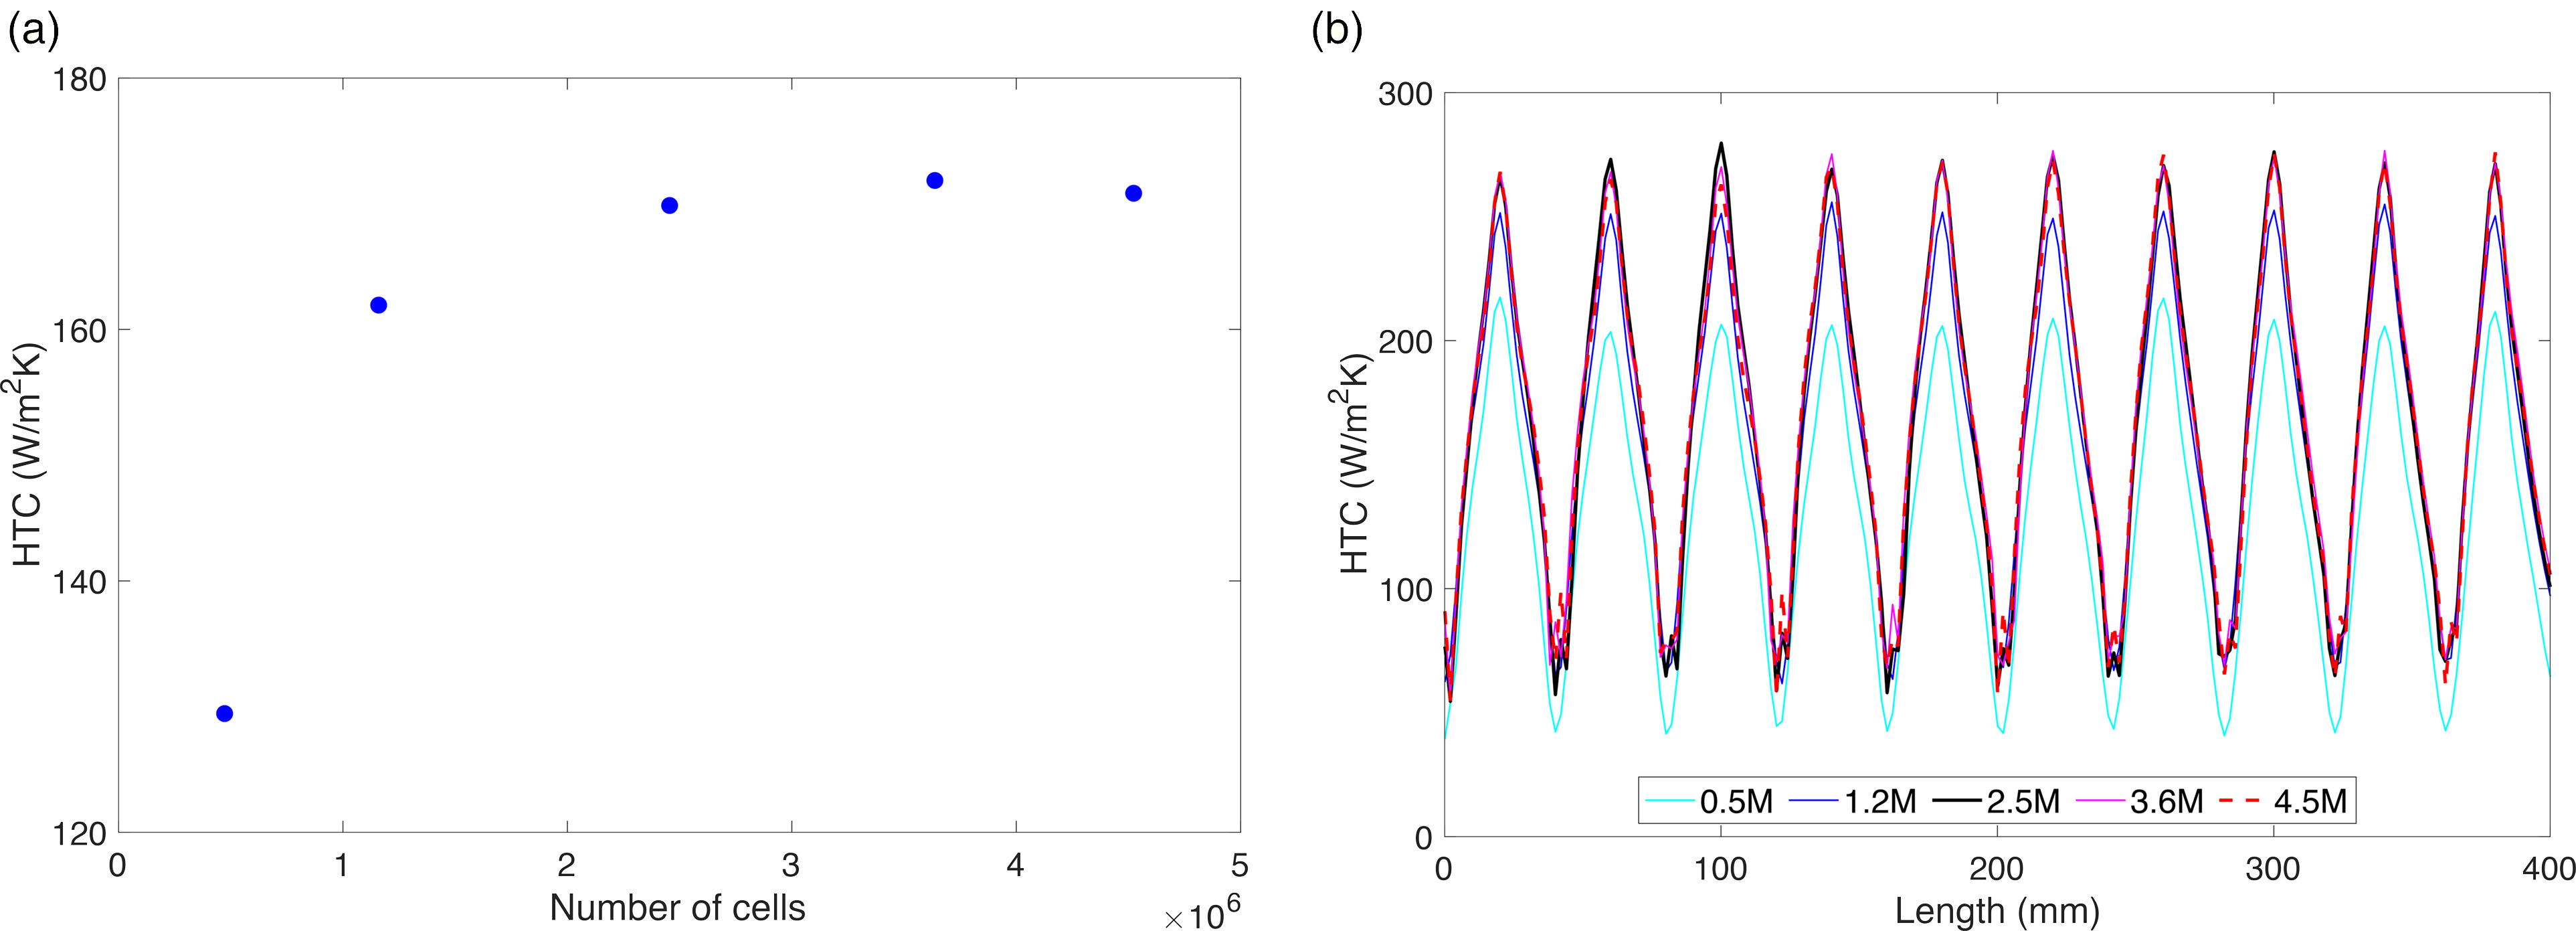
To evaluate the grid dependence, 5 different meshes (0.5, 1.2, 2.5, 3.6 and 4.5 million cells) are calculated for the corrugated h/d = 9 geometry. Figure 3a shows that area averaged heat transfer coefficient increases with grid resolution up to a grid size of 2.5 million cells, at which point the increase becomes saturated. Errors for the 0.5, 1.2, 2.5 and 3.6 million meshes relative to the 4.5 million mesh are 24.3%, 5.2%, 0.6% and 0.6% respectively. More detailed analysis of the spanwise average heat transfer coefficient distribution in Figure 3b reveals a discrepancy in the peaks of the 0.5 and 1.2 million meshes relative to the 4.5 million mesh. The 2.5 million mesh is chosen as it shows better agreement at the peaks and the area averaged value has only a small error for significantly reduced computational cost.
Figure 3.
Variation of heat transfer coefficient with number of cells in mesh. (a) Area average heat transfer coefficient (b) distribution of spanwise average heat transfer coefficient.
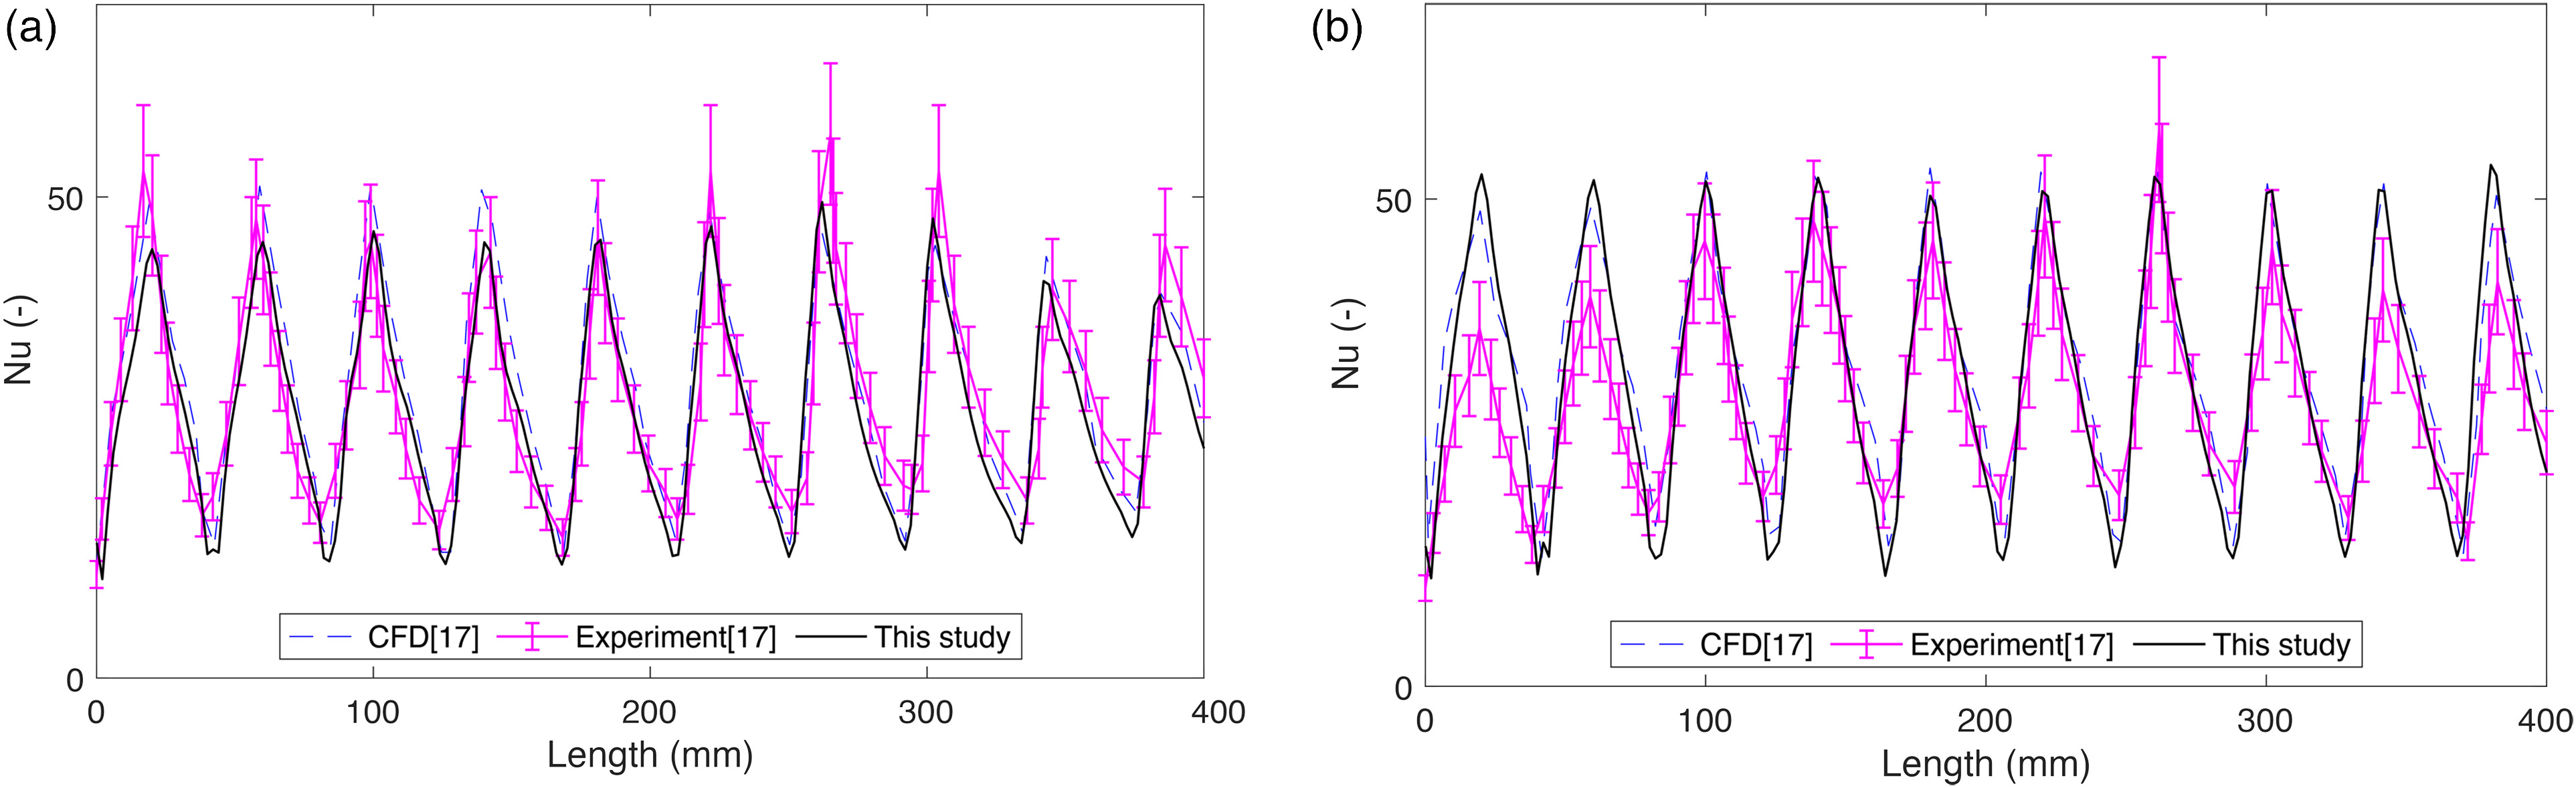
To validate the numerical calculations, results are compared with numerical and experimental results obtained by Chi et al. (2013). The study used configurations with 10 inline holes (d = 5 mm, z/d = 2, p/d = 8 for flat and corrugated h/d = 3), which were reproduced and simulations were performed. As specified, a temperature of 293 K is set at the target wall and 323 K is set at the inlet. The distribution of spanwise average Nusselt number at Re = 13,000 are compared in Figure 4. Error bars are included for the experimental results, corresponding with an experimental uncertainty of 13% mentioned in the study. Given that the exact upstream and exit boundary conditions are not specified, the larger discrepancy seen across the first and last 2 holes can be expected. In both cases, the results for the middle 6 holes are within the experimental uncertainty for the majority of points, so overall the agreement is considered acceptable.
Before discussing flow mechanisms and heat transfer details, evaluation parameters are defined in Table 2.
Table 2.
Evaluation parameters
| Jet Reynolds number is defined in Equation 1, where ρ is the density, V is the area average velocity at hole exit, d is the hole exit diameter, and μ is dynamic viscosity. | |
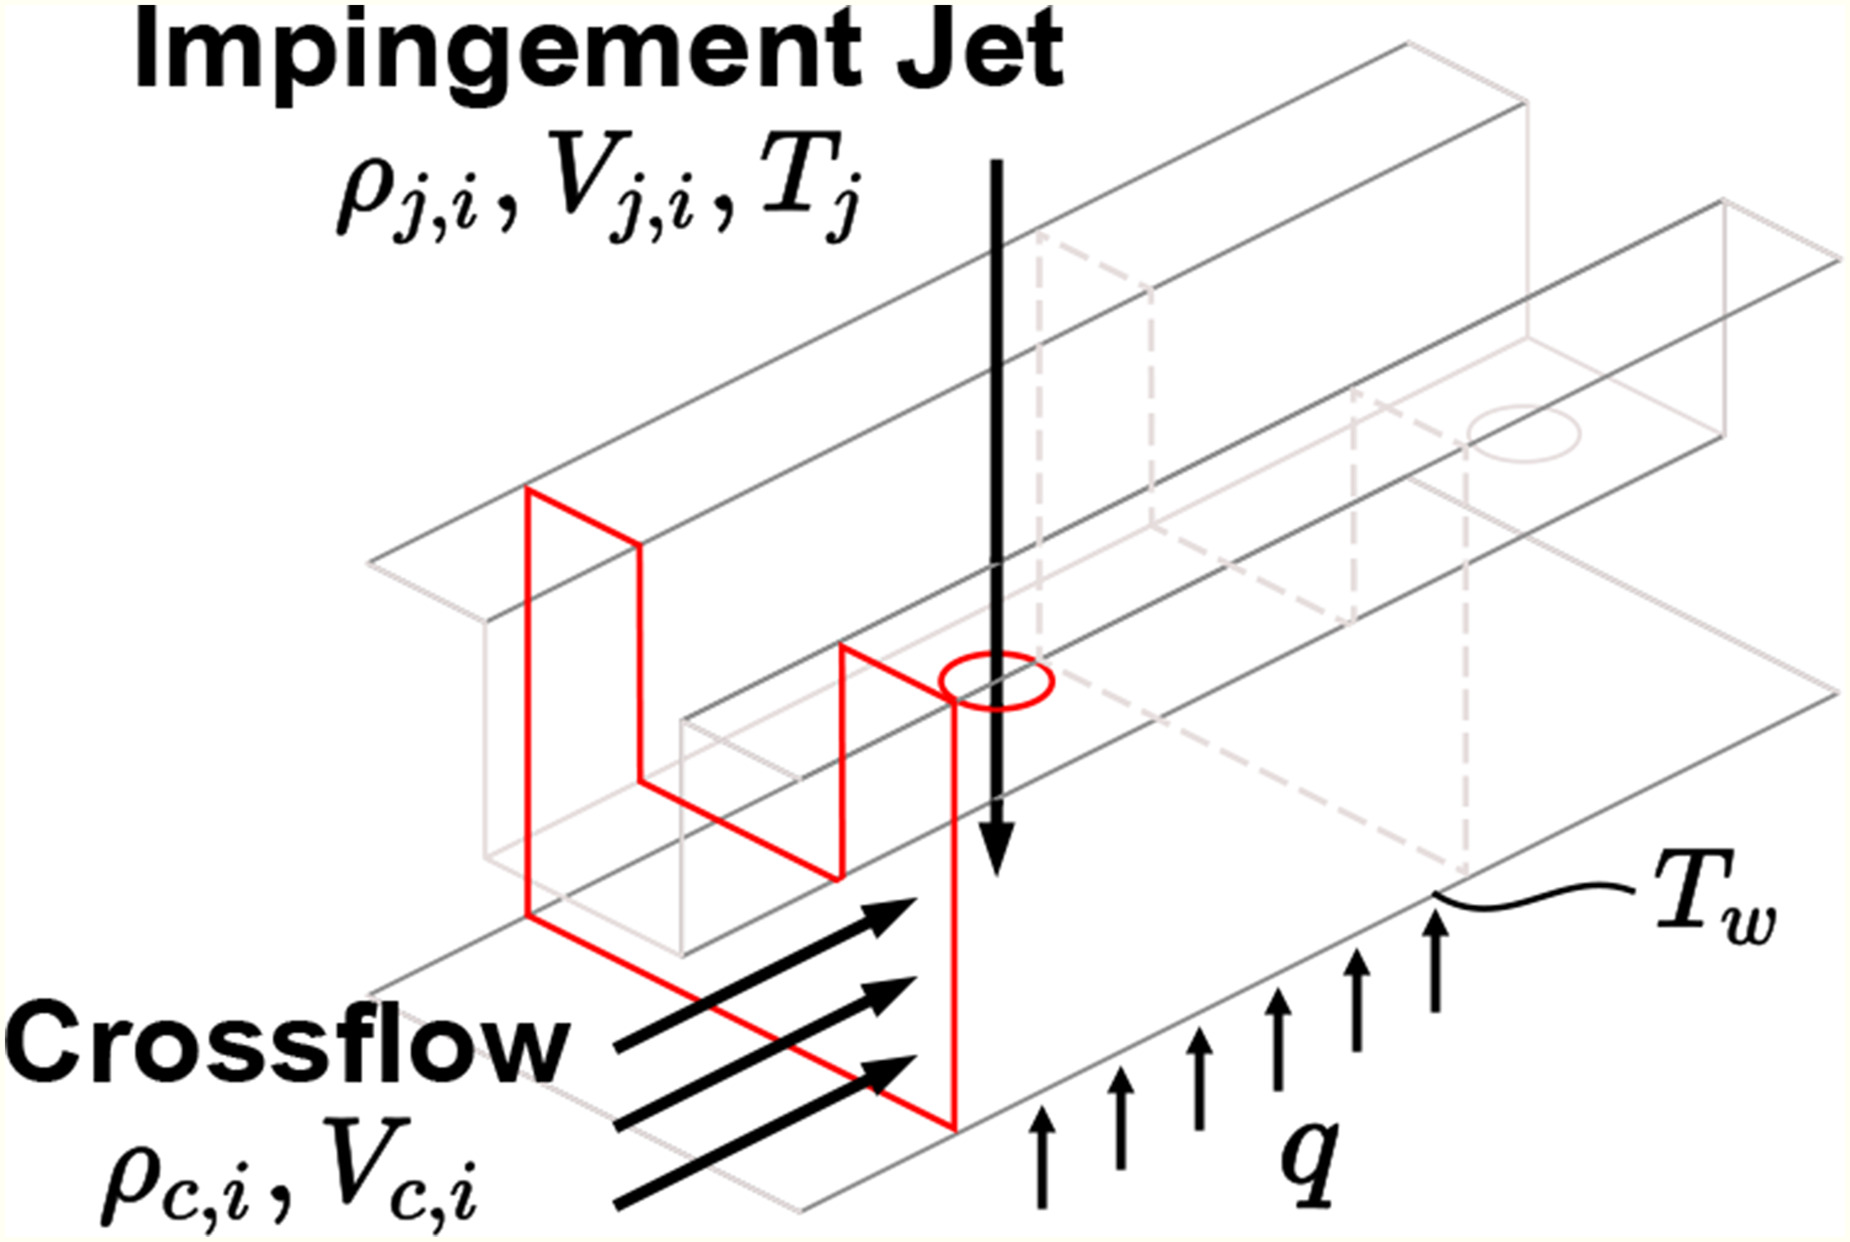
| Heat transfer coefficient (HTC) is defined in Equation 2, where q is the target surface heat flux, Tw is the target surface temperature, and Tj is the inlet temperature. Area averaged HTC is calculated on evaluation area shown in Figure 2. | |
| Nusselt number is defined in Equation 3 where | |
| Temperature ratio (TR) between the target wall and impingement jet is defined in Equation 4. | |
| Momentum ratio (MR) between the crossflow and impingement jet (shown in Figure 5), is defined for each jet, i, in Equation 5. |
Effect of temperature ratio
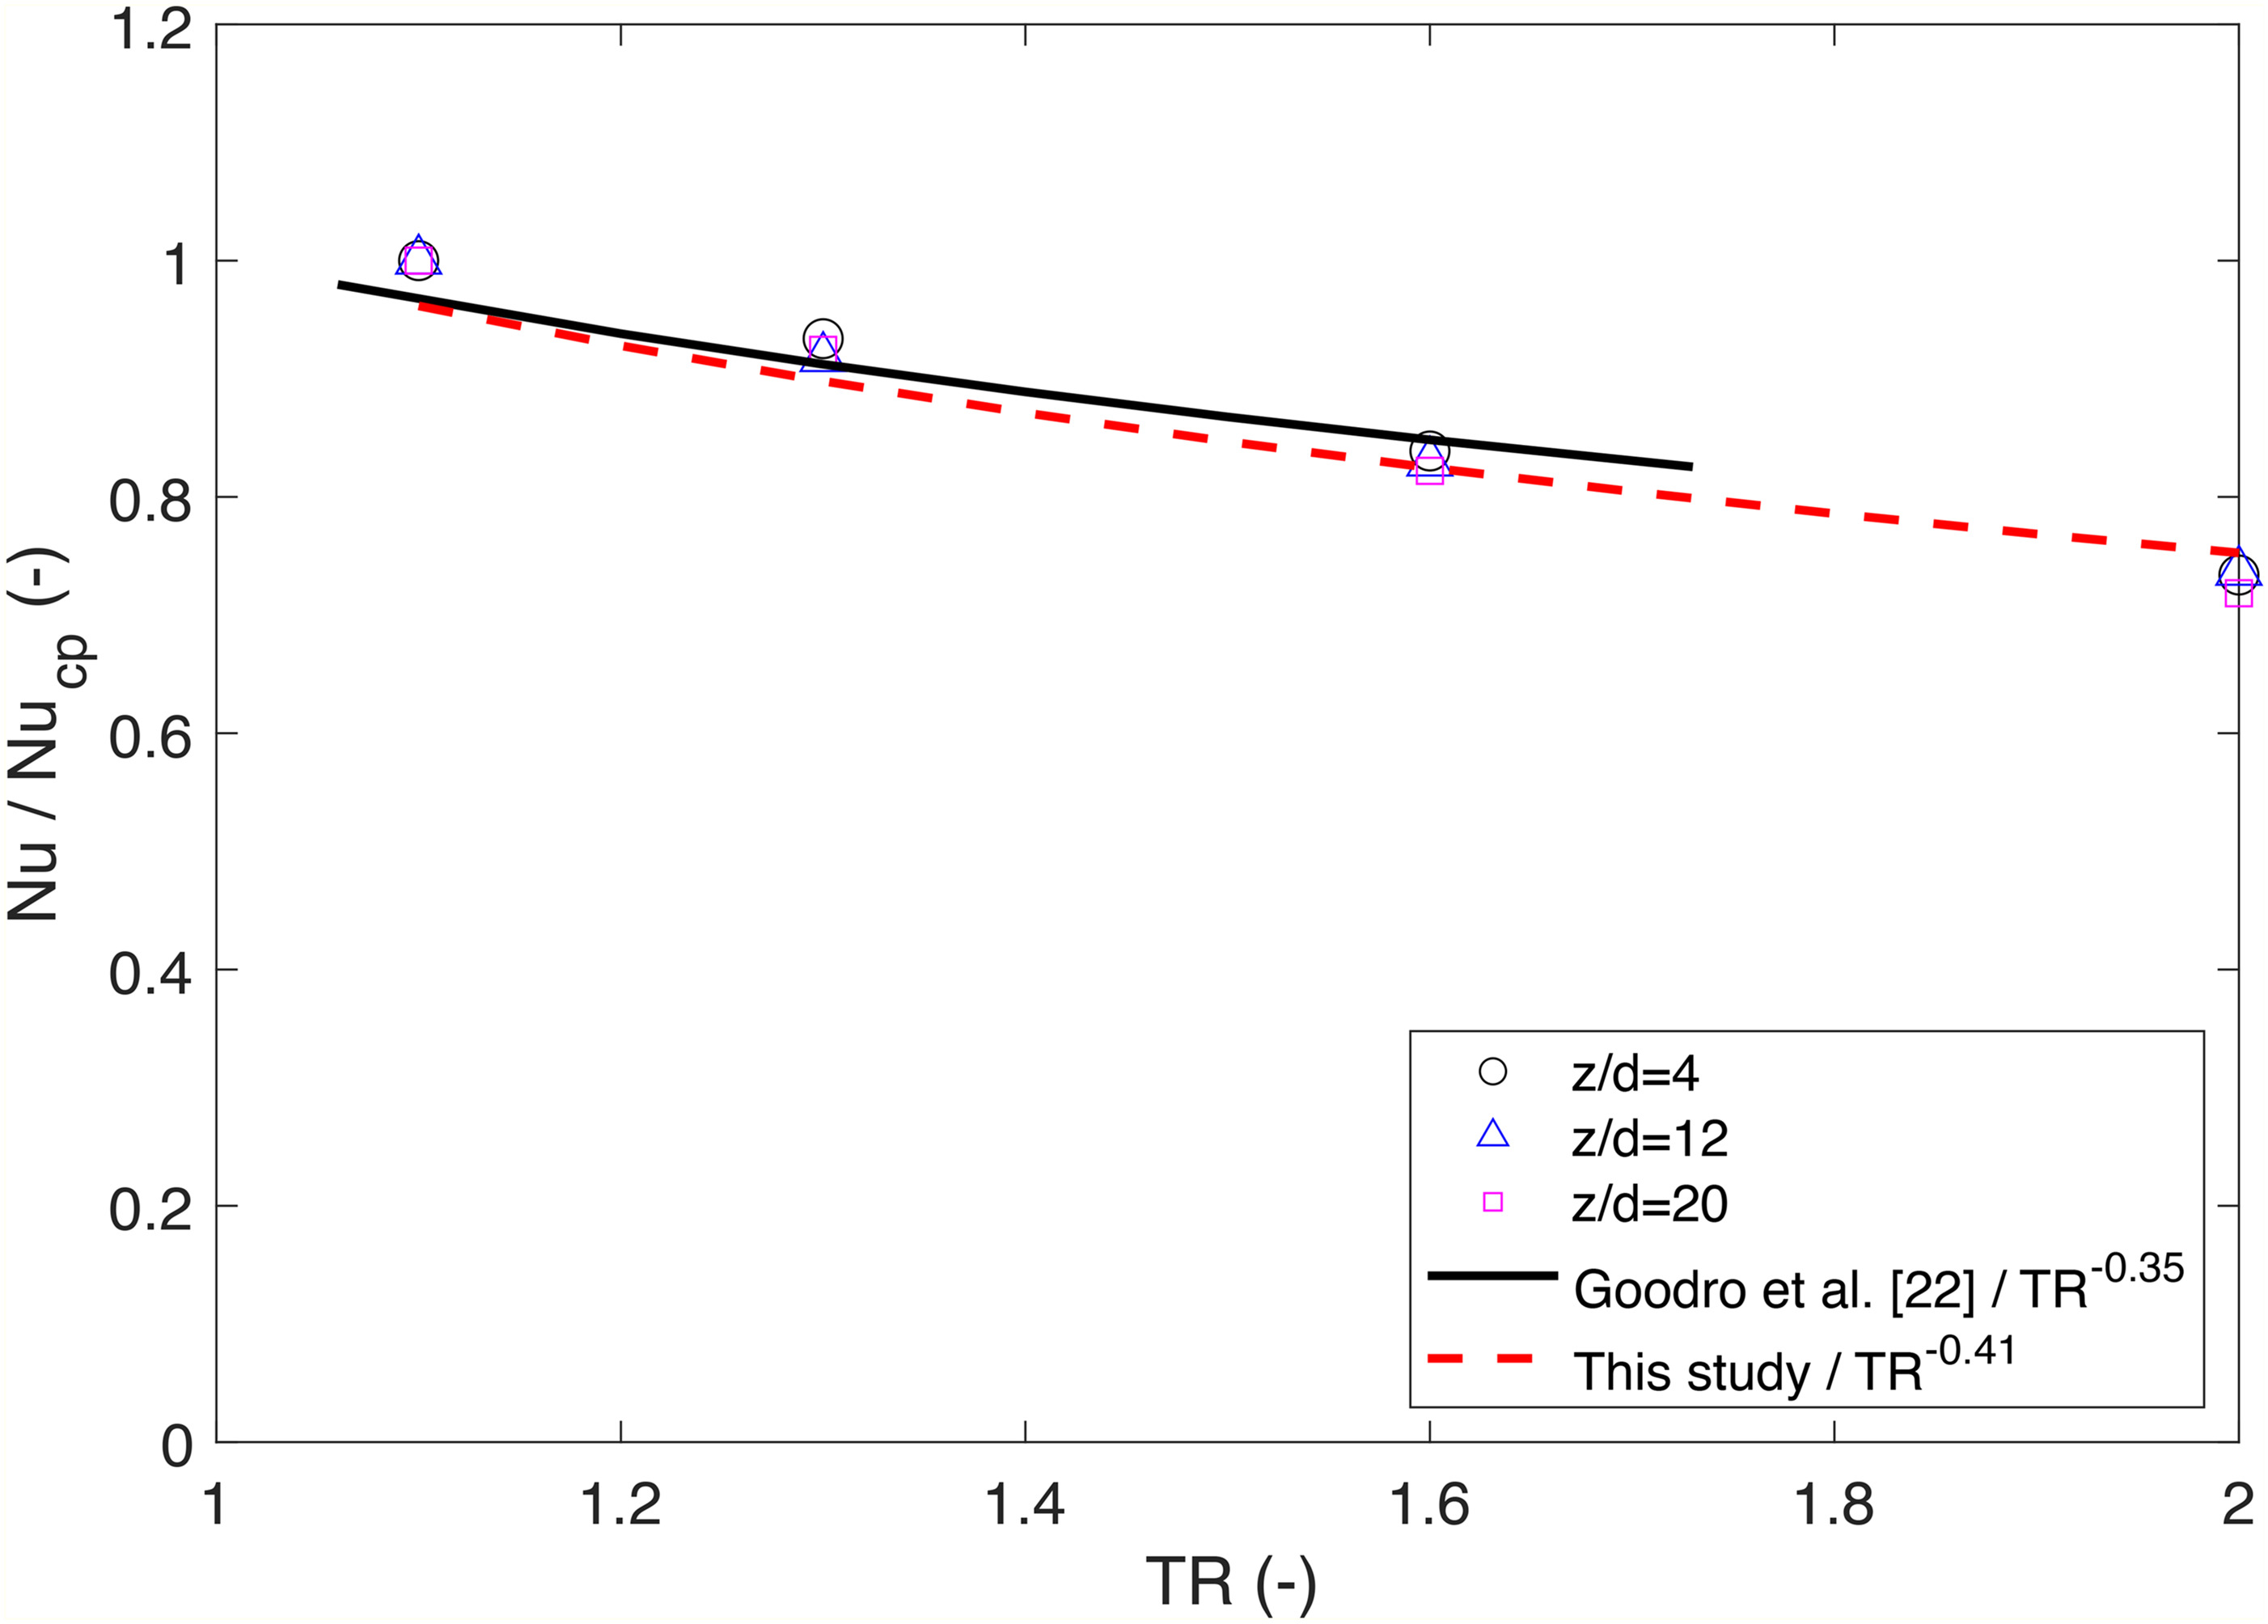
To improve turbine efficiency, designers look to reduce the coolant air mass flow rate, leading to higher temperature ratios between the target wall and impingement jet. Literature shows that the effectiveness of impingement jet heat transfer decreases with increasing temperature ratio. However, no literature considers the temperature ratio effect for corrugated geometries. Firstly, to validate the effect of different temperature ratios on performance of a flat plate geometry, numerical results are compared to the power law correlation developed by Goodro et al. (2007), shown in Equation 6 withan exponential constant
Figure 6 compares numerical results for the Nusselt number at various lengthwise (z/d) locations with the correlation of Esposito et al. (2007). Nucp represents the Nusselt number result for a temperature ratio of 1.1. The results show good agreement with the correlation of Goodro et al. (2007) and minor differences may be attributed to the small discrepancies in geometries and boundary conditions. Goodro et al. state that the correlation is only valid for
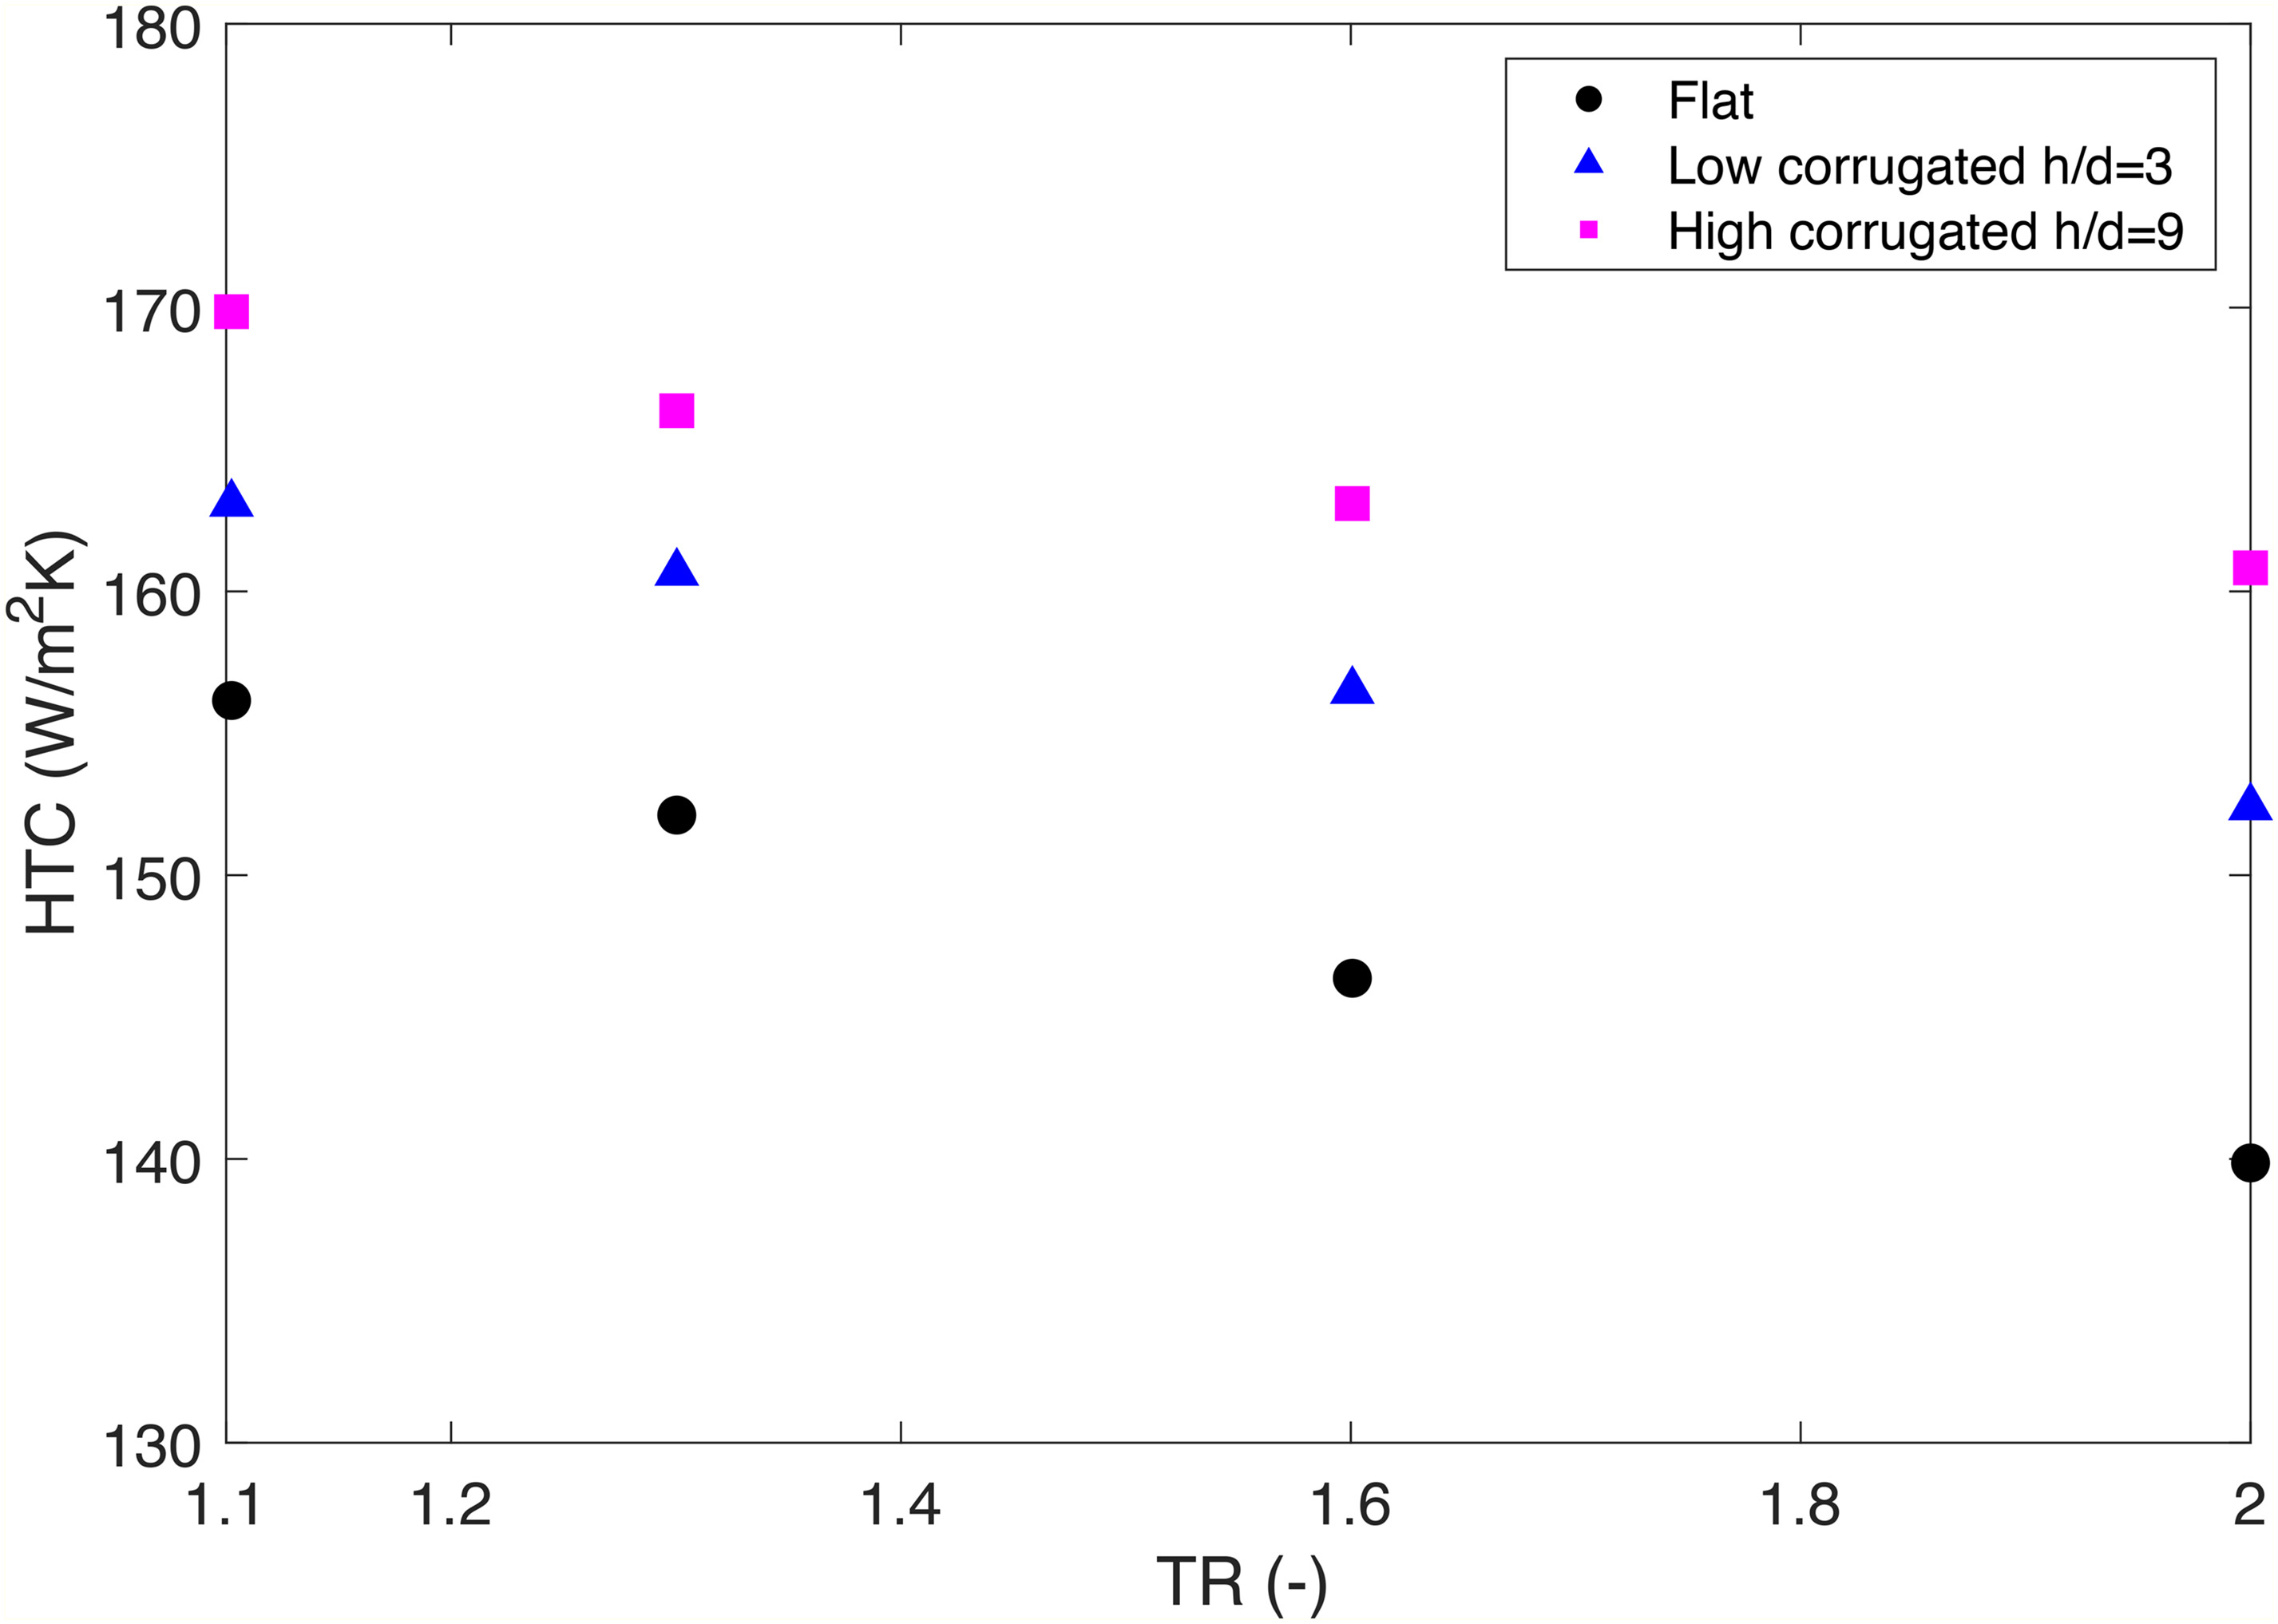
To clarify the effect of different temperature ratios on impingement jet heat transfer performance for corrugated geometries, a range of 4 temperature ratios (TR = 1.1, 1.3, 1.6 and 2.0) are investigated for flat, corrugated h/d = 3 and corrugated h/d = 9 geometries. Figure 7 shows the area average heat transfer coefficient across the target plate for different temperature ratios. As discussed in the introduction, literature shows that the choice of reference temperature in the calculation of thermal conductivity can significantly affect the trend between Nusselt number and temperature ratio. To eliminate this dependence, it was chosen to use heat transfer coefficient instead of Nusselt number to evaluate the heat transfer effectiveness. The results show that the decreases in heat transfer coefficient for the corrugated cases are smaller than that for the flat case. Furthermore, the decrease in heat transfer coefficient for the corrugated h/d = 3 is greater than that for the corrugated h/d = 9, demonstrating that the enhancement provided by corrugated geometries is greater at higher temperature ratio conditions.
Figure 7.
Variation of area averaged heat transfer coefficient on the target plate for different corrugated heights and temperature ratios.
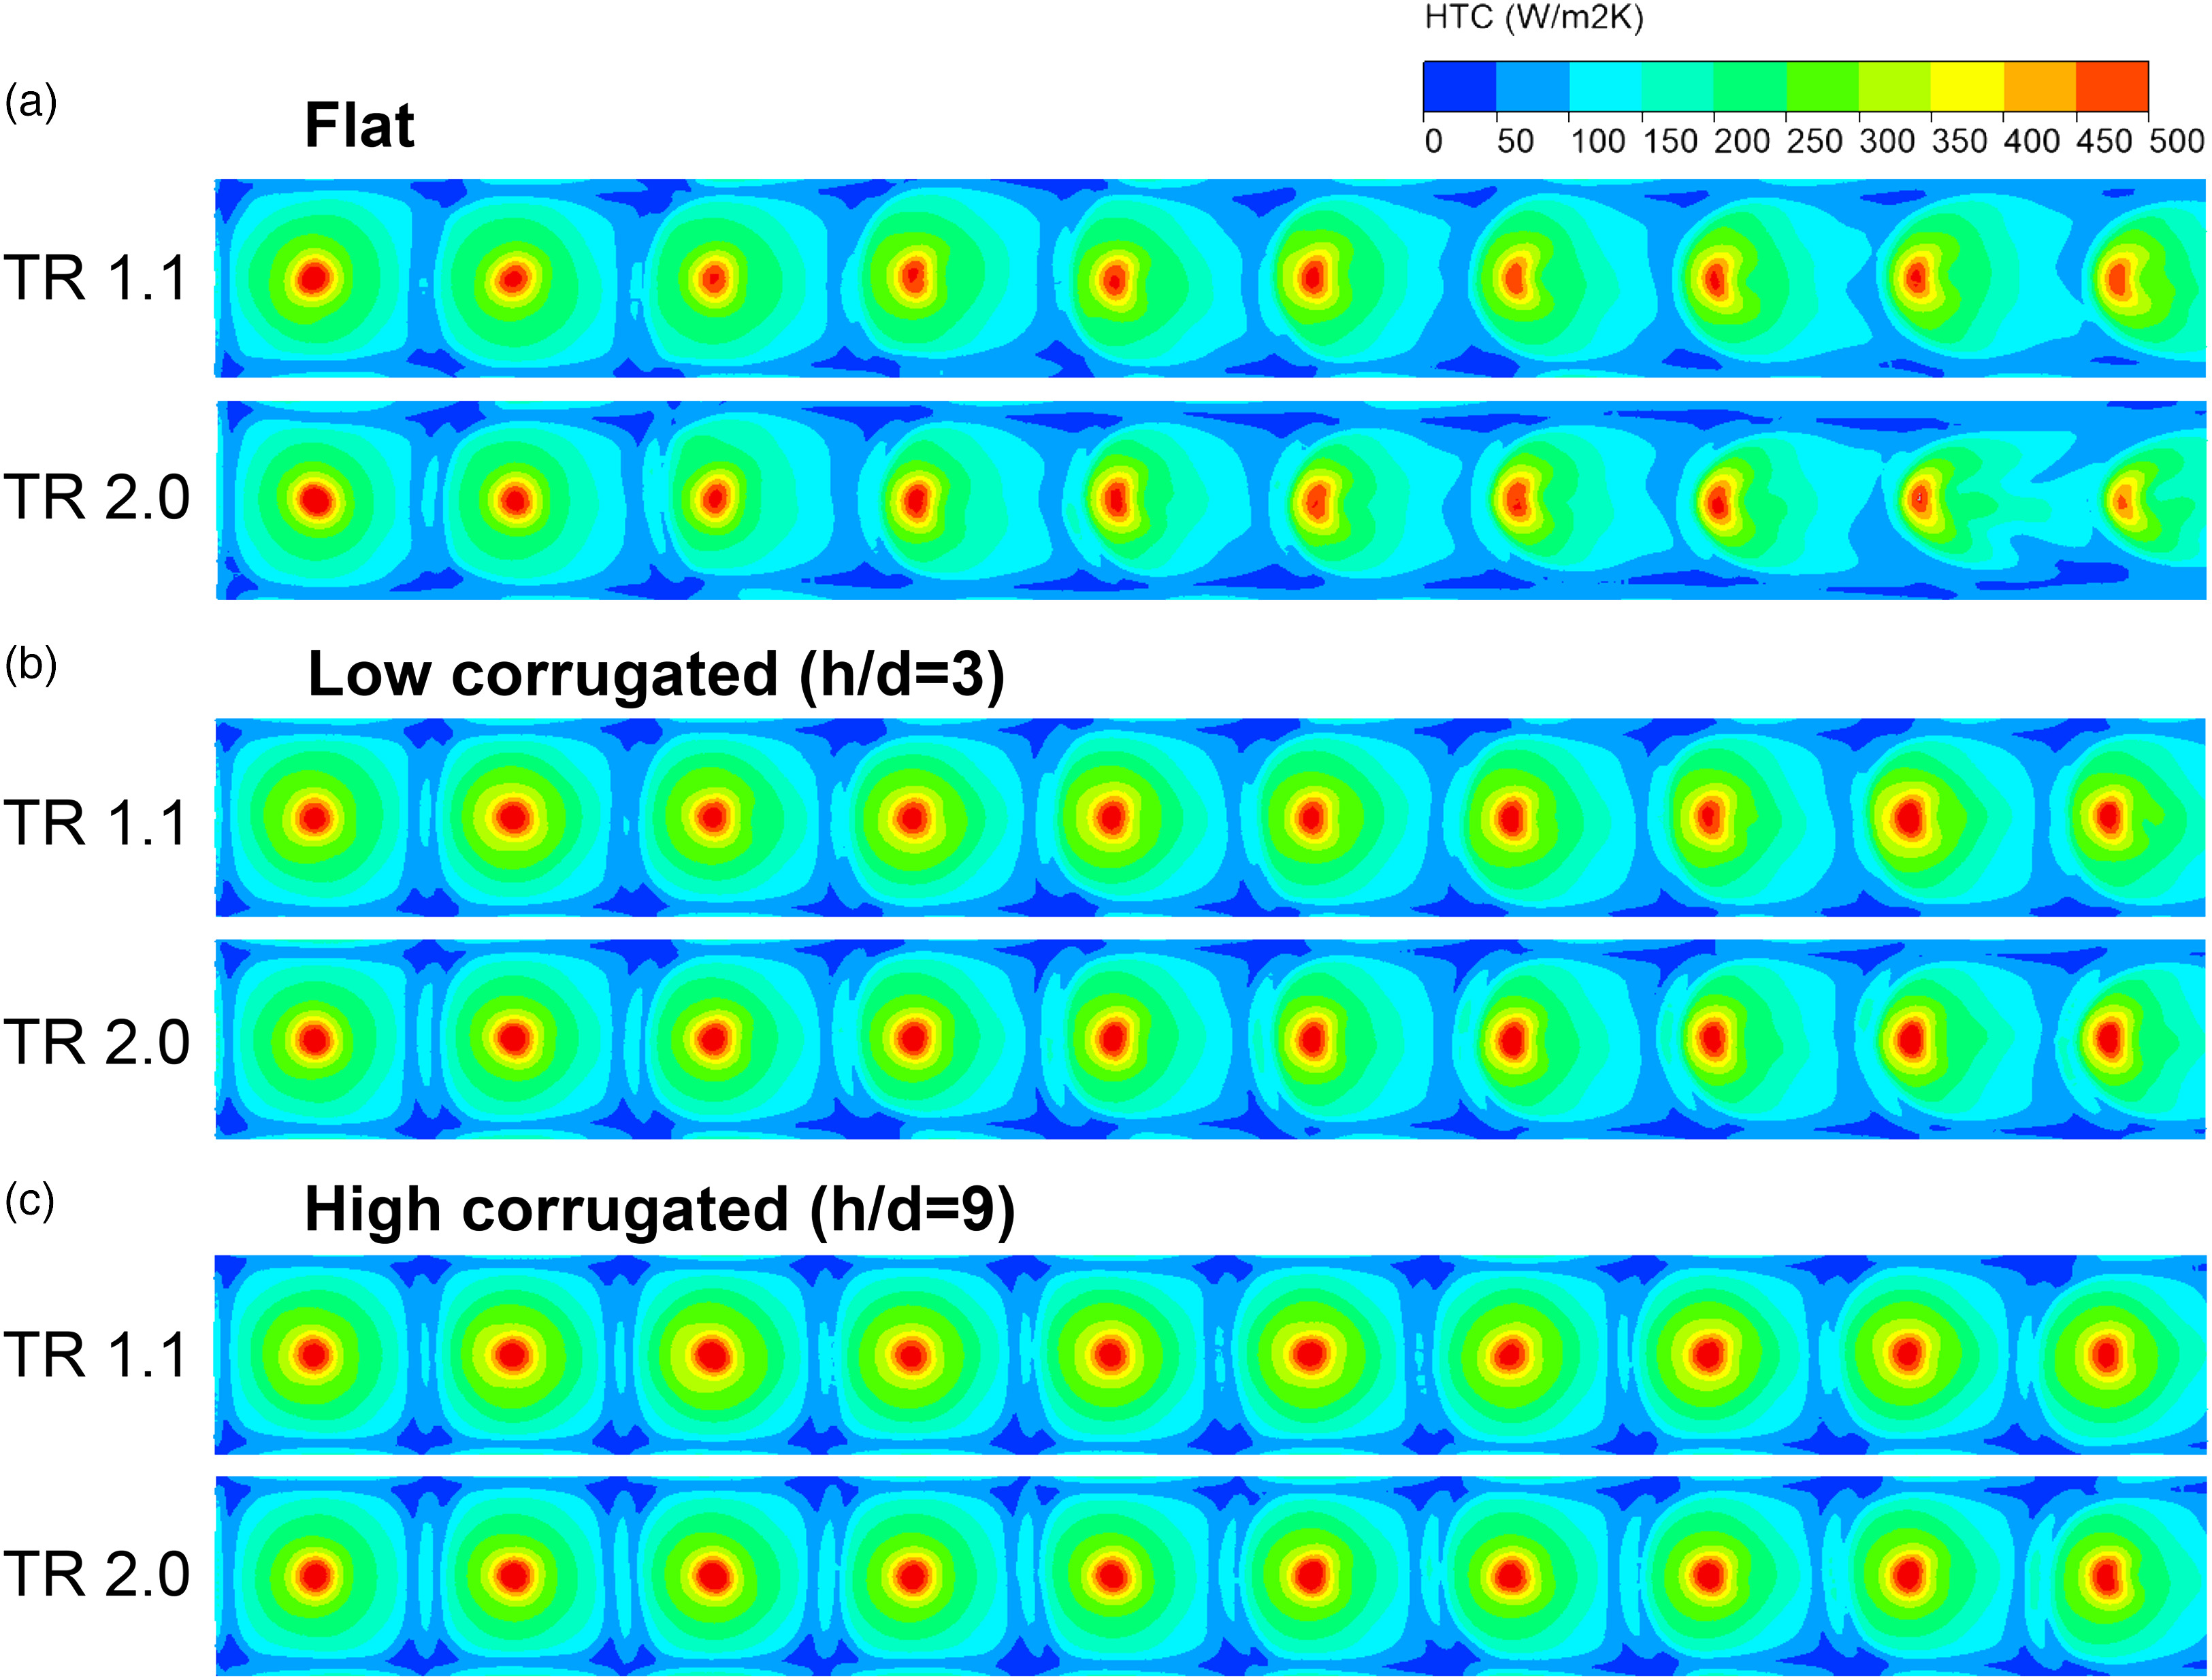
To visualize the change in heat transfer distribution between geometries and temperature ratios, Figure 8 shows heat transfer coefficient contours for flat, low and high corrugated cases. The flat case shows that the heat transfer deterioration downstream is bigger at TR 2.0 than that at TR 1.1. The low corrugated case exhibits a similar trend, but the downstream deterioration is significantly reduced. In the high corrugated case, the deterioration is almost completely eliminated, as demonstrated by the upstream contours being comparable to the downstream contours for both temperature ratios.
Figure 8.
Heat transfer coefficient distribution on target plate for different corrugated heights and temperature ratios.
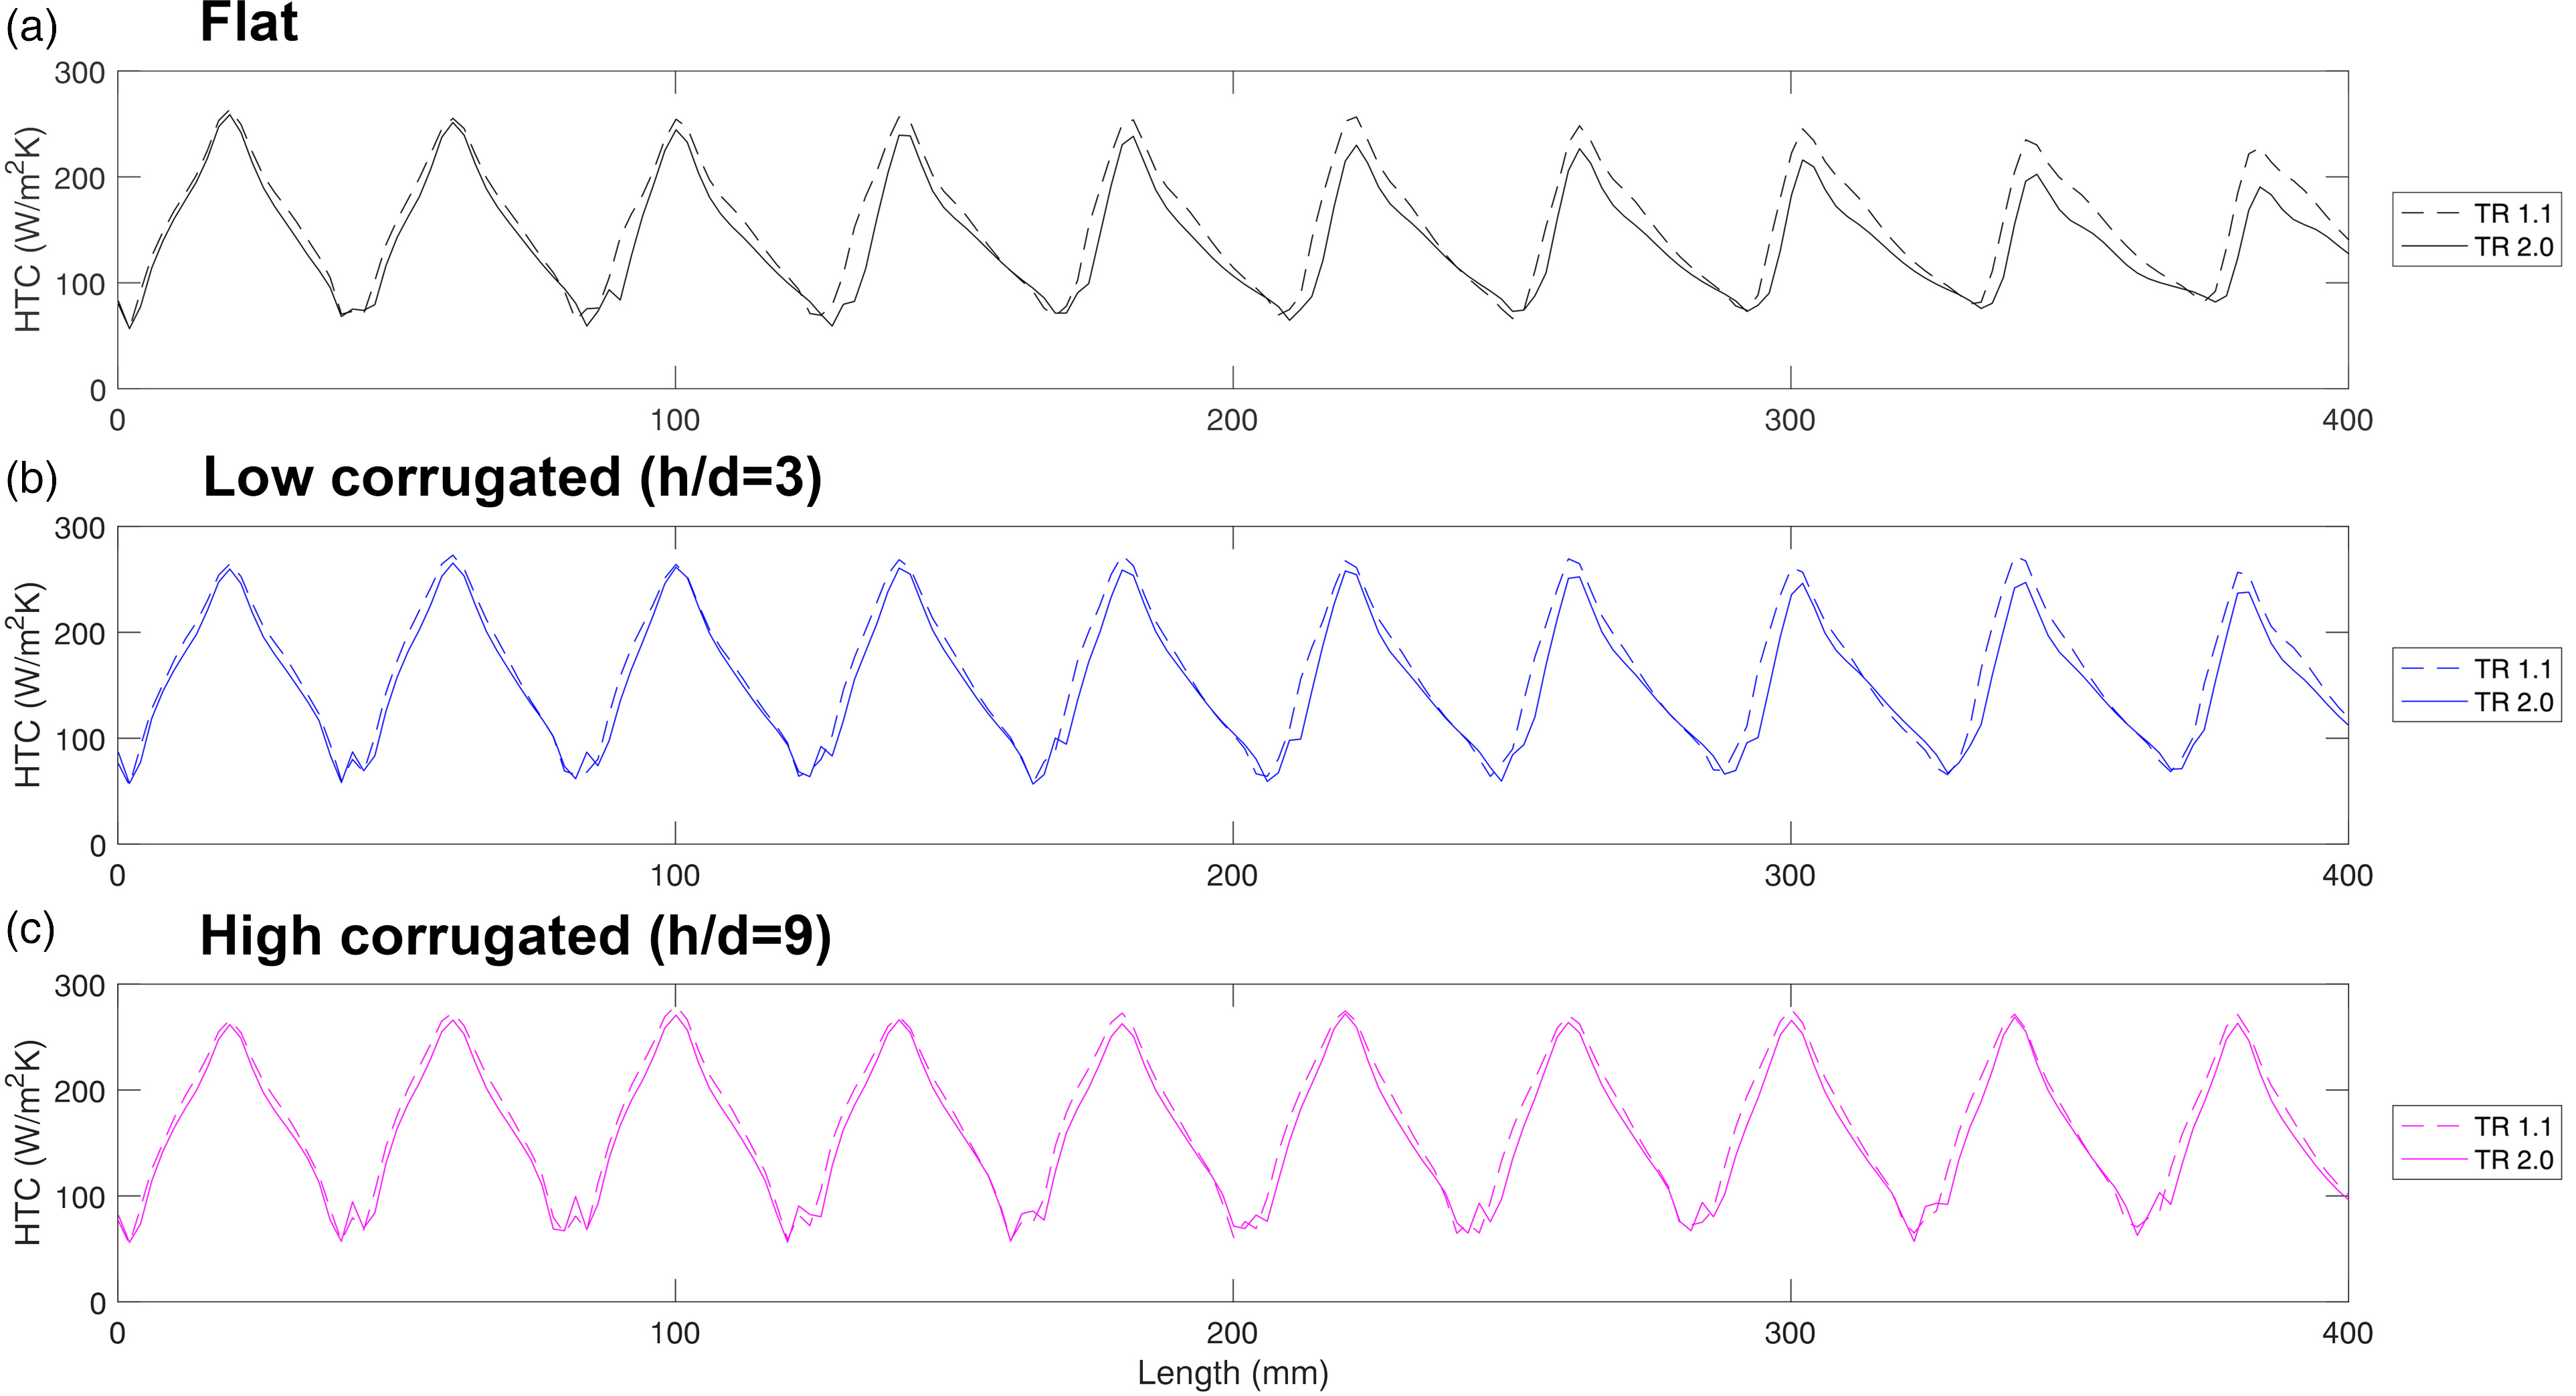
To understand the changes in heat transfer coefficient distribution in more detail, Figure 9 shows spanwise averaged heat transfer coefficient distribution for flat, low and high corrugated cases. In the upstream region, every case shows a small decrease in heat transfer due to the temperature ratio increase. The TR 2.0 flat case shows increased deterioration of the heat transfer coefficient in the downstream region, particularly at the peaks. The low corrugated also shows slight downstream deterioration and the high corrugated case shows almost no deterioration.
Figure 9.
Spanwise averaged heat transfer coefficient distribution on target plate for different corrugated heights and temperature ratios.
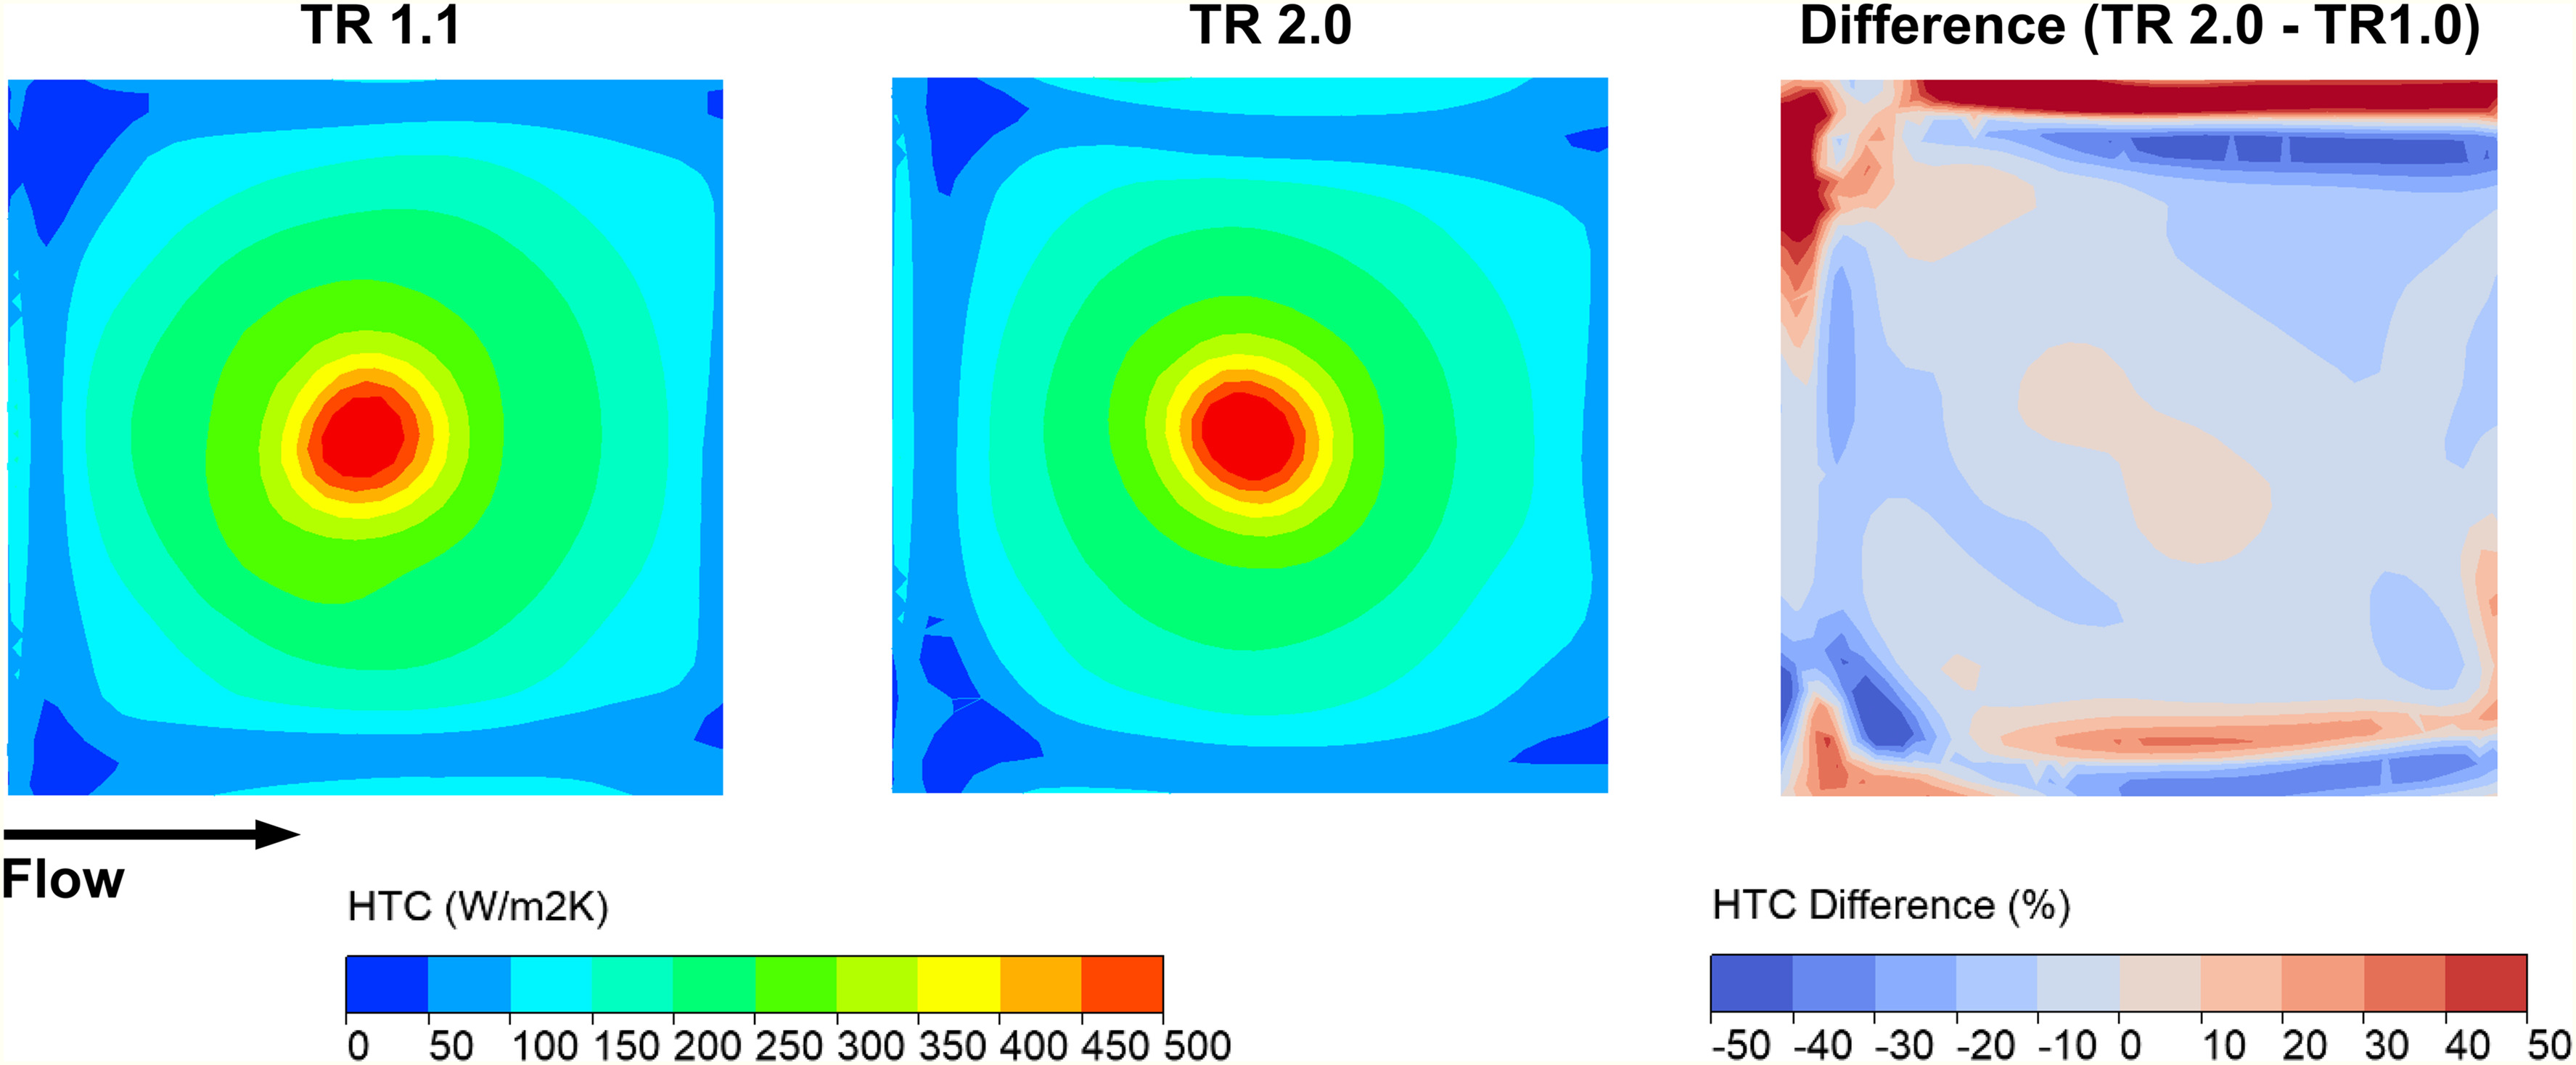
There is a small noticeable decrease in heat transfer coefficient in the upstream region, yet there is little to no crossflow. To clarify the heat transfer coefficient decrease at upstream region, Figure 10 shows the heat transfer coefficient distribution for hole 1 of the flat case at TR 1.1 and TR 2.0, and the difference between them. The difference contour shows a holistic decrease in heat transfer. It is difficult to attribute the decrease to just one effect, as temperature affects many fluid properties, as well as the interaction at the target surface. In the near wall region, dynamic viscosity and thermal conductivity increase around 20%, whilst density decreases around 20% between TR 1.1 and TR 2.0. These changes could be significant enough to influence the flow interaction and heat transfer at the target surface. Investigating the change in flow mechanisms in more detail would require a fundamental study of the near wall region. Although the RANS model used in this study matches well with correlations and experimental data, a high fidelity large eddy simulation would be necessary to more accurately resolve the high gradients in the near wall region and explain the discrepancy in heat transfer, which is beyond the scope of this study.
Meanwhile, in the downstream region, a significant portion of the deterioration can be attributed to the jet distortion caused by accumulated crossflow. Jets with higher momentum relative to the crossflow are less susceptible to distortion, as shown by Florschuetz et al. (1981). Hence, to evaluate the effect of crossflow in distorting each jet, the momentum ratio between the crossflow and jet is calculated for each hole for the flat, low and high corrugated cases, and the results are shown in Figure 11. The flat case shows that temperature ratio causes a significant increase in the momentum ratio of the downstream region. Both corrugated cases have lower momentum ratios since the increased cross sectional area leads to decreased crossflow velocity. The low corrugated case has a slight increase in momentum ratio at downstream region, and the high corrugated case shows a negligible increase.
Figure 11.
Momentum ratio distribution per hole for different corrugated heights and temperature ratios. (a) Flat (b) Low corrugated (h/d = 3) (c) High corrugated (h/d = 9).
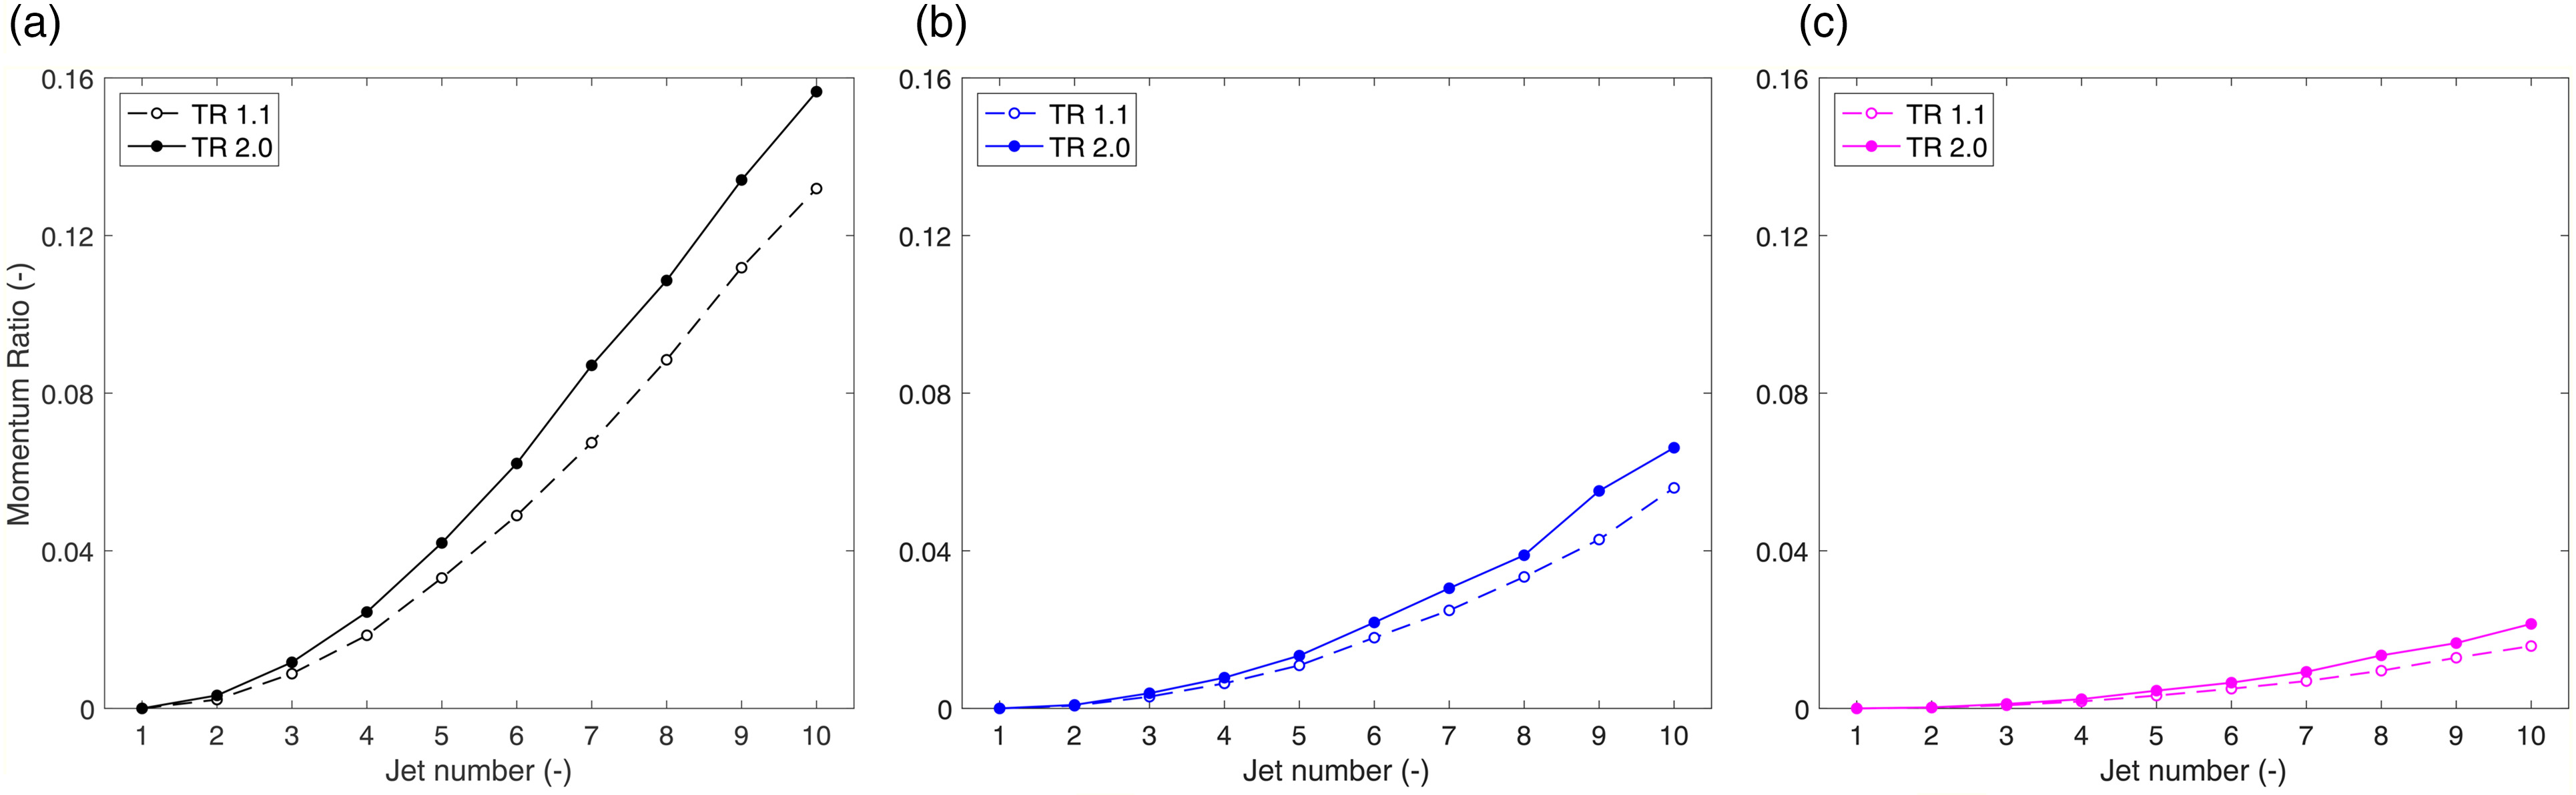
With an increase in temperature ratio, the crossflow temperature increases, causing a decrease in density. Continuity requires that the velocity must increase to maintain the same mass flow rate. Momentum increases with the first power of density and the second power of velocity, therefore momentum ratio increases with temperature, resulting in increased jet distortion and reduced upstream impingement area for the flat case. Overall, these effects detrimentally impact heat transfer. Since the corrugated geometries provide a larger cross sectional area, the increase in velocity is smaller for the corrugated cases, compared to the flat case. Therefore, momentum ratio is significantly smaller and the deterioration due to the high temperature ratio is minimal for the corrugated cases.
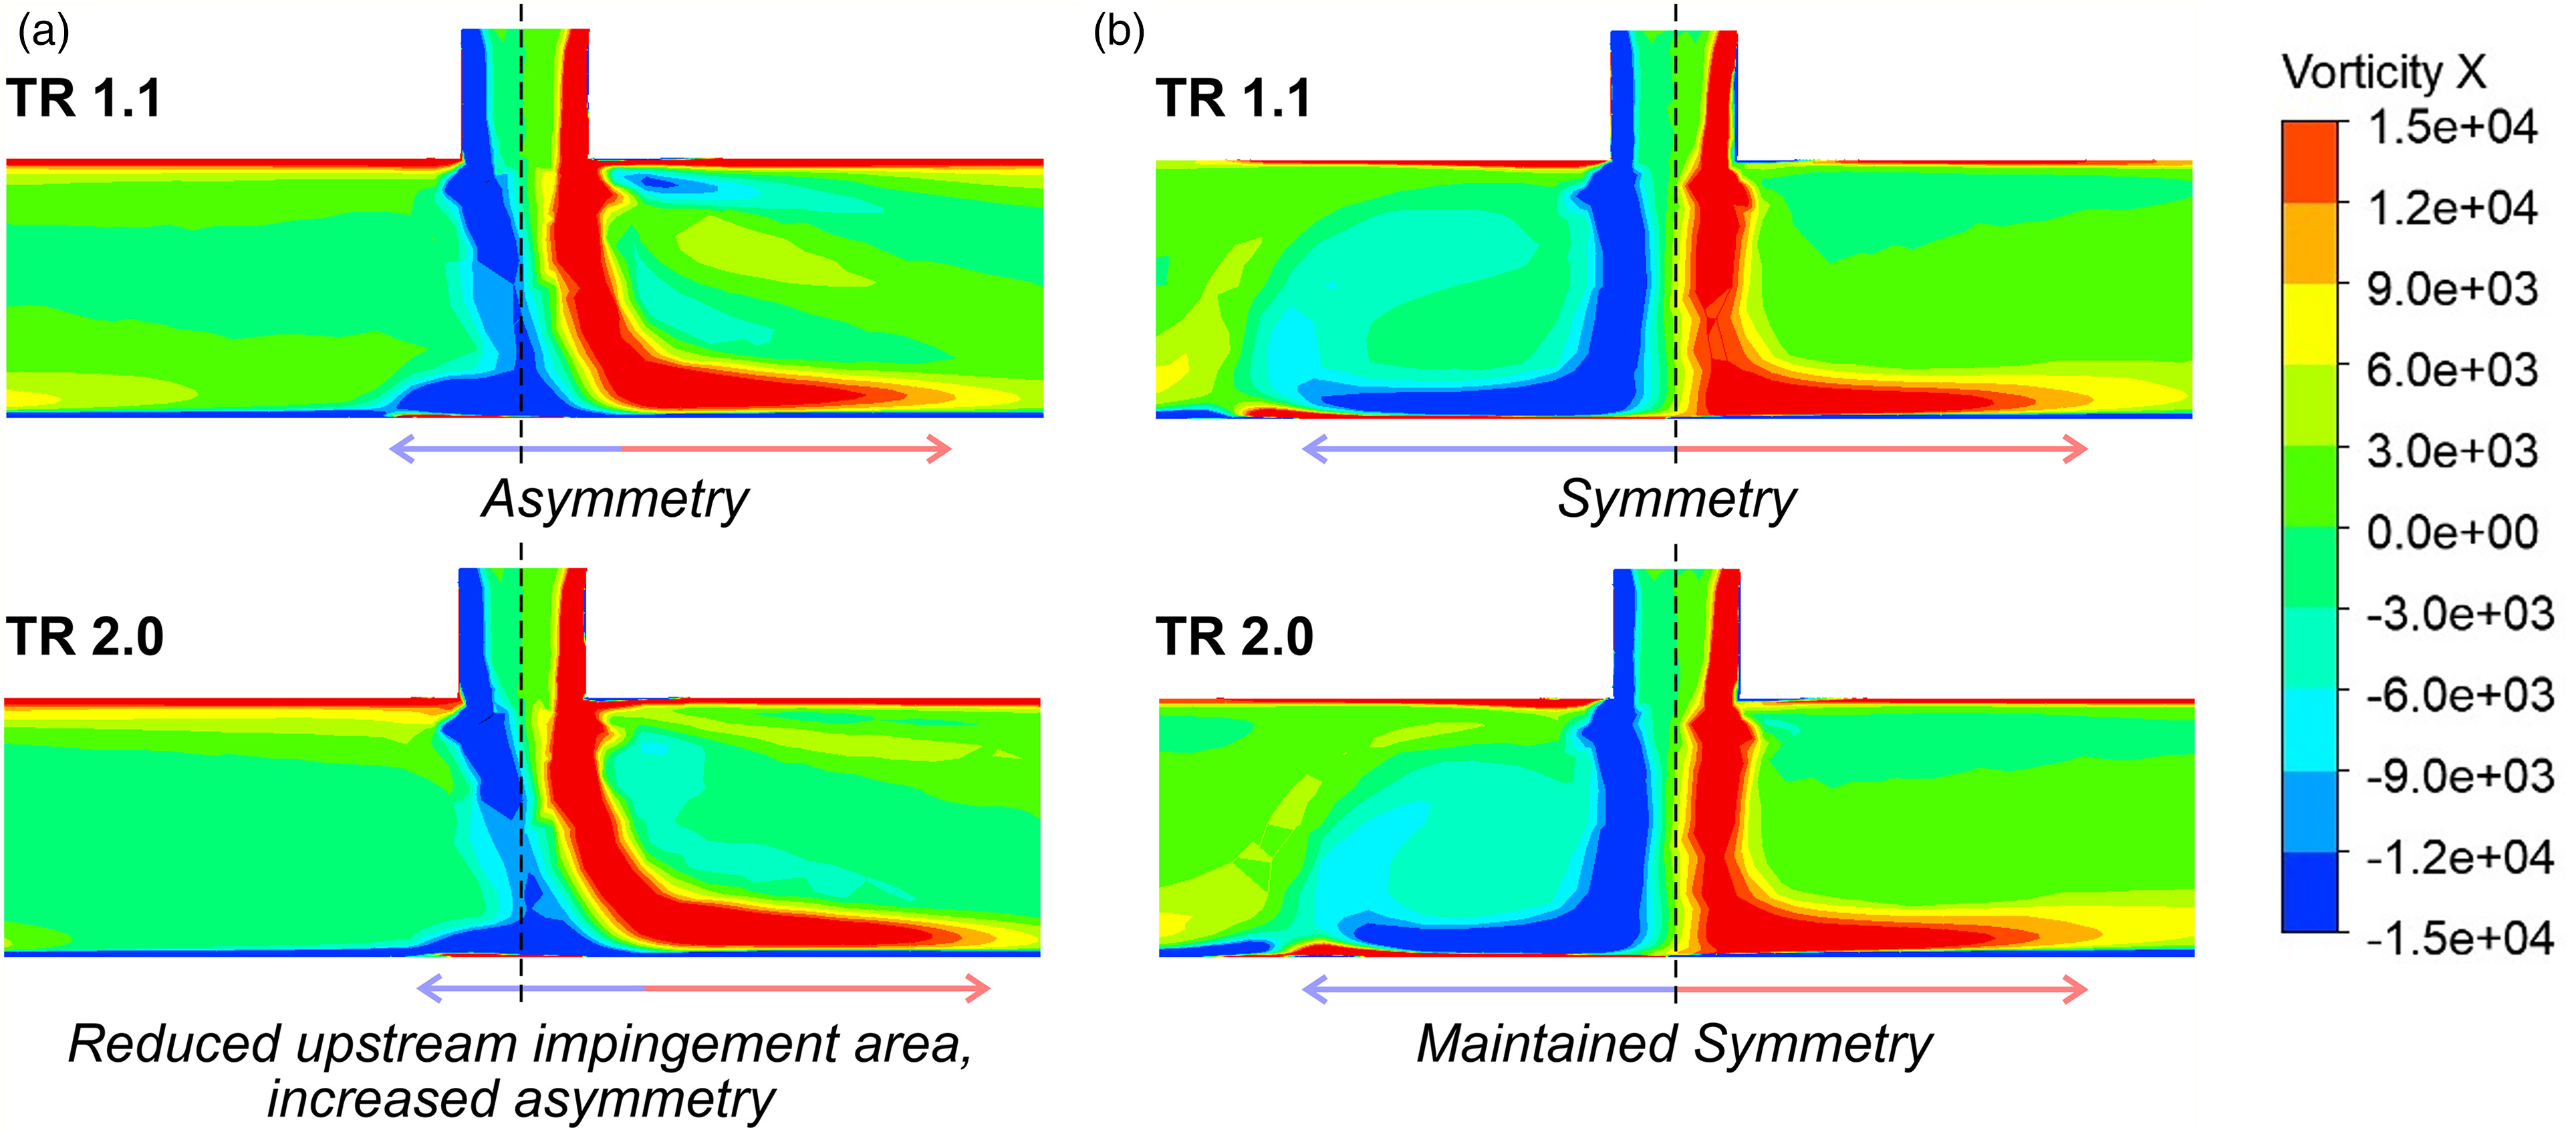
Figure 12 shows vorticity distribution over the streamwise plane for hole 10 at TR 1.1 and 2.0. Due to the increased momentum of the crossflow relative to the jet at TR 2.0, the focus of the jet moves further downstream as it becomes distorted. Moreover, the impinging jet travels less far upstream, reducing the impingement area and resulting in an asymmetry. The corrugated geometry mitigates these effects by reducing the crossflow momentum, as shown by the jet focus being inline with the hole centre and a symmetrical impingement area, which is maintained for TR 2.0.
Effect of temperature ratio and initial crossflow
In addition to decreasing coolant mass flow rate for efficiency, where possible, there is incentive to reduce the number of film cooling holes to reduce manufacturing cost, stress concentrations and increase blade life. It is common to exhaust spent coolant from impingement as film cooling, so, by reducing the number of film cooling holes, crossflow accumulation is increased. Furthermore, when designing arrays with more than 10 inline jets, even higher crossflow is expected. Hence, it can be expected that the next generation of gas turbines will feature high temperature ratio and high crossflow conditions. Hatta et al. (2024) demonstrated that corrugated geometries are particularly effective for enhancing heat transfer under high crossflow conditions, but it is yet to be explored at high temperature ratios for which the impact of crossflow is even greater. To clarify the effect of corrugated geometries for both temperature ratio and initial crossflow, 3 different temperature ratios and 3 different initial crossflow conditions are evaluated for flat, low and high corrugated cases.
Figure 13 compares the area averaged heat transfer coefficient for different temperature ratios and initial crossflow ratios for flat, low and high corrugated cases. Figure 13a shows the flat case. With increased temperature ratio and initial crossflow ratio, the heat transfer coefficient is decreased due to the increased momentum ratio causing jet distortion. The grey shading illustrates the sensitivity of the cases to the different conditions. Designers favour robust geometries for which the grey region is as small as possible, as it demonstrates small performance variation across conditions. The grey regions in Figures 13b and c are smaller showing that the corrugated geometries are significantly less sensitive to both increased crossflow and increased temperature ratio. The best performing conditions are defined as condition
Figure 13.
Area averaged heat transfer coefficient over target plate for different corrugated heights, temperature ratios and initial crossflow ratios. (a) Flat (b) Low corrugated (h/d = 3) (c) High corrugated (h/d = 9).
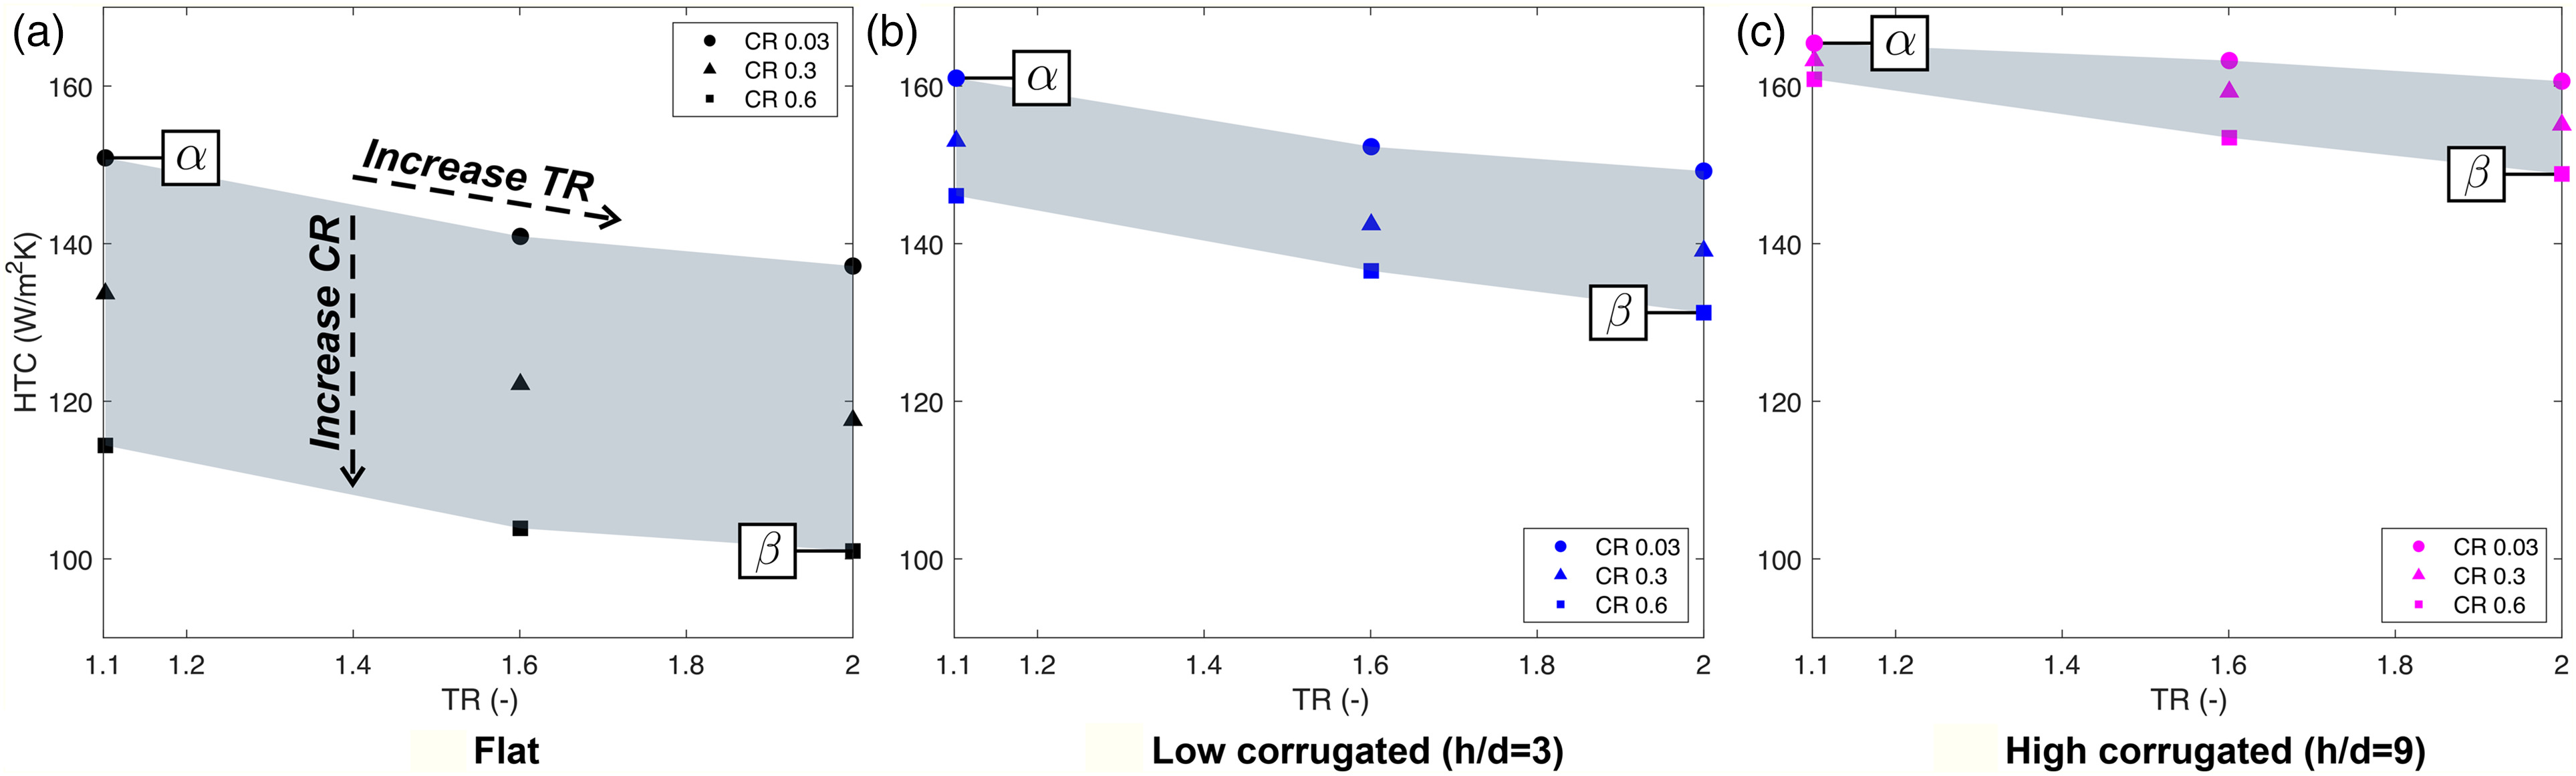
Figure 14 compares the heat transfer coefficient for the best performing conditions
Figure 14.
Heat transfer coefficient distribution over target plate for different corrugated heights, temperature ratios and initial crossflow ratios. (a) Flat (b) Low corrugated (h/d = 3) (c) High corrugated (h/d = 9).
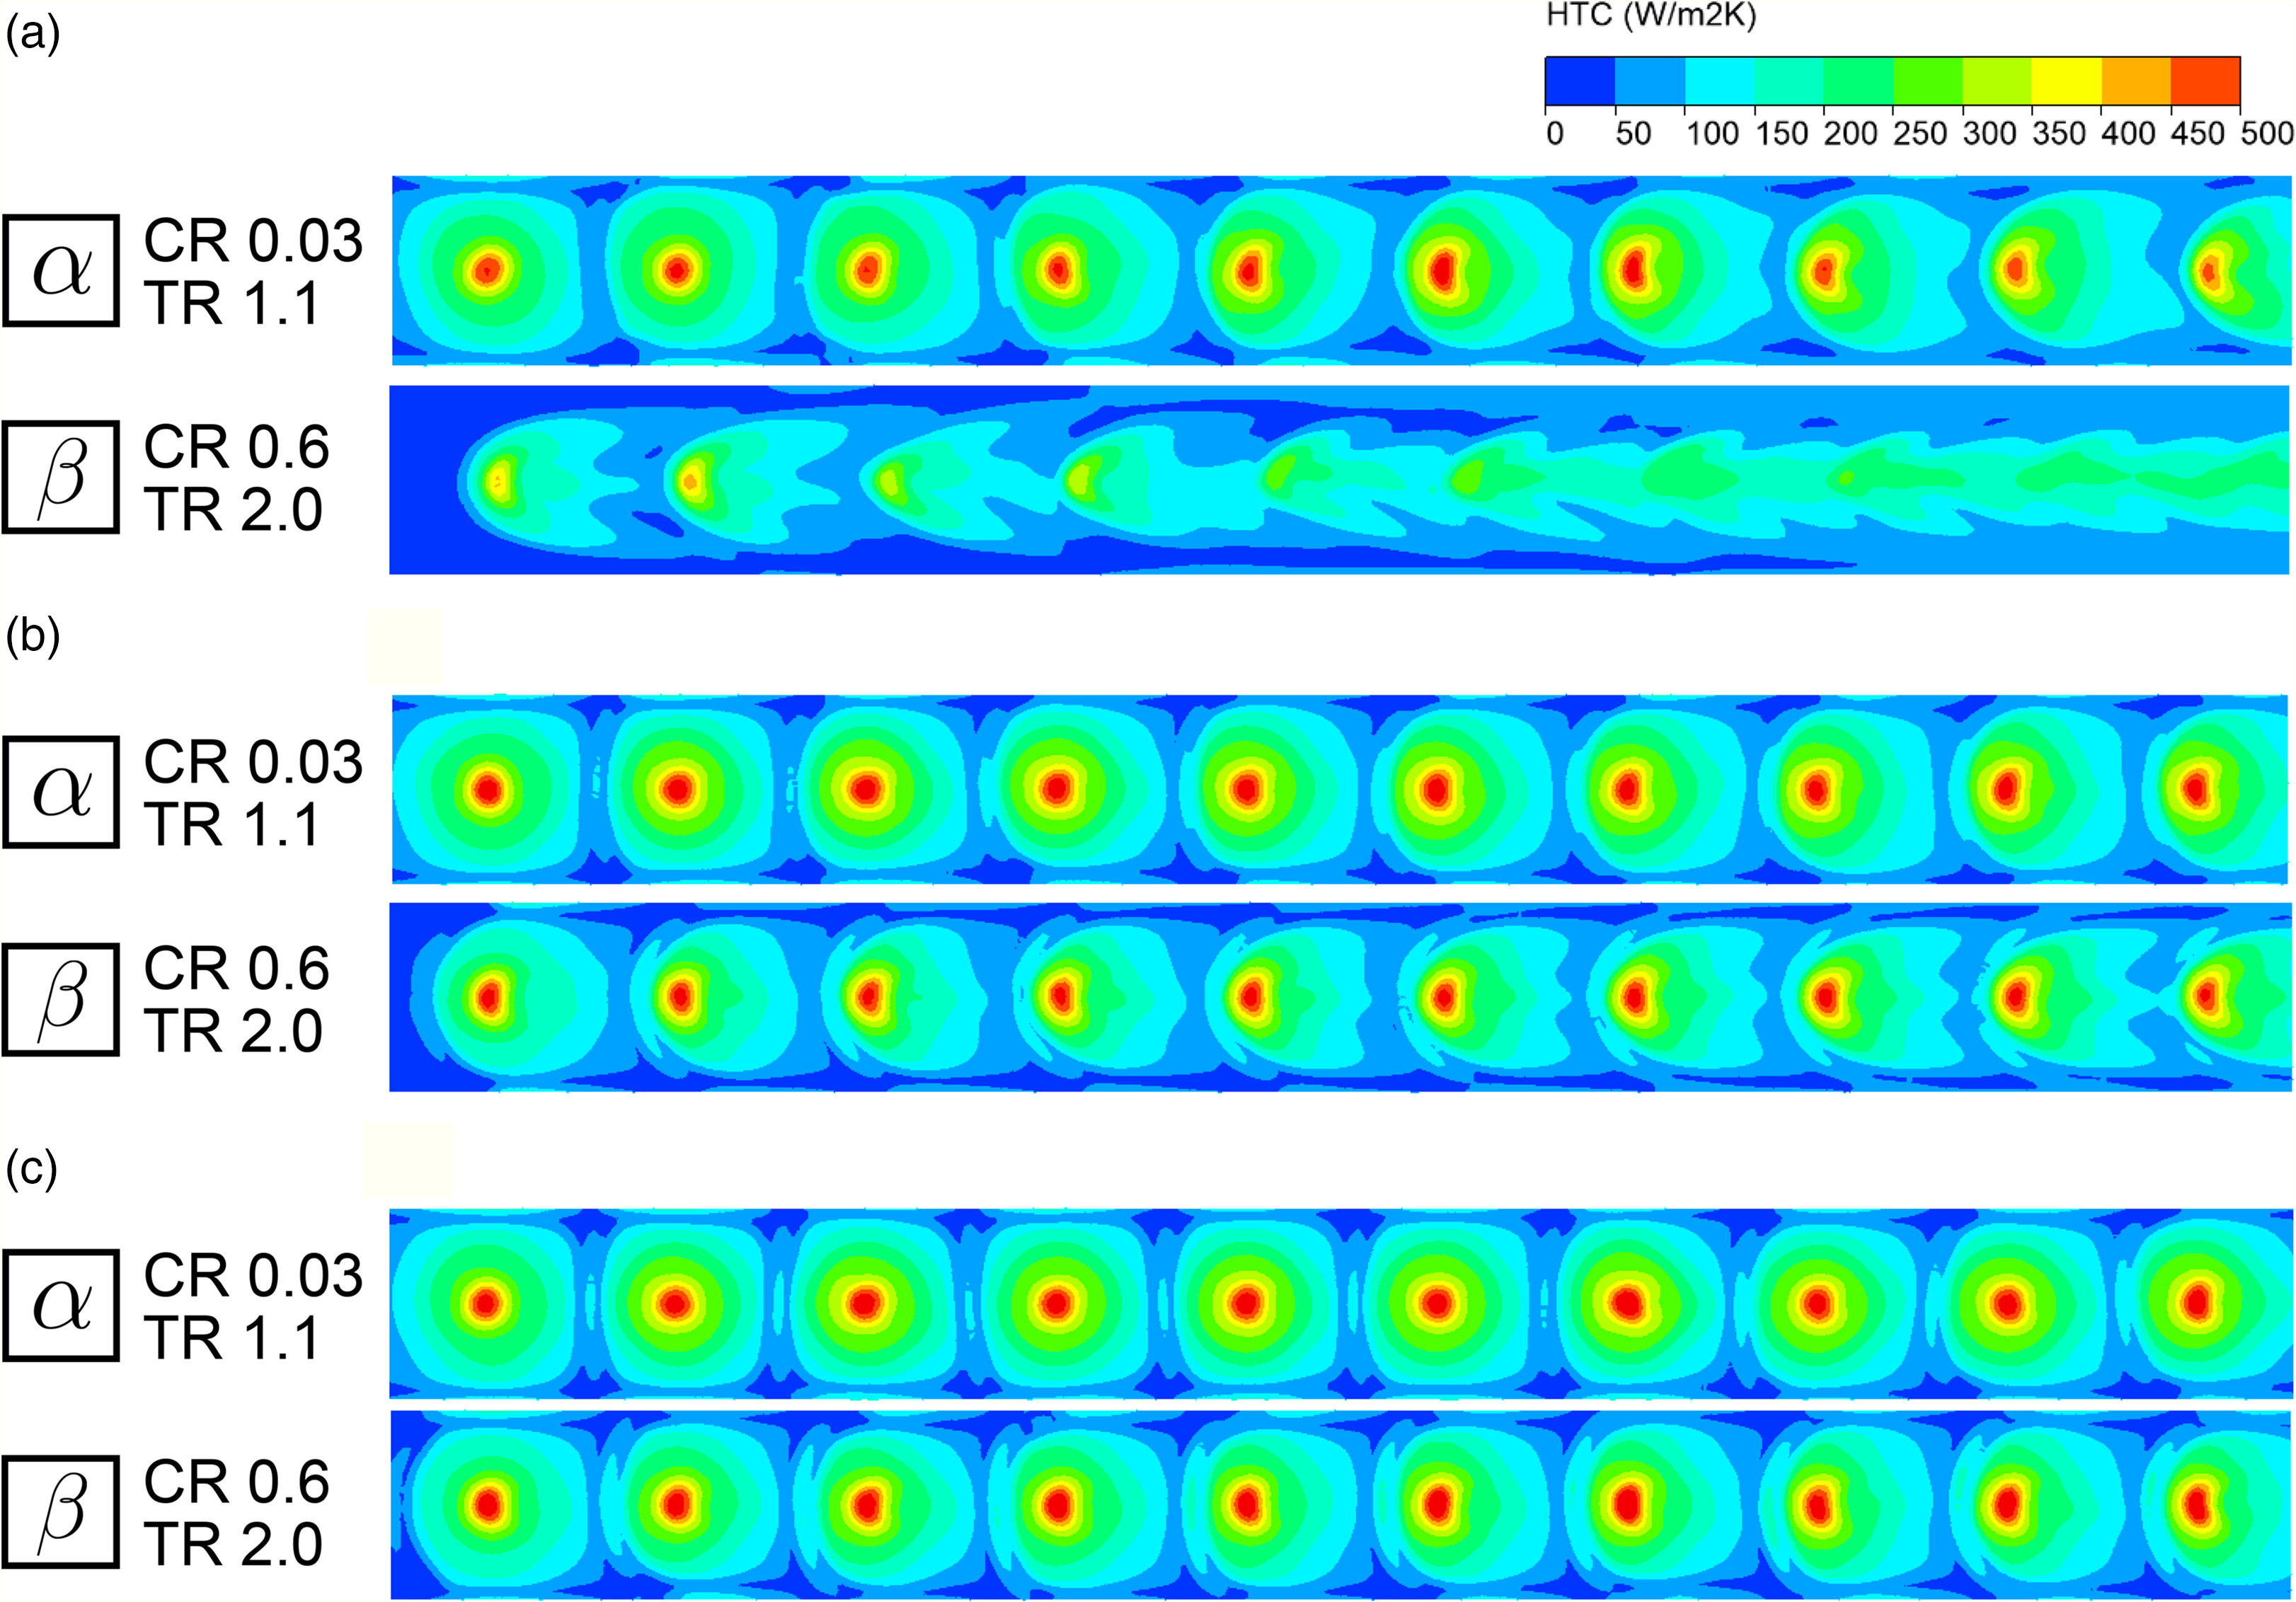
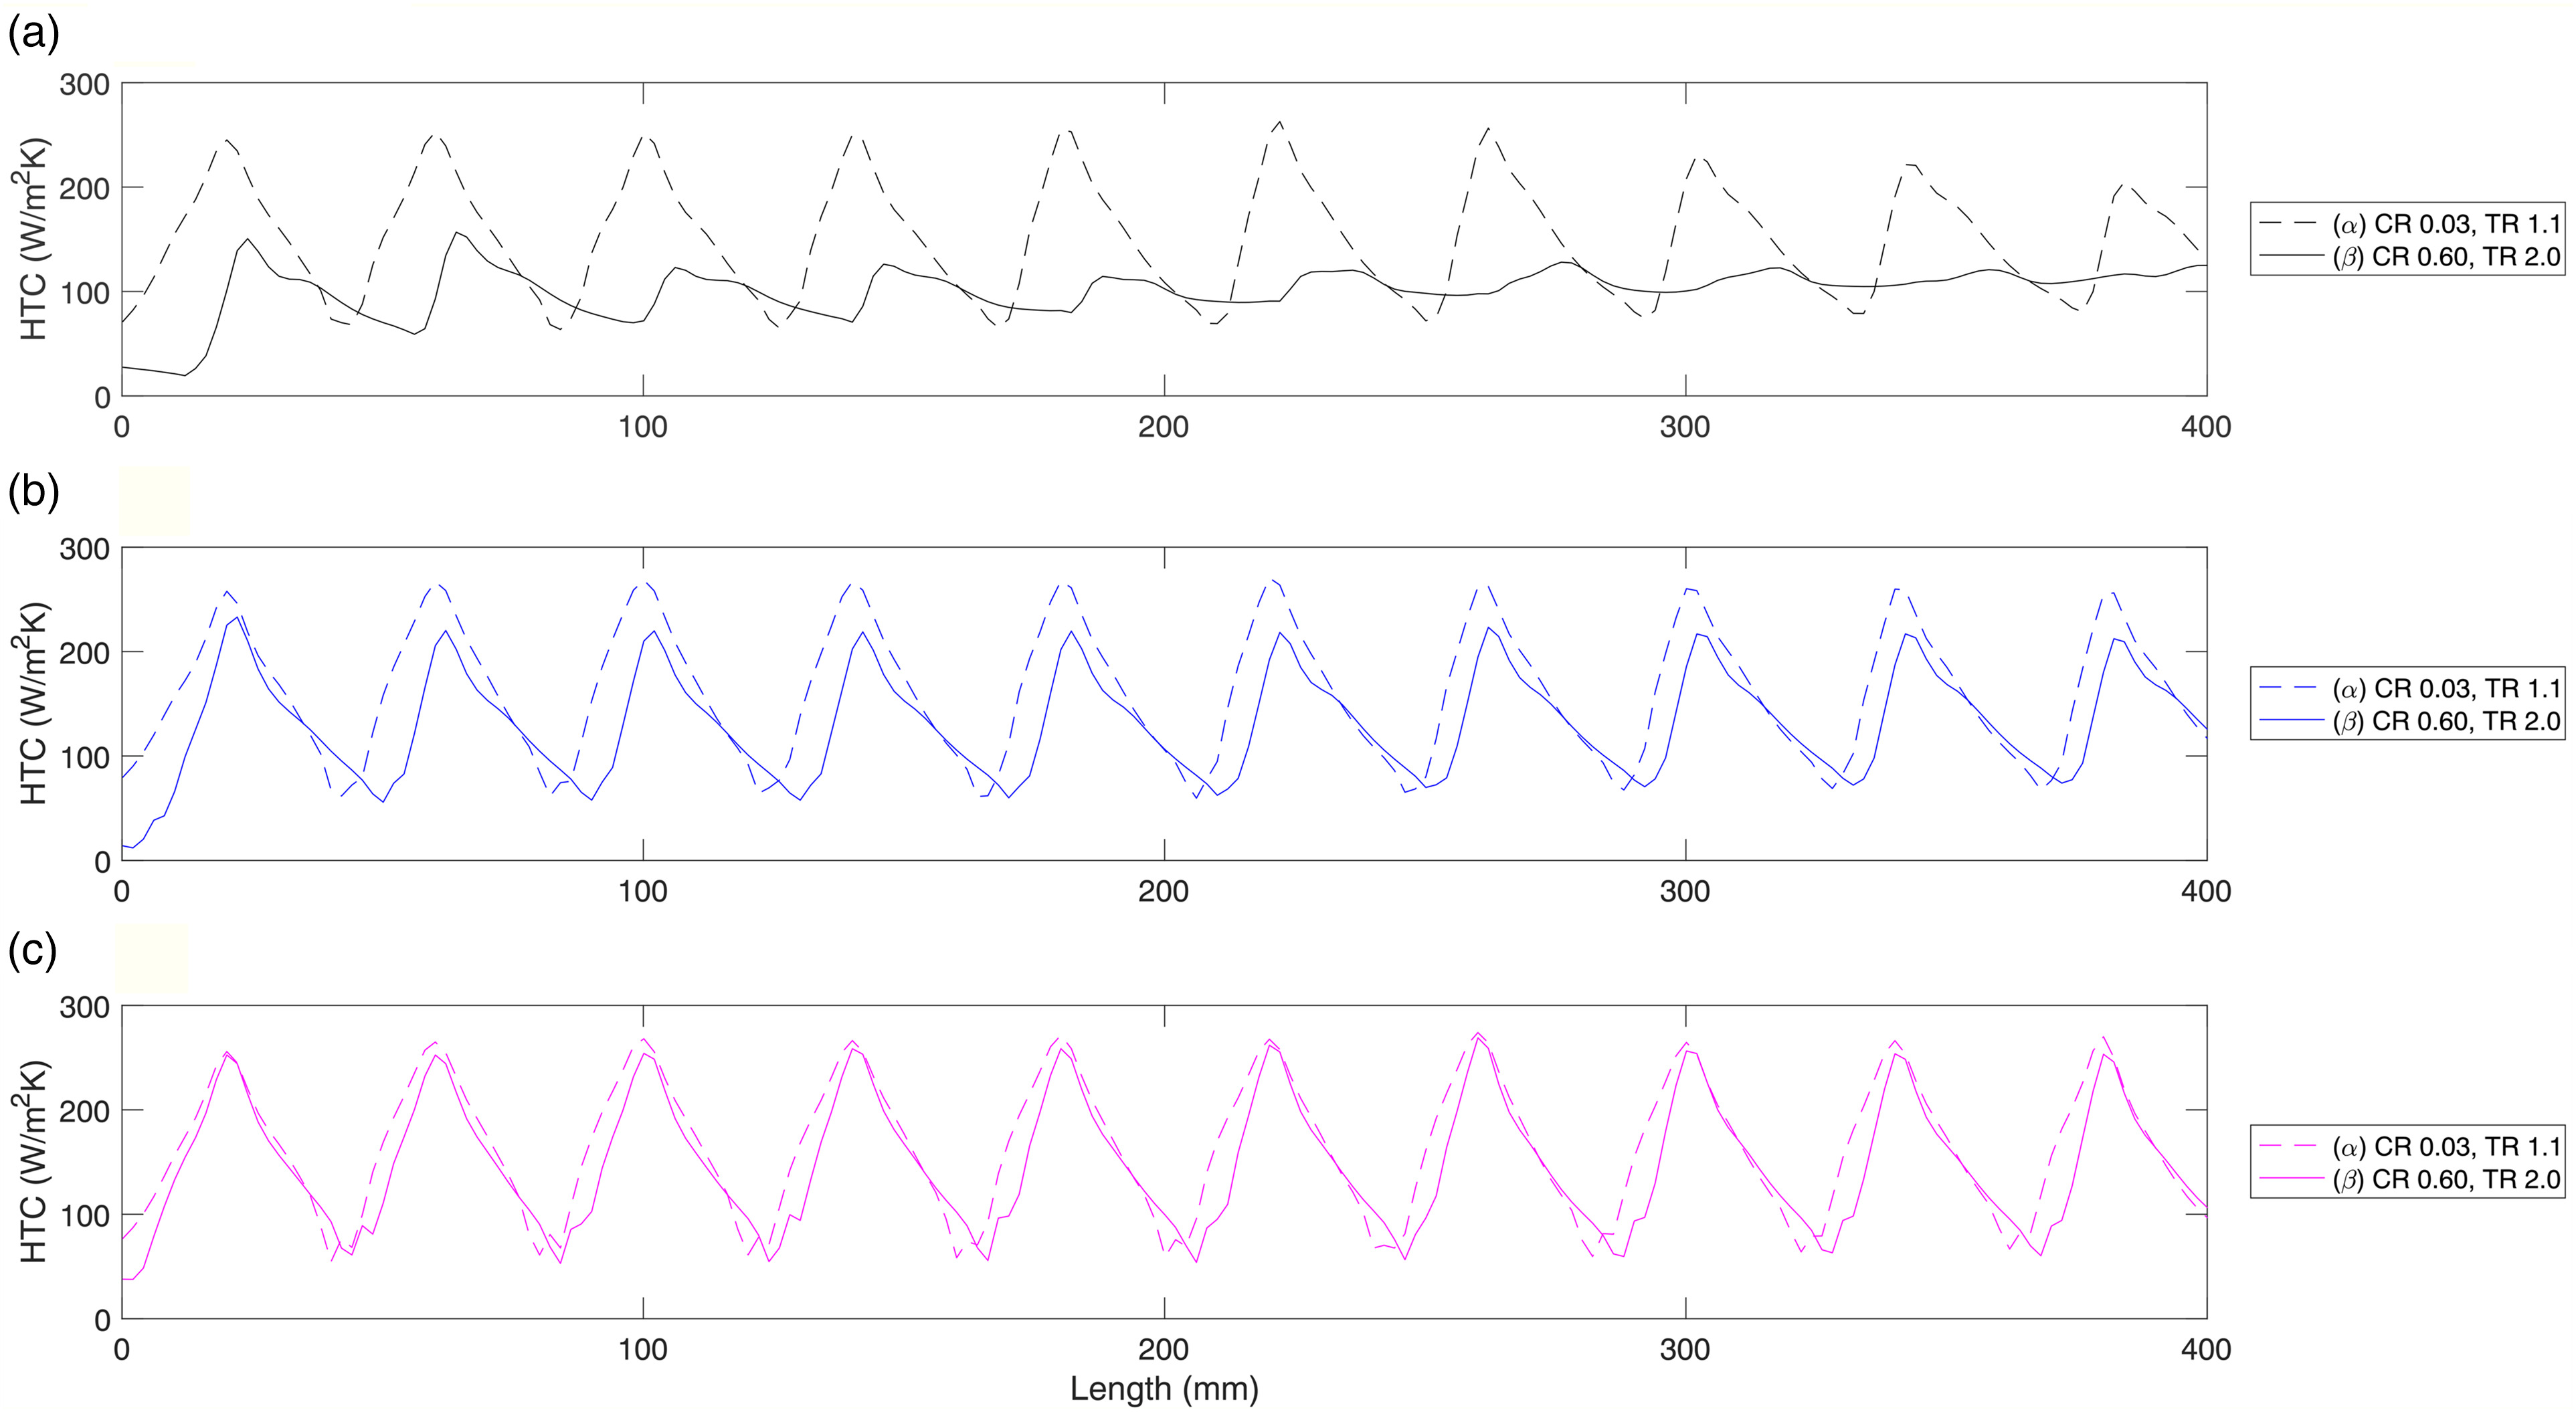
Figure 15 shows the spanwise averaged heat transfer coefficient for the best performing conditions
Figure 15.
Spanwise averaged heat transfer coefficient distribution on target plate for different corrugated heights, temperature ratios and initial crossflow ratios. (a) Flat (b) Low corrugated (h/d = 3) (c) High corrugated (h/d = 9).
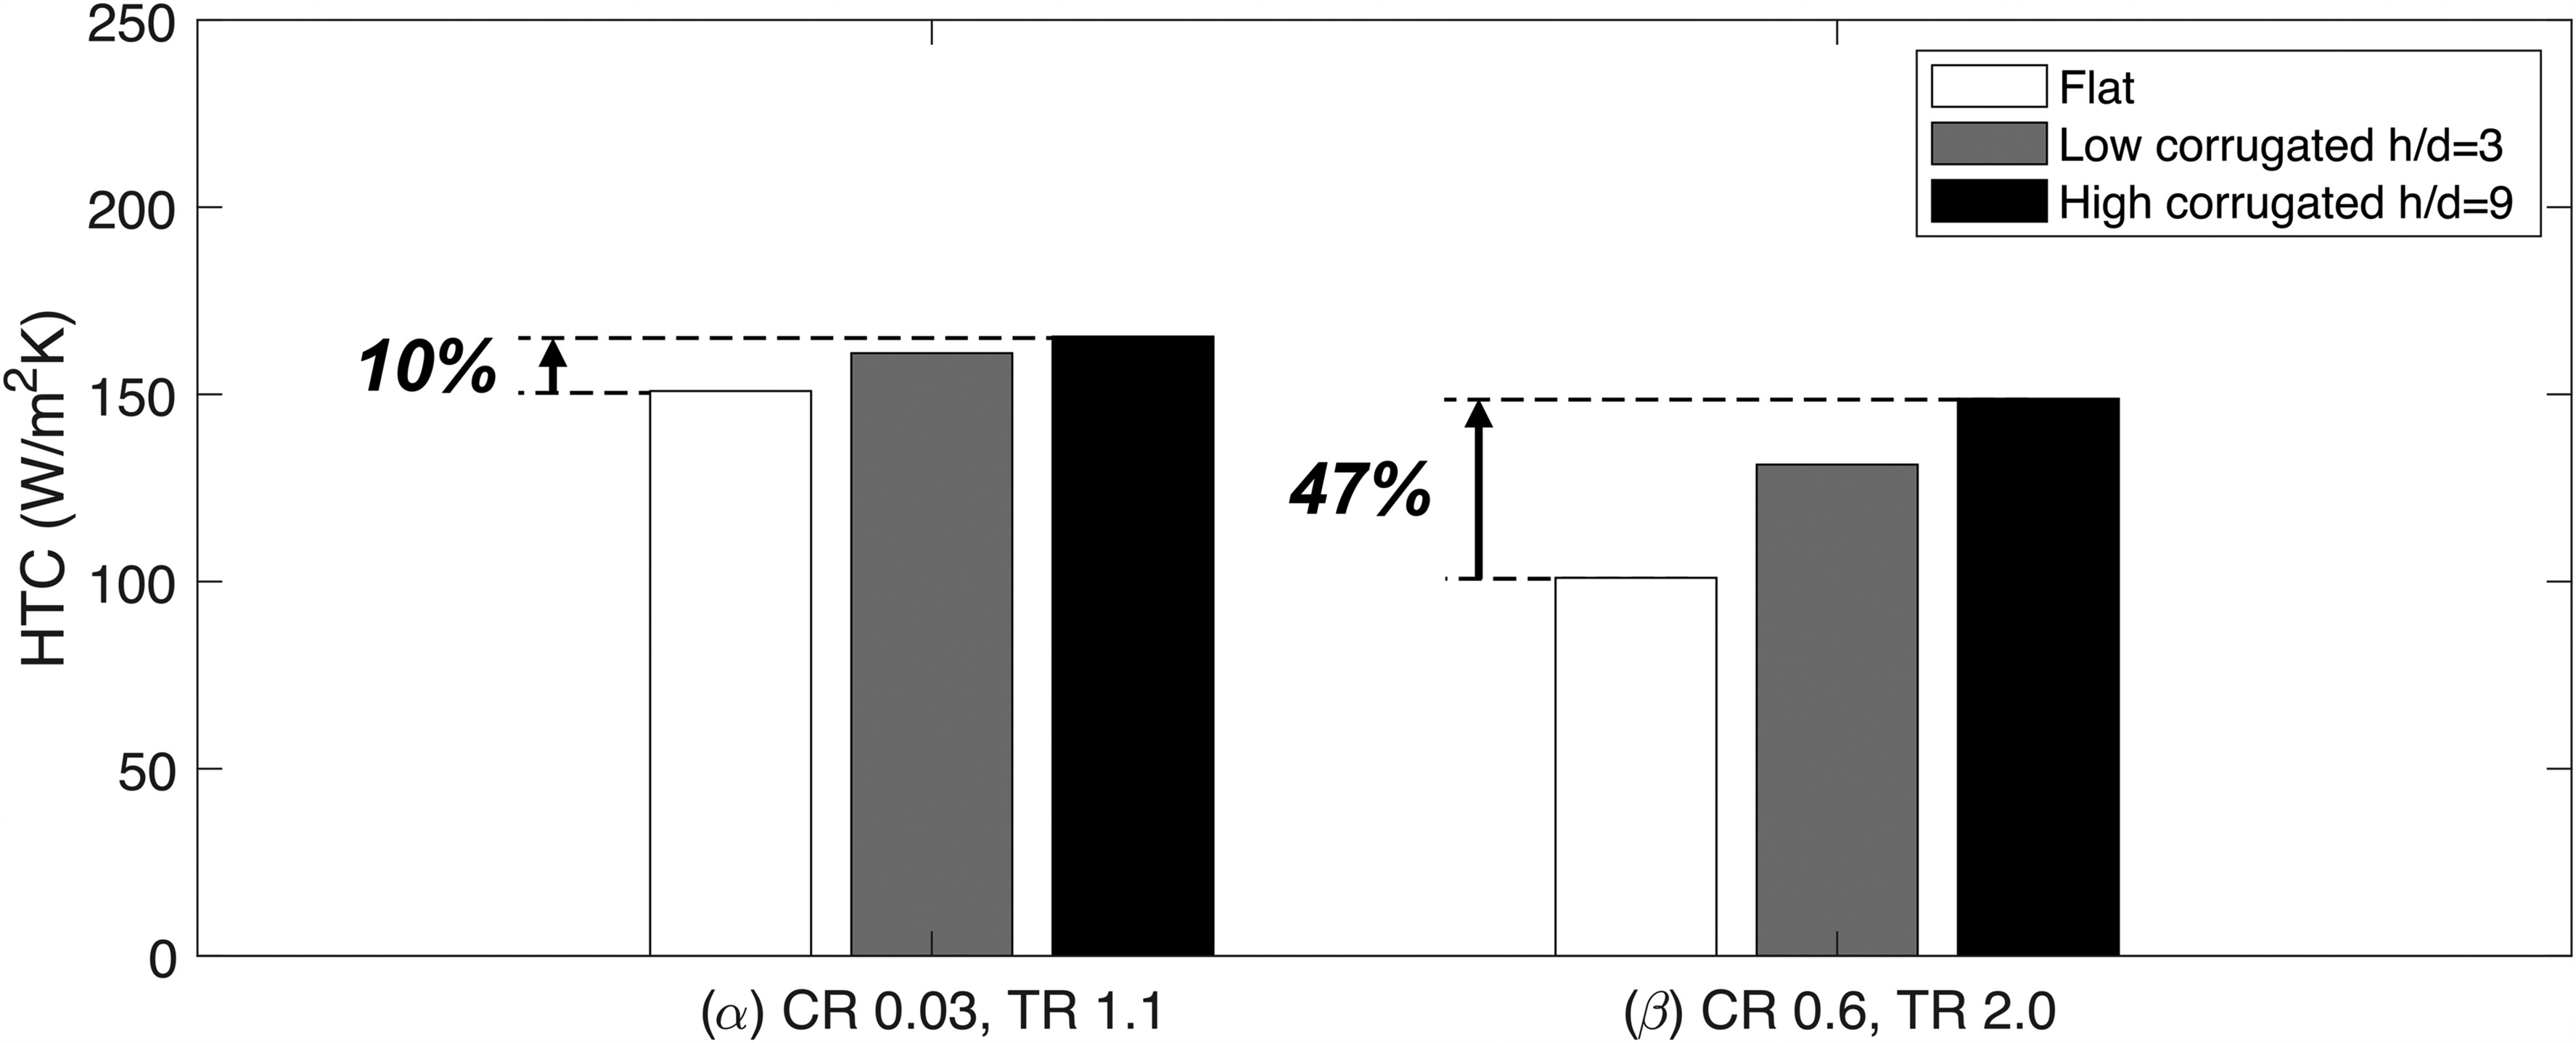
To summarize the effects of different temperature ratios and initial crossflow ratios, bars for the heat transfer coefficient of flat and corrugated geometries at the conditions
Conclusion
In this paper, numerical simulations are used to explore the use of corrugated geometries for enhancement of impingement jet heat transfer at a range of crossflow conditions and temperature ratios and that designer might consider for future gas turbines, which would be challenging to study experimentally. The key findings are as follows:
For the flat geometry, with increasing temperature ratio the heat transfer coefficient decreases inline with literature. It is observed that changes in air properties in the near wall region cause a change in the flow interaction at the wall and holistically reduce heat transfer. In the downstream region, crossflow accumulates. Due to a higher wall temperature, crossflow temperature is increased, causing a decrease in density and increase in crossflow velocity and momentum ratio, resulting in jet distortion and reduced impingement area.
For corrugated geometries, the heat transfer deterioration due to high temperature ratio is reduced. Corrugated geometries provide increased cross sectional area, decreasing crossflow velocity, and resulting in a smaller increase in momentum ratio and decreased jet distortion.
The heat transfer enhancement using corrugated geometries is up to 10% at low temperature ratio and low initial crossflow conditions. However, at high temperature ratio (up to TR 2.0) and high initial crossflow conditions, heat transfer enhancement increases up to 30% for low corrugated geometries, and to 47% for high corrugated geometries.
Nomenclature
CR
Crossflow Ratio (−)
d
Impingement hole diameter (m)
HTC
Heat Transfer Coefficient (W/m2K)
h
Corrugated wall height (m)
MR
Momentum Ratio (−)
Nu
Nusselt number (−)
n
Nusselt number ratio scaling exponent (−)
P
Pressure (Pa)
p
Hole pitch of spanwise and streamwise (m)
q
Heat flux (W/m2)
RANS
Reynolds Averaged Navier Stokes (−)
Re
Reynolds number (−)
SST
Shear Stress Transport (−)
T
Temperature (°C)
TR
Temperature Ratio (−)
t
Impingement plate thickness (m)
V
Velocity (m/s)
w
Corrugated wall width (m)
z
Distance from impingement plate to target plate (m)