
Introduction
The organic. Rankine cycle (ORC) is a thermodynamic process that shows exceptional features for exploiting waste heat sources across a wide range of temperatures (Wang et al. 2013a, b). This can be achieved by carefully selecting the working fluid, which allows for more efficient exploitation of low-grade waste heat (Yamamoto et al., 2001). Rijpkema et al. (2017) suggested that ORCs outperform other thermodynamic cycles regarding thermal efficiency. In the context of waste heat recovery (WHR), Lecompte et al. (2015) identified the ORC as the most suitable solution for low-temperature sources (<350°C), a finding that was experimentally validated by Benato and Macor (2017).
As an example, ORCs have been used to recover waste heat from internal combustion engines on vehicles to increase the overall efficiency and reduce emissions. A 1.2–3.7% increase in engine efficiency was reported by Galindo et al. (2015) by using an ORC WHR system. Similarly, BMW (Freymann et al. 2008; Ringler et al. 2009), Honda (Ibaraki et al., 2007), and Cummins (Nelson, 2006) proposed efficient ORC installations in passenger vehicles and trucks.
Typical organic fluids have lower latent heat than water, necessitating a higher mass flow rate to achieve equivalent power levels (Bao and Zhao, 2013). This significantly increases the size and power consumption of the pumping stage compared to systems designed for water (Meng et al., 2017). Consequently, the size of the pump and its efficiency play an increasingly important role in ORC compared to Rankine cycles. In particular, for small-scale ORC (<100 kWel), there is disagreement on the ideal pumping technology for ORC systems and a lack of investigation on small-scale pumps suitable for mobile ORC systems (Yang et al. 2018a).
Different types of commercial pumps were studied for ORC systems, such as multi-stage centrifugal pumps (Meng et al., 2017; Yang et al., 2019), reciprocating pumps (Landelle et al., 2017), sliding vane pumps (Bianchi et al., 2017), Roto-Jet pumps (Lei et al., 2016), and diaphragm pumps (Xu et al., 2017). Previous research suggests that the choice of pump affects the ORC efficiency and that some pumps are more suitable for certain conditions than others. For instance, Yang et al. (2019) suggested using pumps with very low specific speeds to achieve a higher thermal efficiency of the ORC system. Meanwhile, Yang et al. (2018b) recommended that the thermal efficiency of the ORC system studied by Meng et al. (2017) can be improved if a hydraulic diaphragm metering pump is employed instead of the original multi-stage pump.
Rosset et al. (2021) recently published data on a gas-bearing supported radial inflow turbine designed for an ORC used for WHR on truck engines. They used a commercially available low-speed centrifugal pump with 27 stages (GRUNDFOS CRNE 1–27) to perform their experimental investigation. The size was six times larger than that of the 8 kW turbine. This highlights the need for smaller, more efficient pumps to make compact, high-power-density ORC more accessible.
Recent work on small-scale turbopumps highlights the feasibility of single-stage designs for driving typical ORC applications (Zakeralhoseini and Schiffmann, 2023a), which is particularly promising for achieving very compact and efficient designs. These high-power density solutions offer promising concepts for installing waste heat recovery systems in various vehicle types and sizes (Xu et al., 2019). Additionally, the reduced material requirements result in cost savings.
The design of turbomachinery is characterized by the sequential engagement of increasingly complex models (Japikse et al., 2006; Gülich, 2010). The design process usually starts with design maps to identify overall dimensions and rotor speed and ends with 3D numerical flow simulations to fine-tune the geometry. Pre-design diagrams (0D models) for turbopumps (i.e., Balje, 1962, 1981) allow the engineers to quickly select the rotational speed and impeller outlet diameter for a given set of operating conditions. These maps relate efficiency to specific speed (Equation 1), and specific diameter (Equation 2), and allow narrowing down the solution space at the beginning of the design process.
The maps proposed by Balje (1962), (1981) are based on experimental data from large-scale pumps and are only applicable to pumps operating at high Reynolds numbers (>108). However, for small-scale turbopumps as required for small-scale ORC (<15 kWel), typical Reynolds numbers range from 105 to 106, and predictions of impeller outlet diameter for a given set of operating conditions using classical Balje maps may entail significant inaccuracies. This leads to erroneous starting points in the design process (Zakeralhoseini and Schiffmann, 2024).
In a second step, 1D models (e.g., Japikse et al., 2006; Gülich, 2010) allow to refine additional geometrical parameters such as impeller inlet diameters, blade angles, and volute dimensions. 1D models are based on the turbomachinery Euler equation and empirical loss correlations commonly derived from experimental data. The advantage of 1D models is that they are computationally efficient and can be used to explore a vast variety of design alternatives quickly. However, the 1D models available in the literature (e.g., Gülich, 2010) are developed based on large-scale turbopumps. Consequently, the influence of down-scaling, which may lead to an imperfect similarity between models and small-scale machines (when they do not perfectly match in terms of scaling, design, or operational parameters (Gülich, 2010)) due to variations in Reynolds number, tip clearance ratio, and relative surface roughness, remains unaddressed (Diehl et al., 2020).
Much has been investigated regarding the slip factor to identify the difference between the metal blade and the actual flow angles, as evidenced by Gülich (2010) and von Backström (2005). However, a slip factor model applicable to unshrouded turbopump impellers is still lacking, and the impact of critical factors, such as tip clearance and splitter blades, on performance indicators like head coefficient and efficiency, remains poorly understood. Recent works by Zakeralhoseini and Schiffmann (2022a), (2023b) suggest that the slip factor is highly affected by off-design conditions and that both the slip factor and head rise coefficient are influenced significantly by the splitter blade design.
As a summary, state-of-the-art pre-design maps (0D-models) and 1D-meanline models fall short of accurately characterizing small-scale unshrouded turbopumps. This misleads the design process in the initial phase and complexifies the design of compact turbopumps for typical small-scale ORC applications.
The objective is to address these limitations by presenting updated nq–ds diagrams with efficiency estimations (pre-design maps/0D models), and revised 1D models that account for the effects of tip clearance and splitter blades in small-scale high-speed turbopumps specifically designed for ORC applications.
These models are developed through extensive CFD calculations and can be used for the preliminary design and optimization of such pumps. Notably, this study goes beyond previous research by presenting novel pre-design maps (0D models) and integrating both 0D and 1D models with experimental studies. Two small-scale turbopumps are designed and tested for an 8 kW ORC (Rosset et al., 2021) to validate the application of these models, demonstrating their effectiveness in properly designing ORC turbopumps. These validated pre-design maps (0D models) and 1D models adapted to reduced scale can aid in the initial design of centrifugal pumps for ORC applications. The validated model and the deviations observed between model predictions and experimental measurements represent novel contributions not previously studied.
Numerical procedure
To establish novel pre-design tools and 1D models, a wide array of reliable training and validation data is required. Therefore, a parametric design tool, which can rapidly create a turbopump geometry, is developed and coupled with numerical 3D computations to generate training data on an extensive range of geometries. The methodology implemented for this work is summarized in Figure 1. The design tool creates a dataset of 2,500 turbopump geometries for inferring updated pre-design maps, 576 geometries for a tip clearance model, and 1,620 geometries for a splitter blade model within the ranges specified in Table 1. For each set of parameters in Table 1, the design tool generates a turbopump geometry by incorporating the equations given in Table 2 (Figure 1, step A).
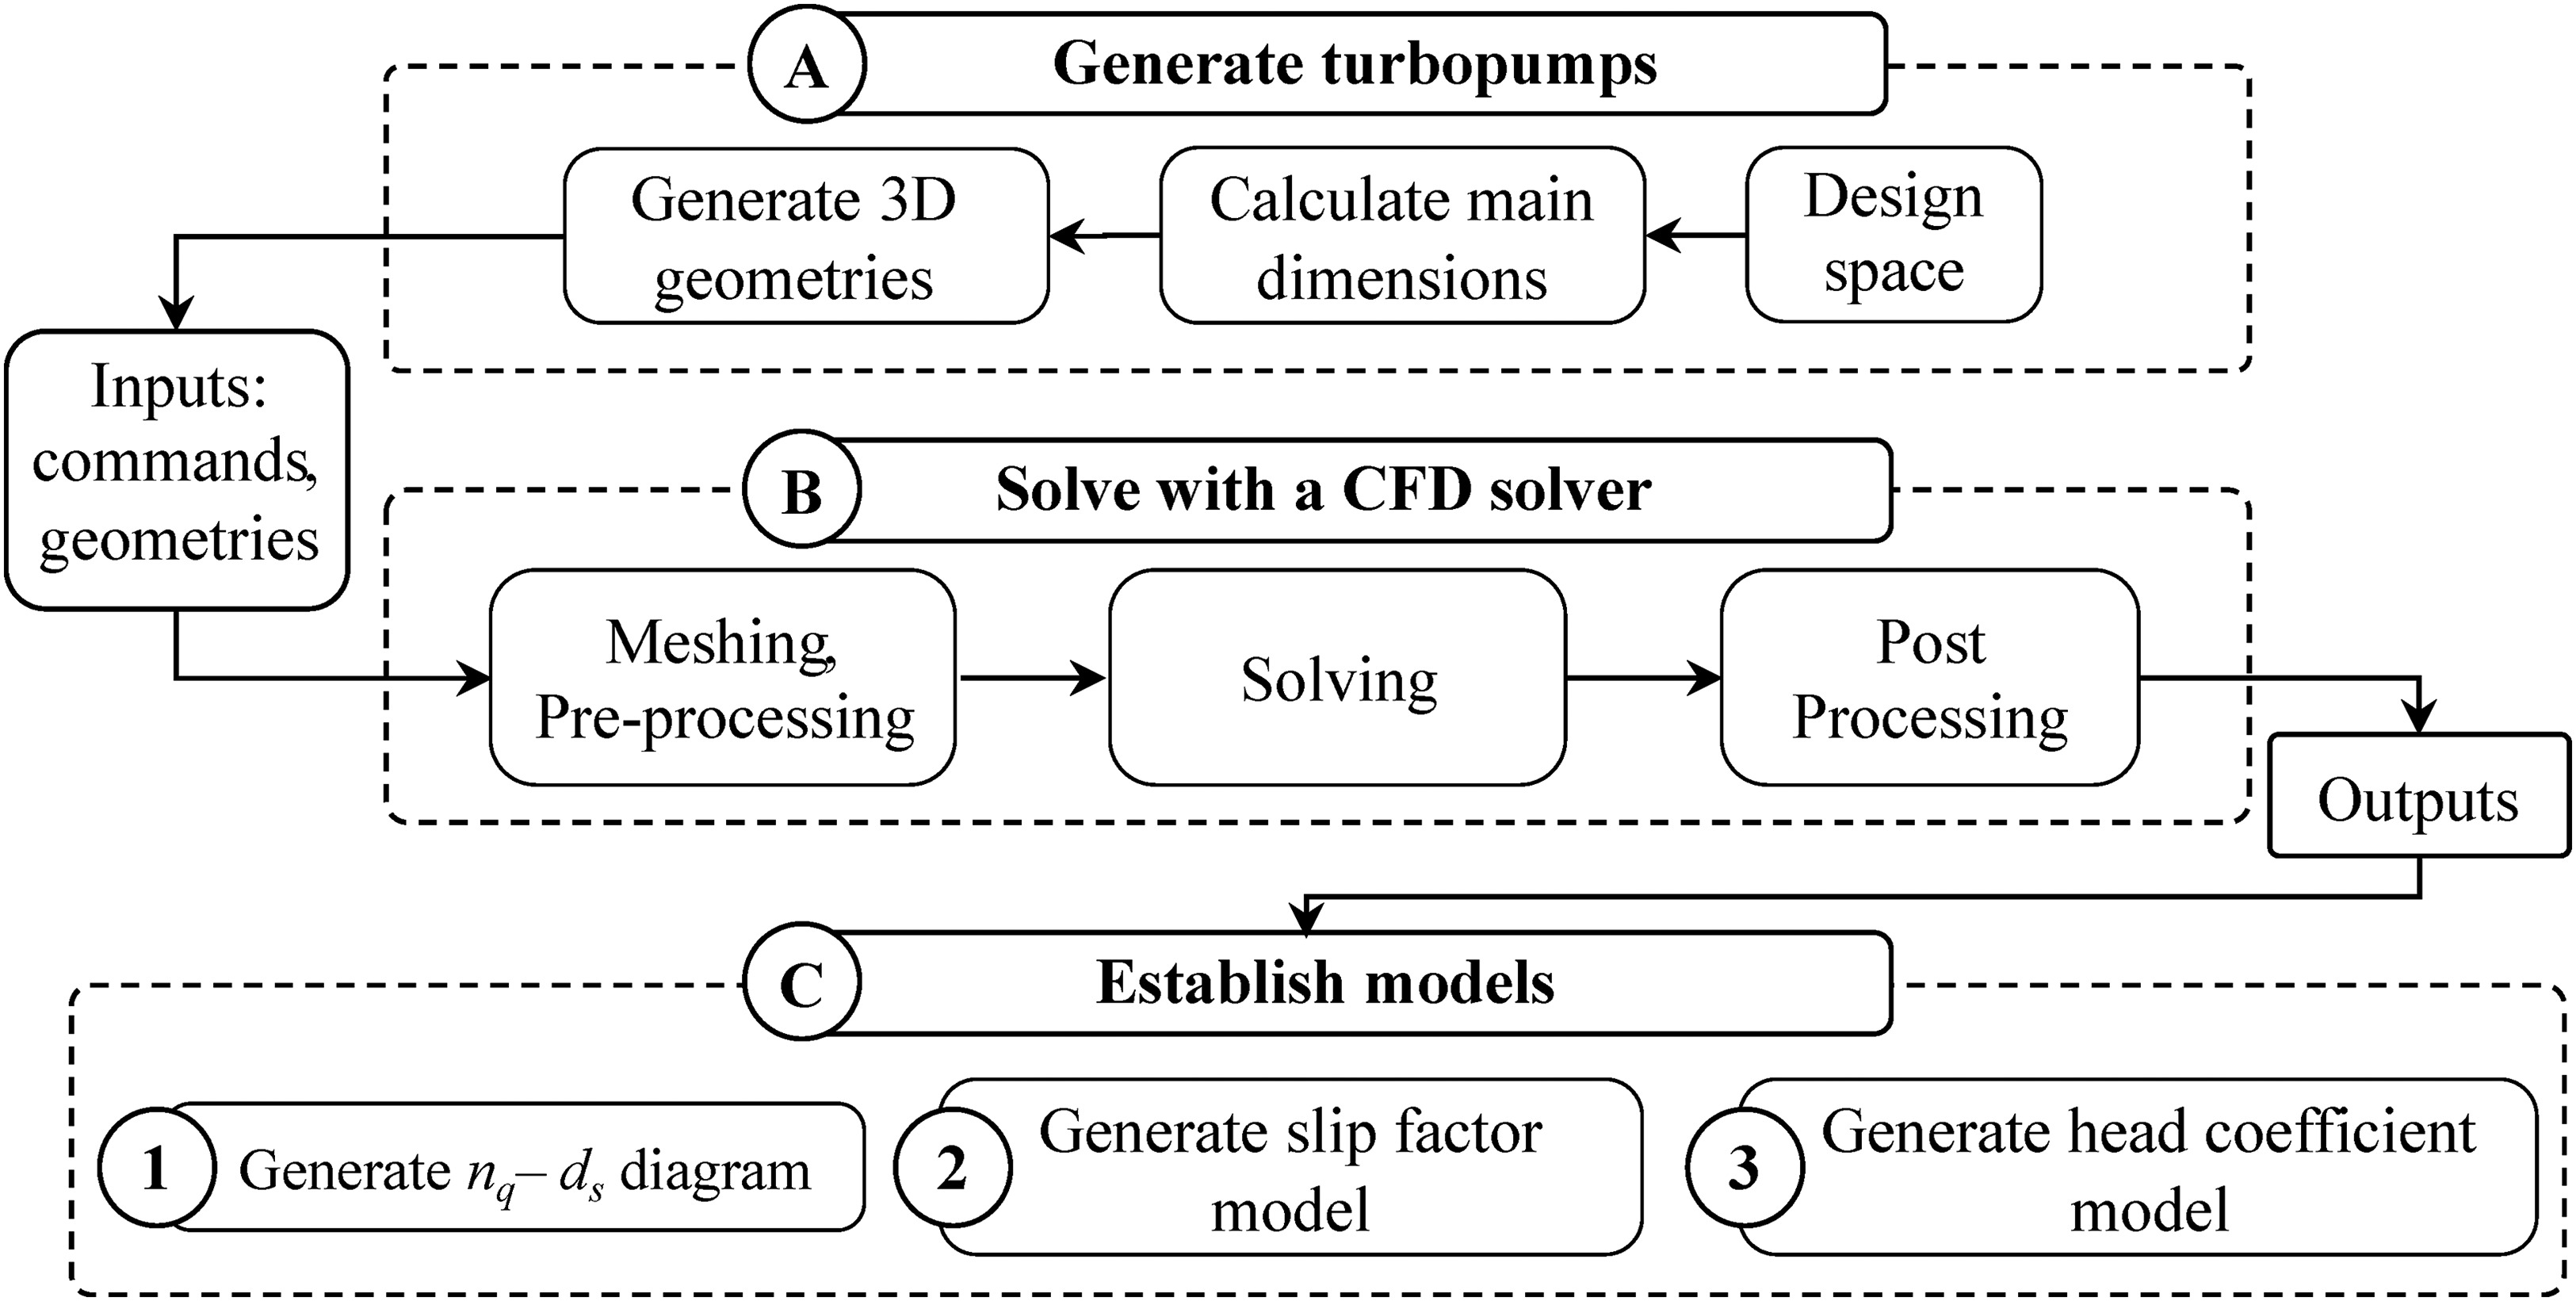
Table 1.
Parameter ranges of turbopumps for CFD computations to infer updated Pre-design maps (0D-model), and tip-clearance and splitter blade loss correlations for the 1D-model.
Table 2.
Impeller equations.
| Parameter | Equation | |
|---|---|---|
| Head coefficient (Gülich, 2010) | (3) | |
| Impeller outlet diameter | (4) | |
| Inlet diameter | (5) | |
| Flow angle at the inlet | (6) | |
| Leading edge angle | (7) | |
| Inlet width | (8) | |
| Outlet width | (9) | |
| Pitch of splitter blades | (10) | |
| Meridional location of splitters | (11) | |
| Slip factor | (12) |
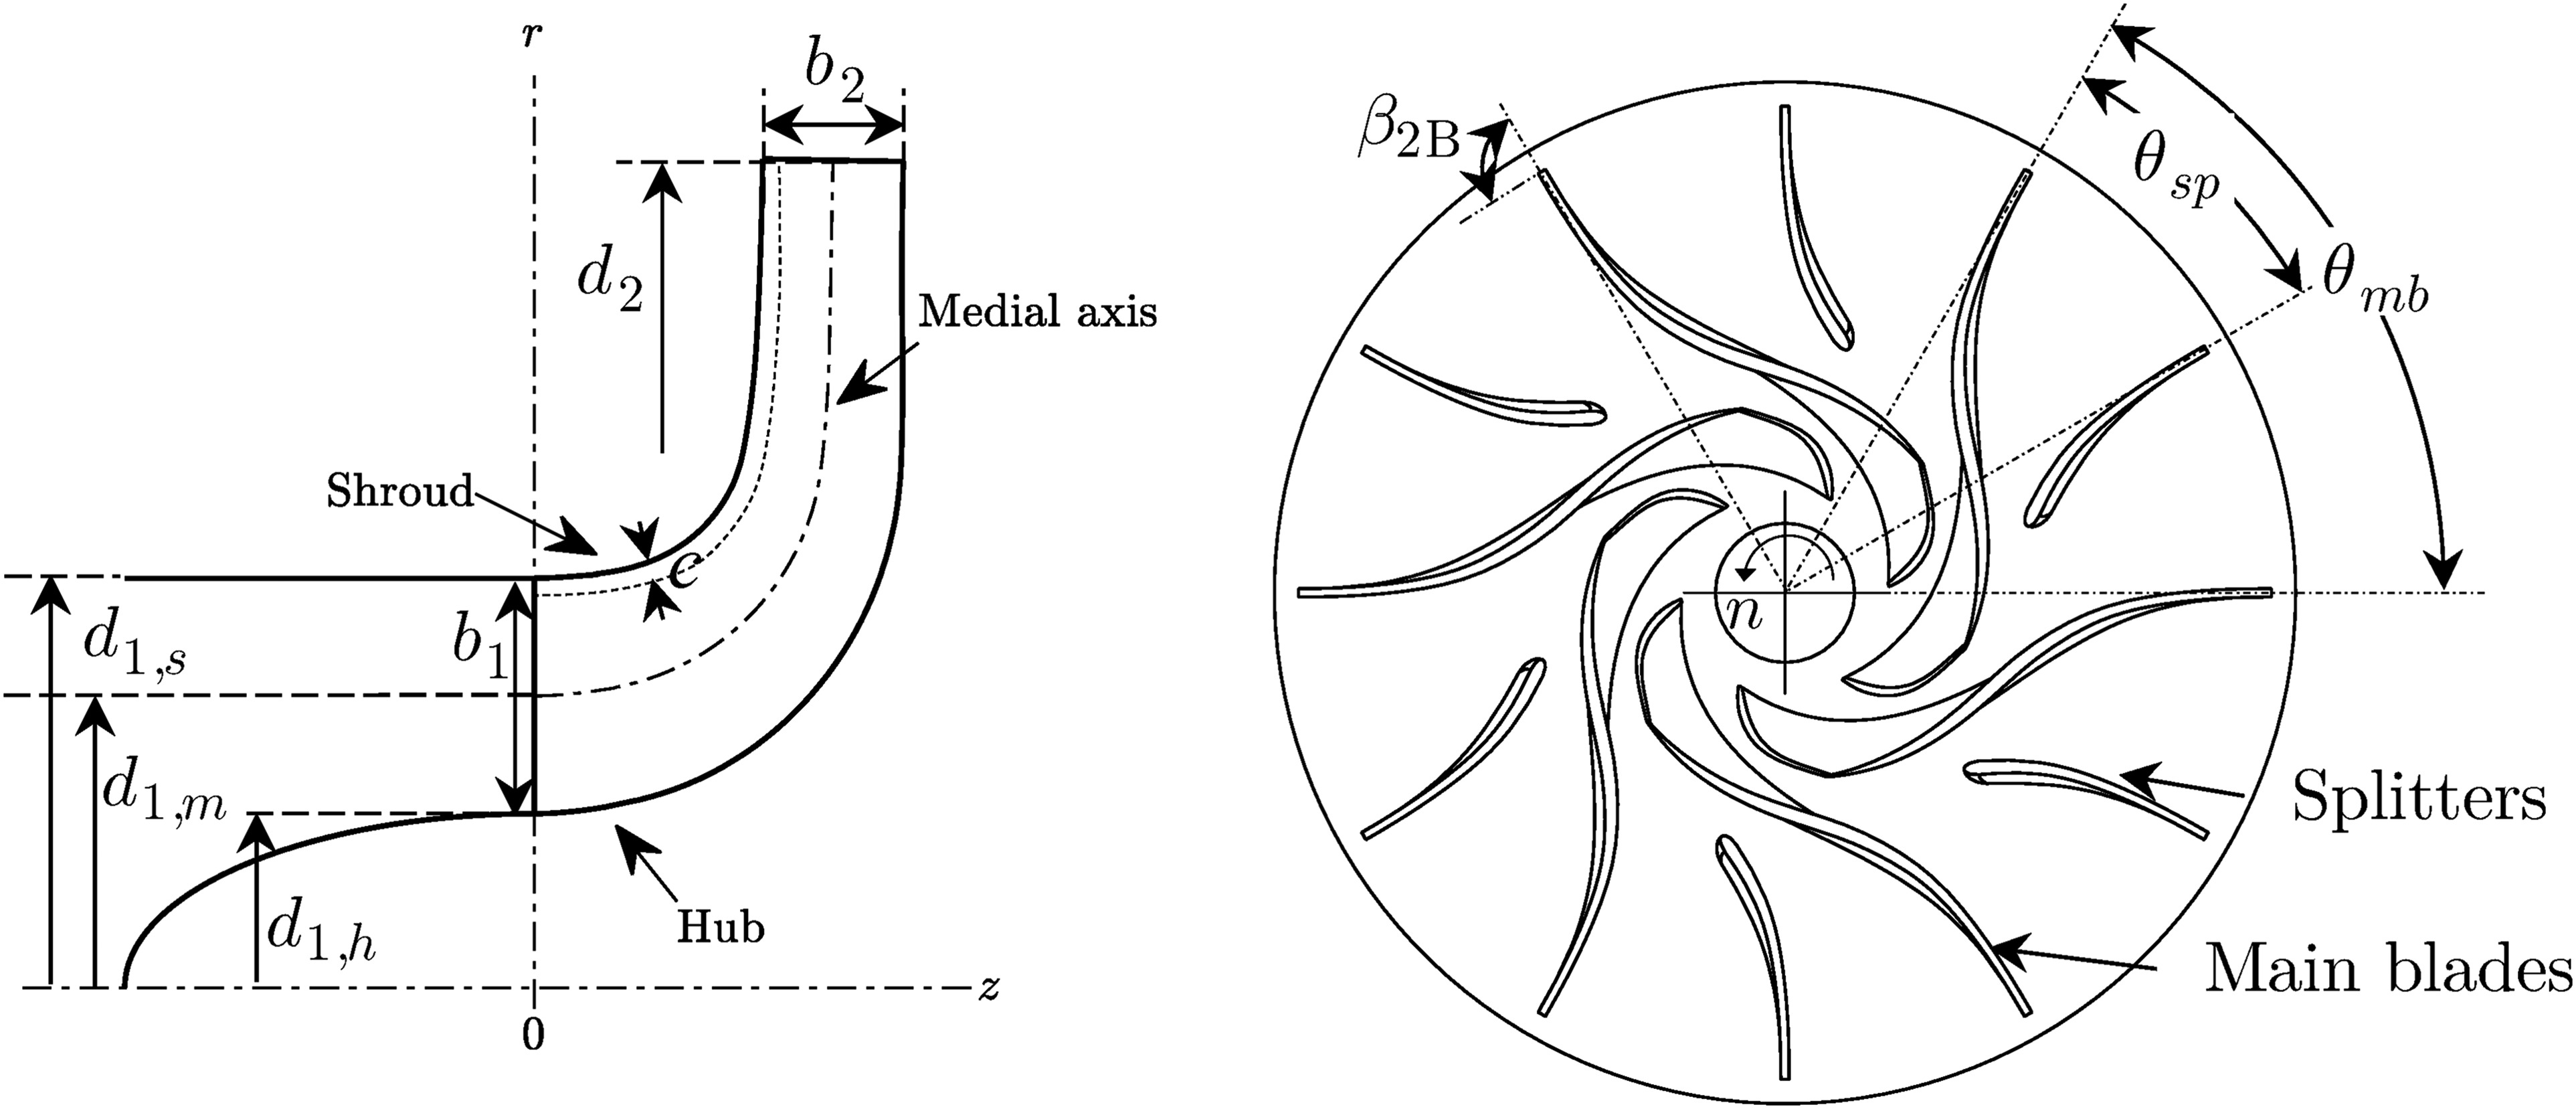
Stepanoff (1957) and Pfleiderer (2013) proposed correlations for determining the number of blades. In practical applications, however, the number of blades typically ranges between 5 and 7, with a tendency to decrease as specific speed increases (Nourbakhsh, 2005). In this study, the turbopump geometries used for generating the data through CFD computations are designed with 5 to 7 blades. The pitch of the splitter blades, calculated with (Equation 10), determines their angular position within the main blade channel (see Figure 2). The relative position of the leading edge of the splitter blades
Turbopump geometry generator and numerical methods
The automated turbopump geometry generation starts by establishing the main parameters of the impeller, followed by the design of a volute to collect the flow discharged from the impeller.
Impeller
The equations determining the impellers’ parameters are summarized in Table 2. A hub ratio
Volute
The width of the volute is the same as the impeller outlet width, and the cutwater is positioned at a 17° circumferential angle in the impeller rotation direction. The volutes are designed with elliptical or circular cross-sections, and the throat area follows the recommendations of Gülich (2010). To establish the volute cross-sections, the method of conservation of angular momentum (Pfleiderer, 2013) is used. A script is developed to create the 3D geometry of the volute and outlet pipe, utilizing the ANSYS Design Modeler (Release 2021 R1) engine to loft the volute profiles.
On average, the time required for generating each geometry is 6.3 s. Once a turbopump geometry is generated, the design tool initiates the CFD solver (Figure 1, step B). The solver is then given a set of appropriate commands to solve the flow passing through the pump. The analysis is conducted with ANSYS CFX 2021 R1.
CFD analysis
The impeller and inlet pipe are meshed using a structured grid, while the volute is meshed using an unstructured grid. The impeller grid is generated via ANSYS Turbogrid, utilizing J-Grid and O-Grid topologies, with grid sizes varying from 800,000 to 1,500,000 elements depending on the specific geometry. The volute mesh is generated with ANSYS Meshing to conserve its intricate geometry. The mesh comprises 1,500,000–10,000,000 elements for the diffuser and volute. A skewness of less than 0.3 is imposed for all geometries to ensure good mesh quality. The near-wall elements are adjusted to ensure y+ values within the turbulence model validity range. A dense mesh comprising over 45 layers is employed for the tip clearance gap, with an end ratio ranging from 30 to 43.
The impeller is set as a relative flow domain, rotating at the pump speed. Steady-state simulations are performed assuming that the working fluid is R245fa in liquid state, using properties derived from REFPROP (Lemmon et al., 2018) at a temperature of 35°C and pressure of 4 bar, where the fluid exhibits a density of 1,311.6 kg/m3 and a dynamic viscosity of 352 µPa·s. The boundary conditions of total pressure and mass flow rate are set for the inlet pipe and volute discharge, respectively. The SST model (Menter et al., 2003) is used to model turbulence. The turbulence equations and advection term are discretized with a high-resolution scheme. Although the parameters of interest in this research—namely head rise, efficiency, and outlet flow conditions—typically converge within 150 iterations, a minimum of 400 iterations and an RMS residual target of 10−5 are established as convergence criteria. The computations are performed using six workstations, each equipped with Intel Xeon Processor E5-1650 v3 running at 3.50 GHz.
Post-processing is performed using ANSYS CFD-Post. The velocity variables (
Pre-design maps and 1D models
The CFD results are then used to infer pre-design maps based on 2,500 geometries and 1D models considering the effects of tip clearance, using 576 geometries, and splitter blades, using 1,620 geometries, as shown in Figure 1, step C.
Pre-design maps
The non-dimensional parameters of specific speeds (nq), specific diameters (ds) and internal efficiency
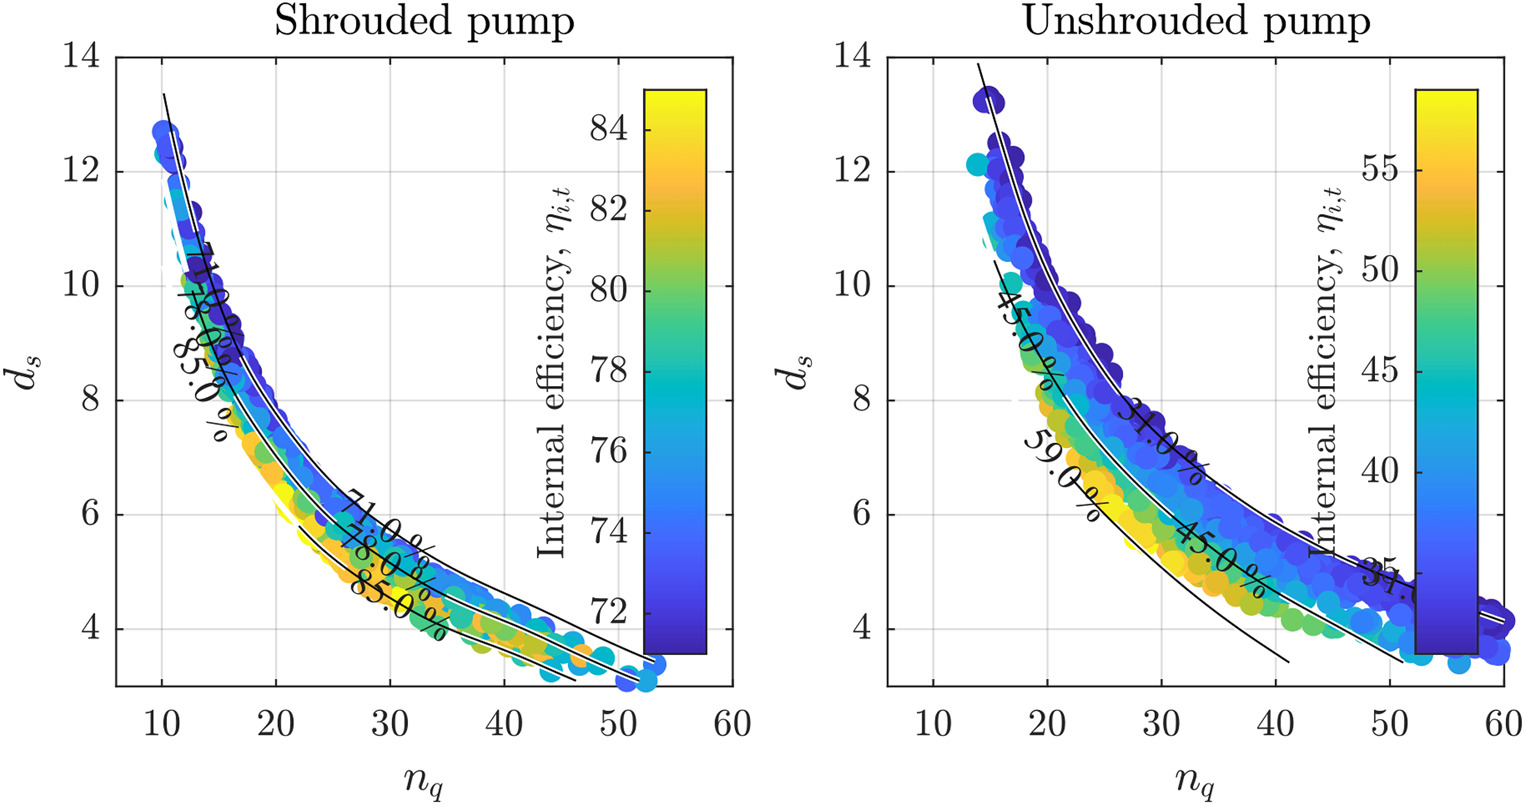
Regression models for shrouded (Equation 15) and unshrouded pumps (Equation 17) were developed to predict the pump efficiency as a function of nq and ds based on the contour lines. Equations 16 and 18 can be used to estimate the ideal impeller outlet diameter, leading to the maximum efficiency (Table 3).
Table 3.
Pre-design correlations.
| Geometry | Correlation | |
|---|---|---|
| Shrouded | (15) | |
| (16) | ||
| Unshrouded | (17) | |
| (18) |
The 1D modeling with neural networks
Zakeralhoseini and Schiffmann (2022a), (2023b) showed that the validity of current models for the effects of tip clearance is questionable for small-scale turbopumps and proposed neural network (NN)-based surrogate models to account for the influence of tip clearance and splitters on the slip factor and head loss coefficient of turbopumps. These models are trained on a wide range of design parameters using the CFD results, and are available in a data repository published by Zakeralhoseini and Schiffmann (2022b).
The slip factor model takes the tip clearance ratio, the number of blades,
Figure 4 presents an overview of how the new pre-design maps (0D models) and NN 1D models are linked for the design of centrifugal pumps. The process is started with the 0D model, which is based on principles of similarity. Figure 3 and (Equations 1 and 2) define relationships between specific numbers (nq and ds), head rise, and mass flow rate, guiding the determination of rotational speed (n) and impeller outlet diameter (d2) based on specified requirements. These initial design values are then used as inputs for mean-line calculations to derive geometrical parameters and velocity triangles at each station using equations provided in Table 2. The developed NN slip factor model replaces existing models (e.g., Gülich, 2010) to determine flow variables at the impeller outlet. Once geometrical parameters are established, the machine performance is assessed using the 1D model that incorporates empirical loss correlations (e.g., Gülich, 2010), including the tip clearance model proposed by Gülich (2010):
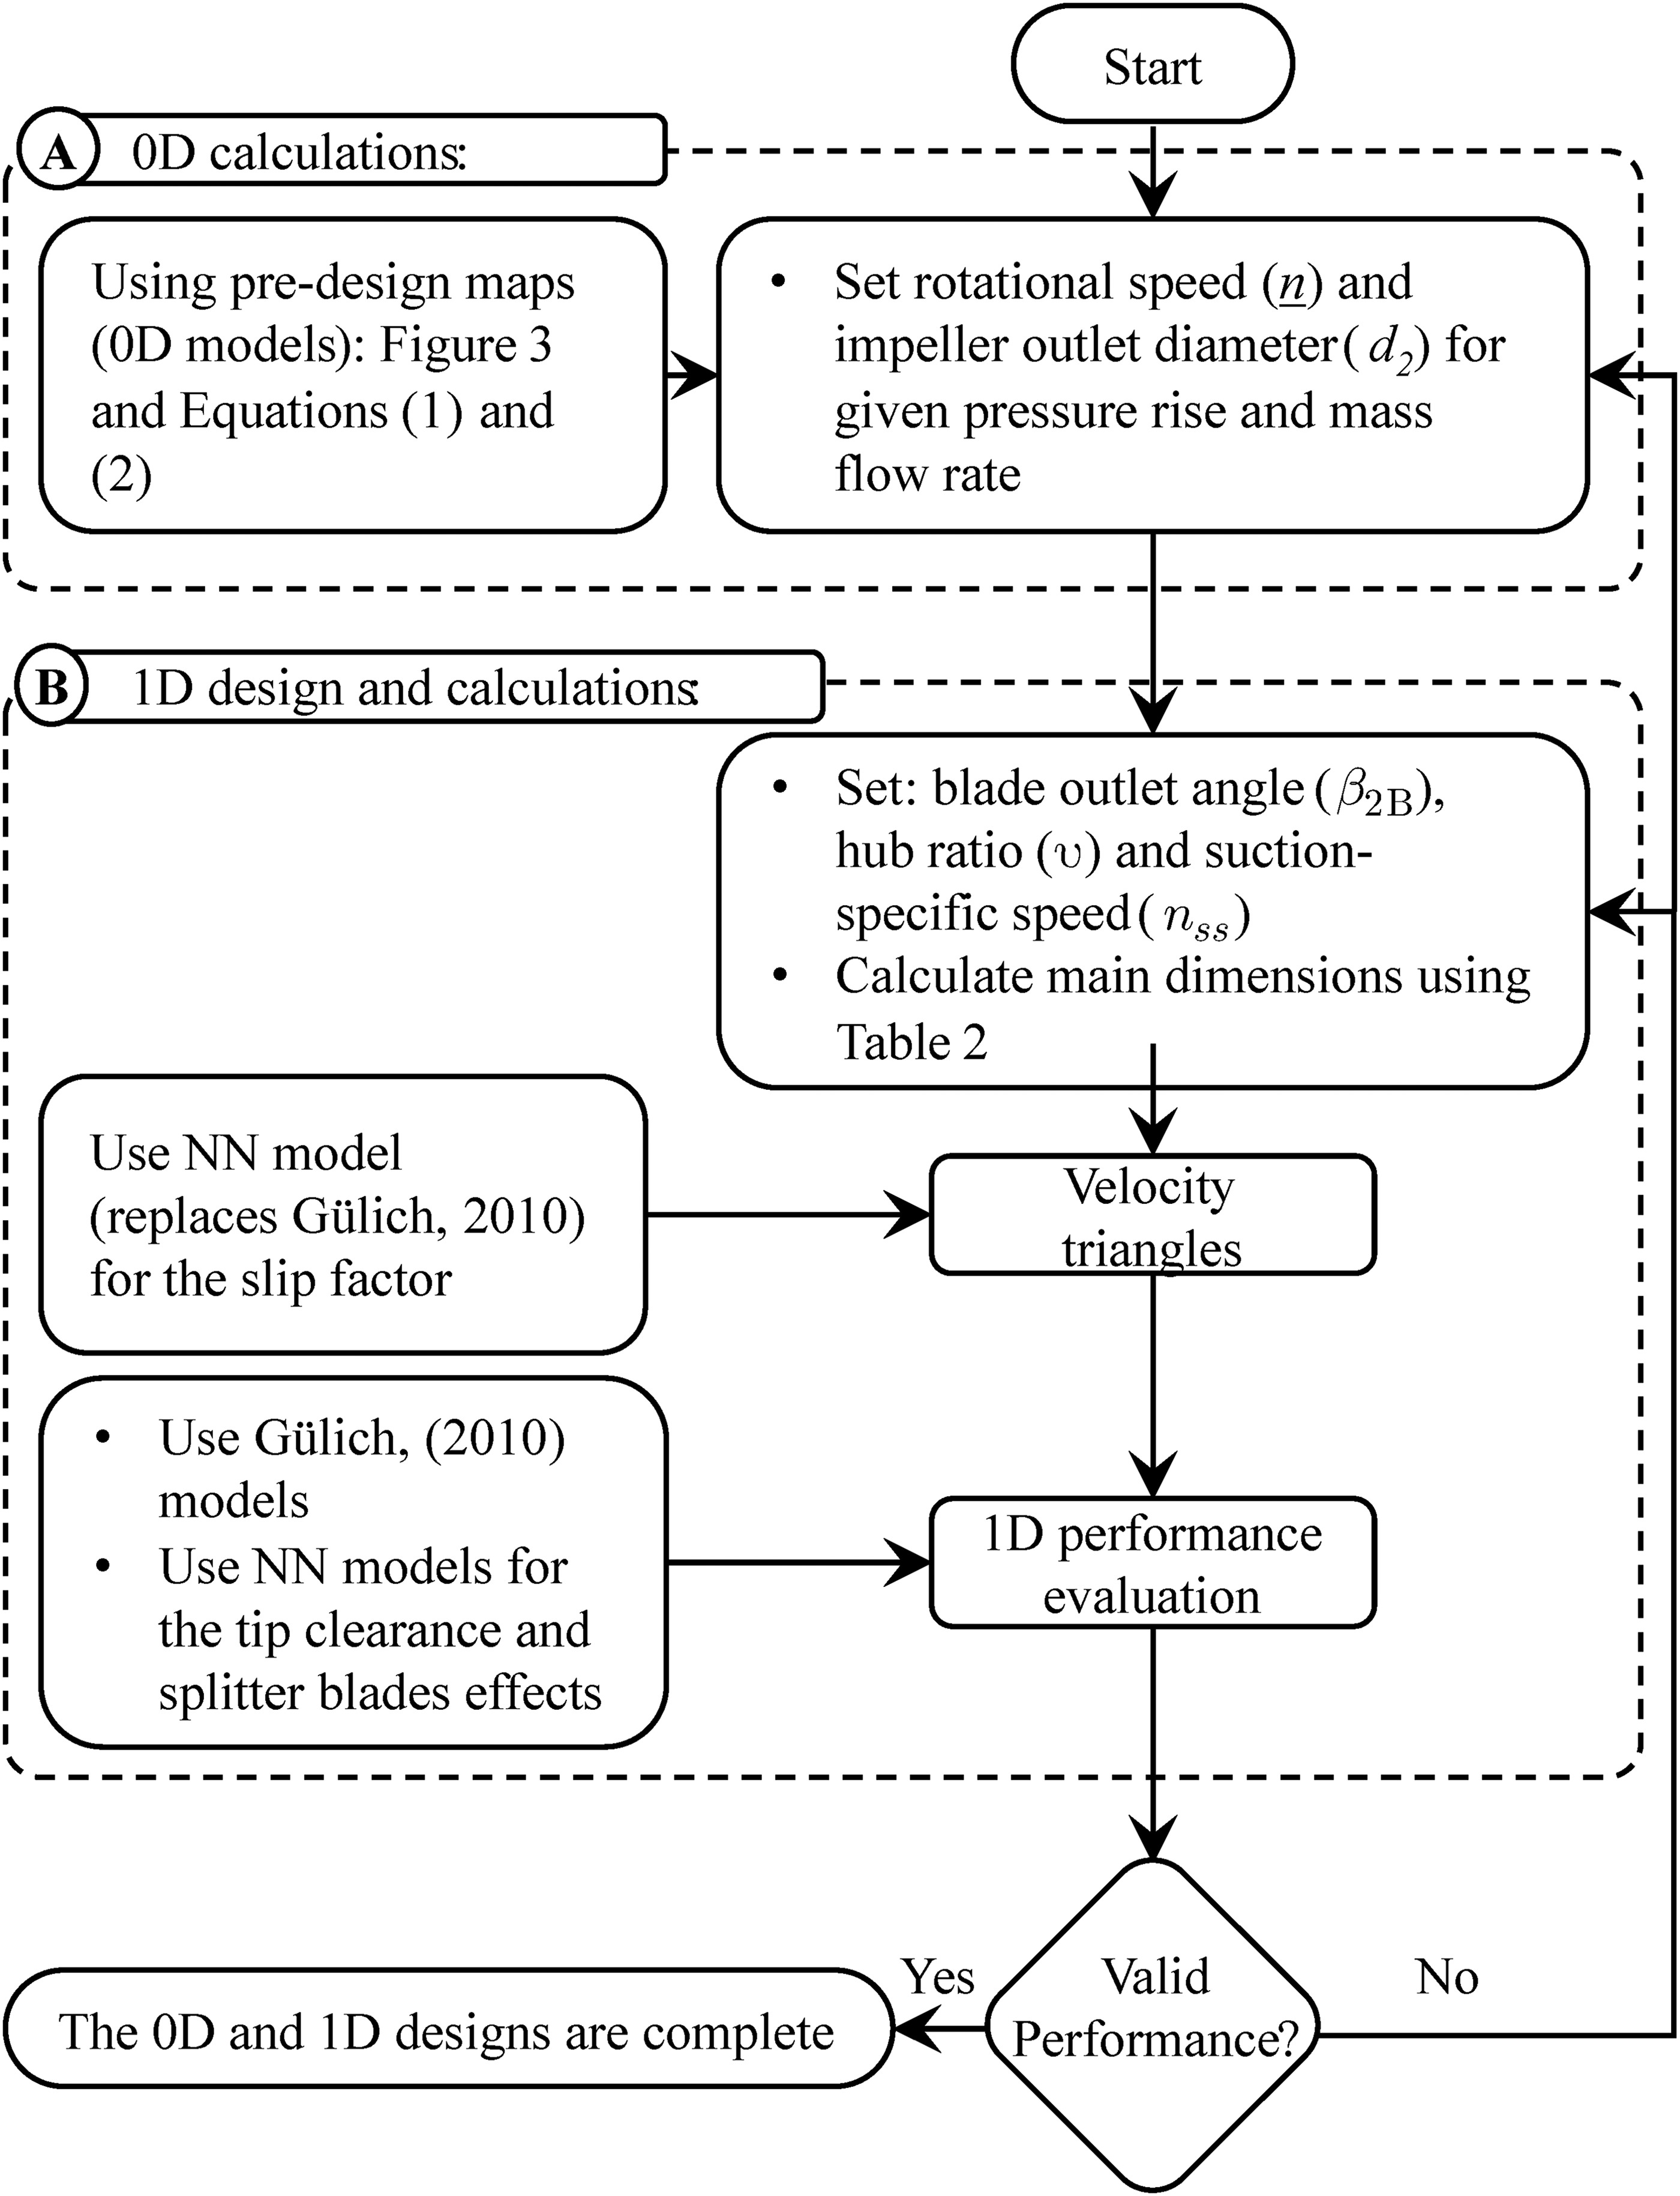
The developed NN models for tip clearance effects (Zakeralhoseini and Schiffmann, 2022a) and splitter blades (Zakeralhoseini and Schiffmann, 2023b), are integrated into the 1D models to predict pump head rise and efficiency. The design process can be used to iterate and refine the turbopump geometry to achieve specified performance criteria for given inputs.
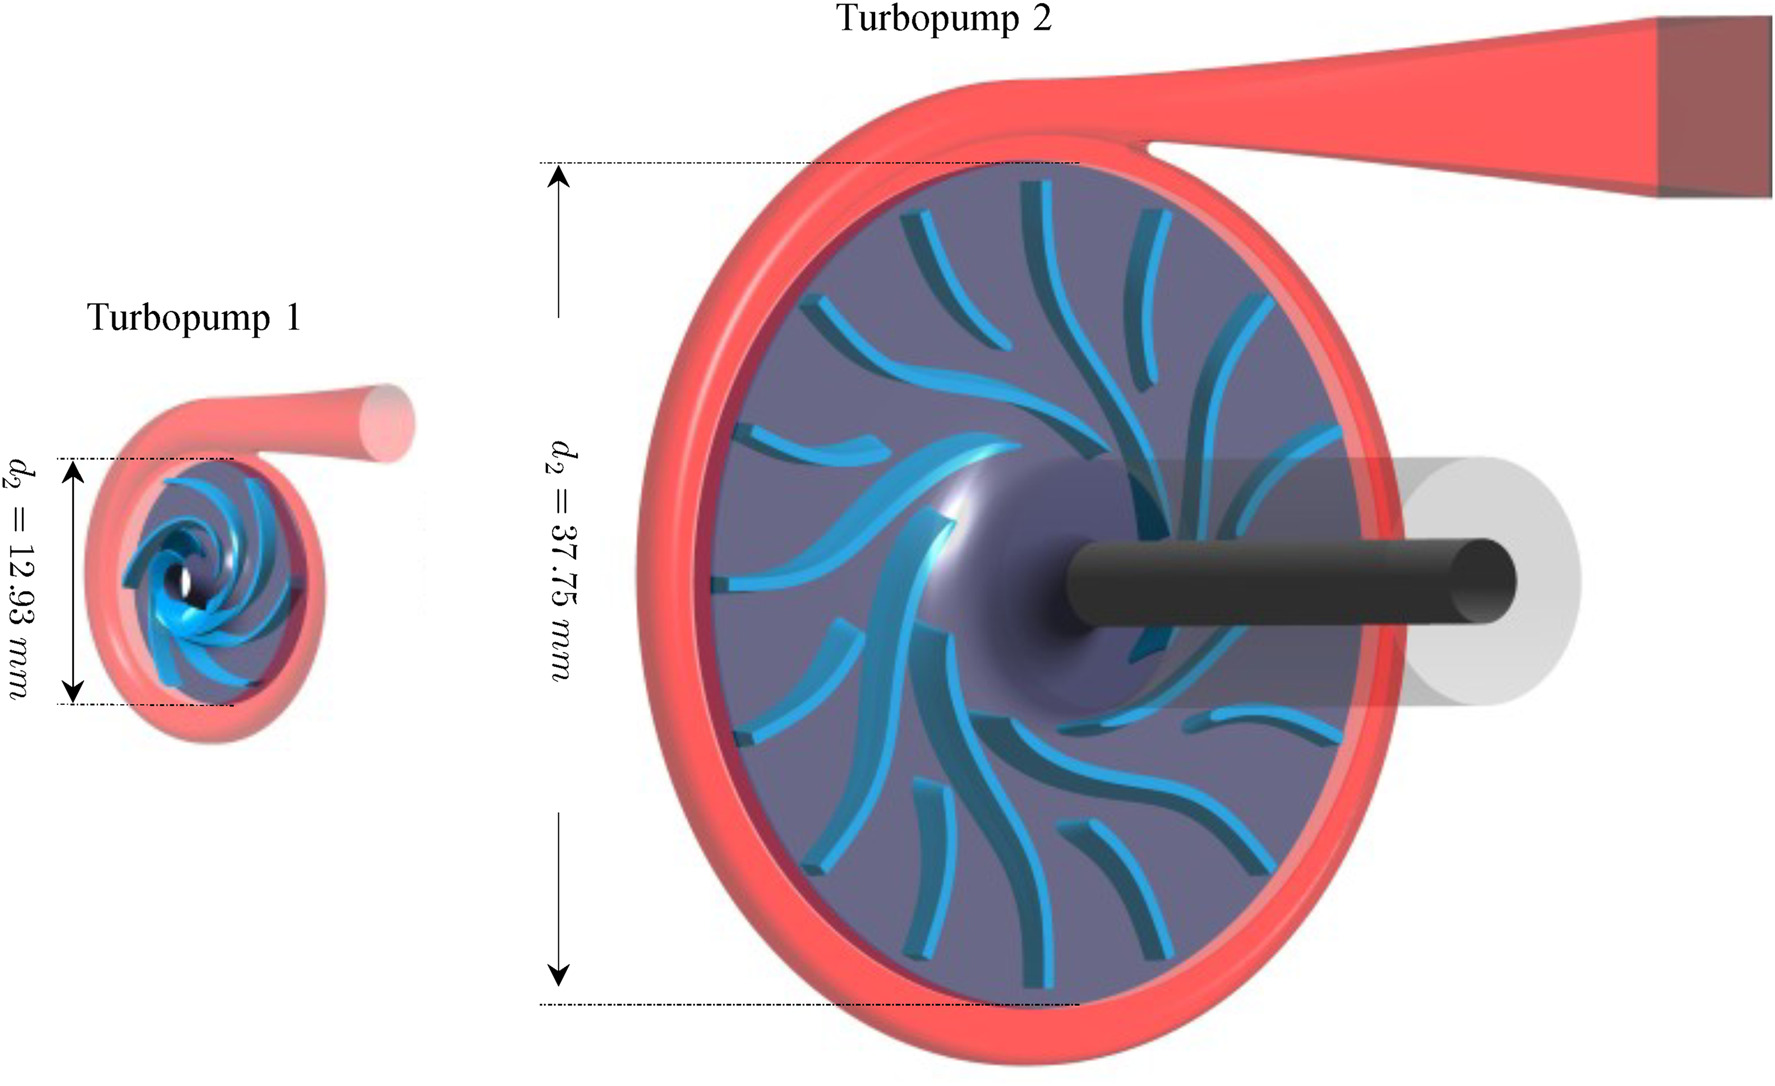
Experimental turbopumps and validation
Two turbopumps, sized for specific speeds of 8.9 and 28.5, are designed for experimental investigation using the same automated design tool and parameters detailed in Numerical procedure section. Two specific speeds are chosen to assess the models across two distinct machines. The specifications (pressure rise and mass flow rate) of turbopump 2 are specifically designed to meet the pumping requirements of the ORC developed and tested by Rosset et al. (2021). The specifications of turbopump 1 are selected to test the models at different non-dimensional numbers. Table 4 presents the specifications and dimensions of experimental turbopumps working with R134a. Since performance characteristics are evaluated in non-dimensional forms, R134a is chosen over R245fa for experimental investigation due to its availability in the laboratory and lower cost. This does not impact the results, as the tests are conducted within the same range of non-dimensional numbers for R134a as for R245fa. The designed tip clearance is 100 µm for both turbopumps, corresponding to 7% and 8% of the blade outlet width for turbopump 1 and turbopump 2, respectively. Although updated pre-design maps are generated for a tip clearance ratio of 5%, corresponding to 61.75 µm and 72.1 µm, the experimental tip clearance is maintained at 100 µm to ensure accurate measurement and facilitate precise assembly. For turbopump 1, the blade outlet angle and number of blades are set to β2B = 27.5° and 6, respectively, as recommended by Gülich (2010) to increase the efficiency of the machine. For turbopump 2, the blades are radially shaped (β2B = 90°) to increase the head rise for a given rotational speed and outlet diameter. Its impeller splitter blades, with a length equal to 55% of the main blades’ length, positioned in the middle of the adjacent main blades (see Figure 5) to further enhance the pressure rise, as recommended by Zakeralhoseini and Schiffmann (2023b). The volute spiral is built with rectangular cross-sections, following Lobanoff and Ross (2013) recommendation for low specific speed pumps to prevent excessively large cross-sections.
Table 4.
Main dimensions and operating conditions of the experimental turbopump.
Experimental analysis
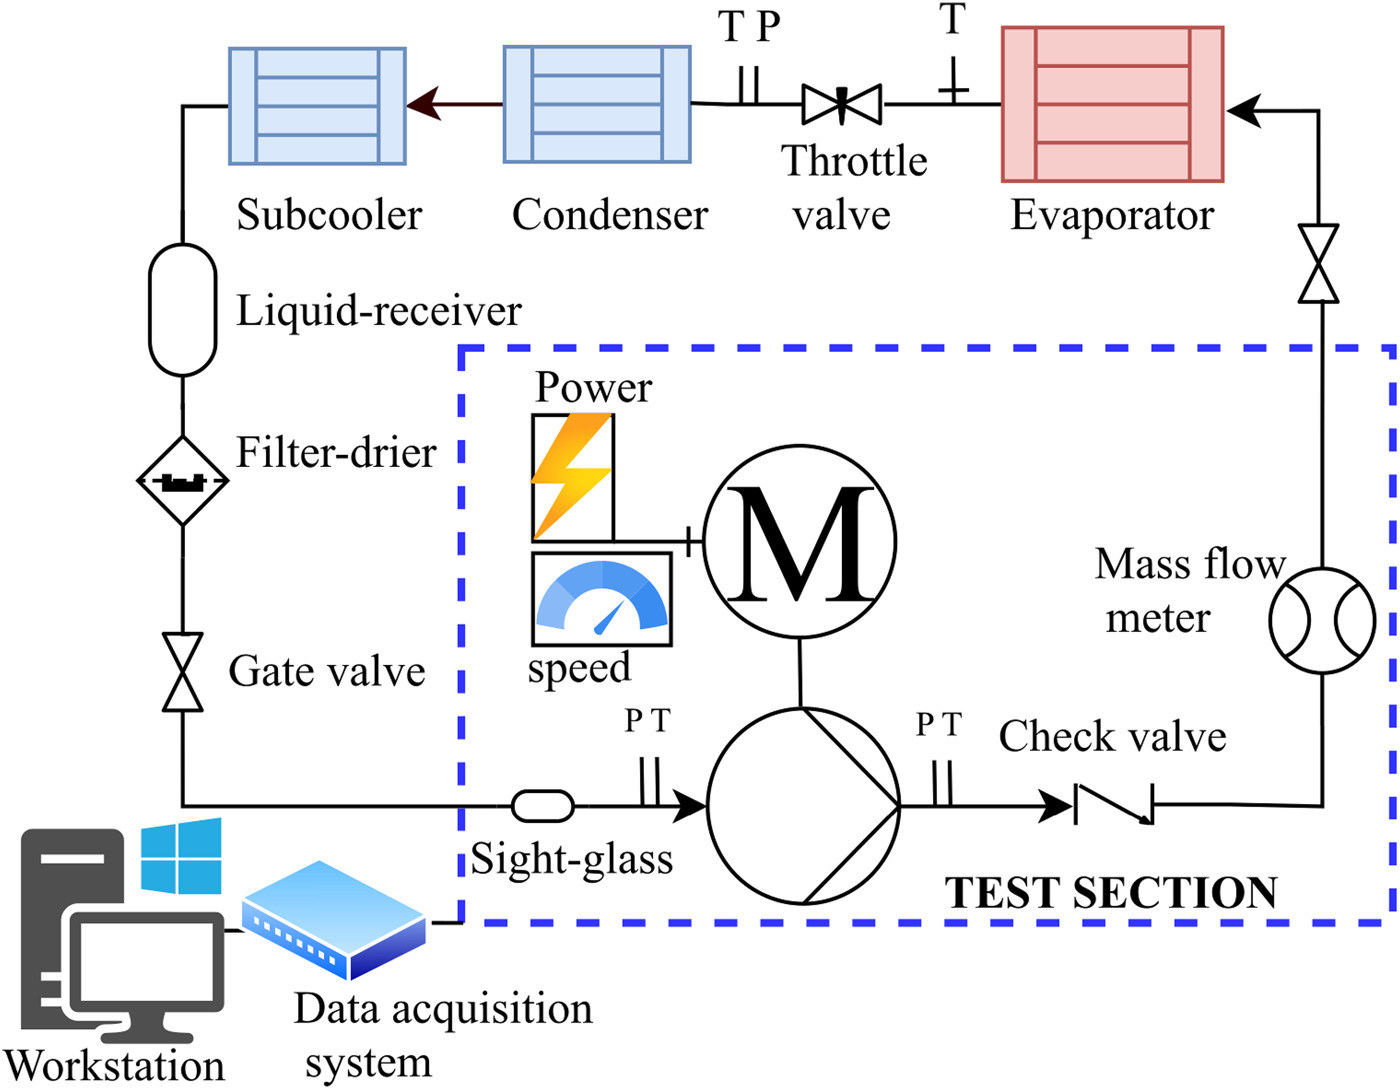
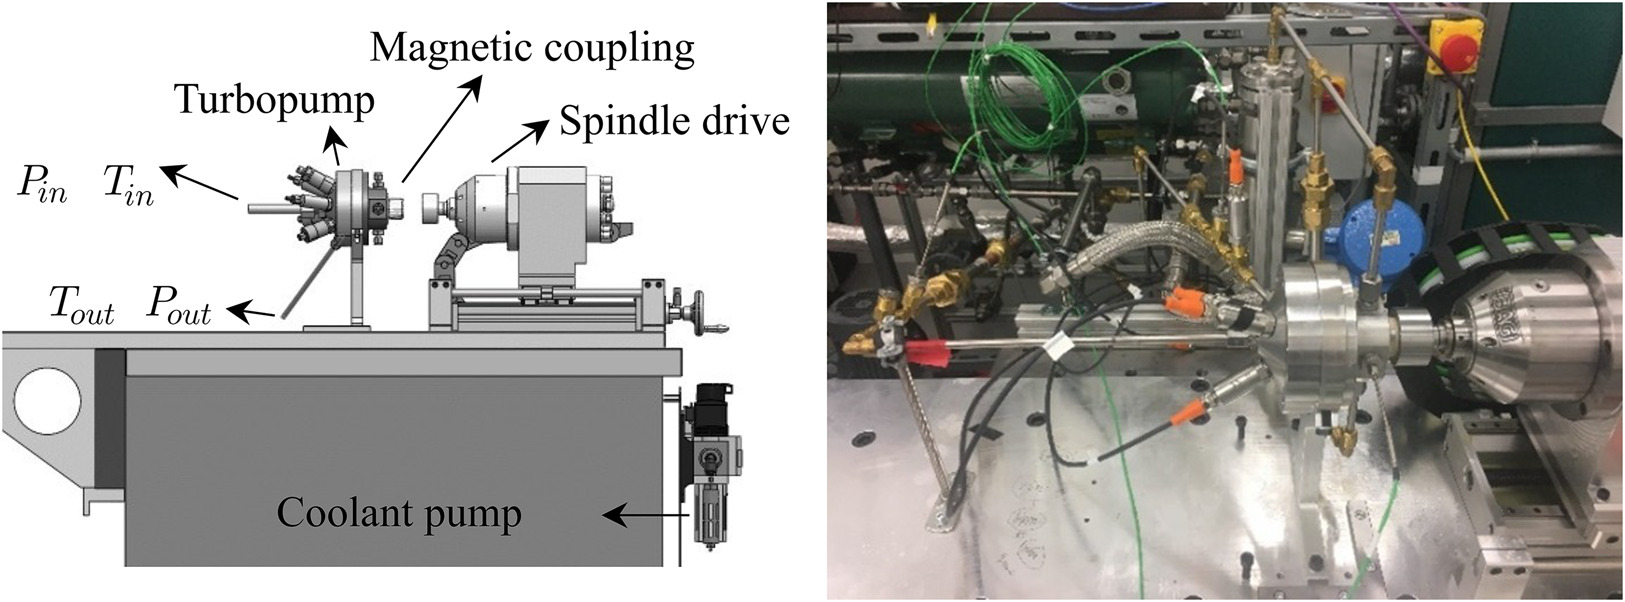
The test rig represented in Figure 6 consists of a pump test section, an expansion valve, a condenser, a sub-cooler, and an evaporator (Zakeralhoseini and Schiffmann, 2023a). The pump test section (see Figure 7) consists of the turbopump, the spindle drive, mass flow meters, and the pressure and temperature sensors at the pump inlet and discharge. Instruments are connected to a data acquisition system governed by LabVIEW. The test conditions are controlled by heating and cooling loads applied to the heat exchangers. The rotor speed is controlled by the spindle drive control unit. The electric spindle drives the hermetic turbopump through a magnetic coupling. Preloaded ball bearings support the rotor and are lubricated directly with the working fluid.
Data reduction method
The LabVIEW interface utilizes REFPROP (Lemmon et al., 2018) to assess the working fluid thermodynamic properties and post-process sensor data, with post-processing relations summarized in Table 5.
Table 5.
Post-processing equations of experimental data.
| Parameter | Equation | |
|---|---|---|
| Useful power given to the flow | (22) | |
| Total power given to the flow | (23) | |
| Internal efficiency | (24) | |
| Head coefficient | (25) | |
| Flow coefficient | (26) | |
| Back-work ratio | (27) | |
| Thermal efficiency | (28) |
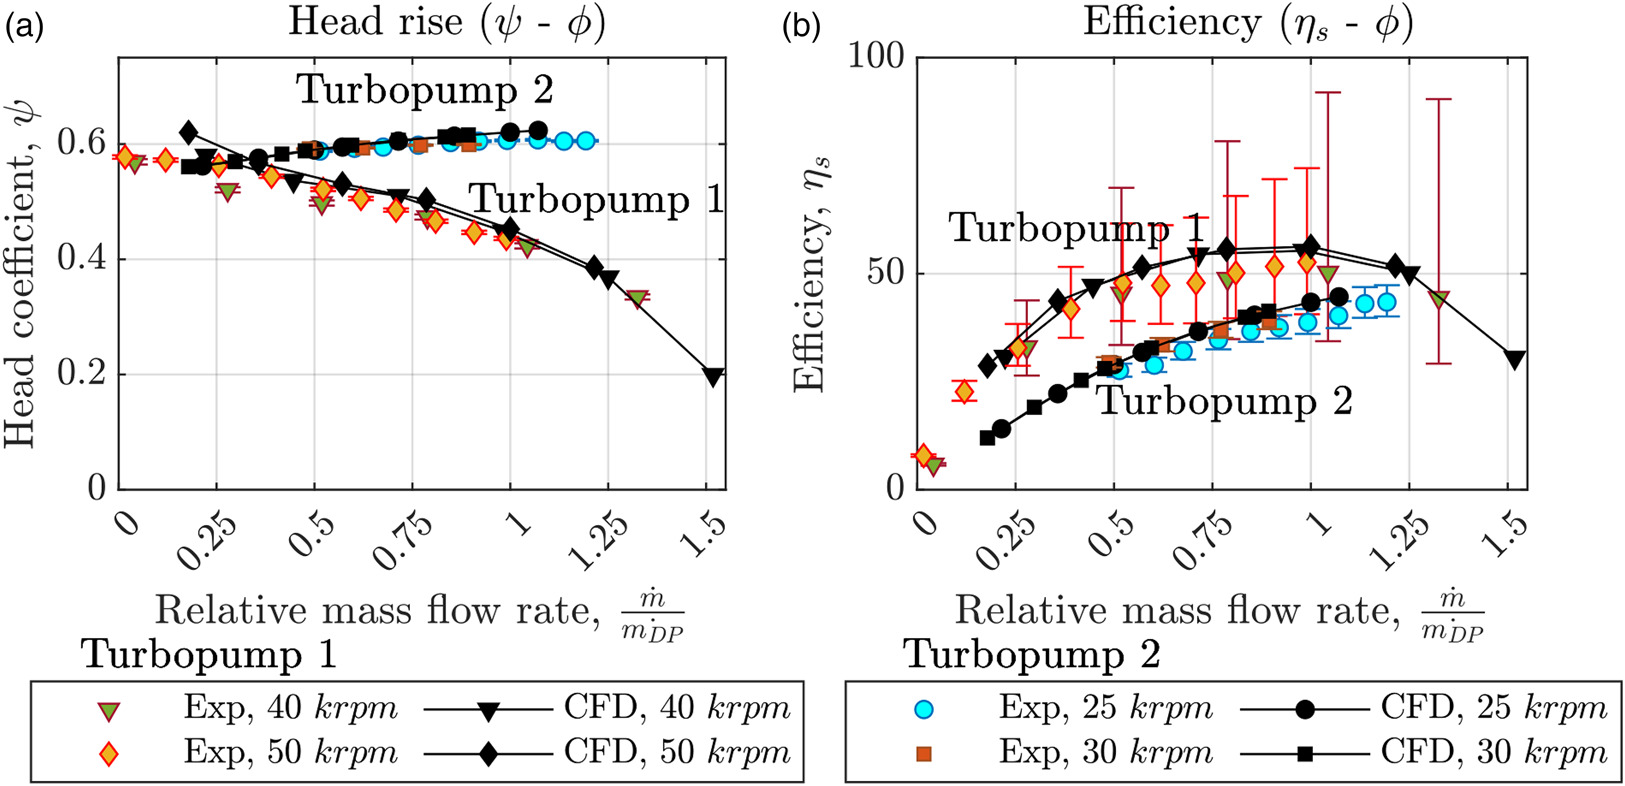
Characteristic curves of experimental turbopumps
Figure 8 presents the experimental and CFD-based head rise and efficiency curves for the two turbopump designs operated at different rotational speeds. The CFD analysis and experimental results exhibit a maximum deviation of 3.51% for the head coefficient and 11.5% on the efficiency, demonstrating the high accuracy of the CFD modeling approach, which has been used to generate the data for inferring the pre-design maps and update the loss correlations. Turbopump 2 with a
ORC performance characteristics
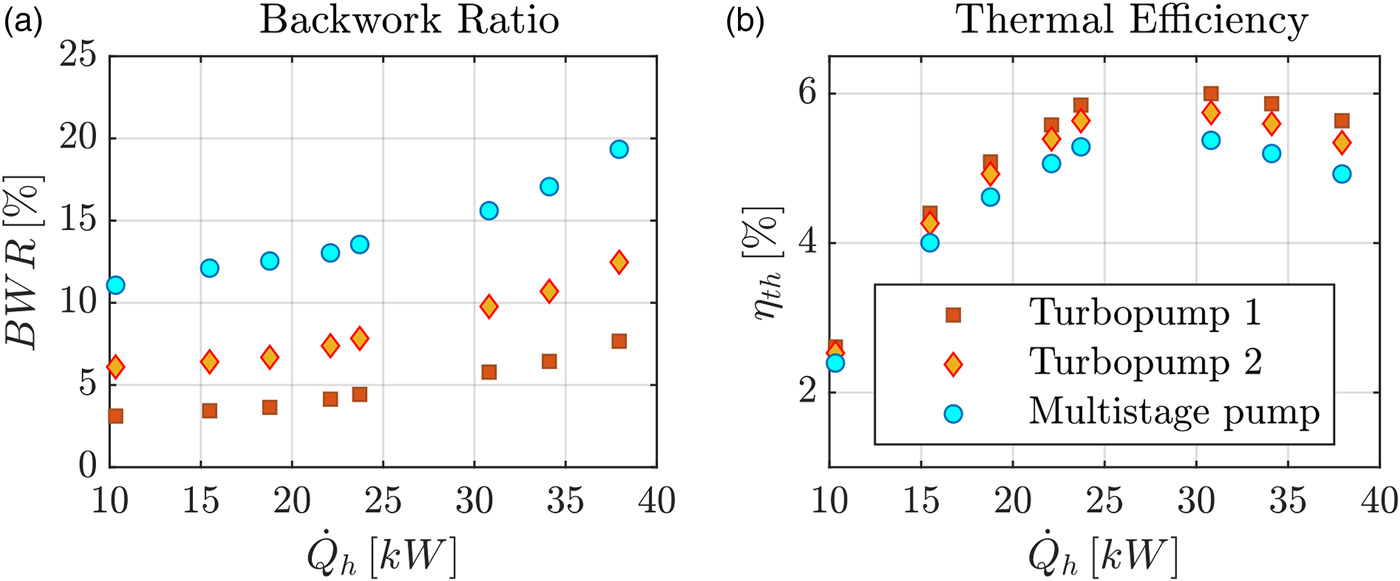
An existing ORC system designed for waste heat recovery from truck engines is used as a baseline to investigate the influence of the developed turbopumps on its performance. The system incorporates a small-scale, oil-free 8 kW radial inflow turbine supported on gas-lubricated bearings developed and tested by Rosset et al. (2021). Initially, the ORC system was driven by a 27-stage GRUNDFOS (CRNE 1–27) centrifugal pump with a maximum rotational speed of 3,000 rpm to achieve the required pressures. Excluding its drive, this commercial pump has a height of 716 mm and a volume of 51 L. In contrast, the tested small-scale turbopumps occupy only 3% of the commercial pump volume. Figure 9 compares the performance of the ORC system using the small-scale turbopumps with the original multi-stage centrifugal pump. The results suggest that the back-work ratio (BWR, see Equation 27) decreases up to 11.6 points and 6.8% points of the generator output power and is 67 and 42% lower for turbopumps 1 and 2, respectively, compared to the commercial pump. Moreover, the figure suggests that in addition to offering a much more compact solution (factor 33), using small-scale turbopumps can lead to a mean increase of 0.51% points in thermal efficiency.
Application of proposed models in the design of ORC turbopumps
The accuracy of the developed 0D and 1D models in predicting the impeller diameter is assessed and compared with state-ot-the-art models. Using a reverse approach, the models are employed to estimate the impeller diameter necessary to achieve the experimental pressure rise at design flow rate as summarized in Table 4. Equation 2 can be reformulated as (Equation 29) to estimate the impeller outlet diameter:
The initial impeller diameter is estimated through the utilization of the pre-design map, which offers an initial guess to start the design process (square symbol in Figure 10). Subsequently, the impeller diameter is modified through an iterative process using the 1D-model (black circle symbol in Figure 10) while maintaining a constant blade outlet angle to achieve the required pressure rise. To correct the impeller outlet diameter, the factor
where, H represents the specified head rise and
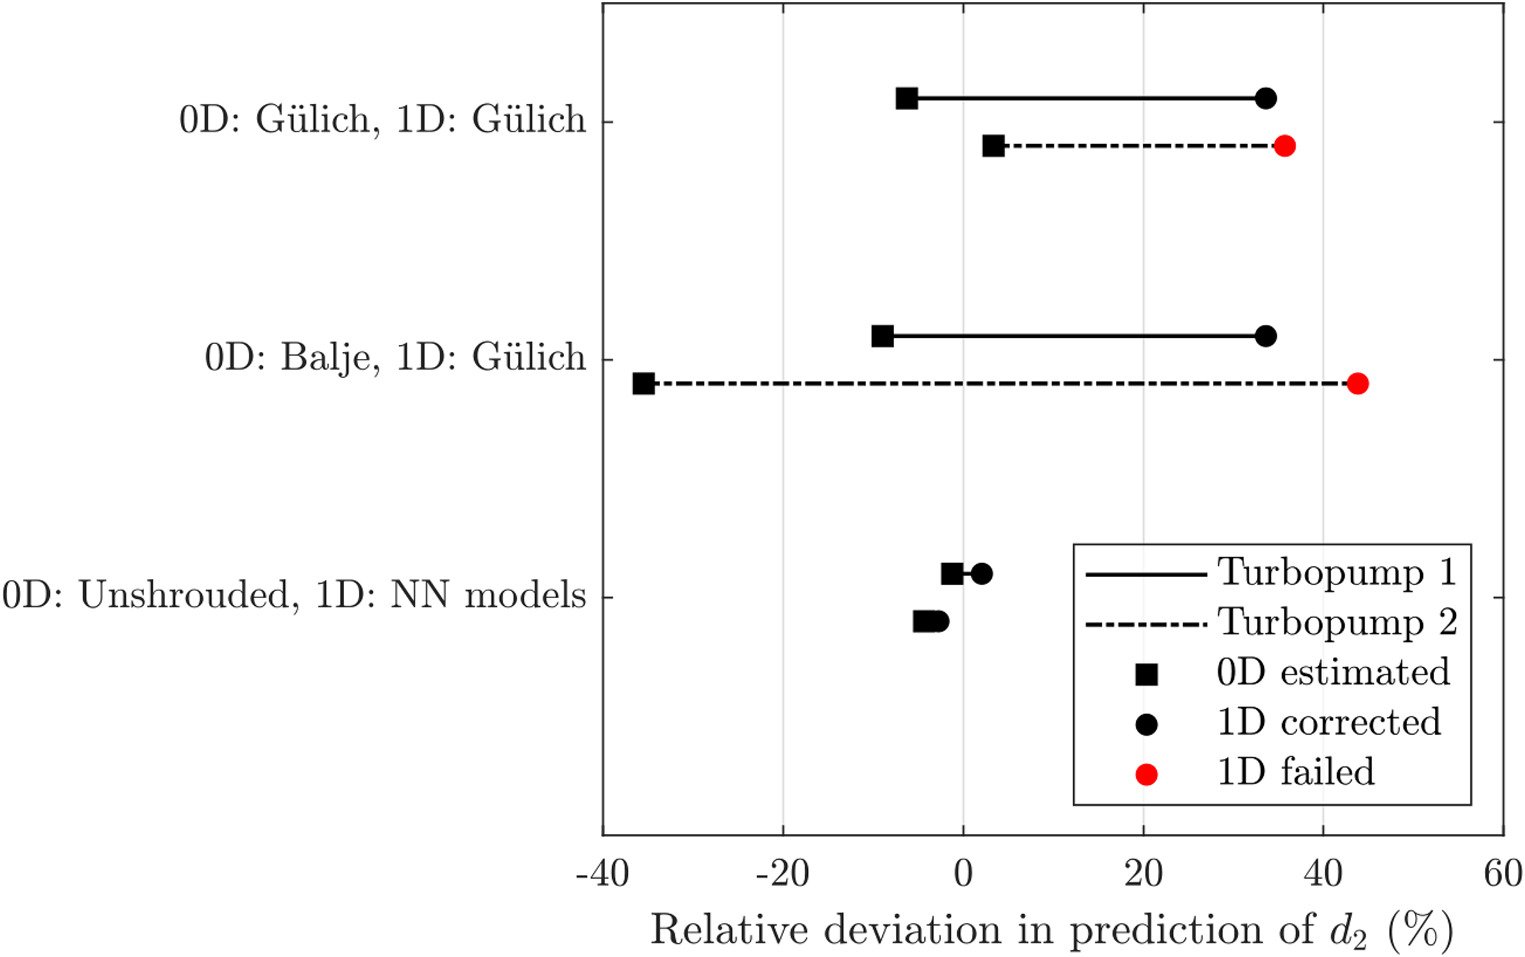
Figure 10 summarizes the estimated diameter deviations relative to the ones of the tested impellers, using state-of-the-art models and the ones introduced in this work. The square symbols represent the tip diameter estimated with Gülich (2010), Balje (1962), and the updated pre-design maps for shrouded and unshrouded designs. The circle symbols represent the impeller diameter obtained by applying correlations by Gülich (2010) and the updated 1D-models using the initial guess originating from the pre-design maps. The combinations of the used pre-design maps and the 1D-model are highlighted by the double label along the y-axis.
The comparison in Figure 10 suggests that, for both turbopumps, the unshrouded pre-design map presented in this work provides the most accurate estimate of the impeller diameter, followed by the Gülich (2010) model (Equation 3). The Balje (1981) diagram underpredicts the impeller diameter by 8.9% for turbopump 1, and by 35.5% for turbopump 2. When using the NN-based 1D-models (Zakeralhoseini and Schiffmann, 2022a, 2023b) for slip factor and tip clearance to correct the impeller diameter, the estimation deviation is only 3%. However, when using the models from Gülich (2010) for turbopump 1, the deviation is around 33.7%. For turbopump 2 (red circle symbol), the correction of impeller diameter does not converge when using the models from Gülich (2010) due to inaccuracies in predicting tip clearance losses, as discussed by Zakeralhoseini and Schiffmann (2022a), leading to negative head rise estimations.
Utilizing the models developed in this study is suggested to significantly reduce the design time of a turbopump, due to the much more accurate initial prediction of the impeller diameter. The impeller diameter necessary to meet the required pressure rise can be attained through a mere two iterations with the updated pre-design maps and 1D-model. In contrast, the Gülich (2010) models exhibit an initial impeller diameter deviation of over 33% and fail to converge for turbopump 2, which suggests that the latter is not feasible. Such imprecise estimation introduces substantial bias to the design and extends the number of design iterations in the CFD analysis stage. Notably, each CFD iteration takes a significant amount of time on today’s powerful computers, whereas the 1D calculations are executed almost instantaneously, highlighting the benefit of the updated pre-design maps and improved 1D models.
Conclusions
Small-scale single-stage turbopumps offer cost reduction in materials, simplified mechanical design, space efficiency, and fuel savings for driving ORC systems. To ensure that a turbopump is efficient and reliable and meets the specifications for its application, an iterative process is needed, which starts with simple pre-design maps and iteratively moves to 1D-meanline models and ends with 3D-CFD simulations to continuously refine the geometry. State-of-the-art models have been shown to fail for the design of turbopumps suited for small-scale ORC.
To address this shortcoming, a parameterized design model that allows for the automated design and CFD evaluation of turbopump geometries is developed to characterize the performance of numerous turbopump geometries for small-scale ORC applications. Based on this post-processed CFD-data, pre-design maps and 1D models, which have proven to be effective tools for designing pumps, are developed for small-scale ORC applications. The presented models can reduce the time and cost associated with the iterative design process.
The models’ validity is verified through experiments on small-scale turbopumps. The very small deviations observed between the CFD analyses and experimental results validate the numerical approach conducted on the small-scale turbopumps for ORC systems. Compared to a 27-stage commercial turbopump, the small-scale single stage turbopumps presented in this work are expected to improve the thermal efficiency of the ORC by 0.51% and decrease the BWR by up to 67%.
This study represents a significant step in developing compact and efficient turbopumps for ORC systems, which opens exciting avenues for future research. The updated nq–ds diagrams and the new 1D models obtained through data-driven approaches are validated against two experimental turbopumps with specific speeds of 8.9 and 28.5. Further experimental investigations are needed to explore additional small-scale turbopumps with different geometric features, to extend the validation of the pre-design maps at various specific speeds.
Nomenclature
b
channel width, m
c
tip clearance, m
absolute velocity, m s−1
d
diameter, m
ds
specific diameter
e
blade thickness, m
g
gravity, m s−2
H
head, m
enthalpy, J
m
meridional length, m
mass flow rates, kg s−1
n
rotational speed, rpm
specific speed
suction specific speed
total pressure, Pa
flow rate, m3 s−1
heat transfer rate, W
t
blade blockage factor
u
peripheral velocity, m s−1
Z
number of blades
relative velocity, m s−1
power, W