Introduction
In order to meet the requirement for reducing fuel burn of commercial aircraft engines, it has been important to achieve their higher overall efficiency and lower weight together. The overall efficiency of the engine can be gained by increasing propulsive efficiency, which can be realised by lowering exhaust jet velocity. Therefore, future aircraft engine fans are expected to have higher by-pass ratio and lower pressure ratio. This trend brings engine manufacturers new aerodynamic and structural design spaces. At the same time, it has been a potential fear that new aeromechanical phenomena emerge and restrict their operating ranges.
Flutter is an aeromechanical instability found in axial flow turbomachinery, which must be addressed during the development of aircraft engine fans. It is caused by the negative aerodynamic damping due to the coupling of blades’ vibration and motion-excited aerodynamic force, and generally occurs near the blades’ structural frequency, which is generally non-integer-multiples of the shaft speed (i.e., non-synchronous). For modern wide-chord fan blades, flutter often occurs in the stall-side of the fan operating map and restricts their operating range. This often becomes critical in part-speed conditions where the flutter boundary becomes closer to the engine work line on the ground.
Another blade vibration called Non-Synchronous Vibration (NSV) have been intensively studied so far in the front stages of compressors (Kielb et al., 2003; Espinal et al., 2018) and recently in Low Pressure Ratio (LPR) fans (Rodrigues et al., 2021). Although the terminology NSV contains some ambiguity because flutter is also categorized into “non-synchronous” vibration, in the context of turbomachinery aeromechanics, NSV often incorporates with specific flow unsteadiness like flow separation (Sanders, 2005), tip clearance flow (Drolet et al., 2013) or acoustic resonance (Fiquet et al., 2022).
During rig tests, NSV pronounces coherent signals of blades’ vibration and pressure disturbance, like flutter. Flutter and NSV is sometimes hard to distinguish however, recent detailed experimental studies have revealed that NSV incorporates with the convective vortex shedding near the tip region, and the vortex shedding locked into the frequency and spatial pattern of the blades’ deflection and impinged to the neighbouring blades (Brandstetter et al., 2018). Based on this observation, a new analytical model for NSV is proposed by Stapelfeldt and Brandstetter (2020). They successfully reproduced the lock-in phenomenon by the developed model and concluded that the NSV with vortex shedding is convection-dominant. Also, a new terminology “convective NSV” is proposed to distinguish it from other types of NSV.
Under such recent progress in the NSV research, IHI also have experienced strong second flexure (2F) mode vibration near stall conditions during rig tests of a LPR fan. Because few reports exist for fan flutter in the 2F mode and the signals during vibration has somewhat different characteristics than well-known fan stall flutter, the authors have begun to suspect that the 2F vibration is close to NSV under separated flow near stall. This 2F mode vibration is the main focus in this paper and referred to as “2F NSV” hereafter for simplicity.
The objective of this paper is to assess the excitation mechanism of the observed 2F NSV by unsteady flow near stall using detailed aeromechanical simulations. After highlighting the difference of 1F flutter and 2F NSV observed in our rig tests, numerical methods are briefly explained. In order to quantify the flow structure during blade vibration, post processing technique by time-space Fourier transformation is specially developed. The time evolution of aerodynamic damping and unsteady flow structure are carefully evaluated by transient simulations with different blade amplitude. Finally the mechanism of the present 2F NSV and possible coincidence of unsteady flow and blade vibration are discussed.
Excitation of 2F mode in a LPR fan rigy
The case studied in this paper is an IHI LPR fan test rig, which is specially developed for aeroelastic assessments in future high by-pass engine fans. Figure 1 summarizes the overview of the rig and stability limits experienced during tests. The fan shown in Figure 1a has 20 rotor blades and 48 exit guide vanes, which is mounted on the test facility in Japan Aerospace eXploration Agency (JAXA). The fan is connected with a plenum chamber upstream and a scroll exhaust downstream. The overview of the test facility and our past related work is reported by Hayashi et al. (2019).
Figure 1.
IHI LPR fan test rig and stability limit. (a) Rig overview (b)2F modeshape (c) 1F flutter and 2F NSV regions.
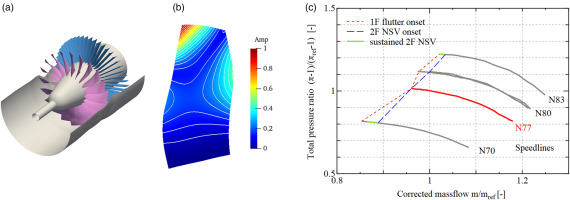
The rotor is manufactured as a blisk made of titanium alloy. The disk is designed to be stiff enough, therefore the structural coupling between the blades are negligible. Also, the mistuning level identified by the standard deviation of natural frequency is below 0.5% for both 1F and 2F modes. This level is sufficiently small, and the flutter onset point is expected to be almost unchanged according to our past flutter evaluation (Tateishi et al., 2016). Figure 1b shows the 2F modeshape expected on the 77% shaft speed. The nodal line exists from the midspan of the leading edge toward the tip trailing edge. The highest displacement exists at the tip leading edge.
Figure 1c summarizes the excitation onset and stress limit points observed in the test. Both the first flexure (1F) flutter and 2F NSV were observed on four speedlines from N77 to N83. The onset points indicates where the vibratory stress level suddenly increased, while the all speed lines ends when the stress reaches the pre-set limits for safety. It can be seen that the 2F NSV tends to arise prior to the 1F flutter. On the N70 and N83 speedlines, the 2F NSV was moderate enough to continue the test. On the other hand, on the N77 and N80 speedlines, the 2F excitation was strong enough to immediately stop the test. On the N77 speedline the 2F NSV occurred at the same time with the 1F flutter. For N80 speedlines, different stability limits were obtained from different runs. In the first and second tests, 1F and 2F excitations occurred respectively, where the onset point of 2F NSV had higher massflow than the 1F onset. From these data, it can be said that the 2F NSV can limit the fan operability severer than the 1F flutter.
The difference between the 1F flutter and 2F NSV can be seen from the spectra of unsteady pressure during excitation which is shown in Figure 2. These spectra are observed by a flash-mounted unsteady pressure transducer on the shroud located at approximately one axial chord upstream from the rotor leading edge. Because of the distance between the blade and transducer, it is anticipated that the pressure signal is mainly form composed of the acoustic wave generated by the blades’ motion. The blades’ vibration is monitored by both strain gauges and tip-timing system however, it is not presented in detail for clarity.
Figure 2.
Difference in unsteady pressure signals between 1F flutter and 2F NSV. (a) 1F-ND1 Flutter (N80 speed) (b) 2F NSV (N77 speed).

On the stationary frame of reference, the frequency of pressure fluctuation generated by the rotor vibration can be obtained as follows, considering the frequency shift due to the change of reference frame and circumferential vibration pattern (i.e., nodal diameter).
Two results are presented for N80 and N77 speedlines, where the structural frequencies for 1F and 2F modes are 1.55 and 4.11, respectively. The response during 1F excitation in Figure 2a, only the peak of 2.55EO is significant, which is generated by 1F-ND1 Forward Traveling Wave (FTW). On the other hand, the response during 2F NSV shows multiple peaks from 6.10 to 10.11EO with the interval of 1EO, which means that multiple FTWs from ND2 to ND6 are simultaneously excited. Among these NDs, the highest peak at 8.11EO corresponding to ND4 is thought to be the primal component of the 2F NSV. This significant excitation of multiple NDs is one of notable differences which distinguishes the 2F NSV from 1F flutter with a few dominant low nodal diameters. At the same time, the difference poses several questions on 2F NSV.
In order to answer these questions, detailed aeromechanics simulations are conducted.Methodologies
Target speedline and blade vibration patterns
The N77 speedline in Figure 1c is chosen as a target case in this paper, because the 2F onset point was close to the work line and the stress level at the onset was high enough to immediately stop the test. According to literature, the unsteady flow pattern like vortex shedding can be affected by the blade vibration amplitude. Furthermore, the frequency and spatial pattern of unsteady flow can synchronize with the blades’ vibration pattern under large blade amplitude (i.e., lock-in).
Therefore, the change in flow phenomenon and possibility of excitation are assessed by obtaining aerodynamic damping over wide range of blade amplitude. The interaction between the blade motion and unsteady flow is considered by one-way manner, where the blade motion (e.g., frequency, nodal diameter, modeshape, and amplitude) is kept constant during the simulations. The targeted blade vibration pattern is ND4, which was thought to be the primal component of the observed 2F NSV, because the frequency of the highest pressure amplitude during NSV corresponds to ND4 according to Figure 2b. Three test cases are prepared with maximum 2F mode amplitude of 0.3%c, 1.2%c, and 4.8%c. The blades’ structural frequency is 4.3EO, which is obtained from the FEM analysis result. Here, the 0.3%c and 4.8%c amplitudes correspond to a typical value for flutter simulations and the pre-set limit for the 2F mode response in the rig test (i.e., scope limit), respectively. Therefore, the 4.8%c amplitude represents the maximum blade amplitude experienced in the rig test.
Numerical method and aerodynamic damping evaluation
The CFD code UPACS Vibrate, originally developed by JAXA (Yamane et al., 2001), is employed for the present simulations. It is based on three-dimensional Unsteady Reynolds Averaged Navier-Stokes (URANS) equations with arbitrary Lagrangian-Eulerian formulation. The equations are discretized by the finite volume method on multi-block structured grids. The blades’ motion is explicitly applied by the moving grid module. The Spalart-Allmaras one-equation model is employed to estimate the eddy viscosity. Similar numerical setups have been successfully applied for our flutter (Aotsuka and Murooka, 2014) and forced response evaluations (Aotsuka et al., 2012).
The aerodynamic damping is evaluated by the work-per-cycle principle. When the aerodynamic damping turns from positive into negative, the blades’ vibration becomes unstable, and its amplitude grows exponentially. The structural modeshape is extracted from the FEM analysis result and mapped onto the CFD grid. Under harmonic prescribed motion of the blade surface, the aerodynamic work and resulting aerodynamic damping can be obtained as follows.
Here,
Data processing for unsteady flowfield
In order to assess the frequency and spatial pattern of the unsteady flow which will arise at near-stall conditions, the space-time Fourier transformation is applied to the unsteady signal sampled during unsteady simulations. Figure 3 illustrates the strategy of data sampling and processing in this study. The unsteady sampling is done along a circumferential line
Then, for each sampling time, the Fourier transformation is applied in the circumferential direction. This operation analyses the components of sinusoidal spatial modes existing at each time instance. Plotting the amplitude of each circumferential mode number m along with time t, the time-mode diagram is obtained like the centre of Figure 3. When the signal has multiple closely separated modes, the diagram looks dispersed like around the time
Finally, in order to identify the frequency
Settings for unsteady simulation and data sampling
The computational model is a full-annulus configuration shown in Figure 1a. The number of grid points for the rotor and stator are 2.21 and 1.06 million per passage respectively, yielding 93 million points in total. This size is determined by preliminary grid study. The time steps per one blade oscillation is 2,200, corresponds to 9,460 steps per shaft revolution.
The sampling station used for the discussion is located at 95% span height, 10%c_x downstream from the rotor trailing edge. The number of sampling points in the circumferential direction is 720, resulting to the pitch of 0.5 degrees and 36 points in a blade-to-blade passage. The sampling frequency is 110 per one 2F oscillation and approximately 480 per shaft revolution, resulting the Nyquist frequency of 240EO, which is well above the range of interest. The frequency resolution in time-domain Fourier transformation is approximately 0.36EO, obtained from the timespan of 12 cycles of 2F oscillation.
Results and discussion
Flow characteristics without blade vibration
Before the aeroelastic assessment, the fan aerodynamic characteristics are obtained without blade vibration and compared with corresponding rig test results. Both steady and unsteady simulations are conducted in order to identify the operating point where the flow unsteadiness appears.
Figure 4 shows the comparisons of rotor speedlines (a) and spanwise distributions of normalized total pressure at the leading edge of exit guide vanes (b). The rig test data are evaluated from time-averaged total temperature and total pressure measured by the Kiel probe heads instrumented on the leading edges of the fan exit guide vanes, while the numerical results are obtained from the mass flow average of the instantaneous flow fields. The operating conditions are labelled as A to E, as the massflow decreases. The simulations slightly overpredicts the total pressure rise however, the global trend well agrees with the rig test. The stability limit in the experiment corresponds to the onset point of 2F NSV. On the other hand, in the CFD results, the stability limit is determined by the last converged point with gradually increasing outlet static pressure. The steady simulation fails to converge near the rig stability limit of
Figure 4.
Steady aerodynamic performance and validation with experimental data. (a) 77% speedline (b) Spanwise total pressure distributions.
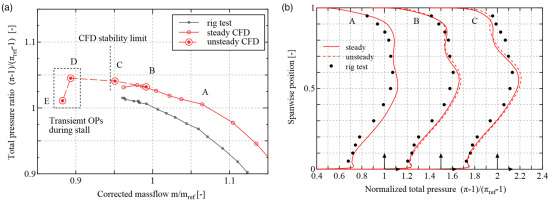
From Figure 4b, it can be seen that the total pressure near shroud significantly increased in the test between the OP B and C. This behaviour is qualitatively appeared in the simulations. The difference between steady and unsteady simulations can also be observed, especially for the OP C. The distribution from unsteady simulation shows more wiggled pattern over 80% span height, which implies the difference of flow behaviour between steady and unsteady results near the shroud.
The difference in the flow patterns near the shroud the blade surface are compared in Figure 5. These results are from unsteady simulations. The entropy contour is used to show the flow pattern near shroud. Also, axially reversed flow area is indicated by dark blue region on the blade surface. The flow structure near the tip is significantly different among the operating points. On the OP B, high entropy area starts near the leading edge and travels toward downstream. This high entropy area is originated both from tip clearance flow and radially migrated separated flow on the blade suction side, which can be confirmed from the streamline on the blade surface.
Figure 5.
Flow structures toward stall. Left: entropy contour at 98% span. Right: streamline on the blade suction surface, with axially reversed flow area indicated by dark blue. (a) OP B (b) OP C (c) OP D.

This high entropy area looks stable on OP B however, it becomes unstable and forms shedding-like discrete patterns near the tip on OP C. Also, it is seen from the blade surface streamline that the axially reversed area exists on the leading edge near the shroud. The flow instability further develops as the operating point moves from OP C to OP D. Comparing Figures 5c with 5b, it is observed that the high-entropy region starts impinging to the neighbouring blades during stall. Corresponding snapshot of the streamline on the suction side shows that the flow is separated and axially reversed at the leading edge for all span height, and the separated flow accumulated near the tip. This growth of separation can be the factor for the change of unsteadiness near the shroud.
Aerodynamic damping evaluation: transient simulation toward stall
The aerodynamic damping of the 2F mode is evaluated for three different amplitudes. In order to identify the relationship between the unsteady flow and aerodynamic damping characteristics, it would be necessary to evaluate at least on three operating conditions shown in Figure 5. However, our preliminary evaluation showed that the aerodynamic damping for 2F-ND4 was positive until OP C. Also, during the evaluation of aerodynamic damping, the flow could not converge into time-periodic state on OP D, because this was an unstable condition during stall. Therefore, transient simulations are planned to evaluate the aerodynamic damping from OP C. The simulations are initiated from OP C by rising the outlet static pressure by 0.5% to initiate stall. The instantaneous operating points and aerodynamic damping over each blade oscillation cycle are monitored during the transient simulations.
Figure 6a shows the history of operating points and for three blade amplitudes: 0.3%c, 1.2%c, and 4.8%c. The symbols in transient results indicate the operating points of each blade oscillation. The massflow decreases as time advances, and therefore the operating condition moves from right to left on the characteristic map. All the transient results qualitatively agree with the speedline without blade vibration, shown by the pink lines.
Figure 6.
Time histories in transient simulations evaluated for each oscillation cycles. (a) Operating conditions (b) Aerodynamic damping.
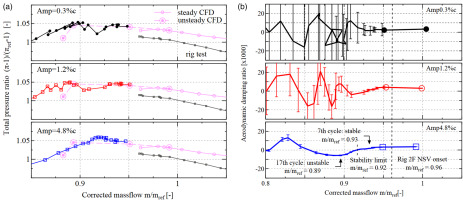
Figure 6b summarizes the history of aerodynamic damping, which is evaluated for each blade oscillation cycles. Large symbols represent the results of the stable operating points, and the transient results are shown by the vertical bars. Again, the massflow decreases as time passes. The width of bars indicates the standard deviation of aerodynamic damping evaluated for each blade, which means the circumferential variation of aerodynamic damping. For lower amplitude cases of 0.3%c and 1.2%c, it can be seen that the 2F-ND4 becomes unstable as the massflow decreases, but the mean damping frequently switches between the positive and negative values, and the variation of damping is very high. On the other hand, the largest amplitude case of 4.8%, the variation of aerodynamic damping is significantly smaller than the other two cases. In addition, the range of massflow which shows negative damping can be clearly identified. From these results, it can be anticipated that the interaction of unsteady flow and blade vibration changes as the blade amplitude increases.
For the largest amplitude of 4.8%, the instability onset massflow is slightly under-predicted (rig 2F onset:
Figure 7 presents local aerodynamic damping and unsteady pressure amplitude synchronizes with 2F-ND4. Here, the aerodynamic damping for the 6th and 17th cycles are positive and negative, respectively. By comparing the local aerodynamic damping between the 6th cycle (a) and 17th cycle (b), it can be clearly seen that the leading edge of the pressure side turns from positive to strong negative damping. At the same time, the unsteady pressure amplitude significantly increases where the damping contribution turns negative. This position corresponds where the high-entropy fluid start to interact with the neighbouring blade, as discussed in Figures 5b and 5c. Therefore, the instability of 2F-ND4 is expected to be closely related to the well-developed unsteady flow near the shroud.
Unsteady flow patterns and relation with blade excitation
In order to confirm the consistency of the unsteady flow pattern and the resulting excited nodal diameter, the time development of circumferential modes are analysed by the space-time diagram and time-mode diagram, as explained in Figure 3. Figure 8 shows the time-space and resulting time-mode diagrams obtained from the 2F amplitudes of 1.2 and 4.8%. Axial velocity is chosen to evaluate the flow instability, because its variation corresponds to flow disturbances due to vortex shedding.
Figure 8.
Evolution of flow unsteadiness (axial velocity, 10%Cx from TE at 95% span). (a) time-space diagram, amp = 1.2%c (b) time-space diagram, amp = 4.8%c (c) circumferential modes, amp = 1.2%c (d) circumferential modes, amp = 4.8%c.
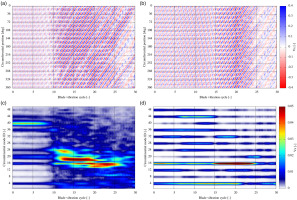
The effect of blade amplitude can be clearly seen by comparing the 1.2%c and 4.8%c cases. In the time-space diagram of the 1.2% amplitude case in Figure 8a, relatively large-scale fluctuation emerges from around the 10th blade cycles. Then the size of pattern gradually becomes larger until 20th cycles, and suddenly grows again around the 25th cycles. The fluctuation pattern is not completely uniform in the circumferential direction. The flow fluctuation in 1.2%c contains multiple circumferential modes as presented in Figure 8c. From the 0th to 10th cycles, the mode number of 40 is dominant. Then, after the 10th cycle, the modes from 12 to 24 are suddenly appeared. These lower modes correspond to the change in flow pattern in Figures 5b and 5c.
In the largest amplitude case of 4.8%c, the qualitative aspect of the arising circumferential modes is significantly different from the 1.2%c case, as expected from the trend in aerodynamic damping. The time-space diagram Figure 8b shows much organized pattern than the 1.2%c case. According to the circumferential modes shown in Figure 8d, only the multiples of 4, which is the prescribed nodal diameter in the simulation, have high amplitude. This result means that the spatial pattern of unsteady flow is determined by the blade vibration. In the lower blade amplitude cases the unsteady flow behaves naturally, and therefore closely separated multiple circumferential modes arise due to the non-uniformity in the flowfield. On the other hand, under sufficiently large blade amplitude, the unsteady flow synchronizes the blade vibration and only specific circumferential modes arise. This finding is consistent with the prior work of Zhao et al. (2020).
In Figure 8d, it can also be seen that the dominant circumferential modes are changing during the transient simulation. At the beginning of simulation, the mode number of 16 has relatively high amplitude. This mode 16 is thought to be appeared by the scattering of prescribed ND4 oscillation by the 20 rotor blades (20−4 = 16). From the time 5–15 cycles, the high mode number of 44 is appeared, and then from the 15th cycles the amplitude of mode number of 16 is suddenly increased. This timing of dominant mode shift corresponds to when the aerodynamic damping switches into negative. Therefore, it is expected that the energization of mode 16 leads the destabilization of 2F-ND4 oscillation shown in Figure 7.
In order to further confirm the local unsteady flow pattern and the destabilizing mechanism, the vortex shedding pattern is compared between the stable and unstable cycles in Figures 9a and 9b. The vortex cores are identified by the positive part of Q-criterion, which corresponds the red part in the Q-criterion contour. During the stable 6th cycle, small scale vortex cores can be observed in Figure 9a. This small-scale vortices may correspond to the 44th mode found in Figure 8d. On the unstable 17th cycle in Figure 9b, the size of vortices is much larger than that in the 6th cycle. Four vortex cores are exist inside 5 blade pitches, therefore this vortex shedding clearly corresponds to the mode 16 in full annulus of 20 blade pitches.
Figure 9.
Vortex shedding near the tip (amp = 4.8%c). (a) 6th cycle (positive damping) (b) 17th cycle (negative damping) (c) schematic of bladevortex interaction.
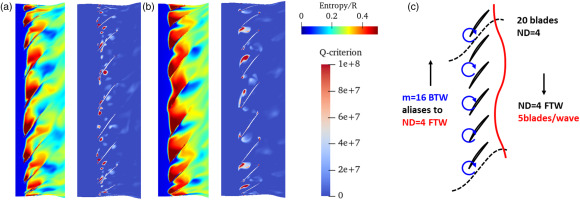
The interaction of vortex shedding and blades are schematically illustrated in Figure 9c. There are 16 vortices traveling backward in the circumferential direction. The blade vibration pattern excited by the mode 16 backward traveling wave is ND4 forward traveling, because of the aliasing effect. From this relationship, it can be confirmed that the impingement of vortices is the root cause of the destabilizing effect of the pressure side leading edge shown in Figure 7. This mechanism agrees well with that of convective NSV (Stapelfeldt and Brandstetter, 2020).
Quantitative evaluation of unsteady flow: time-space spectra and coincidence with vortex shedding
For the largest amplitude of 4.8%c the vortex shedding completely locks into the blade vibration. On the other hand, for the smaller amplitude of 1.2%c, the vortex shedding occurs naturally. By analysing the unsteady flow pattern, the range of possible coincidence can be evaluated. Figure 10 shows the result of time-space Fourier transformation in the 1.2%c blade amplitude case. The timespan used is 14–26 2F oscillation cycles, where multiple circumferential modes exist according to Figure 8c. Figure 10a shows the mode-frequency diagram. Large amplitude due to vortex shedding can be observed in the modes from 8 to 20, whose frequency varies from 3 to 8 EO.
Figure 10.
Assessment of coincidence due to vortex shedding (amp = 1.2%c, time-space DFT from 14–26 2F cycles). (a) Time-space Fourier transformation result (b) Closeup for 4.3EO.
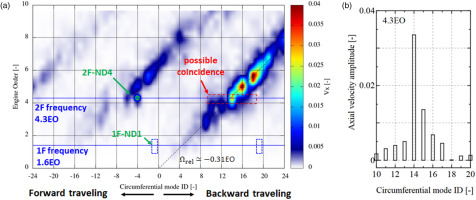
In the convective NSV, the excitation frequency due to vortex shedding is directly correlated with the convective speed of vortices (Stapelfeldt and Brandstetter, 2020). In the present result,
The frequency depends on the modes, and therefore coincidence occurs when the flow frequency eventually matches with the structural frequency. Figure 10b shows the closeup around high amplitude region for the 2F mode of 4.3EO. Here, modes of 14–16 are relatively higher than the other modes, which can excite forward traveling waves of ND4–6 through alias. The vortex shedding contains multiple circumferential modes and can excite multiple nodal diameters, which can be the reason for the existence of multiple nodal diameters in the 2F NSV observed in the rig test.
The above discussion for coincidence can also be made for the 1F-ND1 flutter occurred in the rig test. If the 1F-ND1 excitation is convective NSV due to vortex shedding, the excitation source should exist around the mode 19, which aliases to ND1. From Figure 10a, there is no significant component on the 1F frequency of 1.6EO around the mode 19. Therefore, contrary to the 2F NSV, it is estimated that 1F flutter was not directly excited by the vortex shedding coherent with the blade vibration.
Conclusion
Detailed aeromechanical simulations were conducted in order to assess the excitation mechanism of the 2F mode near stall. The aerodynamic damping and unsteady flow structures were evaluated over a range of operating conditions, where the vortex shedding pattern significantly changed during the transient simulations. The conclusions are summarized as follows.
The 2F excitation found in the rig test can be explained by the coincidence of vortex shedding and the interaction with the 2F mode. When the blade amplitude is low, the vortex shedding naturally occurs at its own aerodynamic frequency and contains multiple circumferential modes. These vortices can excite multiple nodal diameters simultaneously, which supports the experimental observation.
As the blade vibration amplitude increases, the vortex shedding becomes locked into the blade vibration. Under this lock-in condition, the aerodynamic circumferential modes become significantly limited with the given structural nodal diameter.
The aerodynamic damping for ND4 FTW turns negative when the shed vortices near the shroud spill upstream of the blades and impinge to the leading edge of the neighbouring blades. The dominant circumferential mode in the vortex shedding is 16 BTW and it excites ND4 by aliasing with 20 rotor blades.
The 2F vibration observed in the test is categorized into convective NSV because of the existence of vortex shedding as an excitation source. Contrary, it is estimated that the 1F flutter in the test was not directly excited by the vortex shedding coherent with the blade vibration.


