
Introduction
The degradation of jet engines results in performance losses, higher emissions, decreasing safety limits, and shortening of life cycles. An effective and accurate regeneration or recovery of a component can significantly reduce operating costs as well as the risk of failure. Therefore, the Collaborative Research Centre 871 “Regeneration of Complex Capital Goods” (CRC 871) develops a scientific basis for novel technologies and approaches to analyse and determine the causes and effects of wear.
Hence, these methods are exemplified using the V2500-A1, a mature high-bypass turbofan jet engine operated by the Institute of Jet Propulsion and Turbomachinery (IFAS) (Spuhler et al., 2019). In the CRC 871, the full regeneration process is formed by a real and a virtual repair process (Denkena et al., 2019). Therefore, many sub projects are working together to produce a digital twin of a turbofan jet engine to analyse the impact of deteriorated components on the overall performance, aerodynamics, aeroelastics, and structural dynamics for the virtual repair process (Schwerdt et al., 2019; Goeing et al., 2020).
In general, the degradation phenomena with impact on the aerodynamic performance of a highly loaded high-pressure compressor and high-pressure turbine in jet engines are, among others, increased tip clearance, changes of airfoil geometry and surface quality (Saravanamuttoo et al., 2001; Kurz et al., 2009). The impact of these effects on the aerodynamics of the individual engine components can be simulated by using RANS simulations (Seehausen et al., 2020). These simulations generate performance maps, which can be utilised in Reduced Order Models (ROM) for the computation of the overall performance (Li et al., 2011; Reitz et al., 2018). Especially during transient manoeuvres, loads can increase significantly (Goeing et al., 2020).
Compared to existing industrial techniques, which are based on experience, this numerical approach yields a scientific method to investigate the impact of deterioration on the overall performance. Thus, economically meaningful decisions can be made by evaluating test cell data of engines in service, using this method. Here, the transient performance of the V2500-A1 engine with miscellaneous and combined deteriorated components is investigated. Hence, RANS simulations of the high-pressure compressor (HPC) and turbine (HPT) are conducted. They include increased surface roughness of the HPC blading’s surface and increasing tip clearance of the HPT blades. The results of these simulations are steady-state performances maps. The transient performance is computed with the in-house performance software ASTOR (AircraftEngine Simulation for Transient Operation Research). Common performance tools are based on iterative techniques (Kurzke, 2012) or hybrid numerical/iterative approaches with intercomponent volume methods (Evans et al., 1998; Rahman and Whidborne, 2009). In contrast, ASTOR is based on the Pseudo Bond Graph theory. With the Bond Graph approach, the requirement of graphical programming environments like Simulink is no longer necessary. This is a numerical approach which does not employ iterative techniques and is able to simulate transient performance with higher accuracy, by a reducing simulation speed (Fawke and Saravanamuttoo, 1971; Ganji et al., 1993; Kim et al., 2001).
So far, fast iterative or hybrid numerical/iterative approaches are available and used for a fast calculation in the design process or for real-time simulations in system control. In the maintenance, repair, and overhaul (MRO) industry, a precise prediction of deterioration is of high relevance. In general, the deterioration of single or combined components has a significant effect on the steady and transient performance. Steady performance is used to classify the type and degree of deterioration. However, in jet engines with combined deteriorated components a characterisation of the type of deterioration is more complex. The decision of which component to repair is of economic interest. Subsequently, this investigation maintains that the simulation of transient performance supports this decision significantly.
Therefore, the aerodynamics of the HPC with increasing roughness on blades and HPT with increasing tip clearance are simulated with non-commercial RANS flow solver TRACE. Afterwards, a simplified test procedure is computed with ASTOR to analyse the transient performance of the following four engines: A new engine, an engine with a deteriorated HPC, an engine with deteriorated HPT and an engine with deteriorated HPC and HPT. Different characteristic quantities such as thrust specific fuel consumption (TSFC), temperatures (T) and rotational speed
Finally, a simplified combined engine model is derived to constitute a relation between the results of engines with single component deterioration to the engine which features multiple deteriorated components. This simplified combined engine should be able to estimate transient and steady performance of a combined deteriorated jet engine without the need to simulate the combined deteriorated jet engine.
Material and methods
This study investigates the V2500-A1 turbofan by International Aero Engines (IAE). The V2500 engines are mounted on the Airbus A320-100. At the beginning, the performance simulation tool ASTOR is explained. Afterwards, the CFD simulations of the HPC and HPT of the V2500-A1 are presented.
Performance simulation
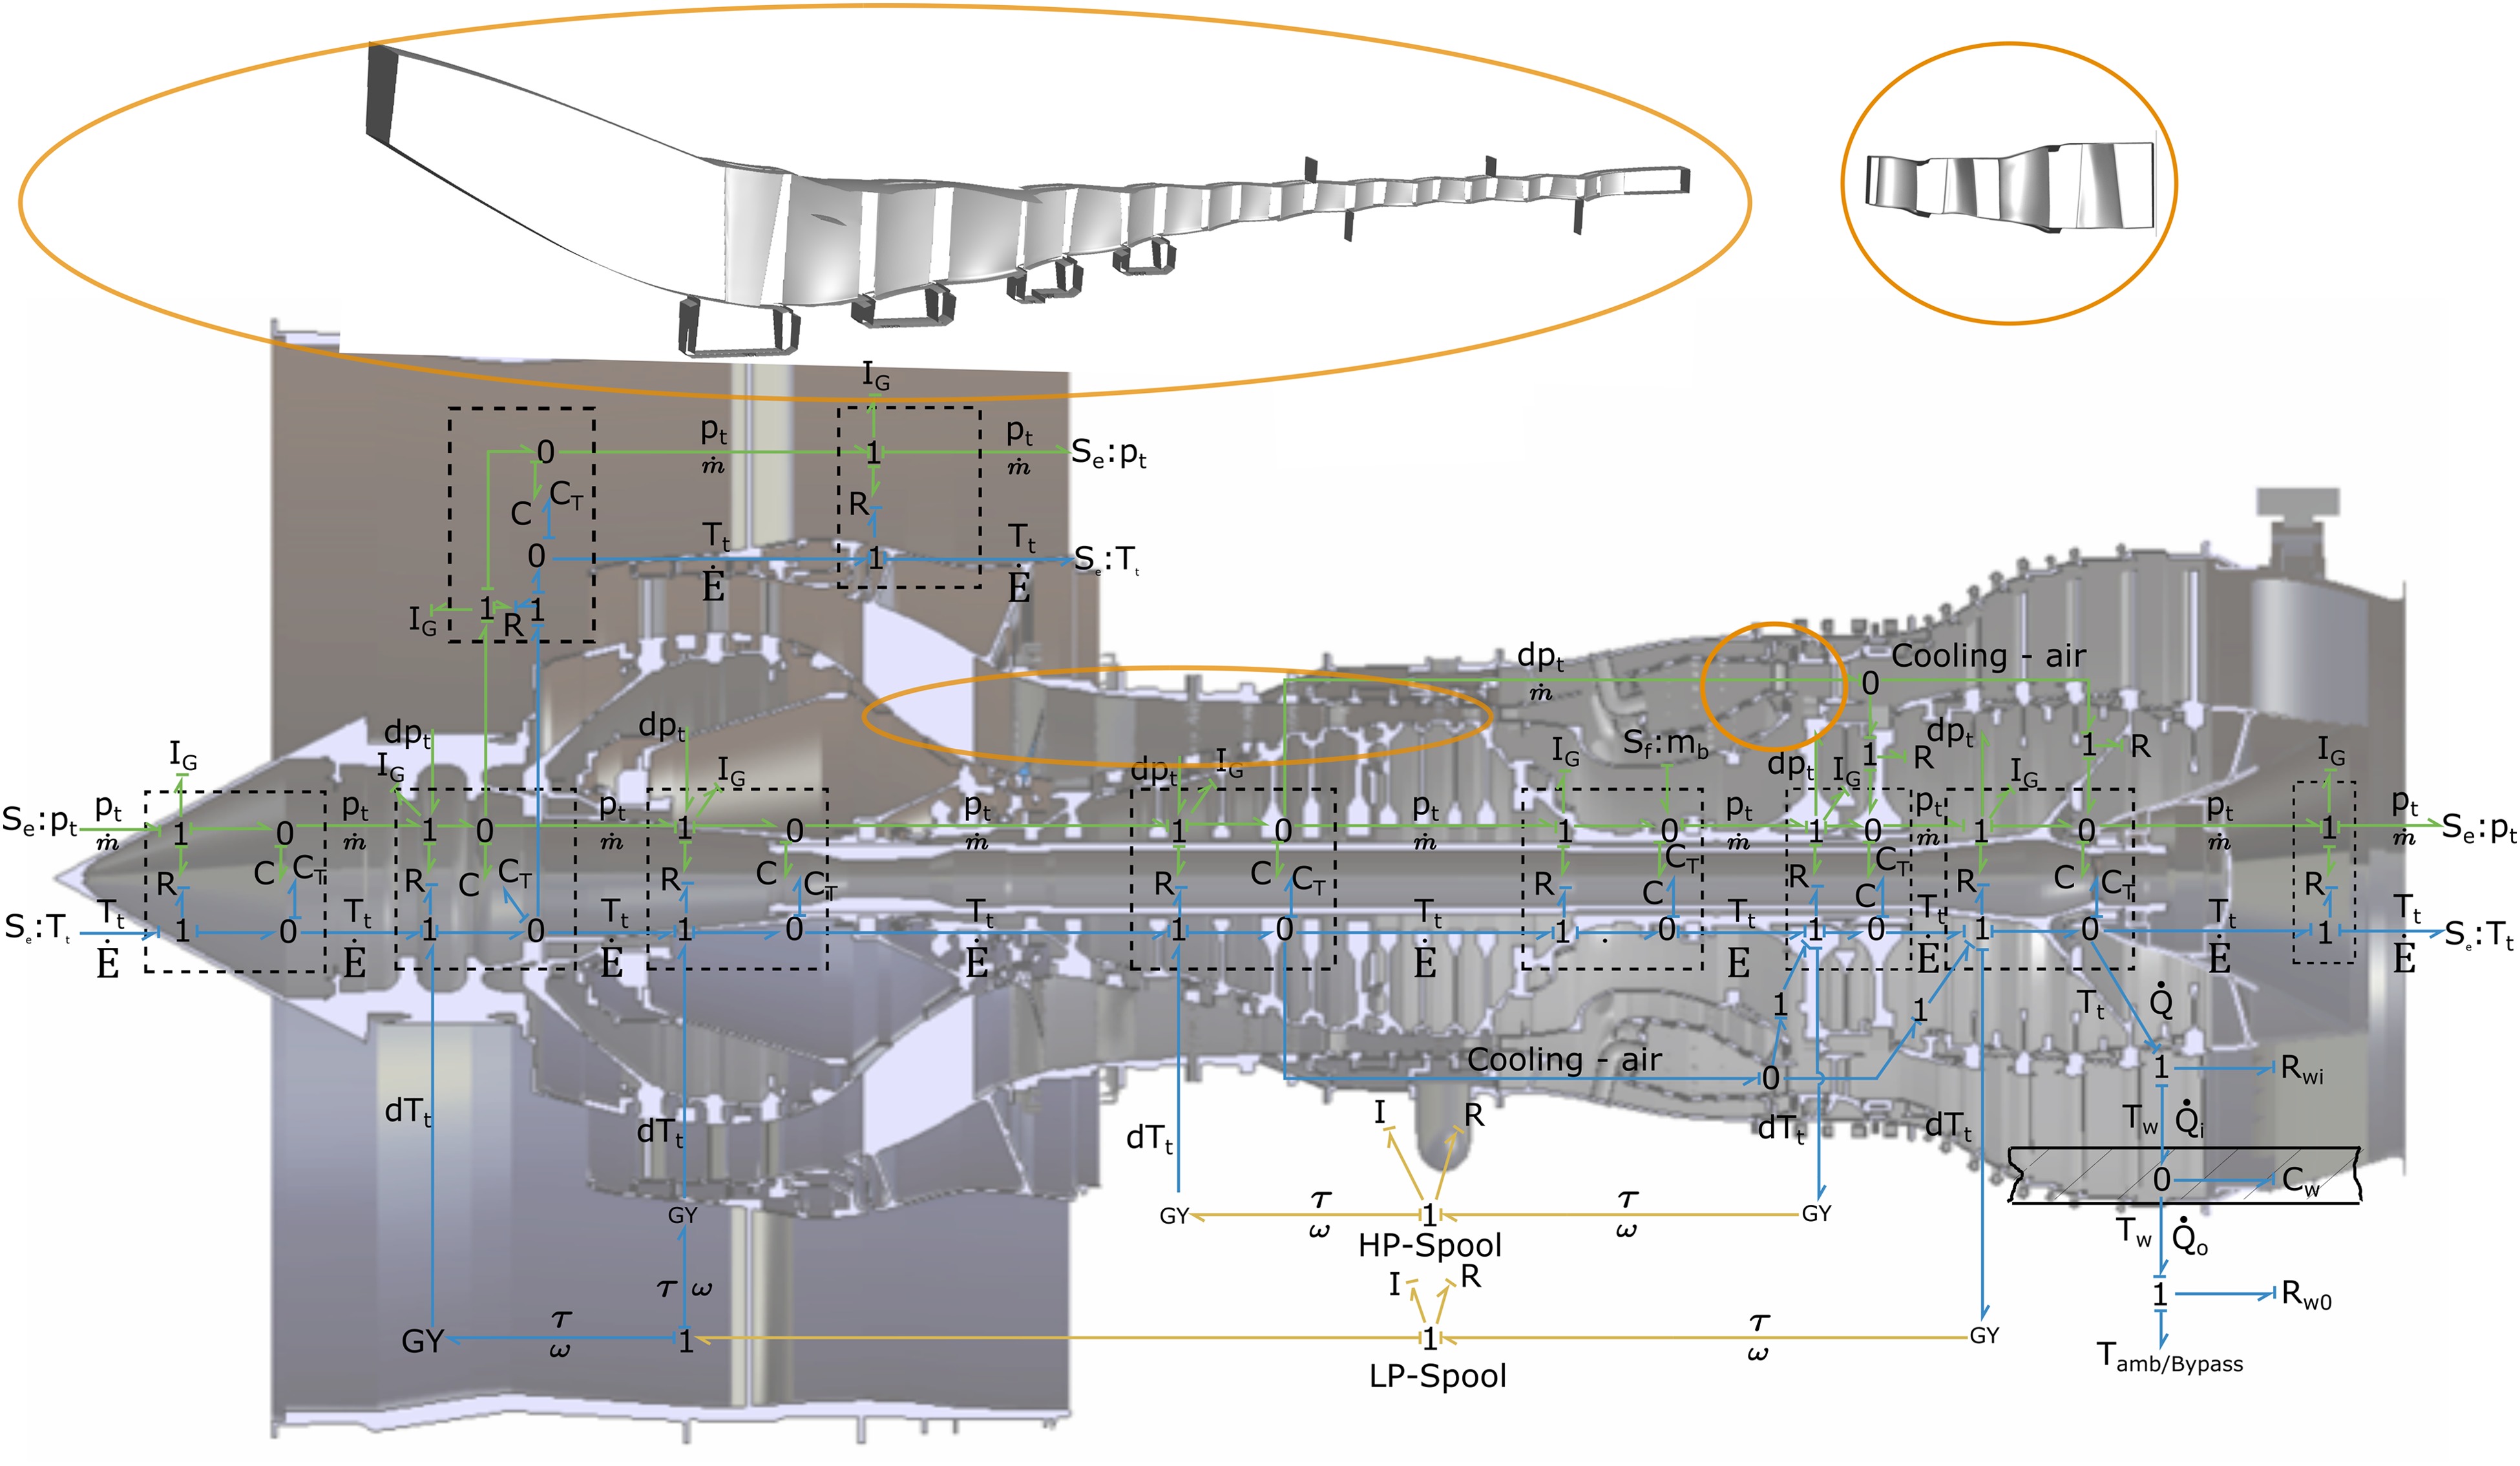
The influence of deteriorated components on the overall performance of a jet engine is simulated with the IFAS in-house performance software tool ASTOR. Therefore, all equations of motion and further ordinary differential equations for heat flow or spool speed are solved using a Runge Kutta third order algorithm. The pseudo Bond Graph is shown in Figure 1. Here, efforts e (e.g. pressure p, temperature T or torque
Performance maps contain the boundary conditions for the miscellaneous domains. The sections of choked flow in compressor and turbine performance maps constitute a challenge for map interpolation since the reduced mass flow does not increase anymore while pressure ratio change. In order to enable an algorithmic solution of the proposed interpolation technique (Goeing et al., 2019), infinitesimal increments of reduced mass flow
Apart from the performance maps of the miscellaneous components, characteristic lengths, cross sectional areas as well as material information are required for the equations. Scaled performance maps of the fan and booster are used (Wolters et al., 2016; Vieweg et al., 2017) and a simulated low-pressure turbine (LPT) map was calculated in (Ulrich, 2019). Next, based on the IFAS inhouse V2500-A1 engine a full CAD-model was designed to determine the characteristic lengths (see background of Figure 1). Therefore, the fan, HPC, HPT and LPT blades are weighed to determinate the mass. The weight of the booster blades, the two spools and discs are approximated and based on technical sketches. Mostly, titanium and nickel alloys are used as material for these components. The resulting moment of inertia of the LP-system is 57 kg·m2 and that of the HP-system 11 kg·m2.
CFD methods
The CFD simulations of the HPC and HPT are performed using the non-commercial flow solver TRACE of the German Aerospace Center (DLR) in version 9.0 and 9.1 (Nuernberger, 2004; Franke et al., 2005; Kugeler et al., 2008). Based on a finite-volume method with structured multi-block meshes, the three-dimensional Favre-averaged Navier-Stokes equations are solved. The discretisation of the convective fluxes is performed by Roe’s second-order upwind scheme, while the diffusive fluxes are solved by a 2nd order central differencing scheme. An automated Python-script is used to generate the performance maps required by ASTOR. The script varies, in steps, the static outlet pressure of the HPC simulations and total inlet pressure of the HPT simulations. The inlet and outlet boundary conditions are derived from full performance synthesis calculations. Different rotational speeds are considered, and the meshing was performed using Numeca Autogrid software. The numerical setups are presented in Table 1. A mesh convergence study of the HPC setup resulting in a mesh with approximately 26 million cells and a validation of the simulated HPC performance maps are presented in (Reitz et al., 2018). In addition, a mesh convergence study was carried out for HPT, which results in a Grid Convergence Index (Roache, 1993) of 0.0084 and the asymptotic character of the grid convergence was confirmed with 1.0058. Based on Sridhar (Sridhar et al., 2011), the Menter SST turbulence model (Menter, 1994) is applied for these simulations. The multimode model is used for transition, which is validated particularly for turbomachinery applications (Kožulović, 2007).
Table 1.
CFD setup of the HPC and HPT.
| Settings | HPC | HPT |
|---|---|---|
| Analysis type | Steady state | Steady state |
| Walls | No slip walls | No slip walls |
| Interface between rows | Mixing plane | Mixing plane |
| Turbulence model | Wilcox | Menter SST (Menter, 1994) |
| Transition model | Off/ fully turbulent | Multimode (Kožulović, 2007) |
| Rotational speeds | 11,876–14,391 | 9,640–13,972 |
The CFD results are evaluated in terms of the corrected mass flow
polytropic efficiency
total temperature ratio
total pressure ratio
HPC surface roughness
The operation of an aircraft engine causes several different deterioration modes acting on the engine performance. One significant factor when focusing on the performance reduction of an HPC is described by surface roughness (Seehausen et al., 2020). Based on environmental factors such as aerosols, dust, and other particles, blade’s surface roughness is increased, resulting in performance losses (Tarabrin et al., 1998; Morini et al., 2009; Bons, 2010; Wensky et al., 2010). Gilge et al. optically measured the blade surfaces of HPCs which had completed 20,000 cycles (Gilge et al., 2019a, b). Additionally, the equivalent sand-grain roughness
Figure 2.
Roughness distribution across the stages of the HPC after 20,000 cycles in service and examples of measured surfaces (Gilge et al., 2019a).
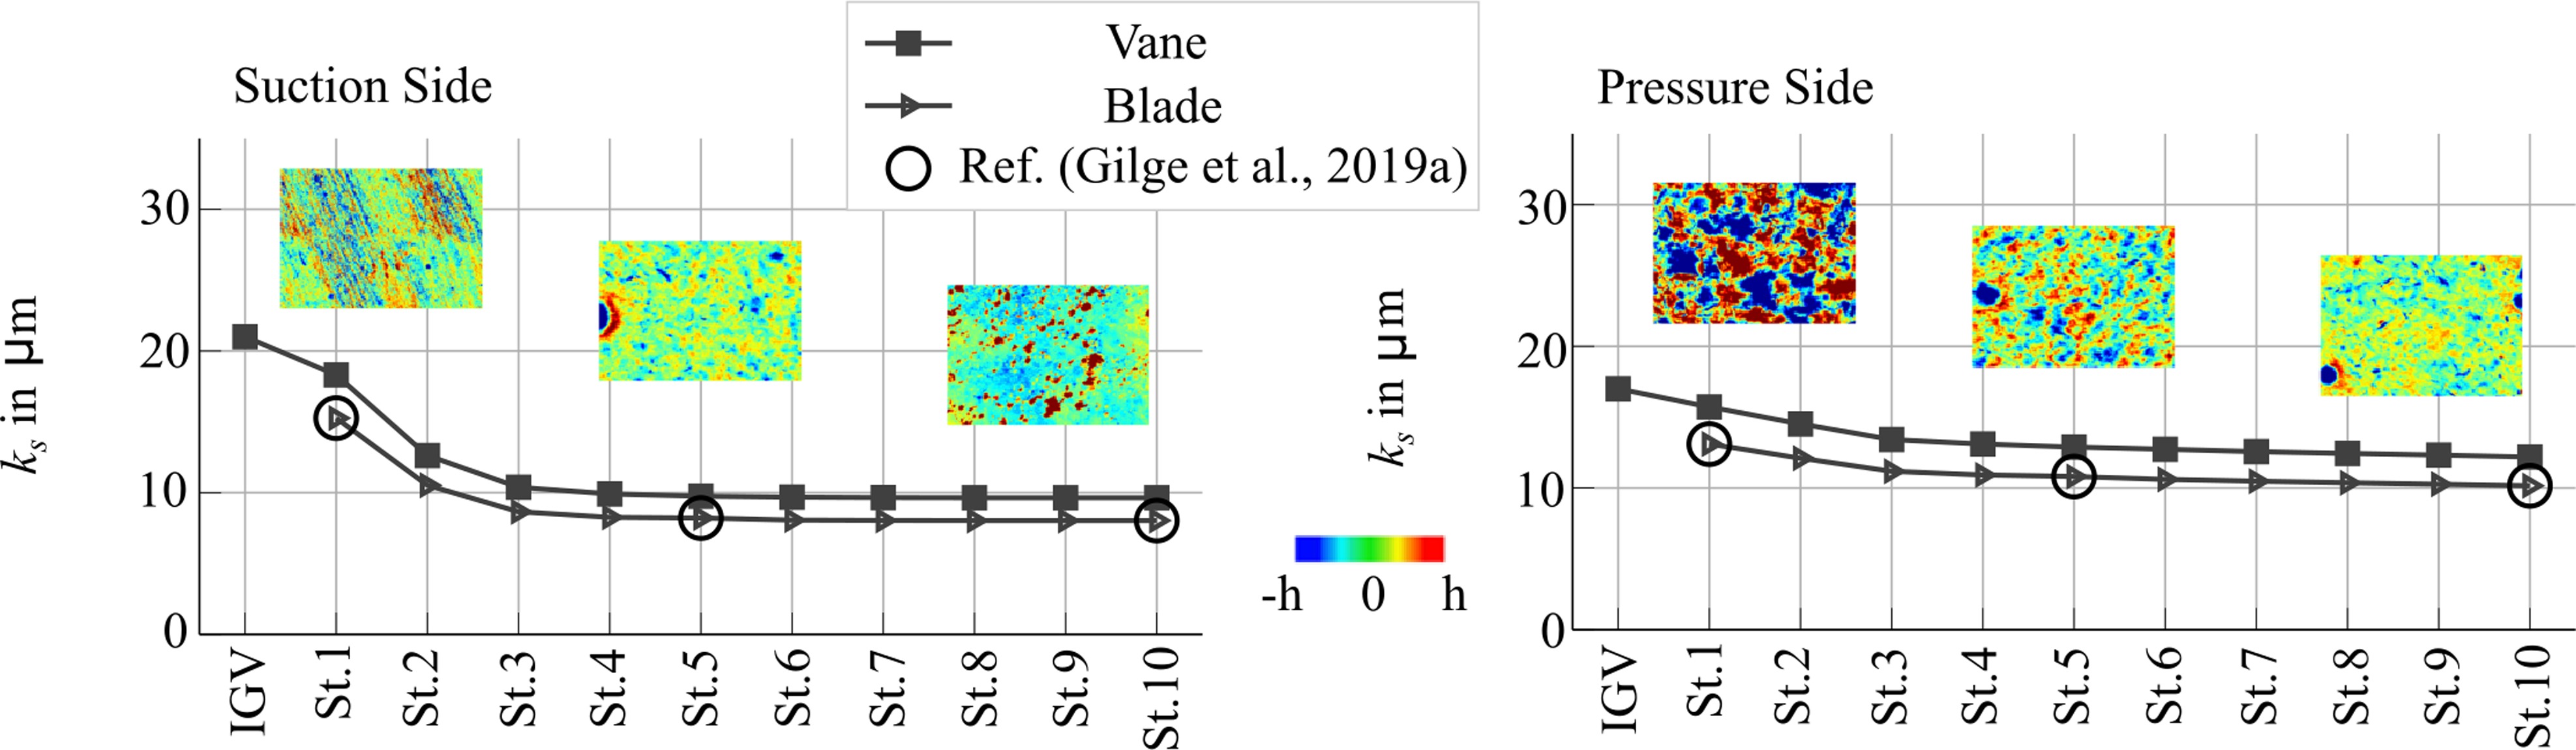
In (Goeing et al., 2020), the effect of HPC surface roughness on the transient engine performance was extensively investigated in ASTOR. To model the transient manoeuvre in ASTOR, performance maps at different rotational speeds and roughness levels are calculated using numerical solutions from TRACE. Following which, the performance maps are scaled using a method described by (Li et al., 2011) which results in lower computational effort. The individual scaling factors indicate a dependency between the Reynolds-number and the roughness effect, which is consistent with the findings of (Nikuradse, 1933; Moody, 1944). In the left plots of Figure 3, the HPC performance maps used in this study are illustrated. The green lines represent the map of the smooth blades and vanes, while the black lines correspond to scaled maps of average roughness height after 20,000 cycles in service.
Figure 3.
CFD performance maps. Left: Performance map of the HPC with smooth blades and vanes at different rotational speeds compared with the scaled map of average roughness height. Top: Pressure ratio π t t m ˙ . η pol m ˙ m ˙ 1 / π t t η pol 1 / π t t
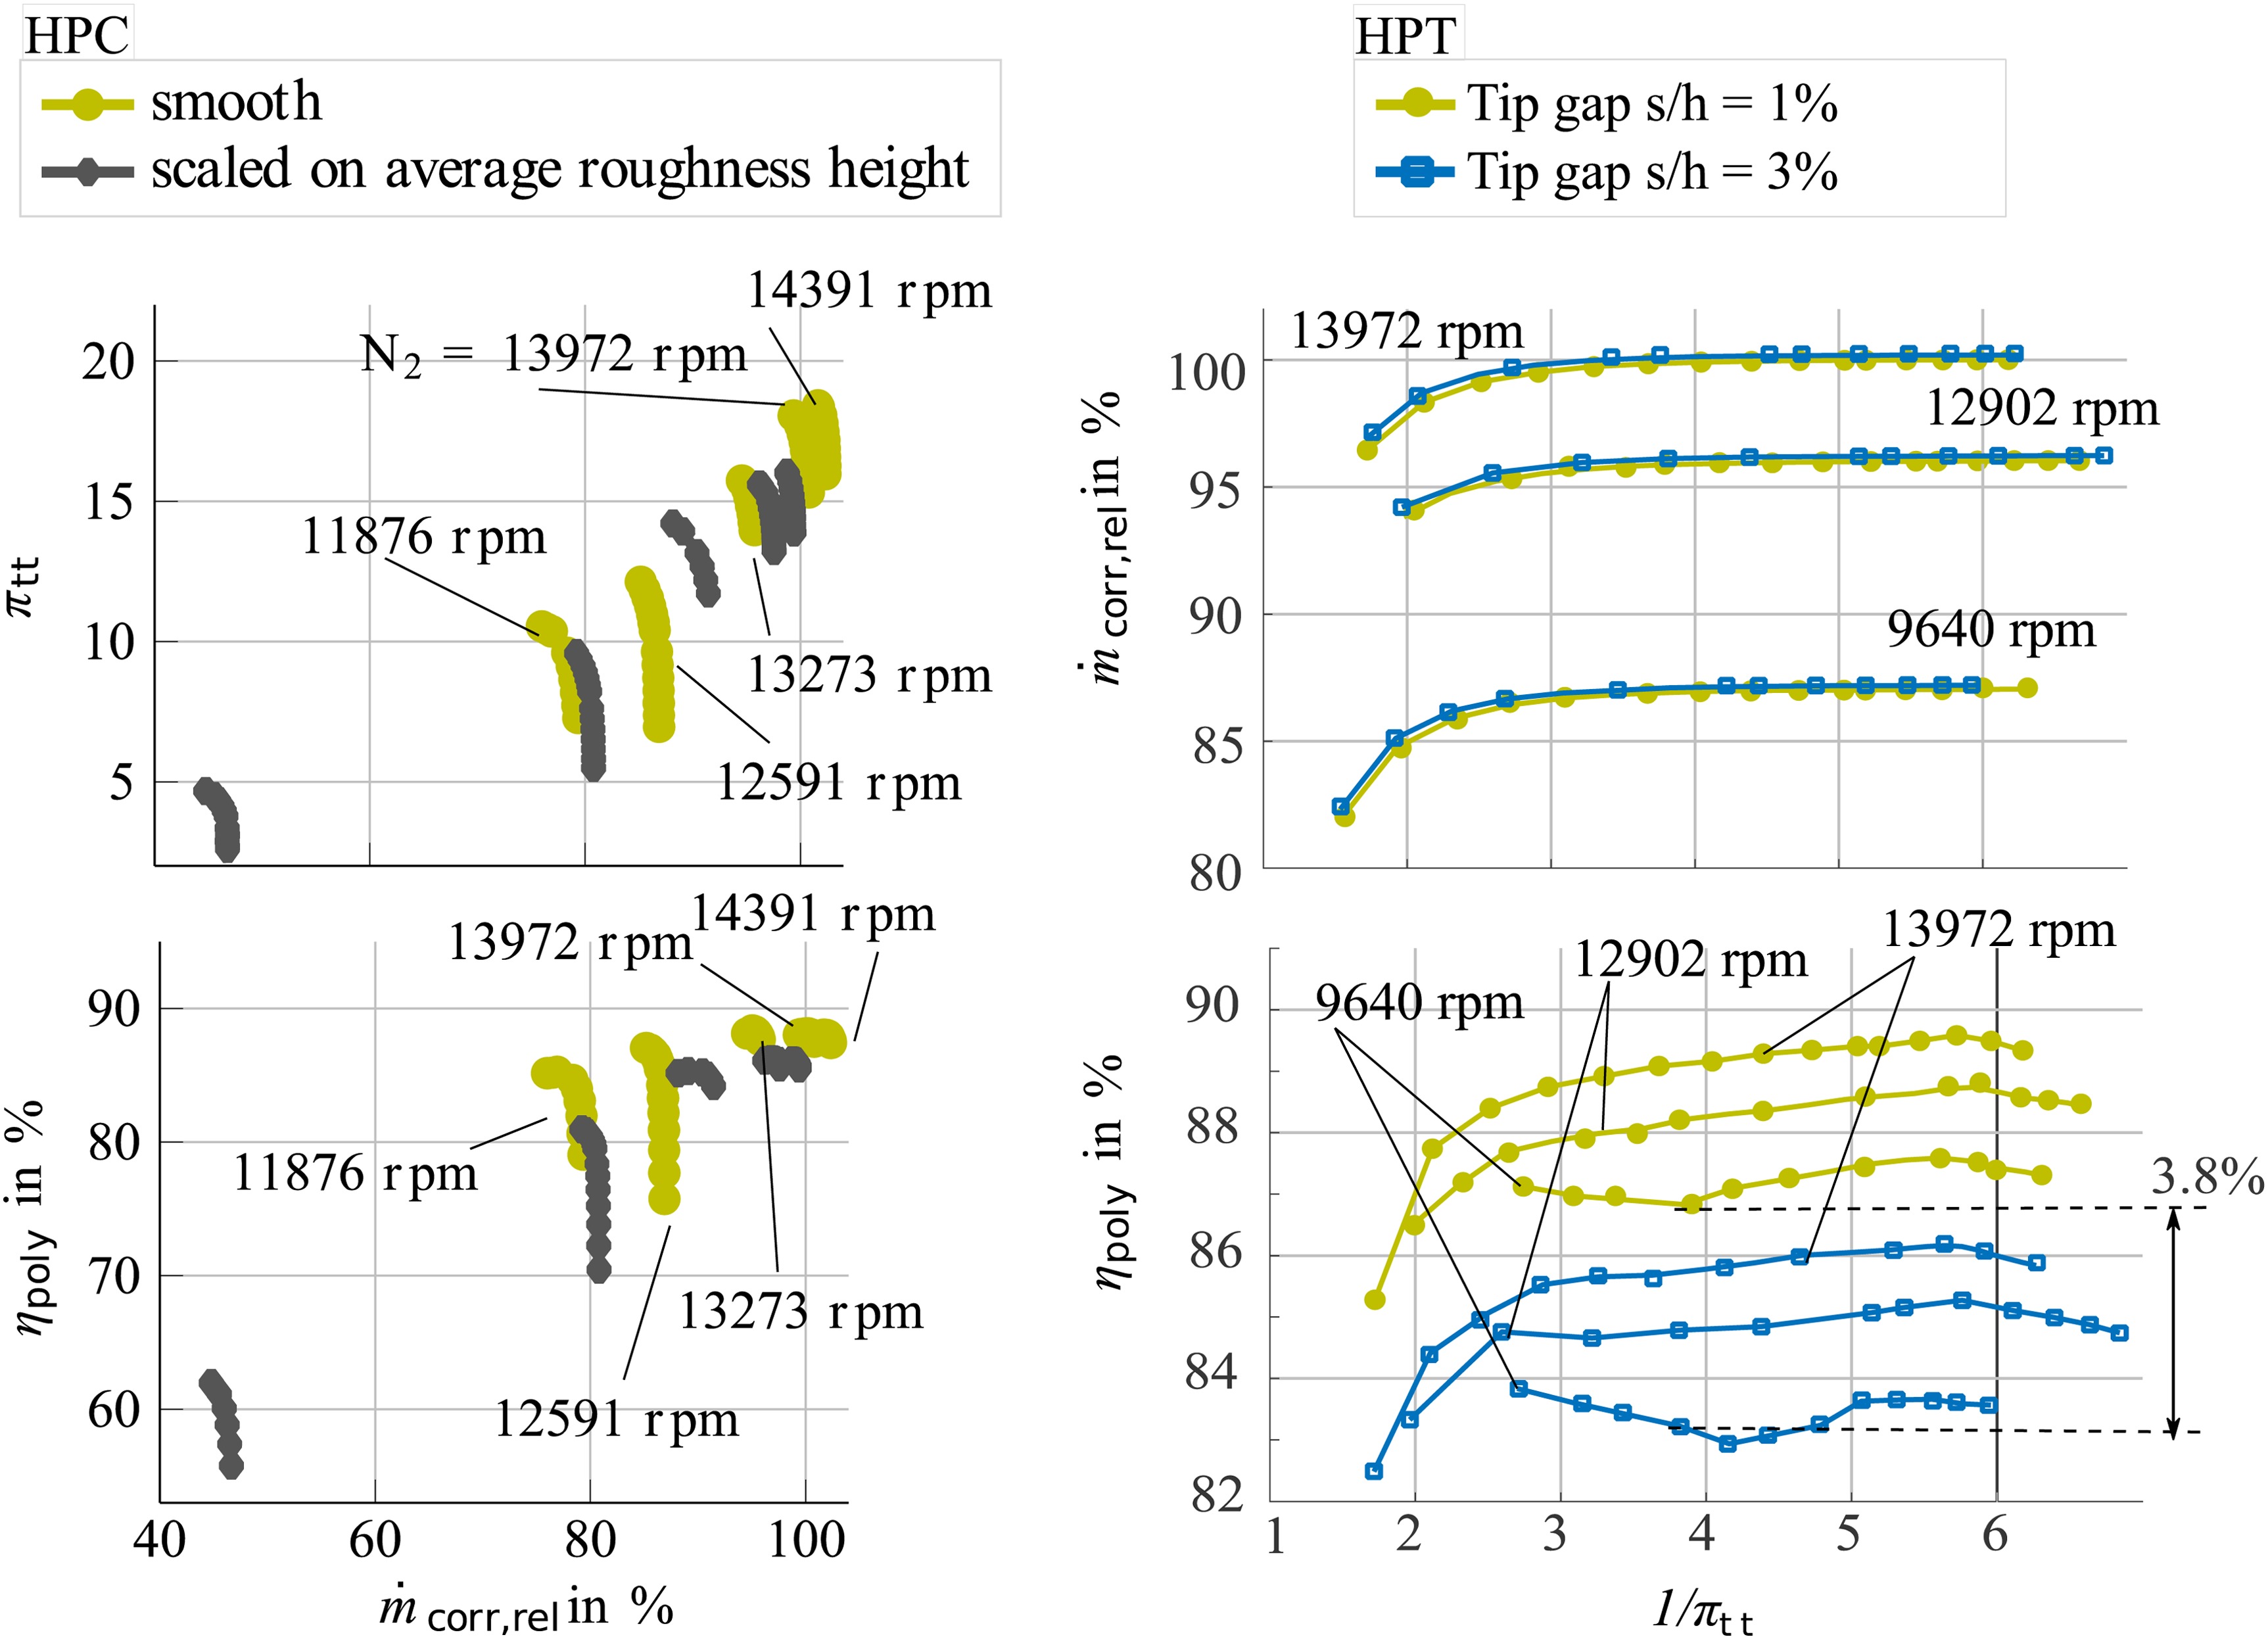
Surface roughness reduces the mass flow due to thicker boundary layers. This comes along with a decreased efficiency and increased pressure losses. At low rotational speeds, the effect of surface roughness increases due to smaller Reynolds numbers.
Reitz (Reitz et al., 2018) performed a scaling of the HPC performance map with a doubled tip gap size. As shown by (Seehausen et al., 2020), the overall effect on the performance is larger for surface roughness than for tip gaps. In contrast to surface roughness, doubled tip gaps mainly affect the polytropic efficiency and not the pressure rise. A CFD study by (Reitz and Friedrichs, 2018) on the effect of modified geometries in the front and rear stages, caused by deterioration, revealed that the performance could be increased by local geometry changes. The intensity of the effect strongly depends on the geometrical parameter modified and varies with the stage (Lange et al., 2012). Regardless of the deterioration type, i.e. surface roughness or geometrical deterioration, the performance is predominantly affected by the front stages resulting in multistage effects.
HPT tip clearance
HPT blades and vanes are exposed to high thermal and mechanical loads due to high gas temperatures and rotational speeds. This causes a range of different deterioration types, an increased blade tip gap being one of them. Typically, the gaps between the turbine blade tips and the shroud are designed to be as small as possible. As described by (Denton, 1993), the secondary flow in the tip gap contributes significantly to the losses in the turbine. Bindon showed that the losses increase with increasing radial gap (Bindon, 1989). To investigate the effect of the increased radial gap on the overall performance, the CFD simulations of the V2500-A1’s HPT are performed.
The V2500-A1 HPT consists of two stages and in this study the blade tip gaps of both stages are varied. The variation is set as a ratio of radial gap s and blade height h. Accordingly, two meshes with different s/h ratios are created. A ratio of s/h = 1% is used as a reference and the increased tip gap is represented by s/h = 3%. Table 2 summarises the meshing setup for tip gaps.
Results are evaluated in terms of corrected mass flow
The lower plot of the right diagrams in Figure 3 shows the influence of the increased gap (blue lines) on the polytropic efficiency. The higher radial tip gap decreases polytropic efficiency by up to 3.8% across all speed lines, which corresponds to earlier studies (Hourmouziadis and Albrecht, 1987). This is caused by increased secondary flow losses in the tip gap. Hence, a negative effect of the increased tip gap on the overall HPT performance can be observed. The influence on the corrected mass flow is not as explicit and decreases by only 0.06%–0.35%
Results and discussion
In this chapter, the overall performance of the miscellaneous jet engines is presented and discussed in more detail. The performance is simulated for a simplified test manoeuvre derived from the pass-off test procedure of the V2500 engine. This test procedure considers 4 different thrust levels (Band A - 105 kN, Band B - 95 kN, Band C - 80 kN and Band D - 30 kN) and a slam acceleration between the Band D and A at the beginning. In addition, a slam deceleration is simulated between each adjoining thrust level. Furthermore, a linear fuel flow signal between the thrust levels is applied. The full manoeuvre ends after 30 s.
The following miscellaneous jet engines are investigated:
New engine
Engine with deteriorated HPC
Engine with deteriorated HPT
Engine with deteriorated HPC and HPT
Simplified combined (sim. com.) engine
The combined jet engine
Steady and transient performance
In this section, characteristic quantities of the test procedure are analysed. They are used to describe the degree of engine deterioration and give an estimation about the component that is subject to deterioration. In the beginning, the transient performance of the engines is represented by quantities which can be measured at the V2500 during a pass off test after a shop visit. Afterwards, the impact on the HPC stability margin is discussed. In the following diagrams, the new engine
Thrust specific fuel consumption (TSFC)
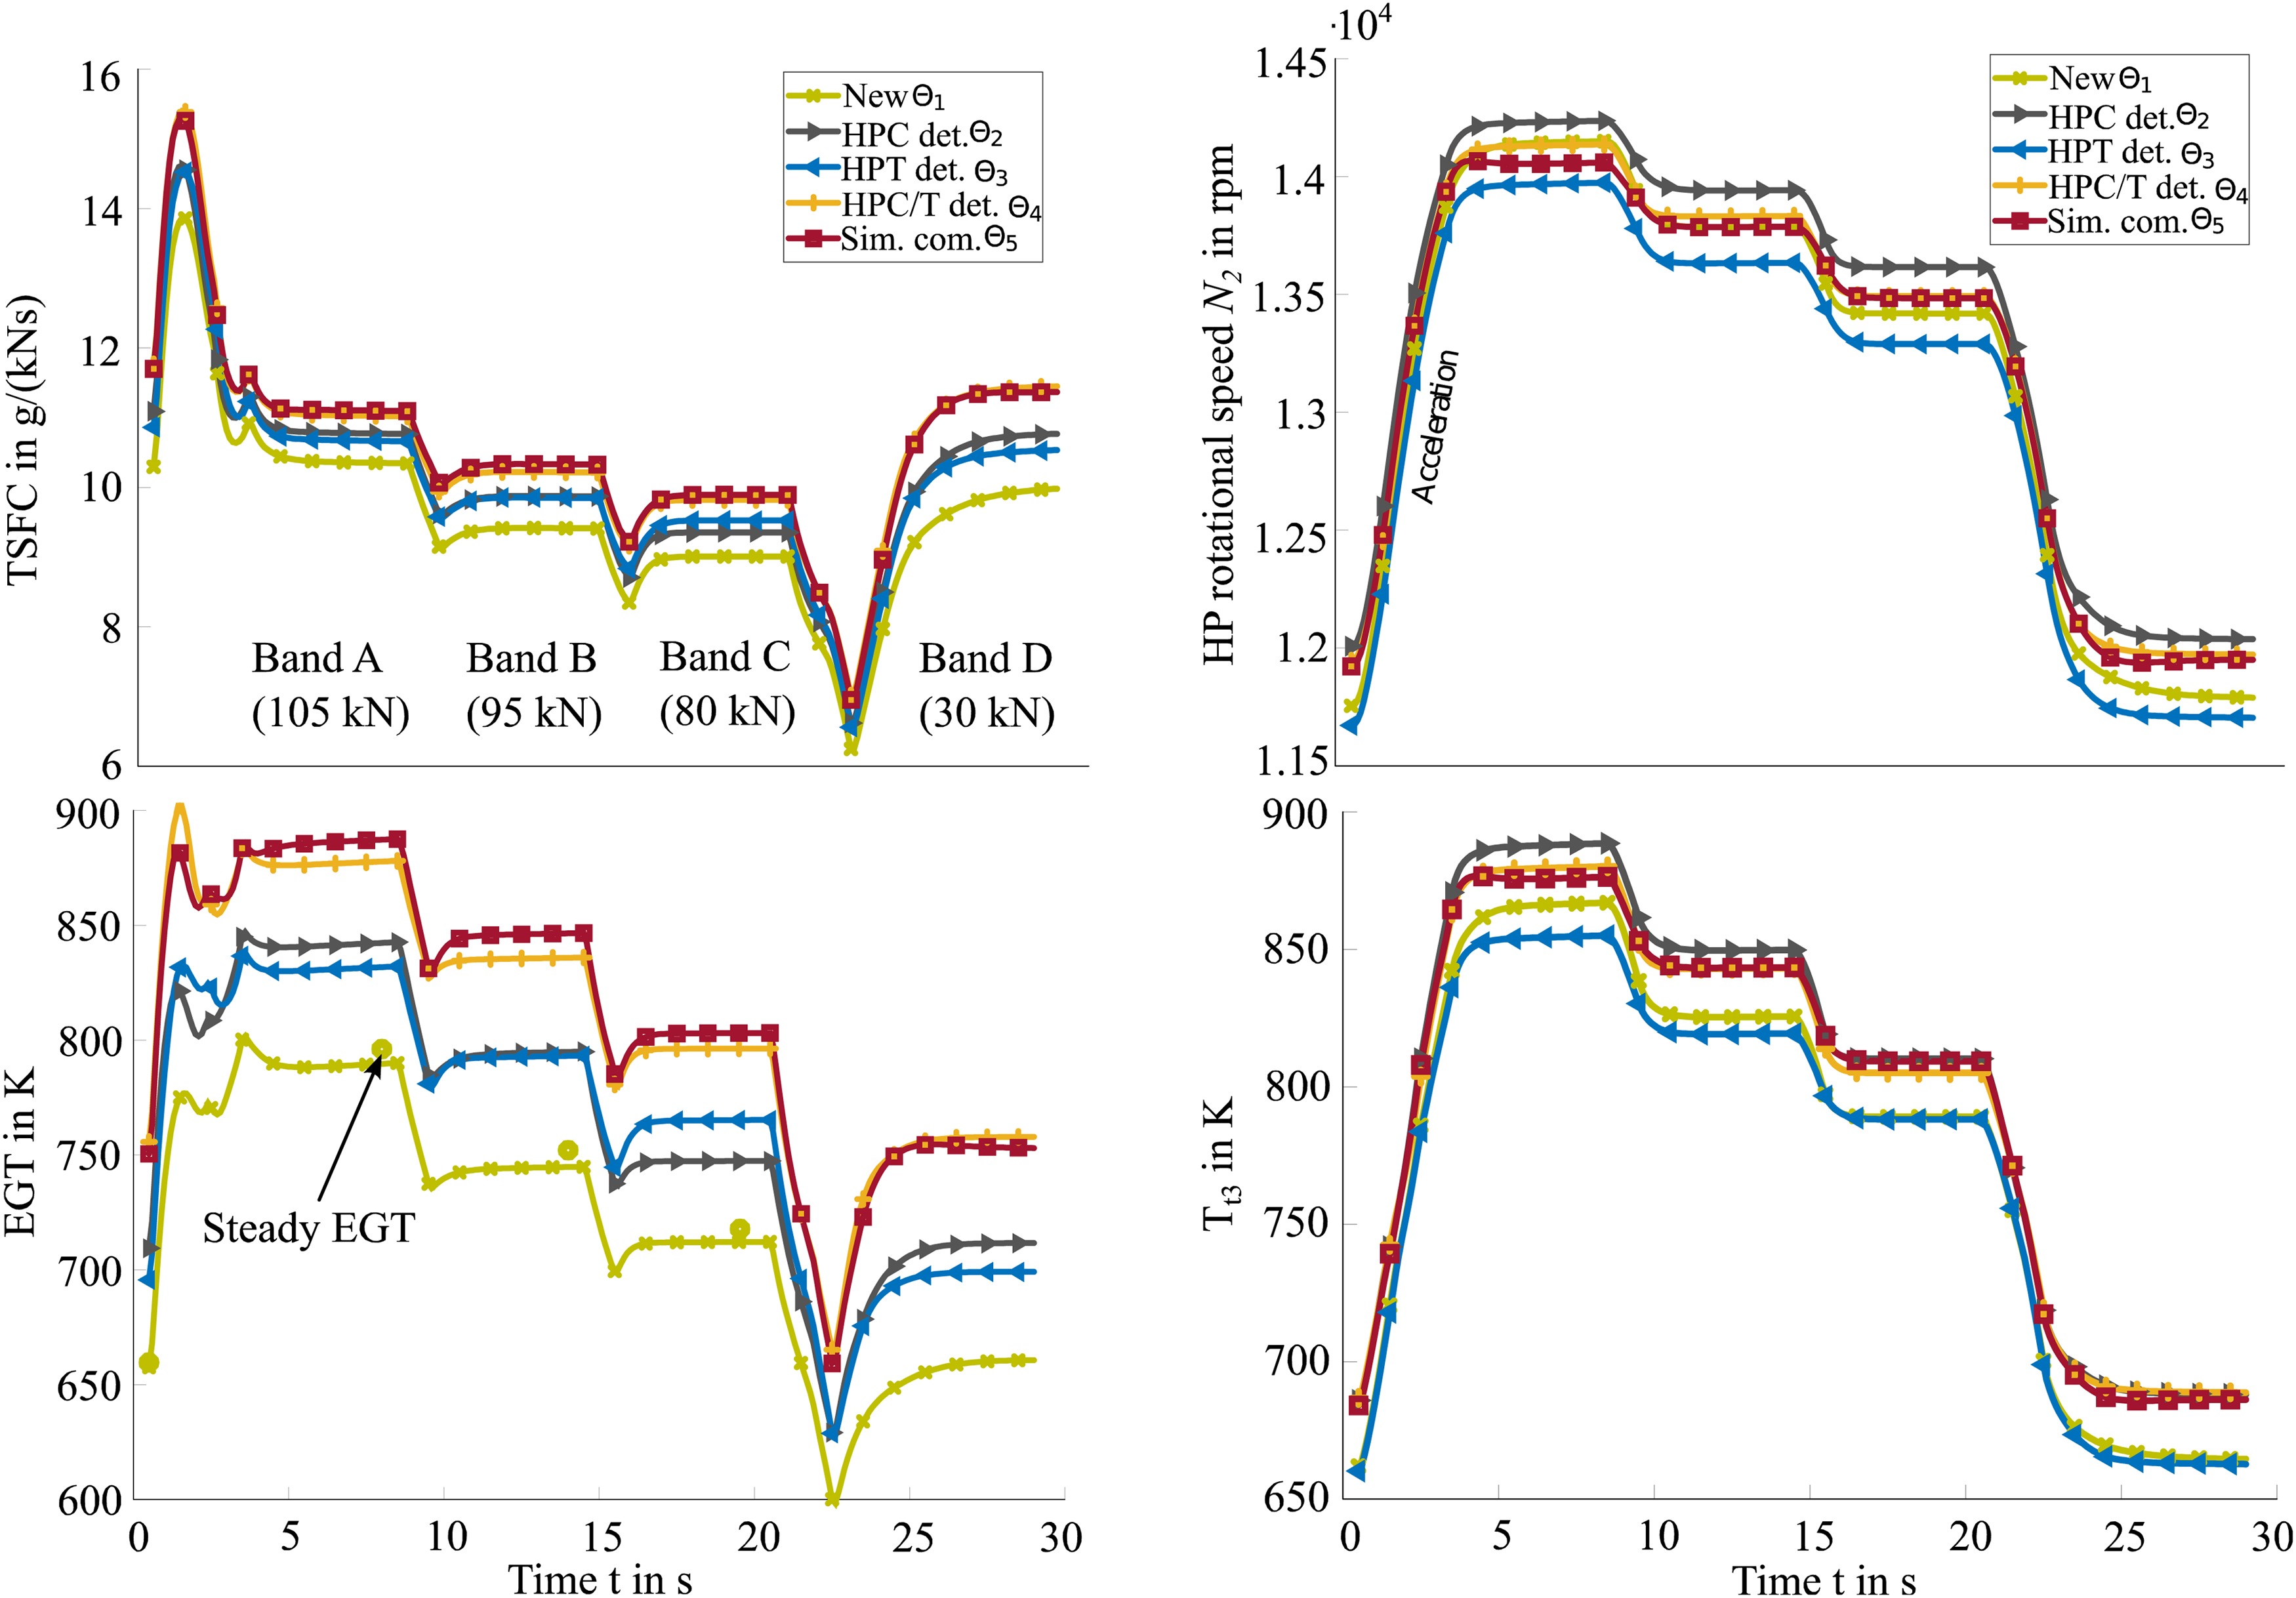
In the upper left diagram of Figure 4 the thrust specific fuel consumption (TSFC) is shown over the time t for all engines. In general, the full TSFC range is between 6.3–15.5 g/(kN
Figure 4.
Left: Identification of the degree of deterioration of the 5 engines. Upper left: Thrust specific fuel consumption (TSFC) over the time t during the pass off test. Bottom left: Exhaust gas temperature (EGT) over the time t. The dots represent the EGT of the steady operating points of the new engine. Right: Identification of the cause of deterioration. Upper right: High-pressure rotational speed ( N 2 )
Exhaust gas temperature (EGT)
Like the TSFC, the exhaust gas temperature (EGT) downstream of the low-pressure turbine is an important identifier for the degree of deterioration. The course of the EGT is plotted over time t in the diagram on the bottom left of Figure 4. Furthermore, the steady state EGTs are represented with dots for each thrust level for the new engine. In these curves, different transient effects are visible. During acceleration and deceleration, the impact of in-/decreasing fuel to air ratio is visible due to the shaft/gas inertia. In the constant fuel flow regions, temperature is increasing slowly due to the heat flow from gas to material. Subsequently, the steady performance is not reached after the 10 s duration of each Band. Like the TSFC, the highest EGT is attained by
The TSFC and EGT are feasible to determine the degree of deterioration. Obviously, the combined engine has the highest level, but these identifiers are not sufficient to grade the single deteriorated engines.
HP rotational speed N 2
In the upper right diagram of Figure 4 the HP system’s rotational speed
In addition, engine
Temperature T t 3
In contrast to
Surge margin SM
The interaction between deterioration and stability of the system is investigated using the HPC surge margin. The change in HPC surge margin compared to the steady state operating line is analysed over rotational speeds
Figure 5.
System stability during the acceleration between 0 s and 8 s. Right: Surge margin of operating line in HPC performance map over the spool speed N2 of the HPC. Transient operating line in solid lines and with marker, steady in dashed lines. Left: Relative deviations between transient and steady HPC operating line.

The definition of the surge margin SM is given in Equation 6:
The relative deviations between transient and steady operating line are calculated with
In the right diagram of Figure 5, the SM of the transient operating line (OL) is between 0.52 and 0.22 for the new engine. Compared to the steady state OL, the SM decreases up to −21% (see left diagram of Figure 5). A significant contrast to
The impact of combined HPC/T deterioration is shown by
Summary/Explanation
In Figure 4 different identifiers for the overall degree of engine deterioration as well as components affected by deterioration have been analysed. In general, two effects are responsible for the performance degradation. First, the reduced efficiency
The HPC of
The reduced HPT efficiency (see bottom right diagram of Figure 3) results in a decreased energy output from the turbine with a smaller pressure ratio
The combination of both degradations increases the EGT significantly compared to the other engines. However, the performance impact of deteriorated HPT dampens the increasing temperature
In the next step of this analysis, the impact of transient loads and system stability is investigated. Especially during the acceleration, an increasing EGT peak occurs due to the system’s inertia (see Figure 4). The reduced mass flow has an impact on the fuel to air ratio and therefore on the transient loads. Hence, the reduced mass flow
Furthermore, both effects have a significant impact on the surge margin. The degree of HPC/T deterioration are at the same level (see TSFC and EGT), but the SM of
Finally, the simplified combined engine model
The shift and throttle effect influence the engine performance in different ways. However, the modified compressor and turbine aerodynamics with further deteriorations such as a reduced leading/trailing edge, max. thickness and the resulting stagger angle are investigated in serval studies (Scharfenstein et al., 2013; Reitz et al., 2014; Ernst et al., 2016). These results exhibit that the positions of the characteristic curve (mass flow, pressure ratio and efficiency) are qualitatively and quantitatively dependents on the type of deterioration. Based on the results of engine
Conclusions and outlook
In this paper, the impact of combined deteriorated components in a turbofan jet engine has been investigated. The aerodynamics as well as the performance of the HPC and HPT of the V2500-A1 engine were simulated using RANS methods. The influence of degradation represented by increasing roughness in the HPC and tip clearance in the HPT on the performance maps was computed. The derived performance maps were used to simulate the overall performance of the jet engine. A simplified test procedure was used to analyse the impact of the deterioration on the steady and transient performance at different thrust levels and in transient load cases with ASTOR. The characteristic effects of the degradation on the performance can be summarised as follows:
TSFC and EGT can be used to identify the degree of deterioration
HPC surge margin and the deviation between transient and steady operating line have a significant difference for HPT and HPC deterioration.
Transient loads increase significantly for a combined deteriorated engine.
Steady and transient performance of a combined deterioration jet engine can be approximated by the coupling of the single deterioration jet engines.
A reduction of the HPC’s blade roughness and a recovery of the HPT tip clearance in a high bypass jet engine improves the engine performance significantly. Both isolated and combined degradation effects increase the specific fuel consumption and operating costs during the full manoeuvre. However, the recovery of the HPT in a combined deteriorated engine has a subordinate influence on the surge margin in the HPC. Nevertheless, transient loads can be reduced significantly by recovering only one domain. These results can be used to classify deterioration by evaluating steady and transient test cell data, improve safety limits and extend life cycles. Finally, the relevance to consider deterioration of engine components in transient operations was shown.
This investigation will be extended by the impact of deteriorated combustion chambers. Moreover, an individual pass off test of the instrumented IFAS in-house V2500-A1 jet engine with combustion chamber modifications will be performed and simulated with ASTOR. Furthermore, the impact of combined deterioration effects in one turbomachine on the overall transient performance and stability should be investigated.
Nomenclature
Capacity element
Thermodynamic accumulator
Capacity element for heat flow
Specific heat coefficient
Temperature rise
Pressure rise
Effort
Energy flow
Flow
Blade height
Turbulent kinetic energy, heat capacity ratio
ks
Sand roughness
Inertia element
Moment of inertia
Mass flow
Rotational speed
p
Pressure
Pressure ratio
Heat flow
Reduced value
Resistor
Gap
Time, total, total to total
Temperature
Efficiency
Engine
Torque, temperature ratio
Specific dissipation
ASTOR
AircraftEngine Simulation for Transient Operation Research
CAD
Computer-Aided Design
CFD
Computational Fluid Dynamics
Corr
Corrected
CRC
Collaborative Research Centre
DFG
German Research Foundation
DLR
German Aerospace Center
EGT
Exhaust Gas Temperature
IAE
International Aero Engines
IFAS
Institute of Jet Propulsion and Turbomachinery
HP
High-pressure
HPC
High-pressure compressor
HPT
High-pressure turbine
LP
Low-pressure
LPC
Low-pressure compressor
LPT
Low-pressure turbine
MRO
Maintenance, repair and overhaul
PCHIP
Piecewise Cubic Hermite Interpolating Polynomial
Pol
Polytropic
RANS
Reynolds-Averaged Navier-Stokes
ROM
Reduced Order Model
OL
Operating line
OP
Operating point
Sim. Com.
Simplified combined
SL
Surge line
SM
Surge Margin
SST
Shear Stress Transport
TSFC
Thrust specific fuel consumption