
Introduction
Flutter experiments have been conducted traditionally in sector or annular cascades in academic laboratories prescribing the harmonic motion of a single (Vogt and Fransson, 2006) or a set of airfoils (Bölcs and Fransson, 1986). The unsteady pressures on the airfoil and the aerodynamic work are the output of these experiments. Therefore, they can be regarded as purely aerodynamic experiments for the validation of aerodynamic codes (Fransson and Verdon, 1992). However, cascade testing suffers from several limitations. In the first place, sidewalls contaminate the signal in the instrumented blades (Corral and Gisbert, 2003), especially at high-speed, making the data difficult to use for code validation unless the whole cascade is modelled. Secondly, leakage in the hub is difficult to avoid due to the clearance needed to vibrate the airfoil. Additionally, leakage is difficult to measure and predict. Aside from the intrinsic experimental difficulties, this type of experiment lacks truly aeroelastic dynamics since the free interaction between the fluid and the structure is prevented.
Though many compressor and turbine forced response tests in a controlled environment can be found in the literature, dedicated flutter experiments are scarce because of the difficulty in predicting the final vibration amplitude of the test or its control. Groth et al. (2009) triggered flutter intentionally in a 1.5-stage supersonic turbine blisk and successfully matched the results with CFD predictions. Miura and Sakai (2019) could measure flutter in a rotating labyrinth seal in a dedicated test.
However, the solely dedicated turbine flutter experiment the authors are aware of is that performed by Corral et al. (2019) within the context of the European project FUTURE. An aerodynamically unstable rotor blade was designed to have a wide range of unstable operating points where flutter appears at several nodal diameters. Subsequently, it was tested, and the vibration amplitudes were measured using BTT. Additionally, the unsteady pressures due to blade vibration were recorded using flushed mounted unsteady pressure transducers. Moreover, the rotor was intentionally mistuned to control the rotor blade vibration amplitude. Very recently, a second testing campaign was conducted on a slightly different bladed-disk (Gallardo et al., 2022) where the number of blades and the tip shroud underwent minor modifications. The main objective of this second campaign was to investigate the effect of superimposing flutter and forced response and include under-platform dampers. Some tests performed in (Corral et al., 2019) for the baseline configuration without intentional mistuning were repeated in (Gallardo et al., 2022) with enhanced post-processing techniques. These are the results that are discussed thoroughly in this work.
Unsteady pressure transducers help study turbomachinery flutter because they can provide detailed information about the unsteady pressure fluctuations that occur on the surface of the blades or other components. By measuring unsteady pressure fluctuations, the frequency, nodal diameter, and amplitude of the rotor blade vibration components associated with flutter can be determined.
Turbomachinery is usually designed to be flutter-free. However, it has been shown that cantilever unstable LPT rotor blades can sustain Limit Cycle Oscillations (LCO) induced by flutter and saturated by dry friction in the attachment (Corral and Gallardo, 2006, 2008). The vibration amplitude of the airfoils is small enough to consider linear aerodynamics (Corral and Gallardo, 2014), but friction is dominated by micro-slip in the attachment, which is intrinsically nonlinear. Under these circumstances, the problem is not the determination of the stability threshold of the rotor anymore but its vibration amplitude, which is a problem that is far more complicated.
This work describes and discusses the influence of Mach number on low-pressure turbine blade flutter, analysing its impact on the vibration amplitude. The paper is organized as follows. First, the analytical relations between the Mach number, vibration amplitude, and unsteady pressure are introduced. Secondly, the experimental campaign is described briefly. Then the main experimental results are presented. Finally, the experimental results are compared with the predictions of the analytical relations. It is concluded that the Mach number strongly influences the energy balance between aerodynamic damping and friction damping, and that the vibration amplitude of LPT rotor blades increases with the Mach number.
Analysis methodology
Unstable LPT rotors can sustain limit cycle oscillations indefinitely if the vibration amplitude is low enough (Corral and Gallardo, 2006, 2008; Corral et al., 2019). In the final equilibrium state, the aerodynamic work-per-cycle of the airfoil,
The unsteady aerodynamics due to the vibration of the airfoil is linear. Hence the aerodynamic work scales with the square of the vibration amplitude of the airfoil,
and the problem consists of determining the expressions of coefficients
Aerodynamic work estimate
The aerodynamic damping of LPT airfoils can be reproduced using linearised aerodynamic models (Panovsky and Kielb, 2000). The aerodynamic damping in the present work has been computed using a well-validated linearised Navier-Stokes solver known as
The aerodynamic work at low-reduced frequencies (Corral and Vega, 2016a,b; Vega and Corral, 2016), such as those present in LPT flutter, can be expressed as
where
The dimensionless aerodynamic work-per-cycle
Therefore, the minimum aerodynamic damping and the exit Mach number are related as
though it must be stressed that, technically speaking, the sole true dependence on the Mach number, i.e. compressibility, is through the
Mechanical work estimate
An accurate estimate of the mechanical damping is paramount to determining the rotor blade vibration amplitude and the measured unsteady pressure. Material damping is much smaller than the dry friction in the rotor blade attachment, and can be disregarded safely in the modelling. Dry friction is a nonlinear mechanism responsible for the vibration amplitude saturation in unstable rotor blades (Corral and Gallardo, 2014). In this work, a heuristic approach used previously to predict the vibration amplitude of realistic rotor blades (Corral and Gallardo, 2006, 2008) will be employed to predict firstly the final saturated vibration amplitude of an aerodynamically unstable rotor and then the unsteady pressure perturbations generated due to the vibration. The primary hypothesis is that the normal stresses in the fir-tree contact area due to the pull load are very high. Therefore, the relative displacement between the rotor blade and the disk attachment is small.
Sellgren and Ollofson’s micro-slip model (Sellgren and Olofsson, 1999) assumes the contact surface has asperities and a certain roughness. The model relates the tensional state in the contact with the macroscopic displacement using laws different from Coulomb’s. The model describes analytically the hysteresis curves of the tangential force in the contact, F, during the preloading as
where the dimensionless displacement in the attachment is
where
The scaling of the mechanical work with an exponent greater than two is essential for the stabilization of aerodynamically unstable rotors.
Estimate of the vibration amplitude
The vibration amplitudes that appear in the aerodynamic damping,
Since the magnitude of the displacements in the fir-tree and and rotor blade tip are very different, it is convenient to express the mechanical work as a function of the alternate tangential force in the attachment,
However, if
The next step is to relate the alternate tangential force or stress at the attachement to the blade vibration. If the rotor blade is modelled as beam clamped in the attachment then the alternate moment, M is
where
where
Estimate of the unsteady pressure component due to flutter
In this work, flutter severity is measured using unsteady pressure transducers. It is, therefore, paramount to estimate the component of the unsteady pressure associated with flutter. In the low-reduced frequency limit, i.e.
The main conclusion is that the sensitivity of the unsteady pressure due to the exit Mach number is very high.
Experimental results
Wind-tunnel and rig description
An isolated shrouded high aspect ratio LPT rotor blade was tested in the CTA high-speed wind tunnel during 2022 (Gallardo et al., 2022). The rotor blade used in this second experimental campaign is similar to that described in Corral et al. (2019) and tested in 2011. The aerodynamic shape and the two-lobe fir-tree attachment with the disk used in both experimental campaigns are the same, but the blade count was reduced from 146 to 144 to ease the grouping of blades in packets. The tip-shroud of the rotor blade was designed to accommodate a rear magnet to excite the rotor in a separate in-vacuum test to characterise the damping of the bladed-disk. The two rotor blades are very similar from a dynamic point of view. A more thorough description of the test can be found in Corral et al. (2019) and Gallardo et al. (2022).
The experiment uses an isolated bladed rotor subject to the incoming conditions of the facility VIGVs, which are located more than ten chords upstream of the testing article. Therefore, the rotor blade is considered isolated and subject only to the weak perturbations associated with the blade-passing frequency of the upstream VIGVs, whose chord is about 50% longer than that of the rotor blade. The boundary layer generated at the inlet duct is sucked one chord upstream of the rotor to avoid unrealistic effects in the secondary flow vortex system. A general layout of the wind tunnel can be seen in Figure 1(left).
Figure 1.
Layout of the CTA wind-tunnel used for the experimental campaign (left), time and circumferential averaged Fourier transform of the unsteady pressure signals obtained for Ω = 103 % ρ = 100 % M e = 0.675 M e = 0.775 M e = 0.825
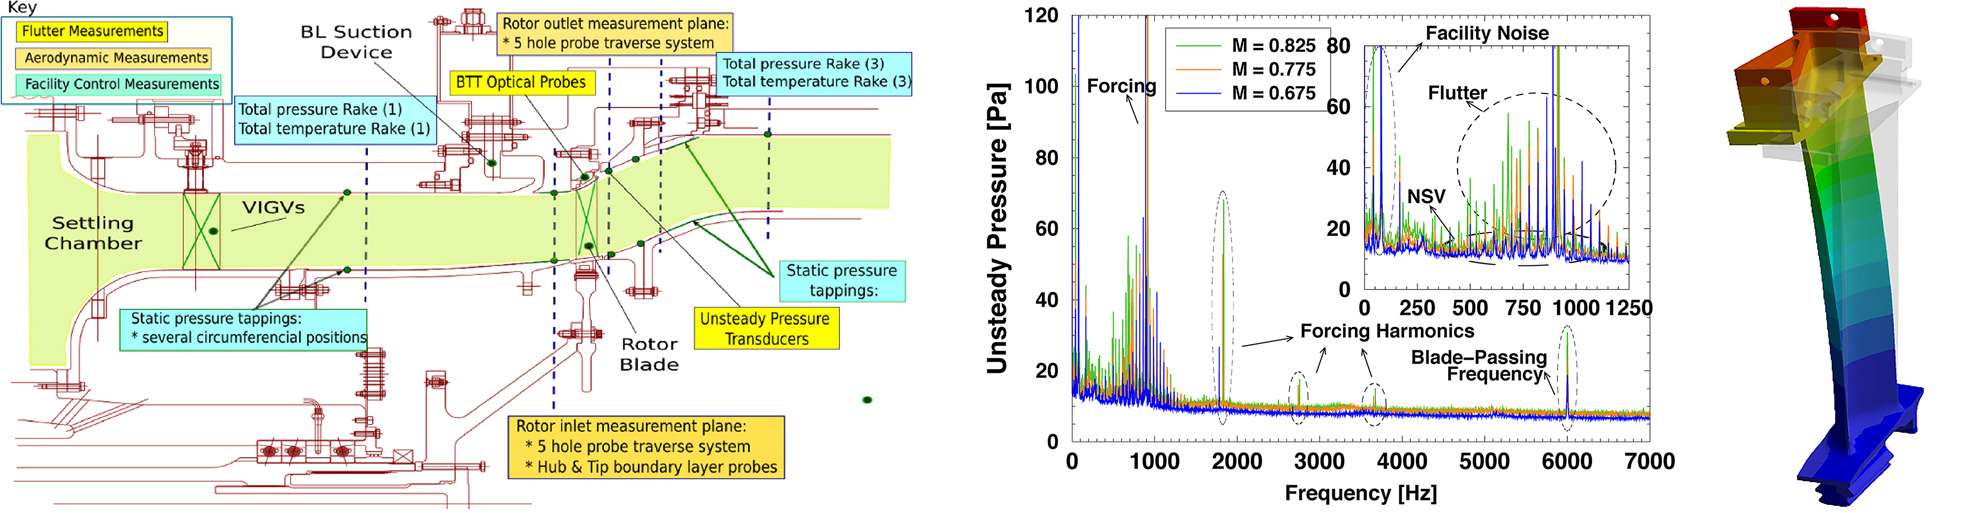
The instrumentation used to measure aerodynamics includes total pressure and total temperature rakes located at the inlet and outlet of the rotor. Inlet and outlet boundary conditions of the row were acquired using fast-response five-hole miniaturized probes that are radially and azimuthally traversed across a distance equivalent to several rotor pitches. Blade Tip-Timing (BTT) optical probes were installed in the outer casing, pointing radially to the rotor to measure the vibration amplitude of every individual blade. Finally, unsteady pressure transducers (Kulite XT-190M) were flush-mounted in the outer casing, one chord downstream of the rotor blade.
Unsteady pressure measurements
Unsteady pressure transducers are flush mounted in the outer casing, one chord downstream of the trailing edge of the rotor blade. Each pressure transducer records the unsteady pressure signal for 40 seconds with a sampling frequency of 25.6 kHz, which is much higher than the range of interest, that in this case, oscillates between 500 and 2,000 Hz. Pressure signals are segmented into one-second windows, Fourier transforms in time are performed on each window, and their Fourier coefficients are time-averaged. Afterward, Fourier transforms of different pressure transducers located at different circumferential positions are averaged to obtain the mean representation of the signal’s harmonic content.
The test matrix of the experimental campaign includes different intentional mistuning patterns, forcing mechanisms (using magnets on the tip-shroud of the blade), a wide range of rotational speeds, densities and three levels of exit Mach number. However, the present study has been carried out for the baseline configuration without magnets and without intentional mistuning patterns. Three different exit Mach numbers at different rotational speeds have been analyzed. Figure 1(center) shows the harmonic content of the unsteady pressure transducers for
The acoustic responses can be divided into different families depending on the source of the excitation. Figure 1(center) shows five families of peaks sorted from low to high frequency corresponding to facility noise, non-synchronous vibration whose source has not been identified, together with a strong forcing and its harmonics, flutter signals as a result of the blade vibration due to different unstable nodal diameters, and the blade-passing frequency.
Since the present paper aims to study the evolution of flutter peaks with the exit Mach number, the frequency range shown below is limited to the frequencies of interest for flutter, coinciding with the Doppler-shifted frequency of the unstable nodal diameters. Then, the vibration frequency in the stationary frame of reference is
in physical terms, the frequency separation between different flutter peaks is
Rotor blade design
Aerodynamic design
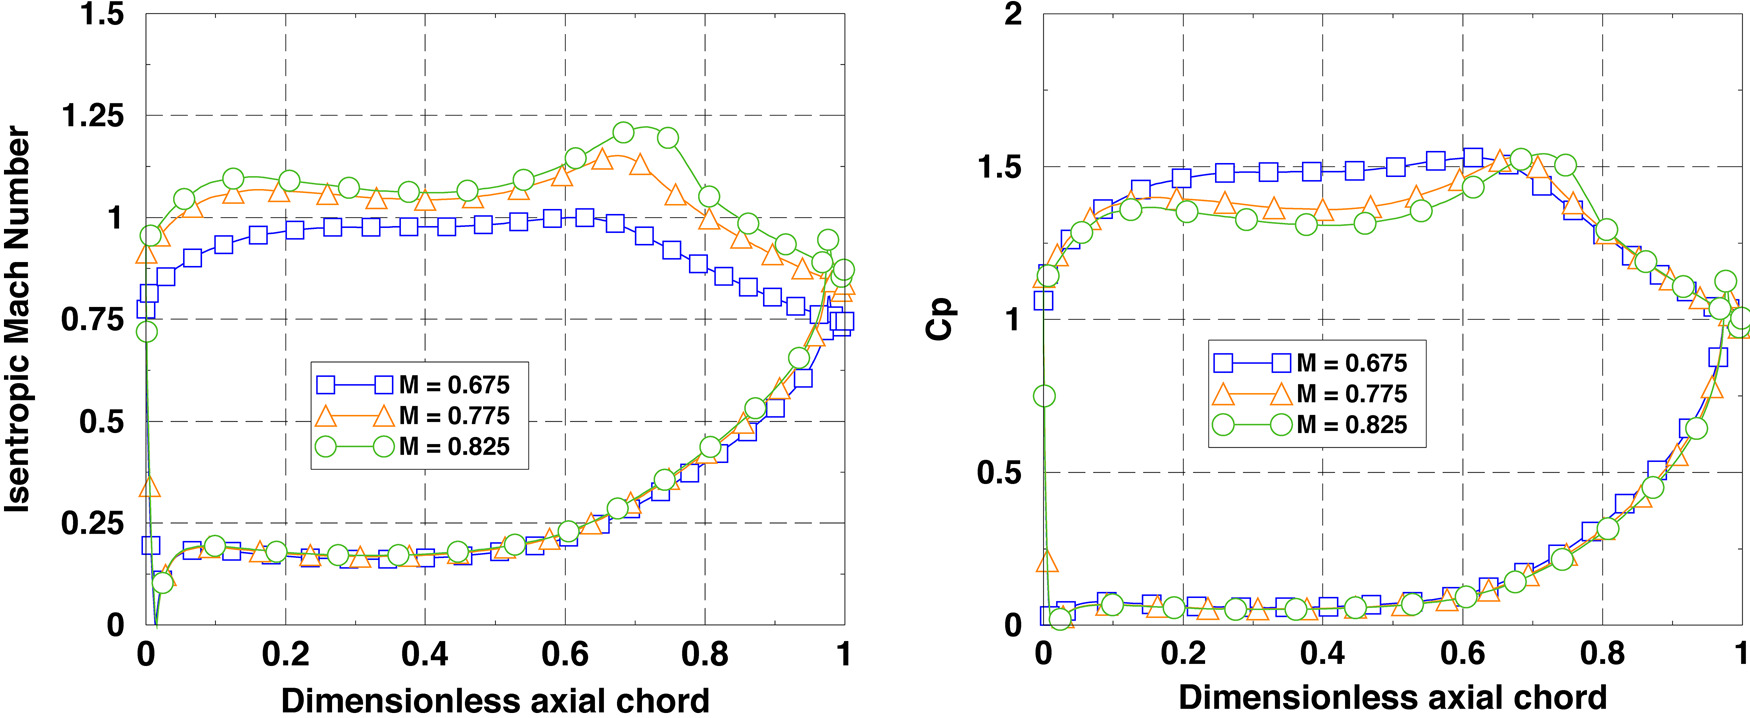
The rotor blade aerodynamic design is representative of an aeronautical low-speed LPT. The total deflection is about 100 deg, the lift coefficient of the blade sections is around 1, and the exit Mach number is high subsonic. In particular, the design intent of the 70% span section is given in Table 1, for more information, the interested reader is referred to Corral et al. (2019) and Gallardo et al. (2022).
Table 1.
Boundary conditions for the design intent of the 70% span rotor blade section.
| 0.42 | 0.75 |
Figure 2(left) displays the isentropic Mach number,
Aeroelastic design
The tested bladed disk consists of a disk stiff enough to ensure a small participation of the disk, except perhaps in the first four NDs. Figure 1(right) shows the first mode of the blade, which is a flap mode. It is well-separated in frequency for all the ND from the second mode to avoid interactions among them. The natural frequency of the first mode is about 186 Hz at design conditions, increasing slightly with the rotational speed.
The reduced frequencies of the first mode,
where
The critical damping ratio,
Figure 3.
CDR and CDR scaled with the exit static pressure and the inverse of M e 2 M ref = 0.625 Ω = 90 %
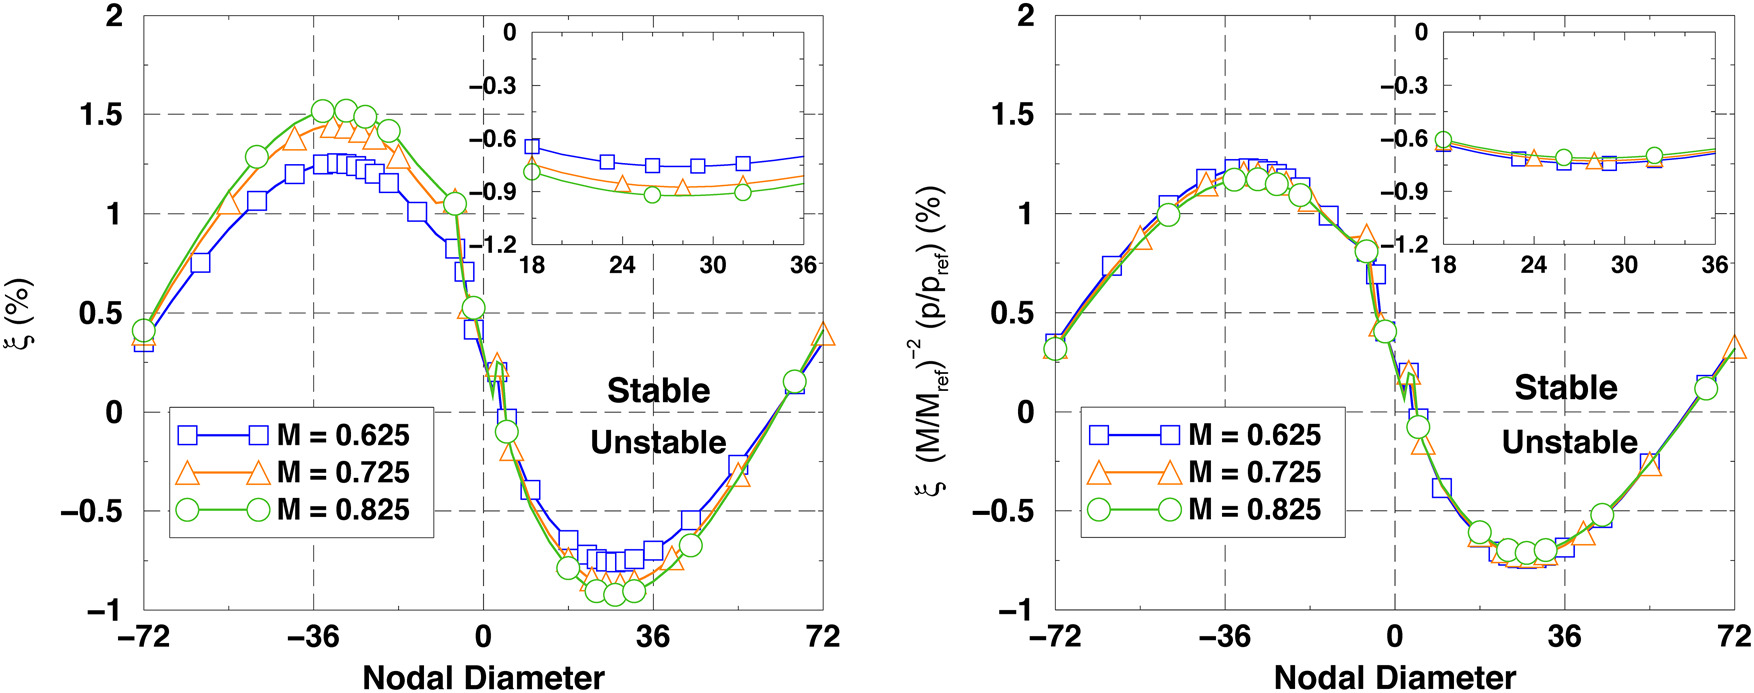
Figure 3(right) displays the critical damping ratio
Analysis of experimental results
Figure 4 shows the harmonic content of the flush-mounted unsteady pressure transducers for different shaft speeds and exit Mach numbers as a function of the ND. Only the NDs associated with flutter signals identified using a bladed-disk FE model are shown. All the peaks that do not correspond to a fluttering ND have been filtered out for the sake of clarity. The highest peak corresponds to the most unstable ND, which can be found in Figure 3 and is around
Figure 4.
Time and circumferential averaged Fourier transform of the unsteady pressure signals filtered to show the flutter-induced peaks for different exit Mach numbers.
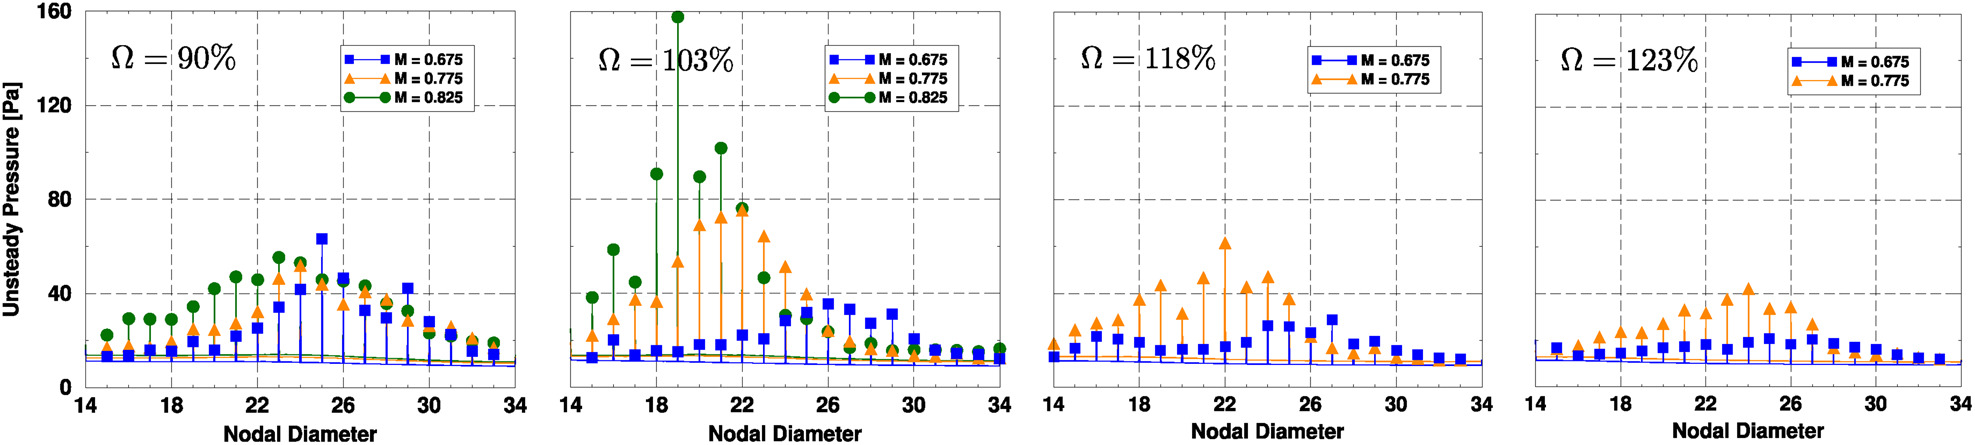
Several studies (Crawley and Hall, 1985; Kielb and Kaza, 1984; Martel et al., 2008) show that the effect of mistuning on flutter is beneficial since it tends to reduce the overall aeroelastic instability of the rotor. It has been shown analytically that the final state of a bladed disk with multiple unstable NDs contains only the most unstable ND (Corral and Gallardo, 2014). Natural mistuning is present in the tested bladed disk, and the measurements obtained in a ping test were reported in (Corral et al., 2019). The importance of mistuning is relative to the effect of aerodynamic forces, so if the dynamic head or the Mach number increase, the response of the system resembles more that of a tuned bladed-disk. Mistuning gives rise to sidebands of decreasing amplitude around the most unstable ND in the response, as shown in Figure 4. The sideband bands corresponding to the less unstable NDs are hardly distinguished since their amplitudes are very small and not detectable by the unsteady pressure transducers.
The experimental results show a variation of the most unstable ND with the exit Mach number changes, whereas the numerical predictions of the tuned aerodynamic damping indicate that the most unstable ND remains unaffected by the Mach number. This discrepancy is attributed to the presence of mistuning, an effect that has not considered in the numerical predictions. Therefore, the highest unsteady peak denotes that the blade is vibrating the highest in that particular ND, which changes with the exit Mach number due to natural mistuning. All the pressure perturbations induced by flutter are cut-off and their decay rate change from ND to ND, but the distance from the trailing edge of the rotor to the transducer is small; hence, the impact on the measured pressure amplitude is deemed small too.
Comparison of analytical and experimental results
The analytical results obtained with the model are compared to the experimental results in this section. Figure 5 shows the mean unsteady pressure as a function of the exit Mach number for different shaft speeds. The mean unsteady pressure is computed by subtracting the background noise from the 15 highest peaks and averaging them. The analytical trend is calibrated with the data at the highest available Mach number at each rotational speed. The Mach number at which the calibration is performed is appropriately labeled for each case.
Figure 5.
Mean unsteady pressure signal for different shaft speeds and Mach numbers compared to the trends obtained by the analytical model for each of the shaft speeds.
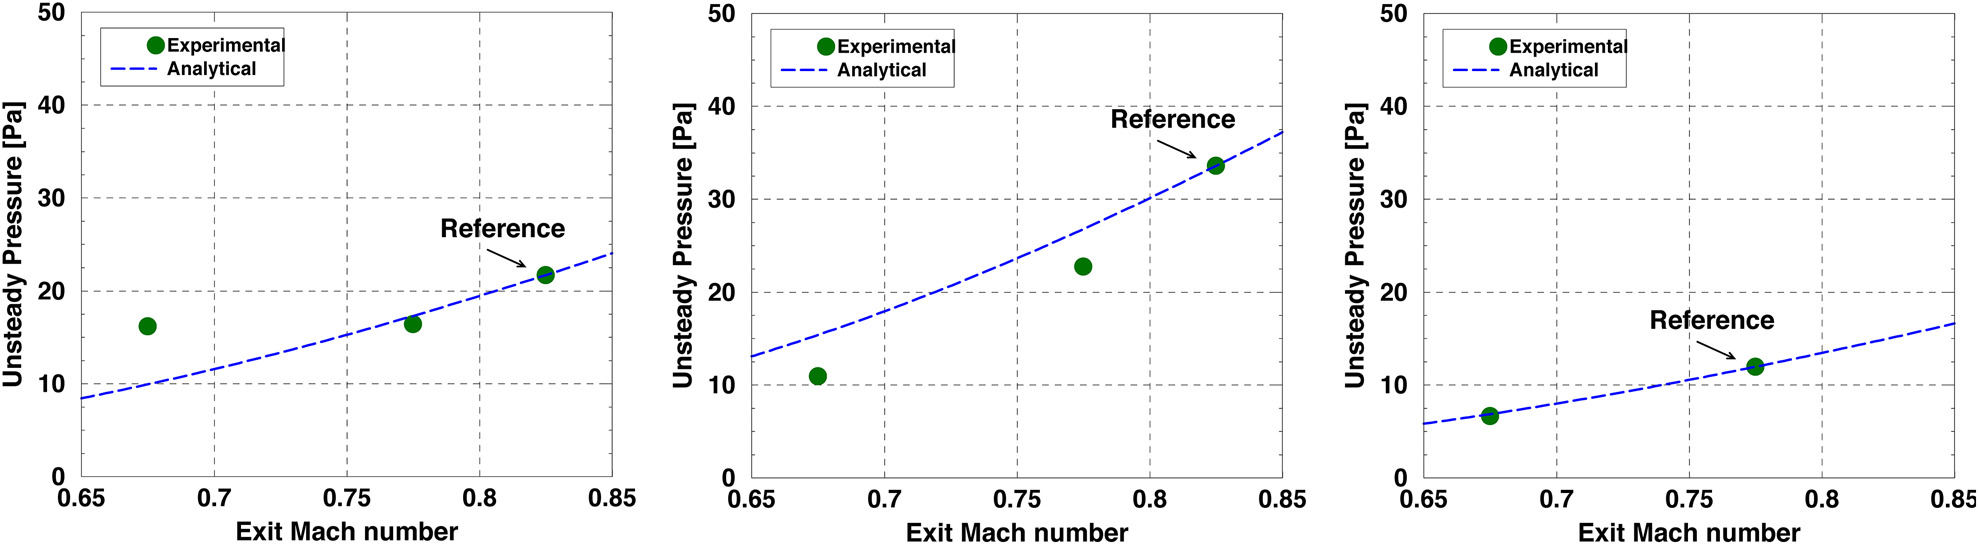
The dashed line in Figure 5 is computed using Equation (11) using
Concluding remarks
The unsteady pressure transducer data of a low-pressure turbine rotating rig have been post-processed to isolate the signals associated with flutter-induced vibration. The study is focused on the impact of the Mach number on the flutter severity though results are presented for several shaft speeds. The vibration amplitude variation with the shaft speed is involved and is not discussed in this work.
The aerodynamic damping characteristics of the rotor blade have been computed using a linearised Navier-Stokes solver. It is shown that a proper non-dimensionalization can absorb the impact of the Mach number on the critical damping ratio and that this scales as
The mechanical work is estimated using a simplified micro-slip model linked to an aerodynamic model to predict the rotor blade vibration amplitude. The vibration amplitude is then translated into unsteady pressure and compared to the experimental data. The exit Mach number was varied between 0.6 and 0.8, and within this range, significant variations on the unsteady pressure (and vibration amplitude) were found. The model predicted the unsteady pressure’s dependence on the Mach number.
Nomenclature
Speed of sound at the exit
BTT
Blade Tip Timing
Airfoil chord
CDR
Critical Damping Ratio
CTA
Centro de Tecnologías Aeronáuticas
E', G'
Elasticity and shear modules
IBPA
Inter-Blade Phase Angle
LPT
Low-Pressure Turbine
Modal mass
Mach number
Blade alternate moment
Nodal diameter
Exit static pressure
Inlet total pressure
Airfoil surface
Exit velocity
Work per cycle
Reynolds number
Greek symbols
Heat capacity ratio
Fir-tree vibration amplitude
Airfoil vibration amplitude
Friction coefficient or mass ratio
Penetration length in the contact
Density of air
Vibration angular frequency (rad/s)
Critical Damping ratio (%)
Shaft speed (%)