
Introduction
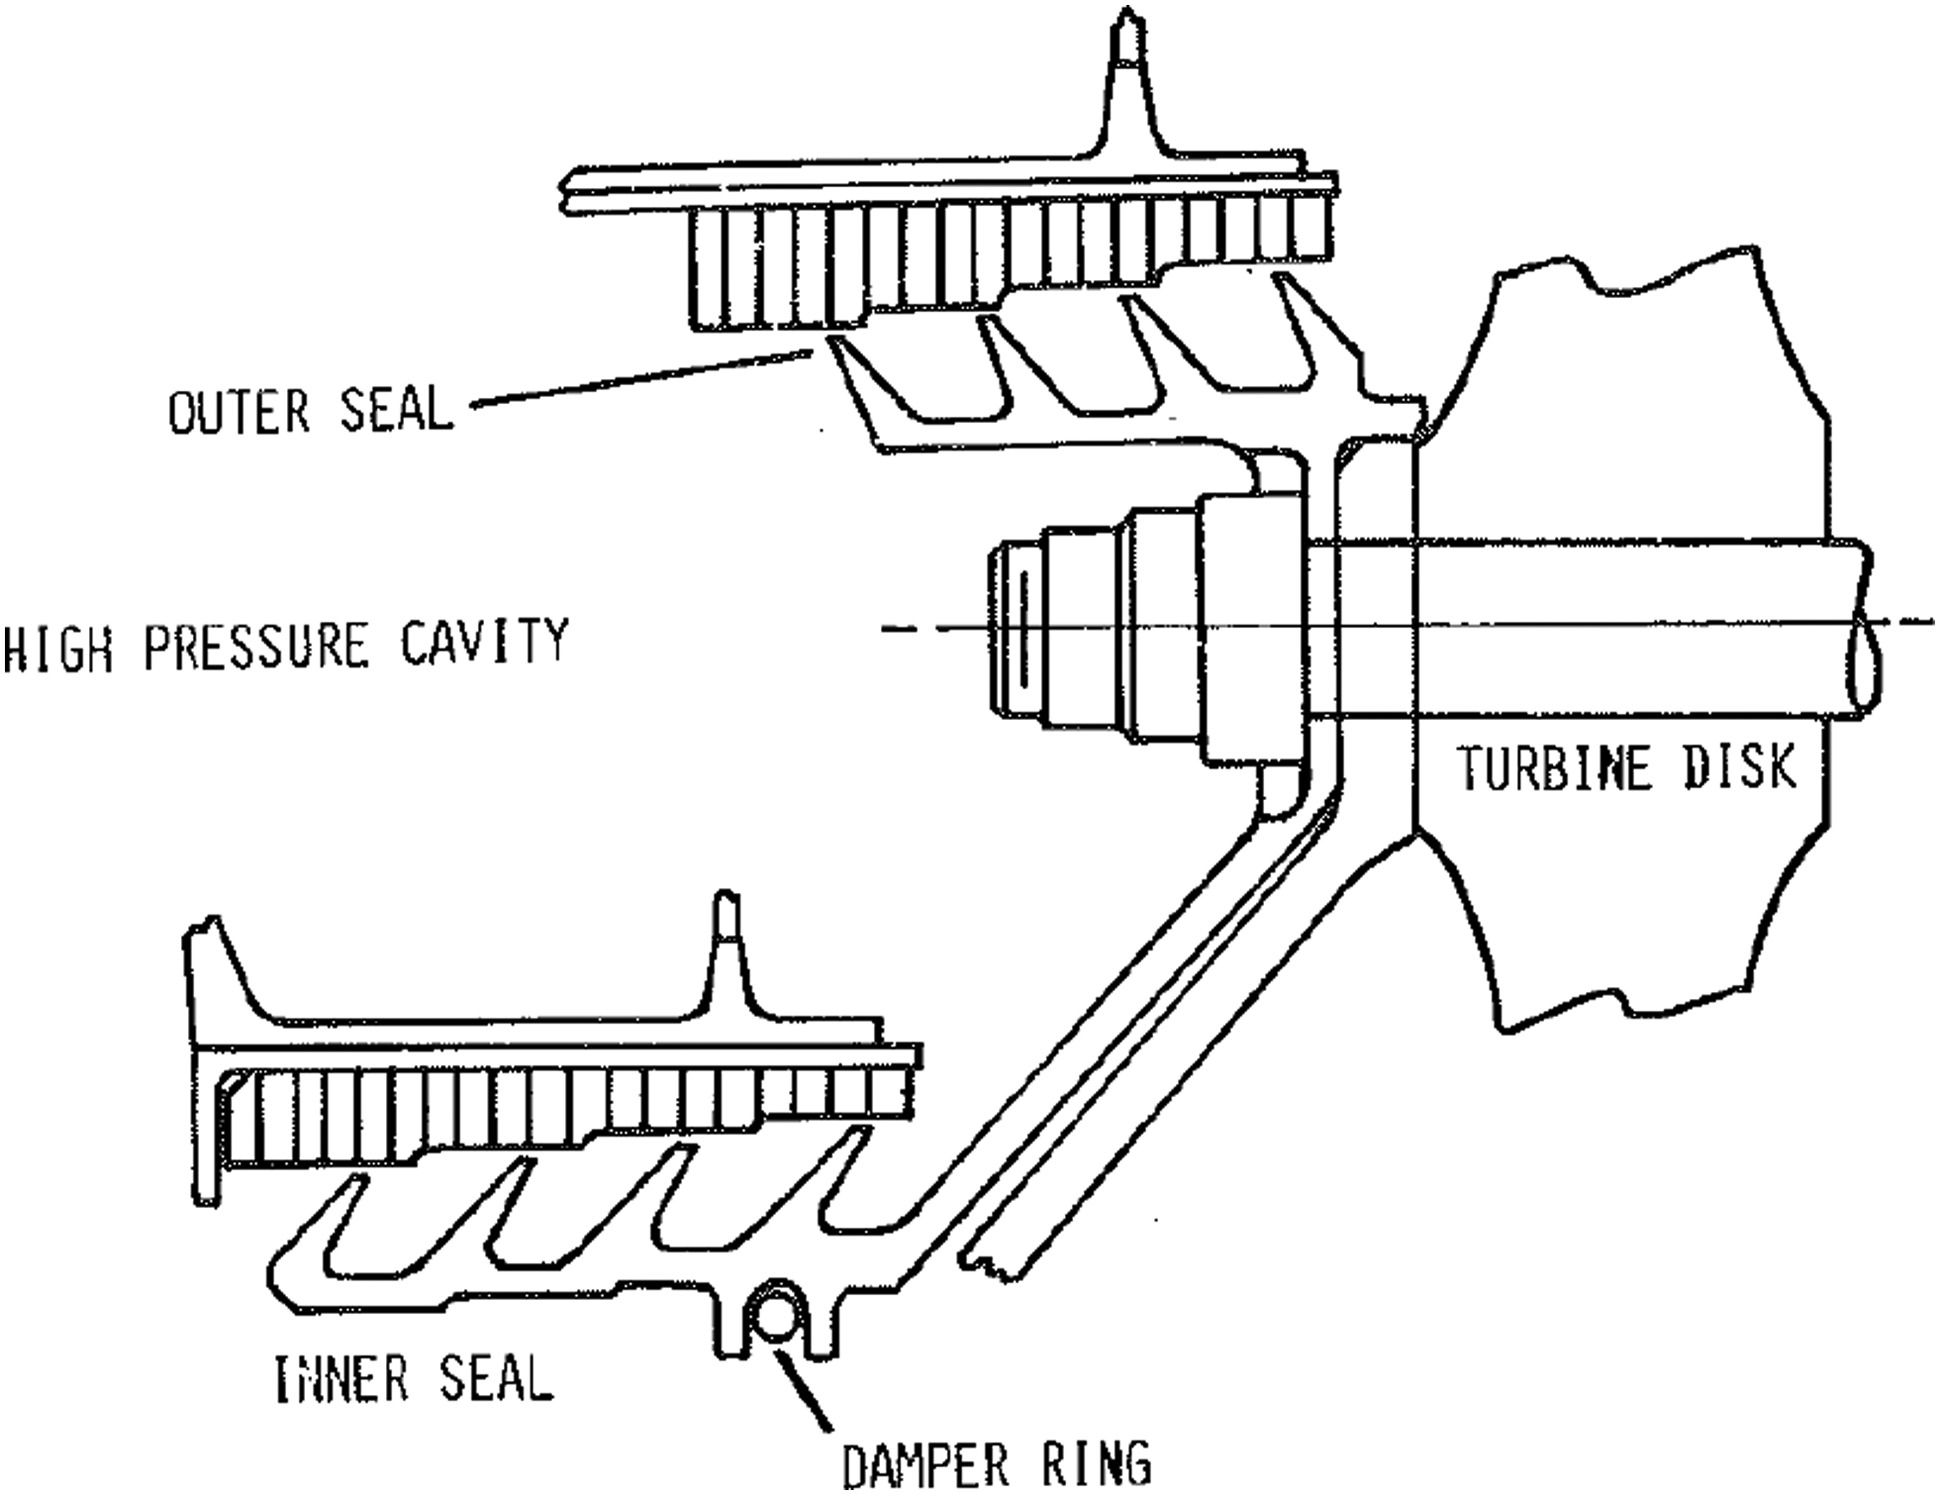
Labyrinth seals are commonly found in turbomachinery. They are comprised of one rotating and one stationary component. Together with the annular cavities which are formed by the coaxial rotor-stator cylindrical surfaces and a series of sealing fins, they keep the high and low pressure cavities separated. The sealing fins, or so-called teeth, grow radially outward from the rotor cylinder surface towards the stator (sometimes in a reverse direction when the fins are attached to the stator) and maintain a certain clearance in-between. A typical labyrinth seal configuration is shown in Figure 1. The members directly opposite to the fin tips (or knife edges) are usually coated with abradable and soft materials such as honeycomb structures. They are in place to accommodate the variable tip clearance during engine operation, especially when the two parts come into direct contact.
Labyrinth seals are primarily designed to isolate high and low pressure cavities and to serve as an interface between the rotor and stator. The sealing function is achieved by forcing the air flow to go through a series of fin tips, in a similar manner as throttled by orifices, and the kinetic energy is therefore dissipated. Being a sealing device and as the efficiency of the engine is meeting ever more stringent requirements, it is of paramount importance that the leakage flow is reduced to its minimum.
A brief review of the research conducted on labyrinth seal aeroelastic instabilities is presented in this section. Alford (1964) first addressed the problem of labyrinth seal flexural vibration and reported that labyrinth seals had encountered both resonance and self-excited vibrations, which eventually led to fatigue failures. For the non-resonance failures Alford noticed the important effect of seal support location on stability. Attempts were made to describe how the support location, either at flow entrance (high pressure) side or discharge (low pressure) side could affect the modulation of the flow during seal vibration, leading to unsteady pressure perturbations that could eventually contribute to instability. The research for seal flutter mechanism was not continued in Alford’s subsequent two papers (1967, 1975) yet mechanical damping solutions were provided. Ehrich (1968) developed a 1D model based on Alford’s hypothesis. A stability parameter and its accompanying criteria are proposed which is derived according to the geometric, structural and flow information of the cavity element.
Lewis et al. (1979) investigated the same problem during the development of F100 engines. Through extensive engine tests the instability was finally attributed to the tight clearance of the first (upstream) knife edge and by increasing the clearance the stability could be suppressed. An analytical model that includes the circumferential dimension is proposed in detail yet the instability in the failed design could not be predicted by the model. Abbott (1980) developed a similar analytical model as Lewis et al. The model was extended from Ehrich’s and accounted for the circumferential pressure variation within the inter-fin cavities. From experiments as well as analytical analysis, Abbott made a coherent and most interesting discovery that the mechanical frequency of the seal, or the rigidity, affects the stability characteristic in combination with the support location. The notion of a frequency ratio, essentially a comparison between the mechanical frequency of the seal structure and the acoustic wave frequency in the annular space, proved to be a useful parameter to describe and to characterize the stability curve. Approximately when the frequency ratio approaches one, the stability of the seals as described by aerodynamic damping would switch its sign, either for a high pressure support (HPS) or low pressure support (LPS) case.
Srinivasan et al. (1984) took the existing analytical analyses to a further step and included in the model the influence from both the stator and rotor, i.e. both members are considered flexible and vibrate in traveling wave modes with diametral nodes (previously only the rotor member is included). The effect of the swirl flow velocity within the annular cavity is also accounted for, which means that forward and backward traveling waves of the structures would interact differently with the flow and thus resulting in different aeroelastic behaviors.
Phibel et al. (2009) for the first time applied CFD techniques to labyrinth seal instability problems. A CFD code based on non-linear time accurate unsteady Reynolds-averaged Navier-Stokes equation is employed to determine the damping of the seal. A phase-shifted periodic boundary condition could be applied so that only a small sector of the complete annulus needs to be modeled in order to save computational cost. The configuration under study is a simplified model adapted from a large-diameter aero engine turbine labyrinth seal disk. In essence, the influence of the seal natural frequencies and the support location are studied. The acquired stability curve of a low pressure support configuration agrees well with Abbott’s criteria. Di Mare et al. (2010) furthered the study of Phibel et al. and applied a similar approach to seemingly two variant configurations of the same large-diameter aero engine labyrinth seal, but with detailed and realistic upstream and downstream cavity geometry. The final damping predictions were presented with reasonable comparison to testing.
Methodology
Numerical models
The numerical analysis is based on decoupled fluid-structure interaction and mainly consists of two parts, namely the cyclic symmetry modal analysis in ANSYS Mechanical™ APDL and unsteady CFD calculation in ANSYS CFX™.
For the structural model, considering the axisymmetric feature of the analyzed component (i.e., a complete rotor disk), only a small sector with cyclic symmetry was employed. On the other hand for the fluid model, a large enough sector is required with periodic boundary conditions in the circumferential direction to accommodate at least one complete wave length of the analyzed nodal diameter. In case of a 4ND mode for instance, a 90-degree sector must be made. Similarly for a 5ND mode the model must be 72 degrees or its multiples in sector angle and so forth. Hexahedral meshes are used for all cases.
The simplified model is designed to maintain the essential features of a labyrinth seal while having a clean geometry. The seal is cantilevered from one side and comes with three fins, forming two inter-fin cavities. The flow channel is essentially mirrored upside down, the thinking behind which is that by simply switching the inlet and outlet assignment a low pressure support configuration could be conveniently changed to high pressure support, with all other setups unaltered. This makes it an optimal test case to study the effects of support location of seal as proposed by both Alford and Abbott. The CFD grid is presented in Figure 2. Within the domain the entire right hand side is the stator member and the left side the rotor, separated by the inlet and outlet on the top or bottom of the domain (which are subjected to change in order to switch the support side of the seal). The boundary conditions and some key parameters for the baseline case in the fluid model setup are detailed in Table 1.

Convergence
Firstly a grid convergence study is conducted among four mesh configurations. The mass flow rates as normalized by the third configuration (chosen baseline case, marked in red) are presented in Figure 3 for the steady state results.
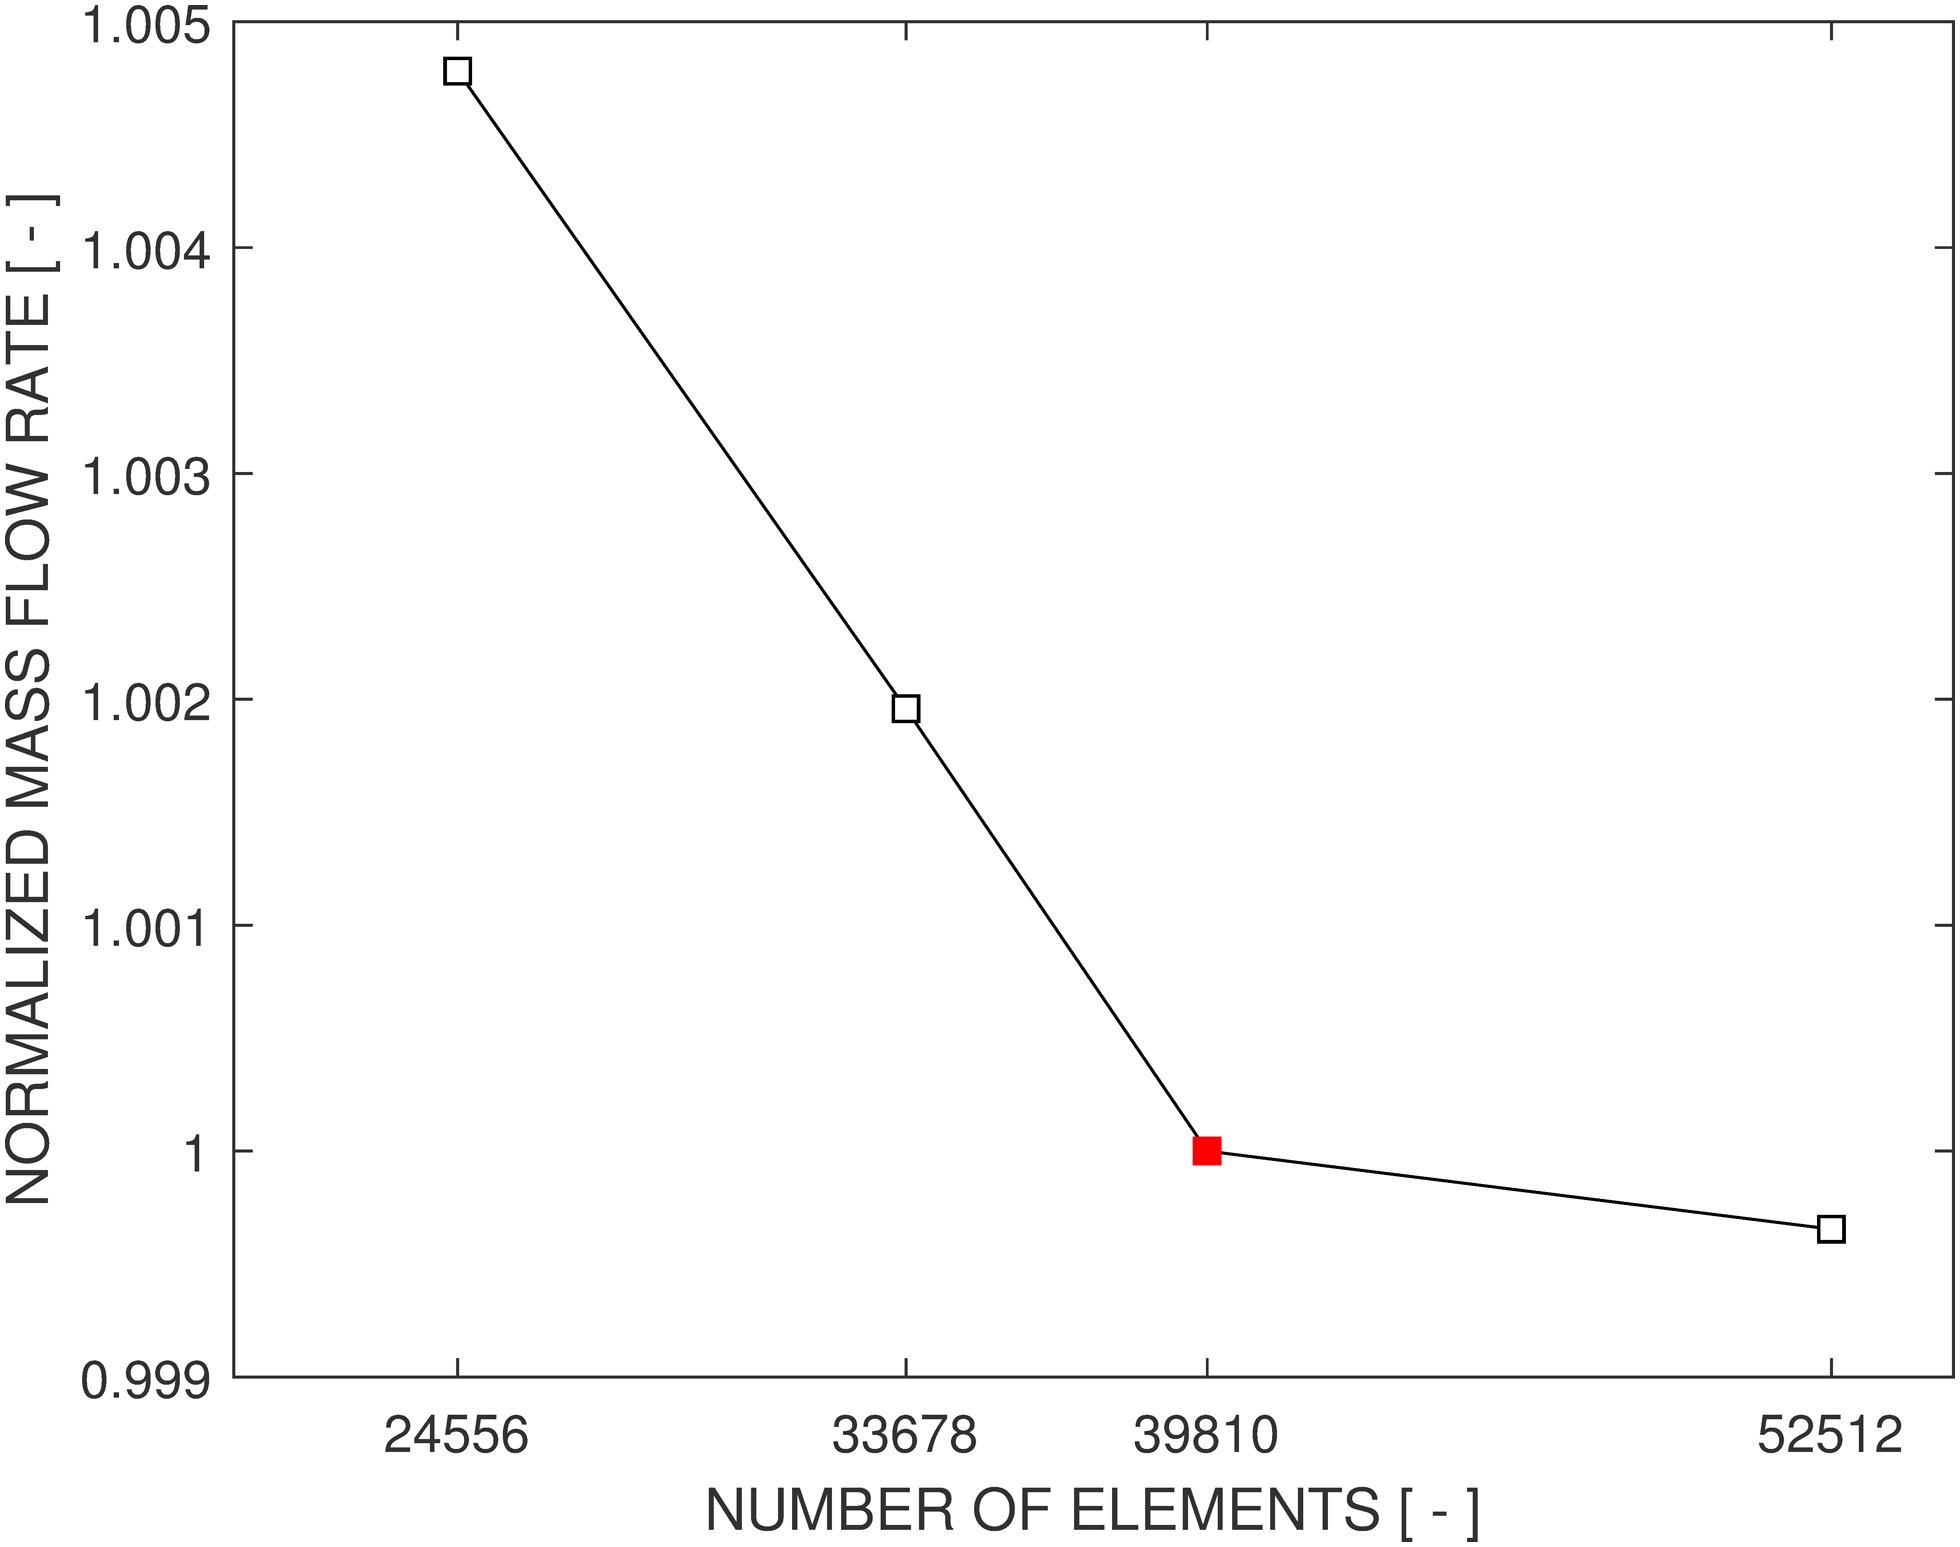
As the number of mesh points increase the mass flow rate is converging. Even the coarsest mesh has merely a 0.5% deviation of mass flow rate away from the baseline case. The meshes are refined in two aspects, namely the overall mesh density in the main flow channel and more importantly the mesh resolution across the seal fin tip clearance. For example the baseline case has a seal fin mesh resolution of 12 by 10, the former count being the number of cells along the knife edge of the fin tip in the flow (axial) direction, and the latter the radial cell resolution across the tip clearance between the rotor and the stator. Detailed mesh resolutions are listed in Table 2. As pressure (or nodal force) is ultimately used for aero damping estimation, the influence of mesh density on computed pressure is also plotted in Figure 4, which shows an acceptable grid convergence even for the coarsest one.
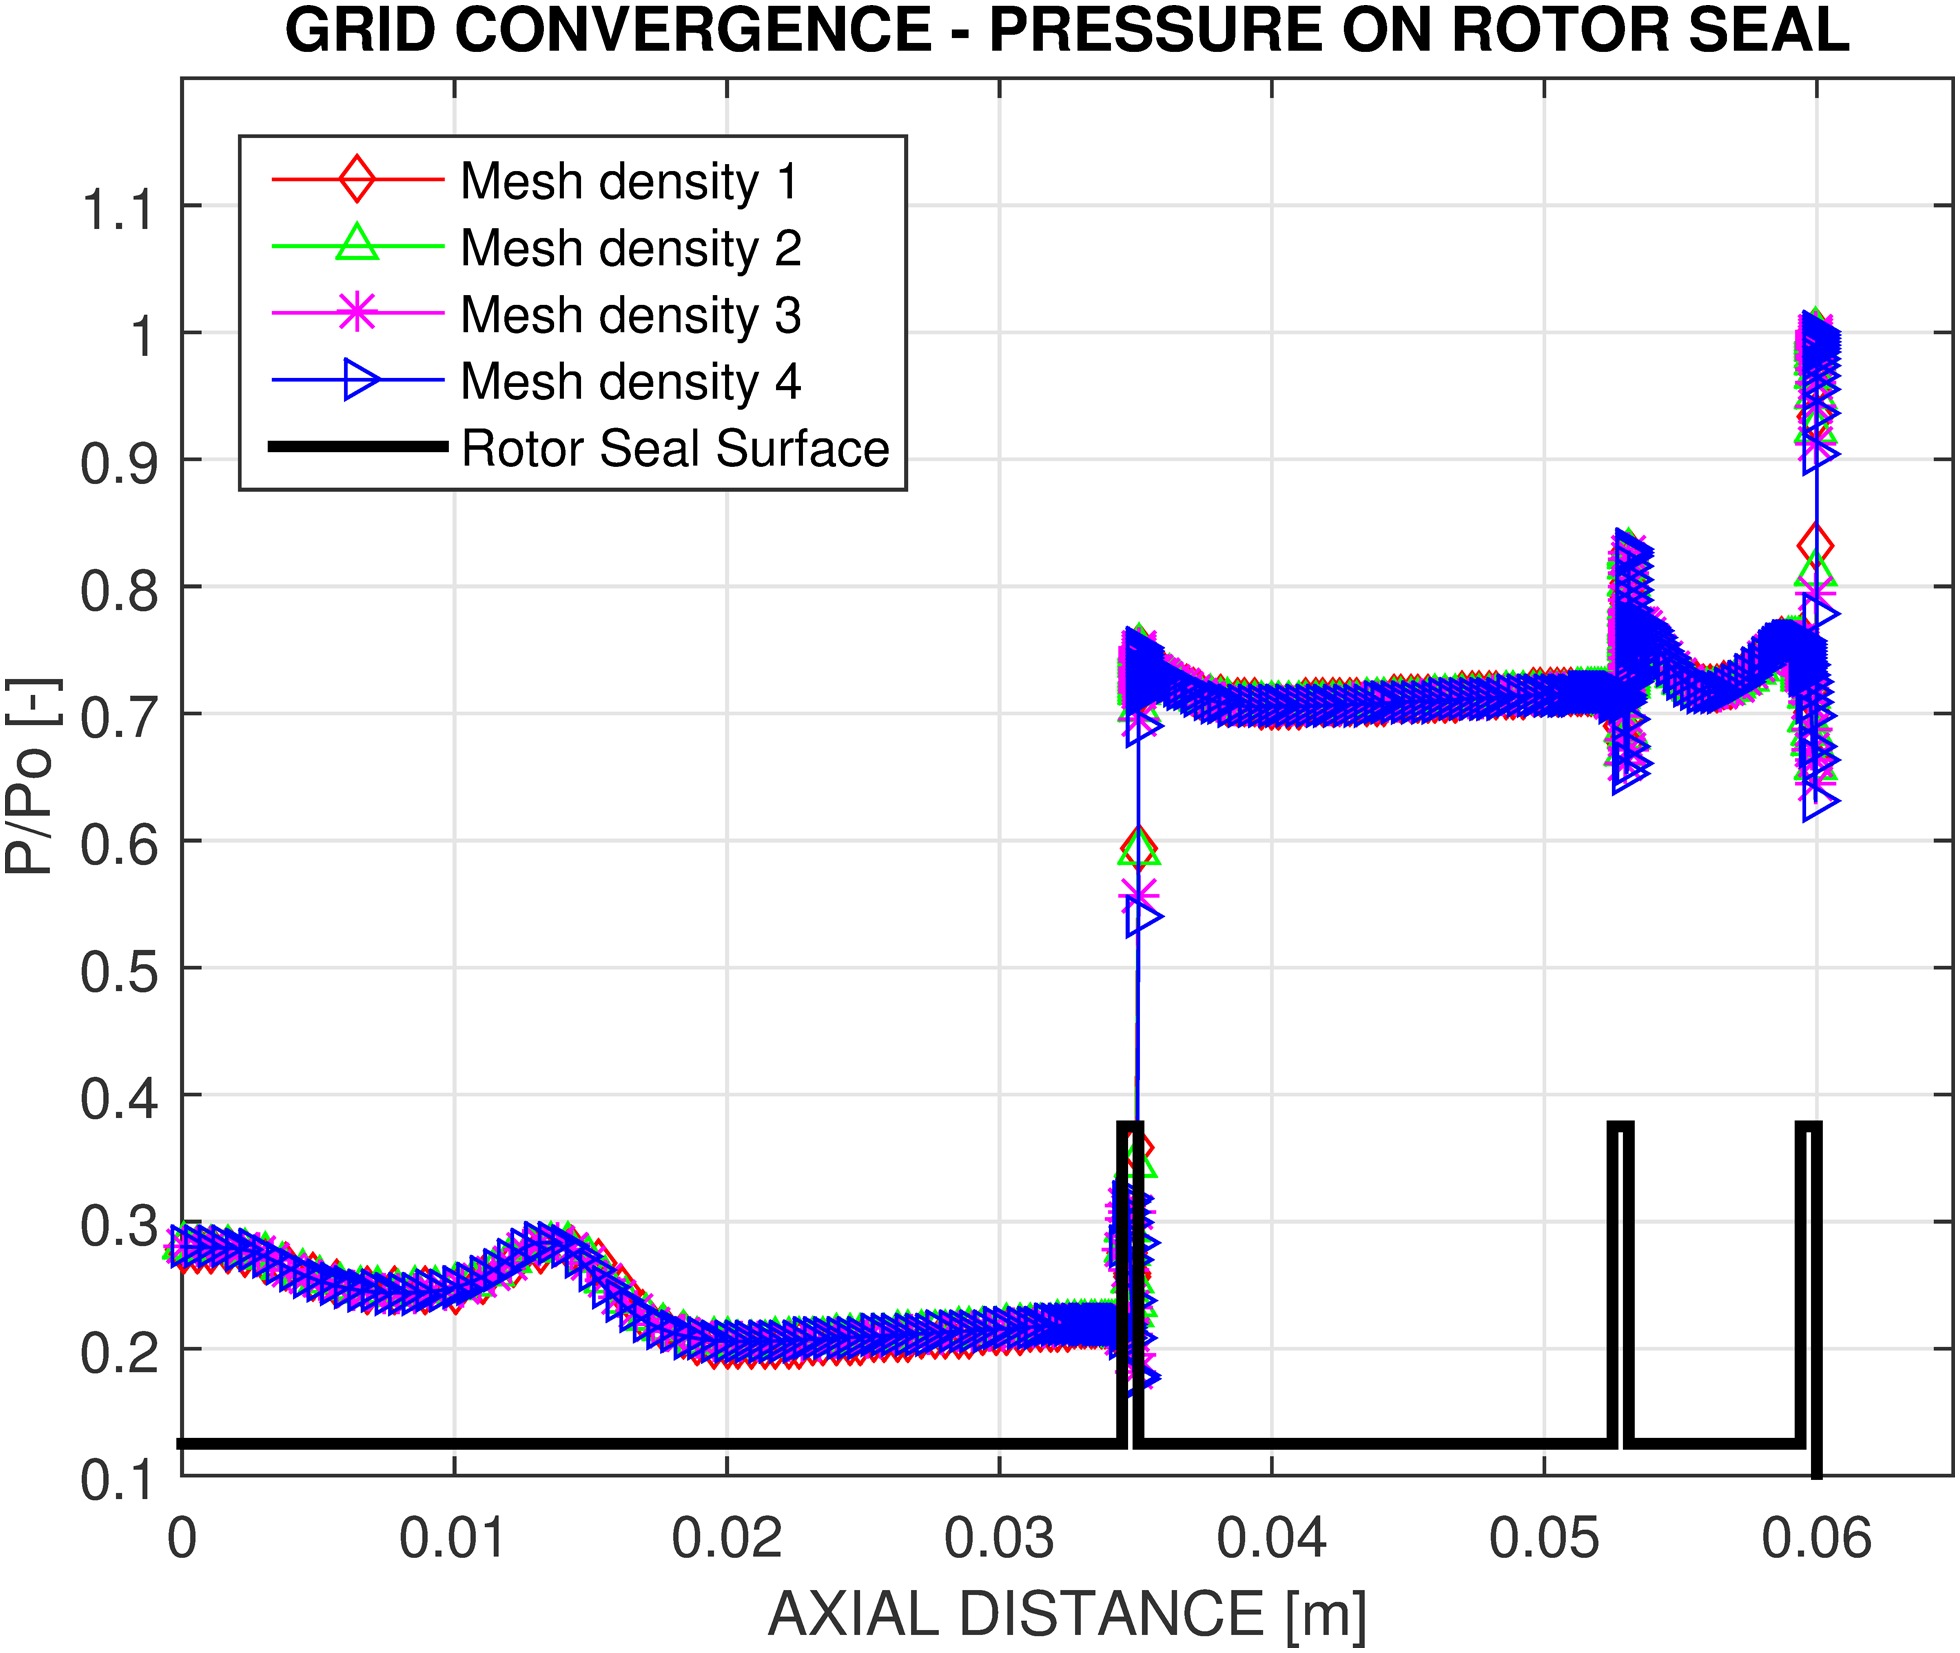
Table 2.
Grid configurations.
| Fin Tip Clearance | Number of Elements | |
|---|---|---|
| Mesh density 1 | 7 * 6 | 24,556 |
| Mesh density 2 | 9 * 8 | 33,678 |
| Mesh density 3 | 12 * 10 | 39,810 |
| Mesh density 4 | 12 * 12 | 52,512 |
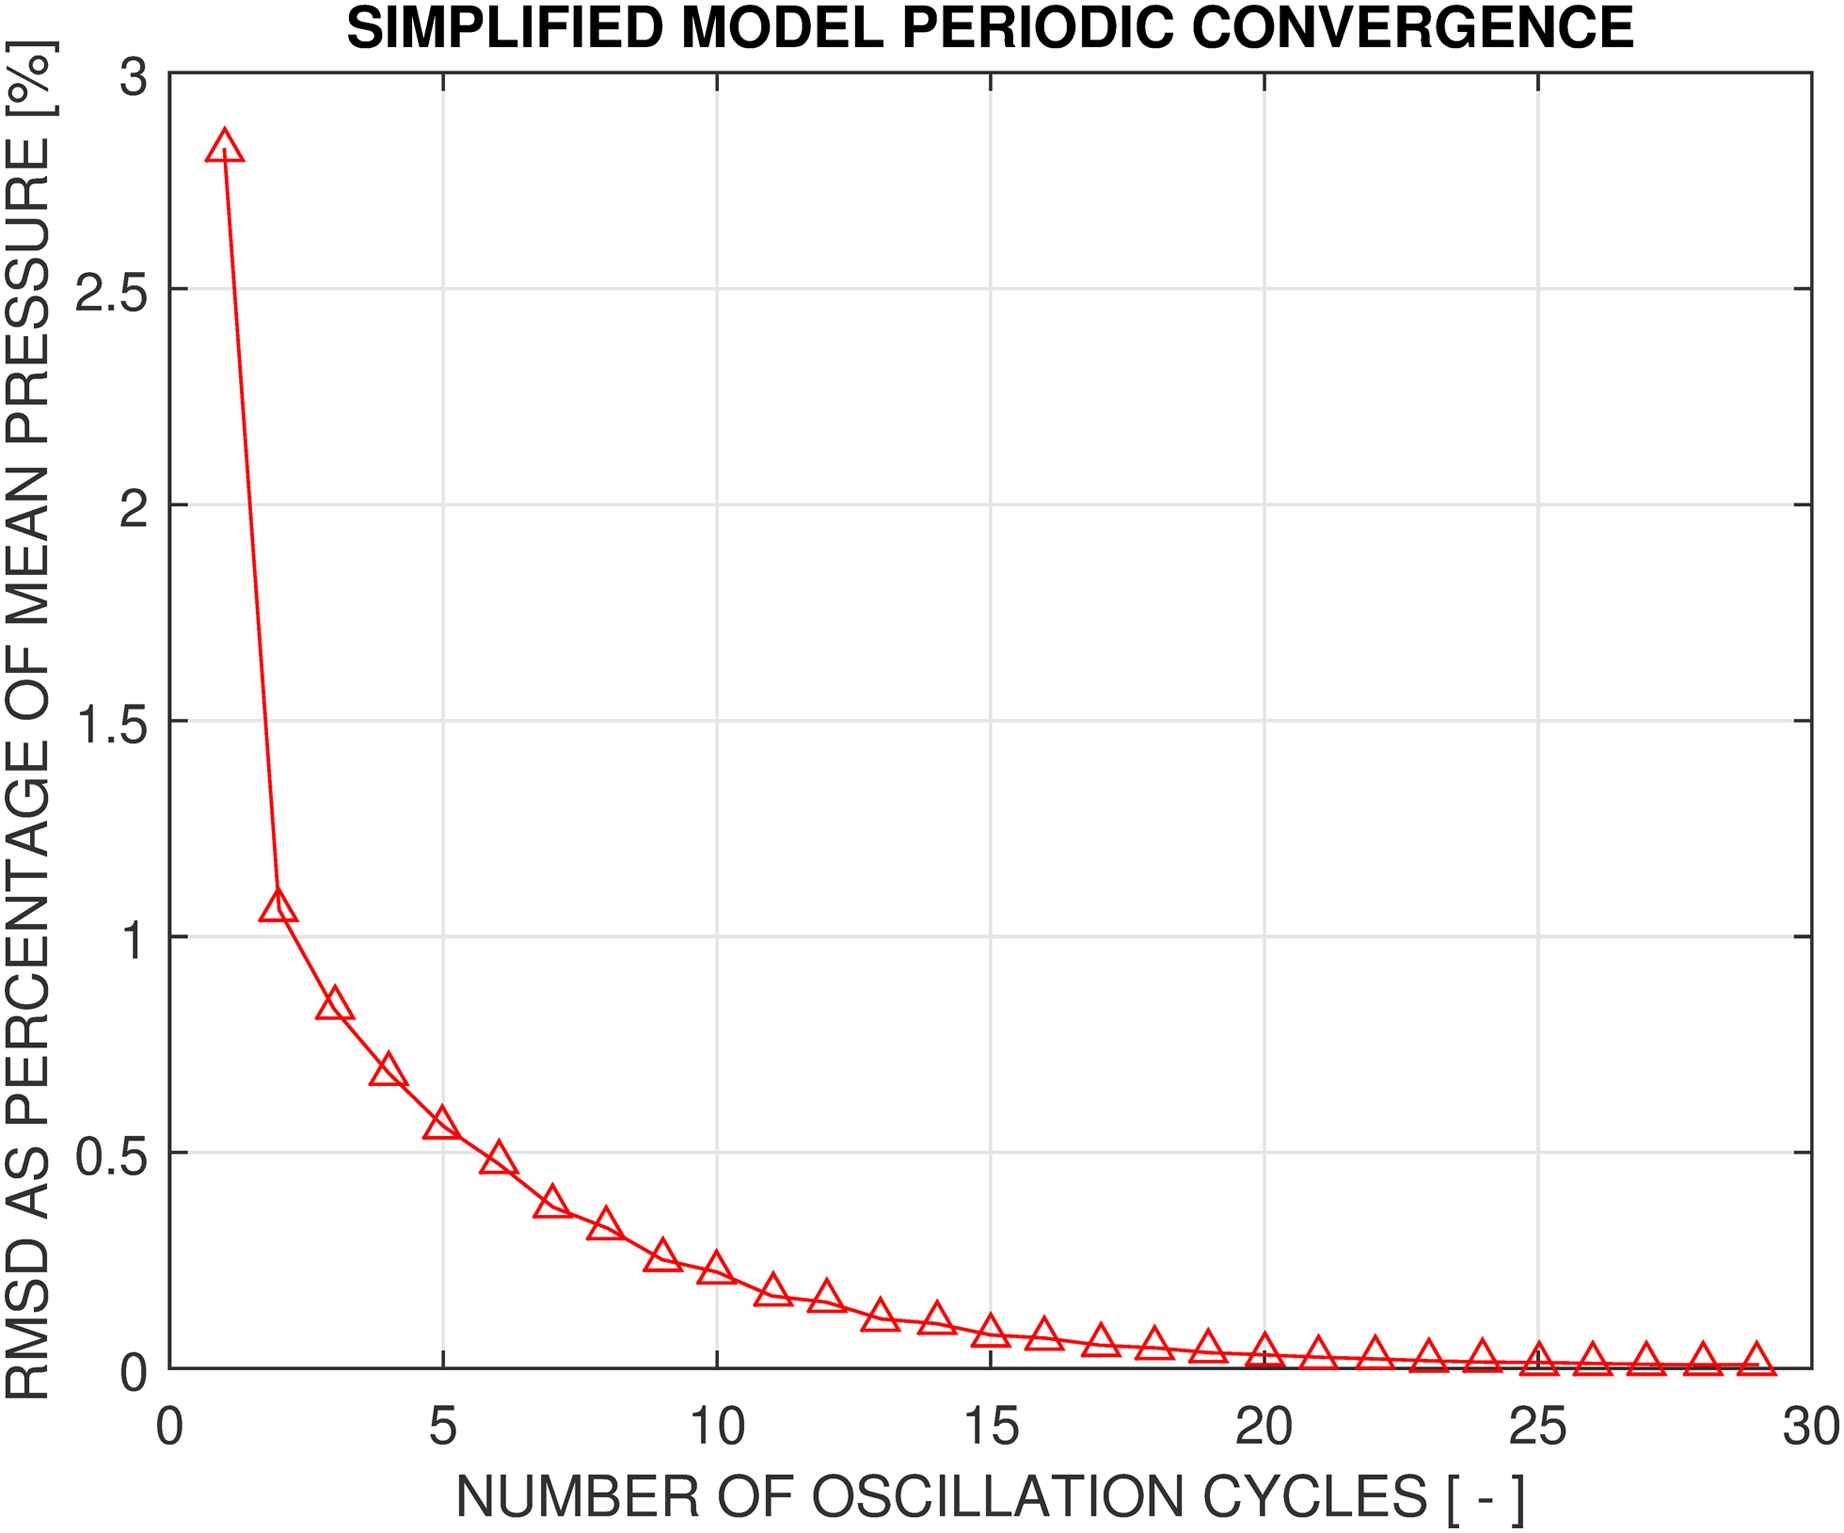
Some of the key numerical parameters are presented in Table 3. In particular for transient calculations, a reasonable choice of total simulation time will ensure a “stabilized” unsteady flow, i.e., a good transient periodic convergence. In order to check this, the baseline case of 4ND is first run for a relatively long time, encompassing in total 30 vibration cycles. Then the time history of pressure (on a selected monitor point) at each cycle is compared against the next one, and a percentage error could be calculated to assess the deviations. A normalized root mean square deviation of the errors for the entire 30 oscillation cycles is shown in Figure 5. At cycle number 29 the error is 0.009%, suggesting a very good periodic convergence. To strike a balance between the computation time and accuracy, the total simulation time is chosen as 16 oscillation cycles, which corresponds to an acceptable error of 0.07%.
Results and discussion
Effects of support side of seal
The support side of a labyrinth seal has a significant influence on its stability characteristics. Its combined effect with mechanical frequency is shown in Figures 6 and 7, representing an LPS and an HPS configuration respectively. In both cases the TWMs involved are 4 nodal diameter modes.
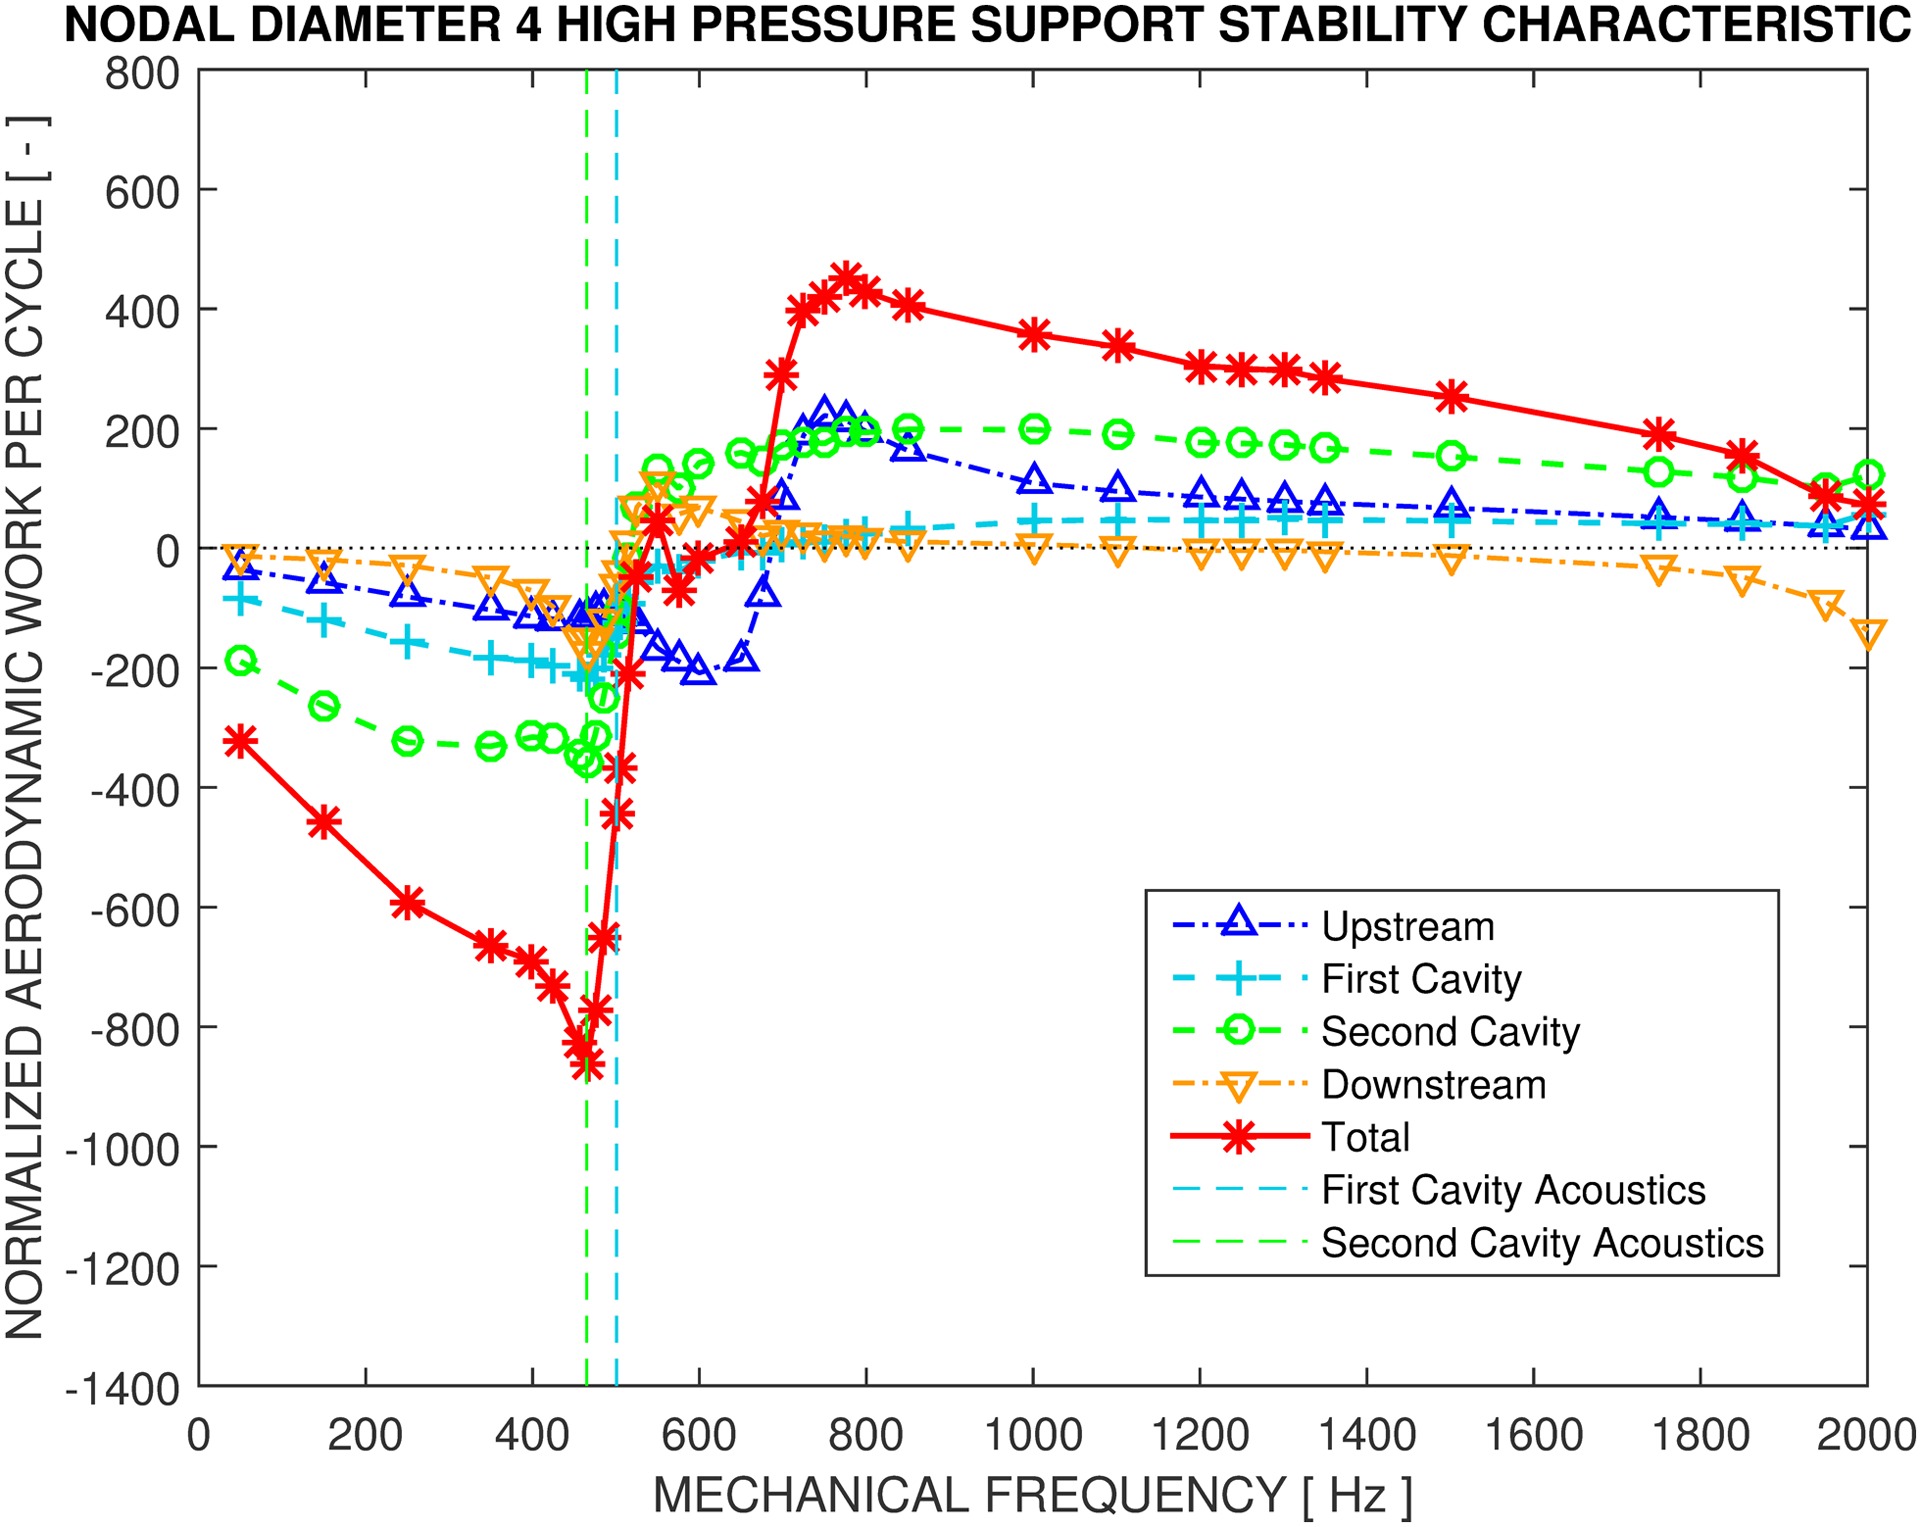

The charts could be interpreted as analogical to a frequency response, for which the mechanical or natural frequency of the seal structure is artificially varied from 0 Hz to 3,000 Hz in the same nodal diameter mode (4ND). The abscissa denotes the mechanical frequency and the ordinate represents the related normalized aerodynamic work per cycle as exerted on each part of the seal in 360 degrees, marked by different colors. The total work, which is a sum of all work contributions and which ultimately determines the stability of the entire structure, is marked with red asterisk. Two vertical dashed lines, one in blue and one in green, refer to the acoustic frequencies of the first and second cavity respectively.
The results of the LPS and HPS 4ND clearly affirm Abbott’s criteria. For an LPS configuration, approximately when the mechanical frequency is lower than the acoustic frequency, the overall work is positive, which means the flow is feeding energy into the structure and thus renders it unstable. When the mechanical frequency is above the acoustic frequency, the seal becomes stable. For the HPS case, the curves are to some extent mirrored to LPS but with distinct shapes.
It is also useful to examine the work contribution from each of the seal surfaces. For the LPS case, at first glance the curves representing the first and second cavity are behaving in a similar fashion, except that for the first cavity the work is always negative, even when the mechanical frequency is lower than the acoustic one. Hence among the two inter-fin cavities, only the second cavity exactly falls into the description of Abbott’s criteria, as is the case regarding the overall stability. The work characteristic on the upstream surface can also be deemed describable by Abbott’s criteria; meanwhile it is showing a distinctive peak during the sign switch near 600 Hz. The downstream surface could only be partially described by the criteria as when the mechanical frequency is over 1,000 Hz, the aerodynamic work per cycle is very close to the stability boundary and is not always negative. For the HPS case, the work characteristics from all surfaces are having a similar trend. Noticeably the major sign switch position of the upstream curve is shifted towards a higher frequency than the others. And no drastic peak features are found. The downstream work curve is still very close to the stability boundary for frequencies over 1,000 Hz. It is interesting to point out that in this HPS configuration the behavior of the first cavity could be well explained by Abbott’s criteria as opposed to the LPS configuration.
For the LPS case the high peaks near 600 Hz in the upstream curve are believed to be the direct result of an acoustic resonance phenomenon, which will also be discussed later. It is also believed that at the same range of frequencies the dents towards the stability boundary in the first and second cavity curves are affected by the same acoustic interference. This feature of the stability curves could not be observed in Abbott’s results, which is understandable since acoustic resonance is primarily dependent upon the specific geometries and the ambient temperatures and also Abbott’s criteria is mainly describing the aeroelastic behavior of the inter-fin cavities.
Overall, it is concluded that the majority of the work contribution comes from the inter-fin cavities, especially considering the small size of these cavity surfaces compared with the upstream and downstream ones. Therefore Abbott’s criteria could be readily applied to these inter-fin cavities in the same way as applied to the entire seal structure. This observation holds true with the exception of the first cavity for the LPS case.
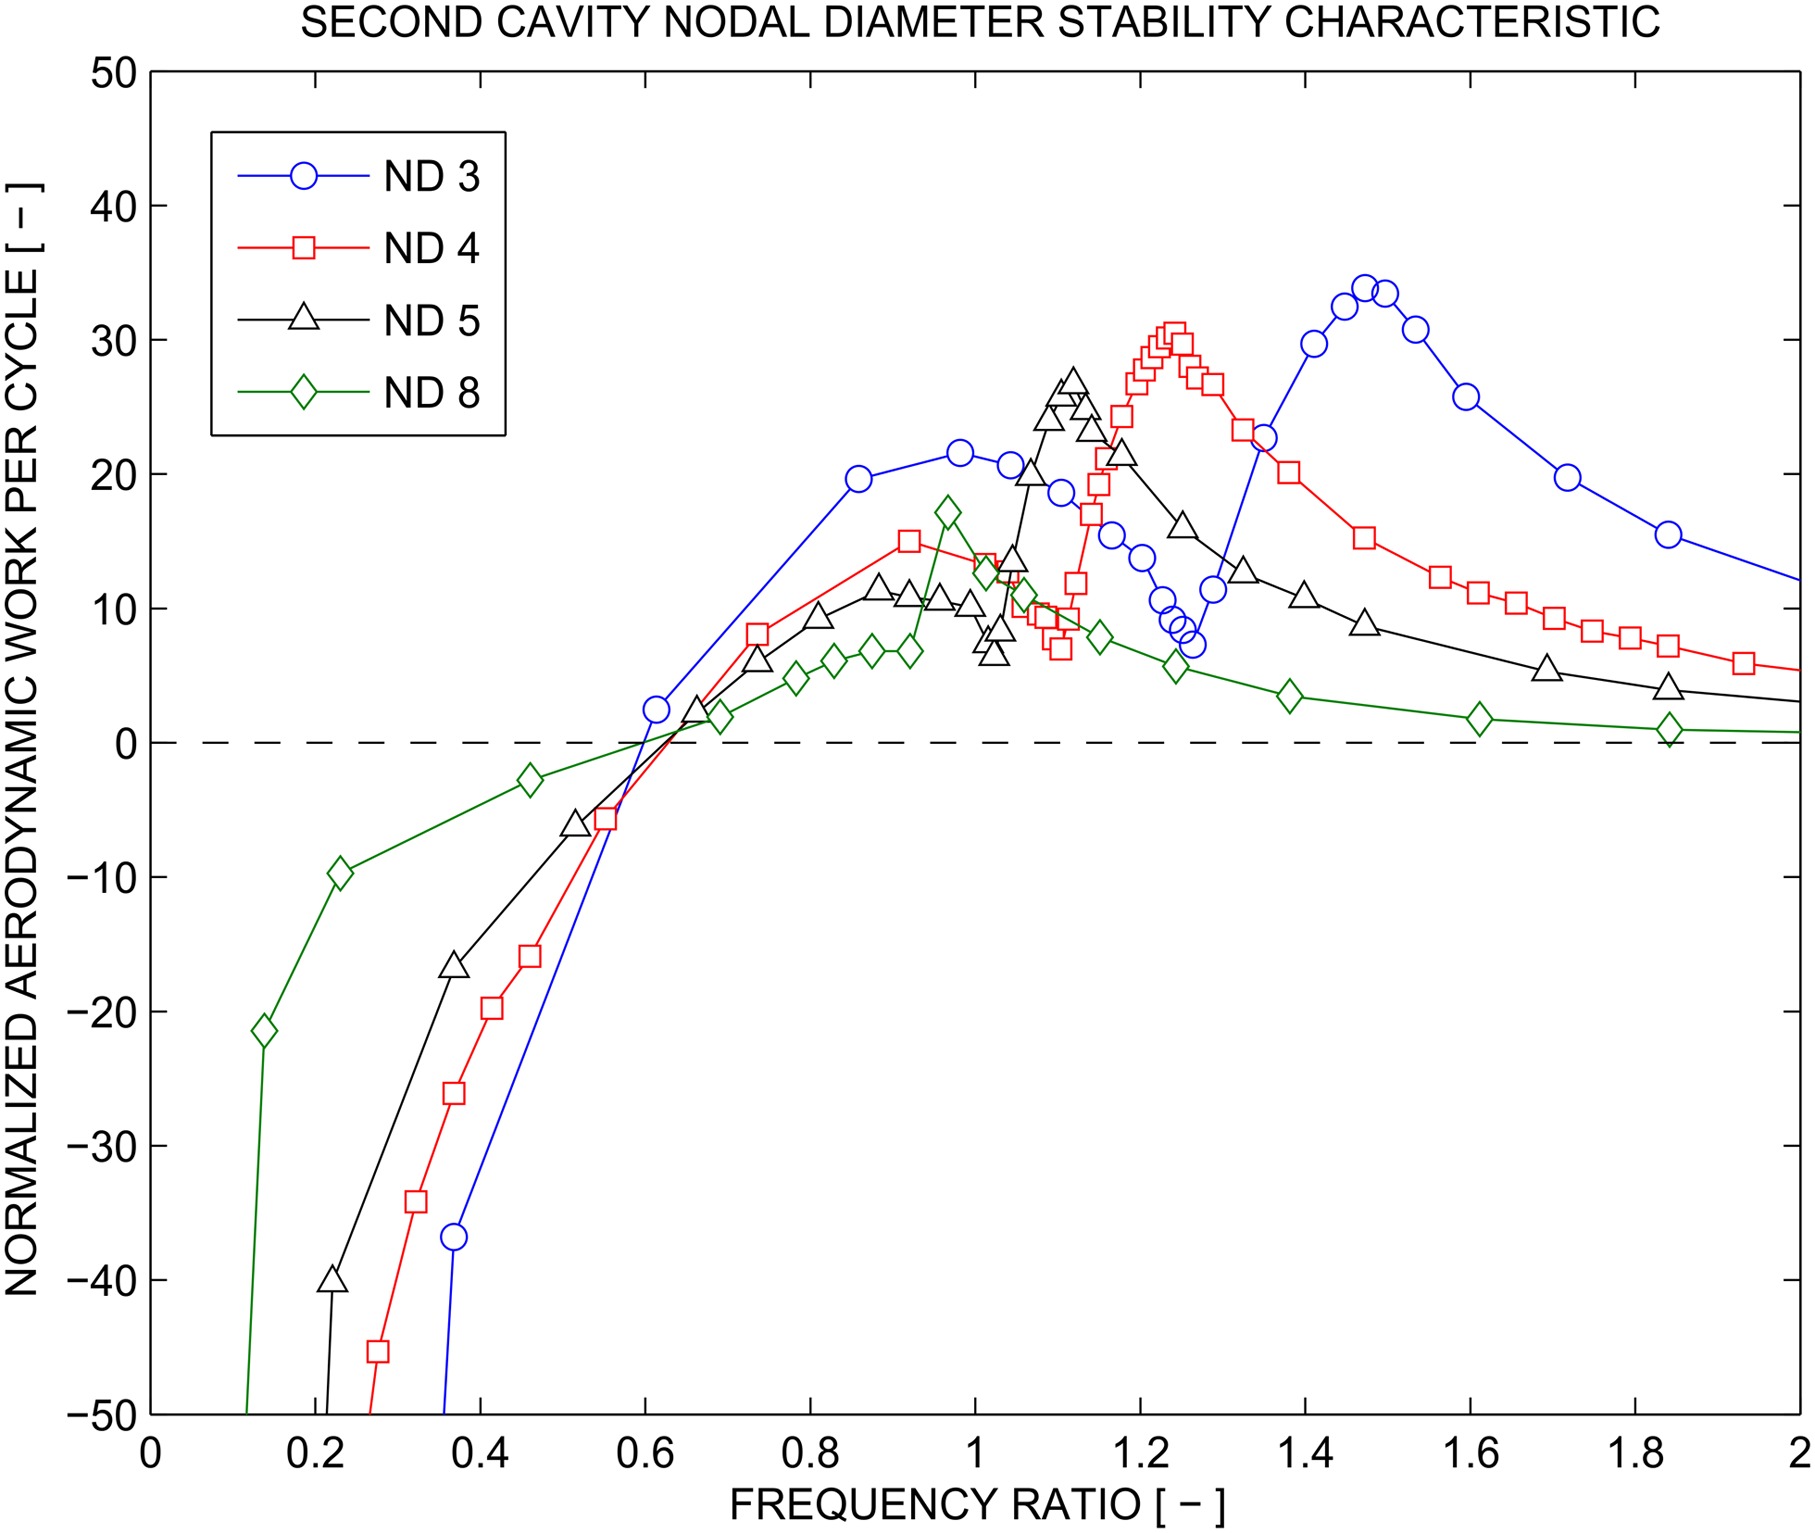
Effects of nodal diameter
A parametric study of nodal diameter’s effect on stability is shown in Figure 8 for the LPS cases, expressed in percentage LogDec. The curves are the interpolation of discrete data points. Six nodal diameter scenarios are checked, from 0ND all the way up to 36ND. It should be noted that across the different nodal diameters the same maximum deflection of the structure is maintained. This is to make sure that all results are comparable against each other since at this stage it is not yet clear if this type of seal flutter phenomenon exhibits linear behavior.
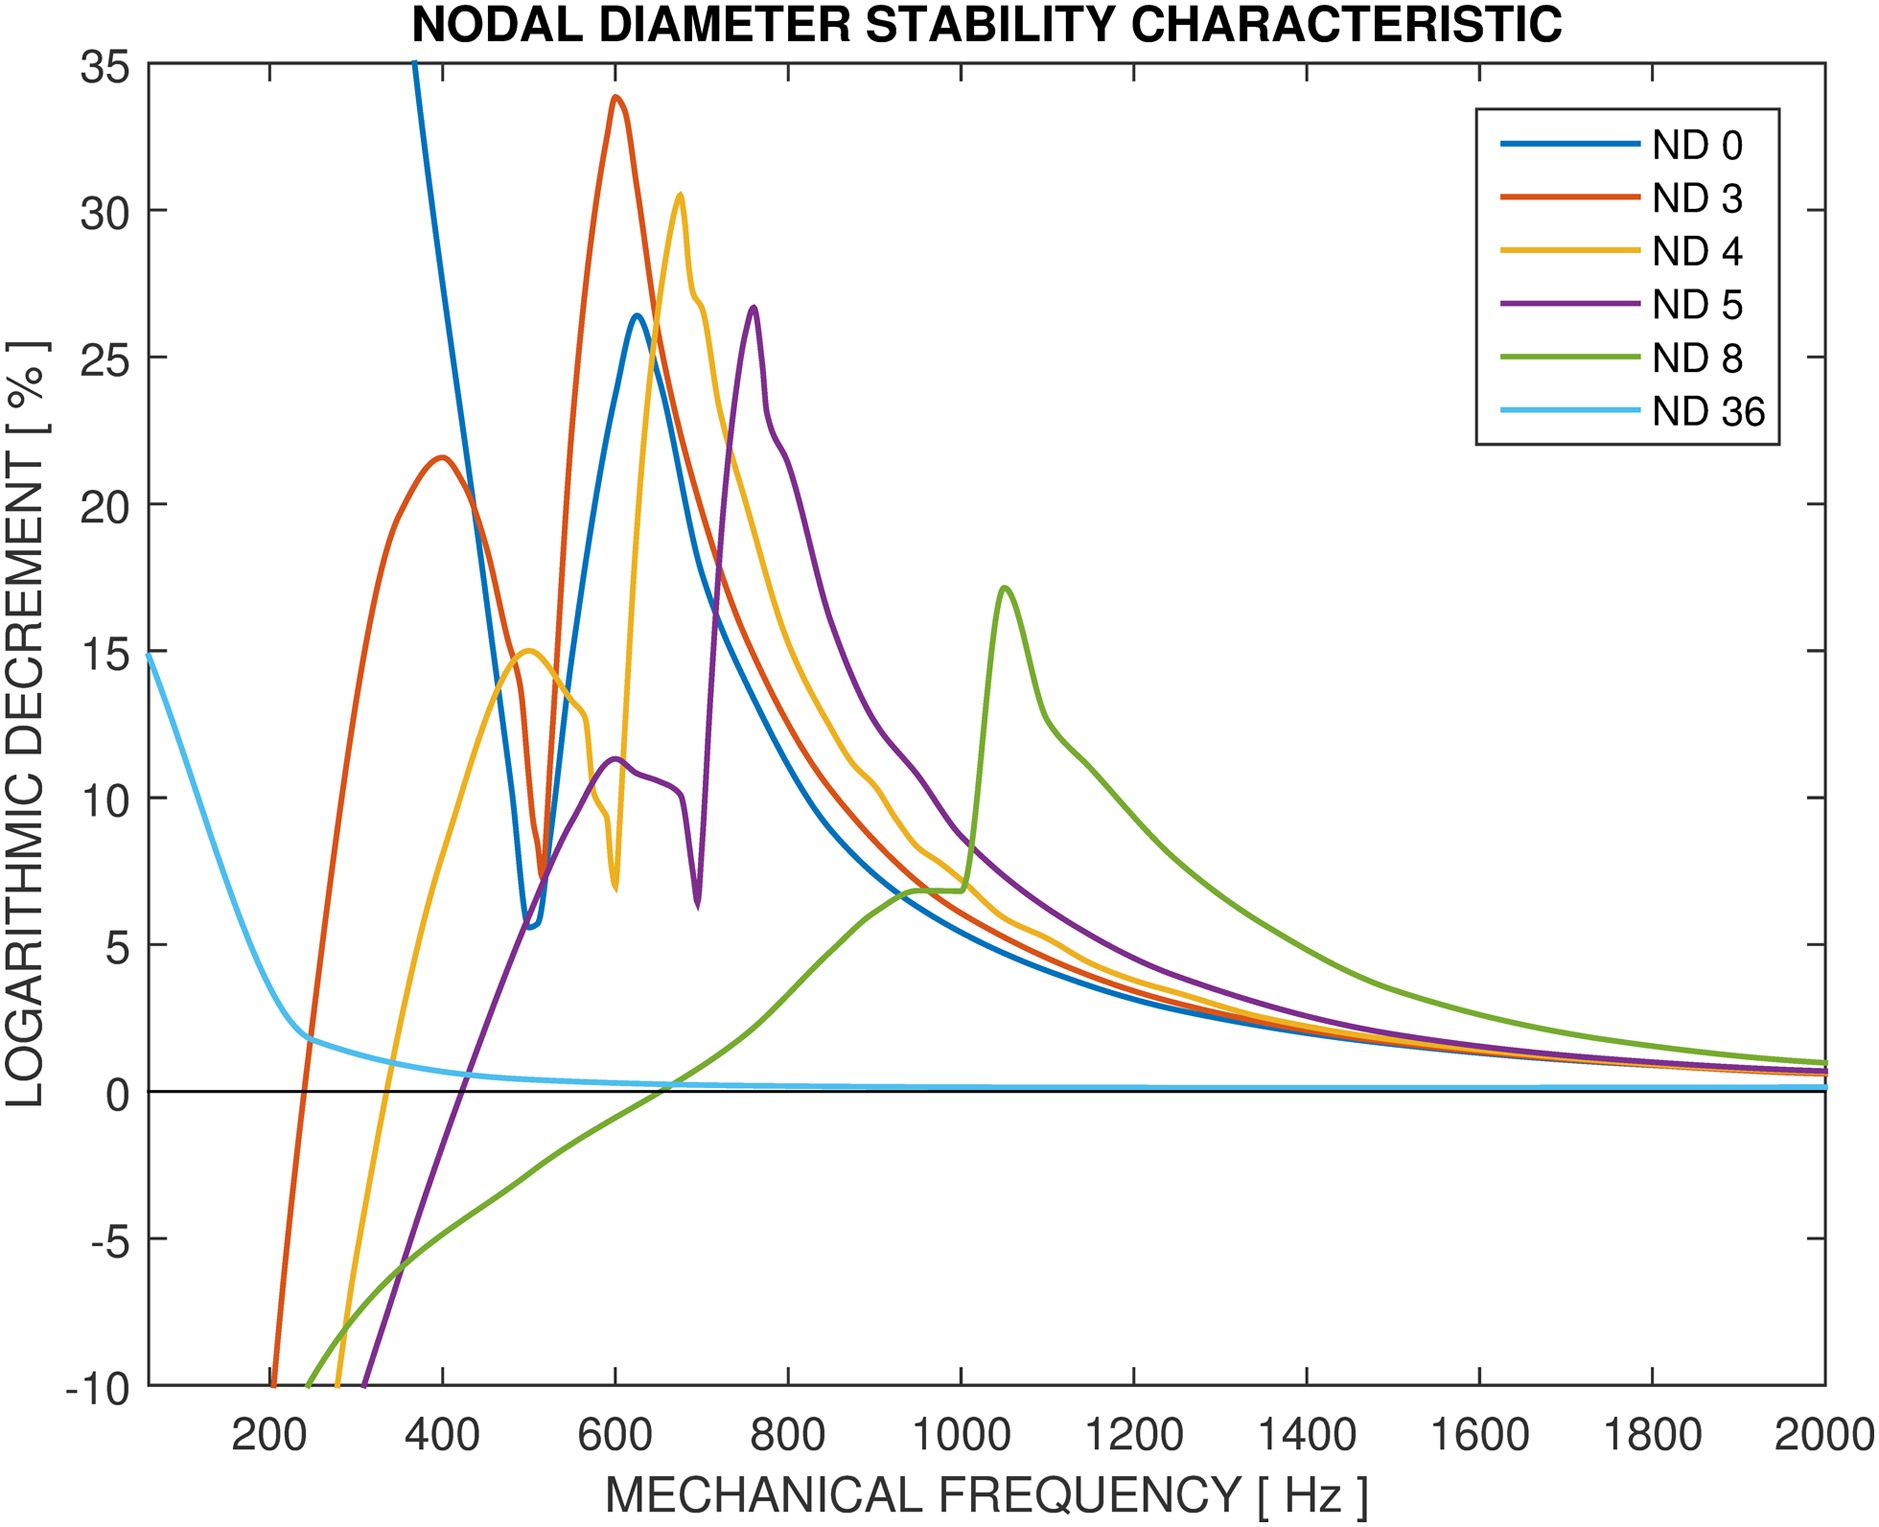
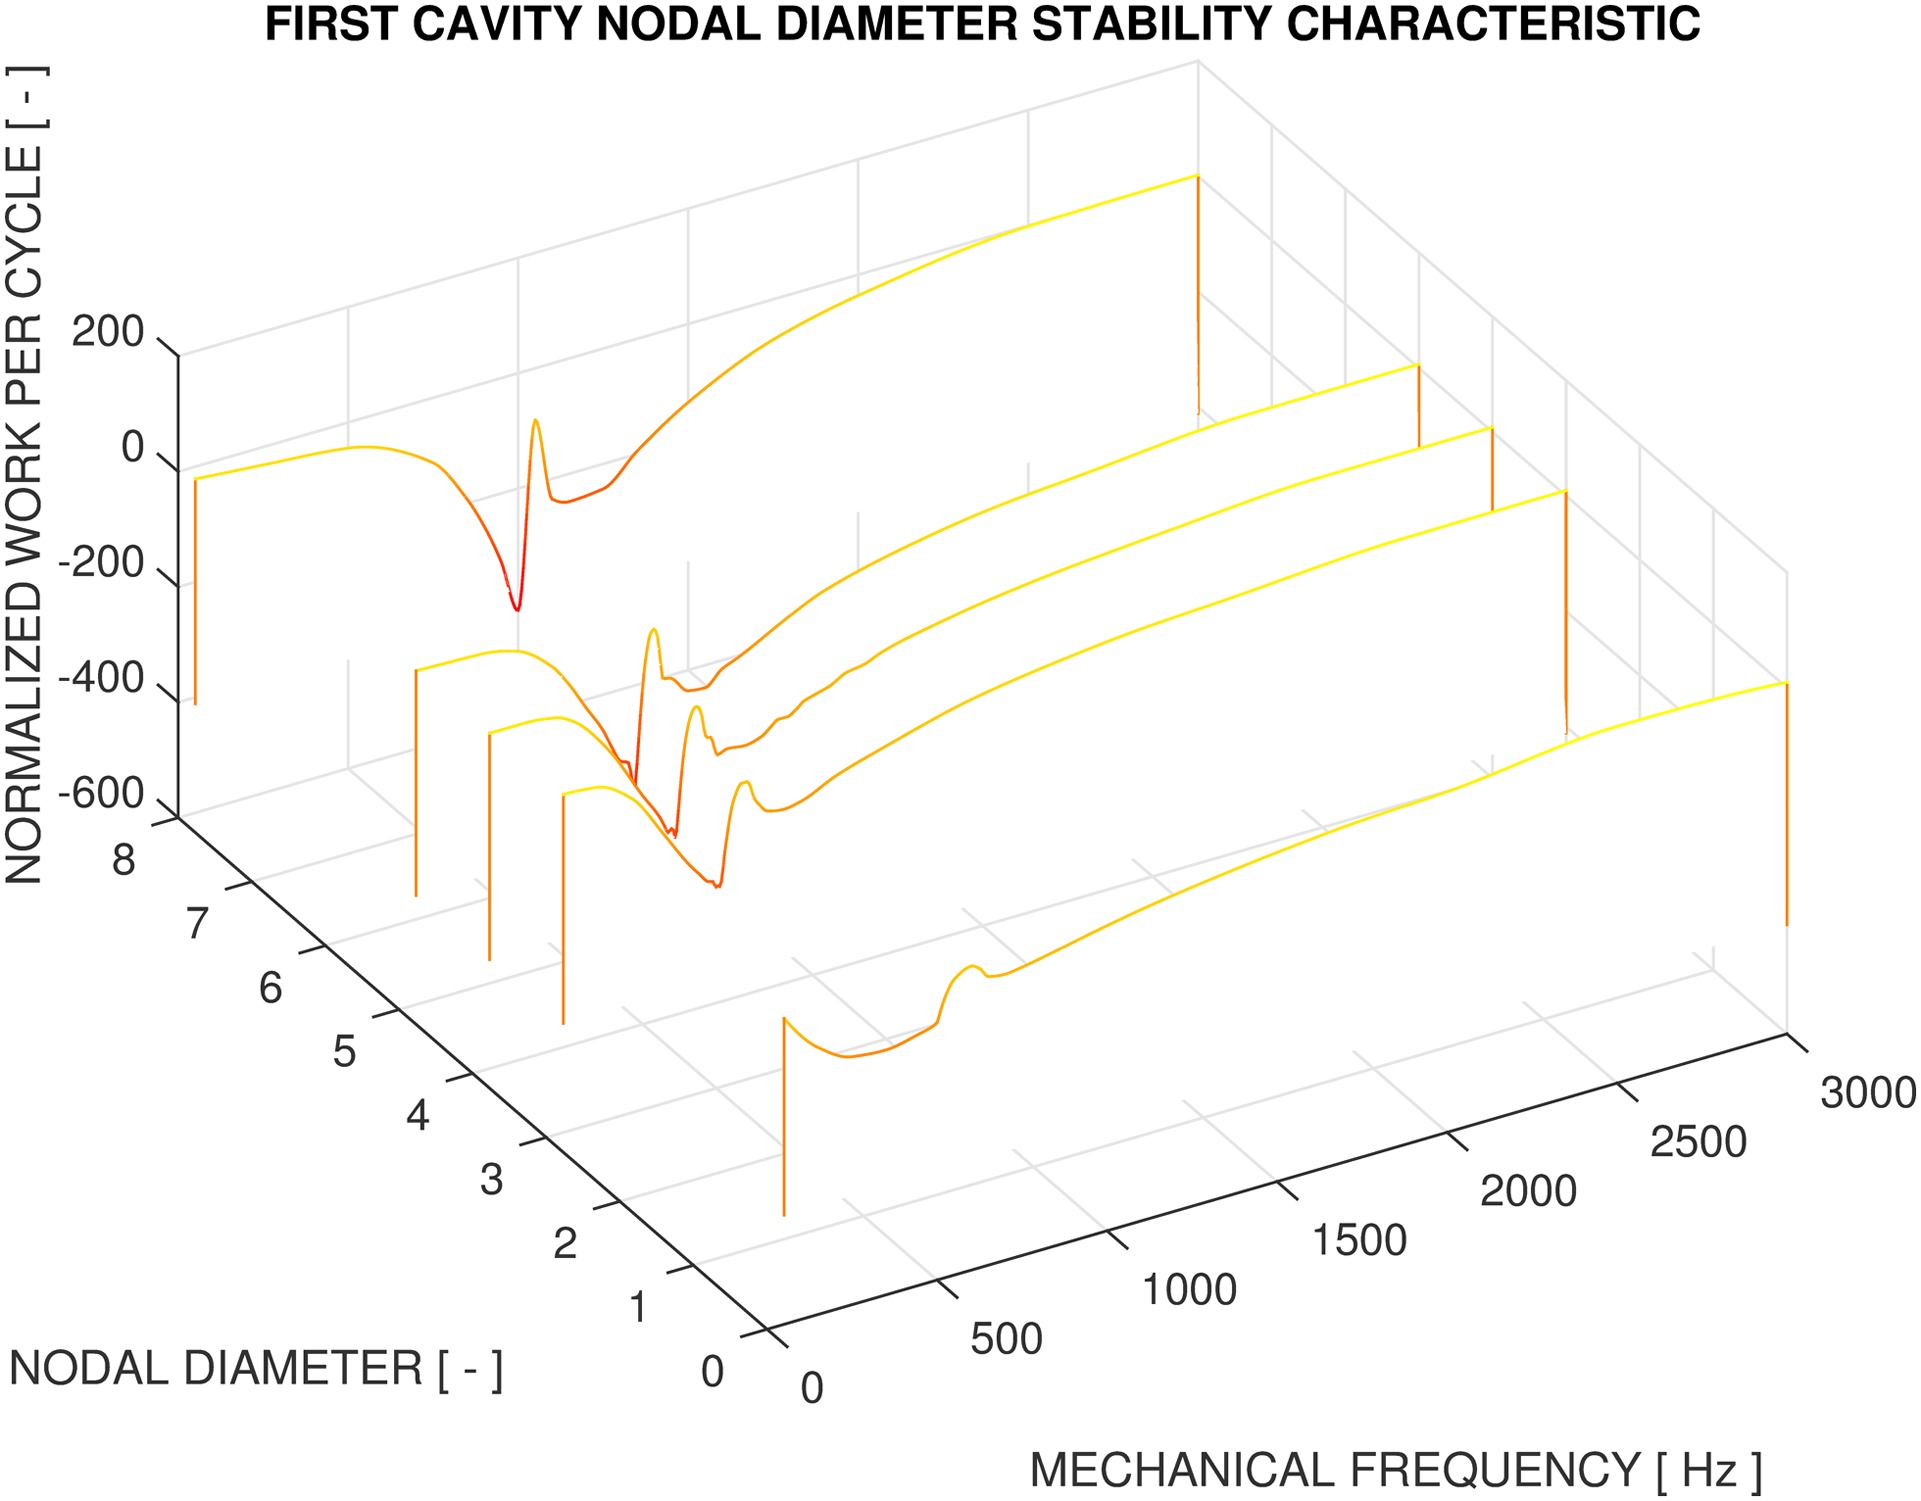
The 0ND case has a distinctive all-stable characteristic, as is the 36ND case throughout the entire analyzed frequency range. Abbott had proposed the notion of inter-fin cavity acoustic frequency in relation to the natural frequency of the vibrating rotor seal. This criterion has been reaffirmed when looking at the 4ND LPS (Figure 6) and HPS (Figure 7) characteristics, both for the overall stability of the entire structure and the individual inter-fin cavity characteristics. To check its validity across different NDs, the work per cycle on the first cavity surface is compared in Figure 9. It appears that as the NDs increase, the peak-valley patterns are scaled towards higher frequencies in a linear fashion. However, since the first cavity is always stable and does not behave exactly as described by Abbott’s criteria, a 2D plot of the work per cycle on the second cavity surface is presented in Figure 10. Two dashed lines are drawn to highlight the stability crossing boundary (black) and the acoustic frequencies (blue) respectively.
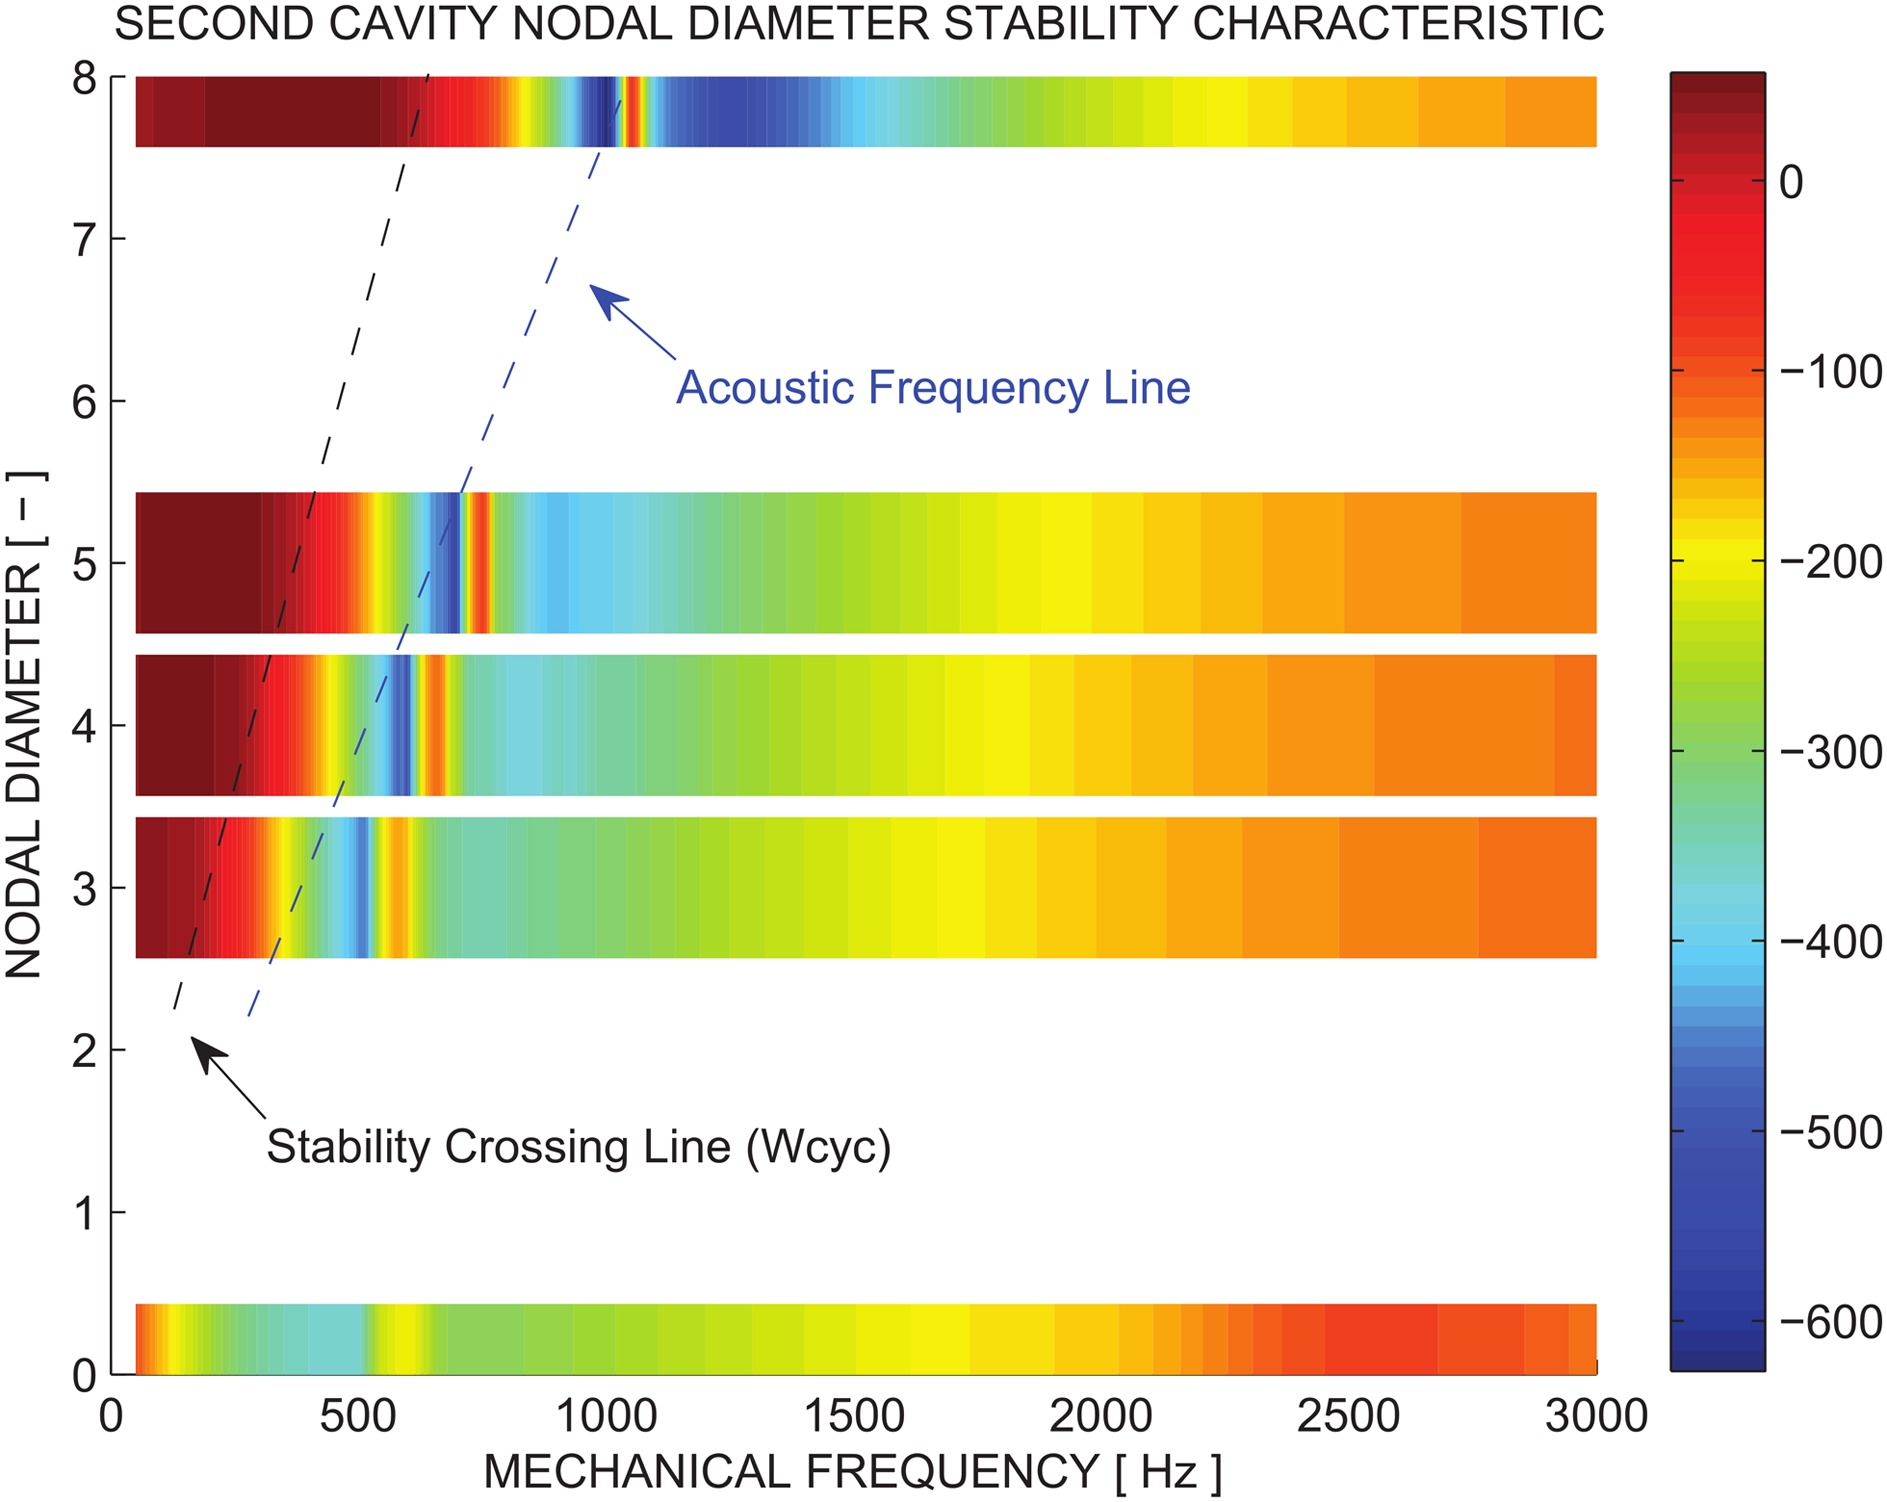
To investigate if the stability crossing line is in fact linear, Figure 10 is re-plotted into Figure 11, where the mechanical frequencies belonging to the same ND family are normalized by their respective nodal diametral acoustic frequency. It shows that all the available ND curves are crossing the zero LogDec line at approximately the same position (0.6) after normalization.
Based on the above analysis with respect to the stability crossing positions, it is concluded that Abbott’s criteria and in particular the concept of the inter-fin cavity acoustic frequency are very useful and practical in describing the stability characteristics of rotor seals regardless of the nodal diameter mode. After the acoustic frequency normalization the stability crossing positions for all NDs are approximately the same.
Effects of traveling wave direction
Another important parameter is the TWM direction. The underlying reason is that during rotation, the flow between the rotor and the stator is traveling slower than the rotating member (where slip velocity is defined as the difference between the two). This determines that the forward and backward TWMs would in fact experience different fluid velocities if one travels with the TWMs.
Shown in Figure 12 is the stability characteristic for a 4ND backward TWM. All setup is the same as the baseline case (Figure 6) except for the TWM direction. The major difference between the forward and backward TWMs for LPS seals is essentially a shift of the curve in the horizontal direction. It is noted here that the acoustic frequency is still serving as a good reference for the stability crossing of the curve.

Effects of pressure ratio
Five pressure ratio configurations are investigated at two chosen mechanical frequencies, namely 300 Hz and 1000 Hz. One is below the acoustic frequency and one is above. The pressure ratio ranges from 2 to 6, as shown in Figures 13 and 14.
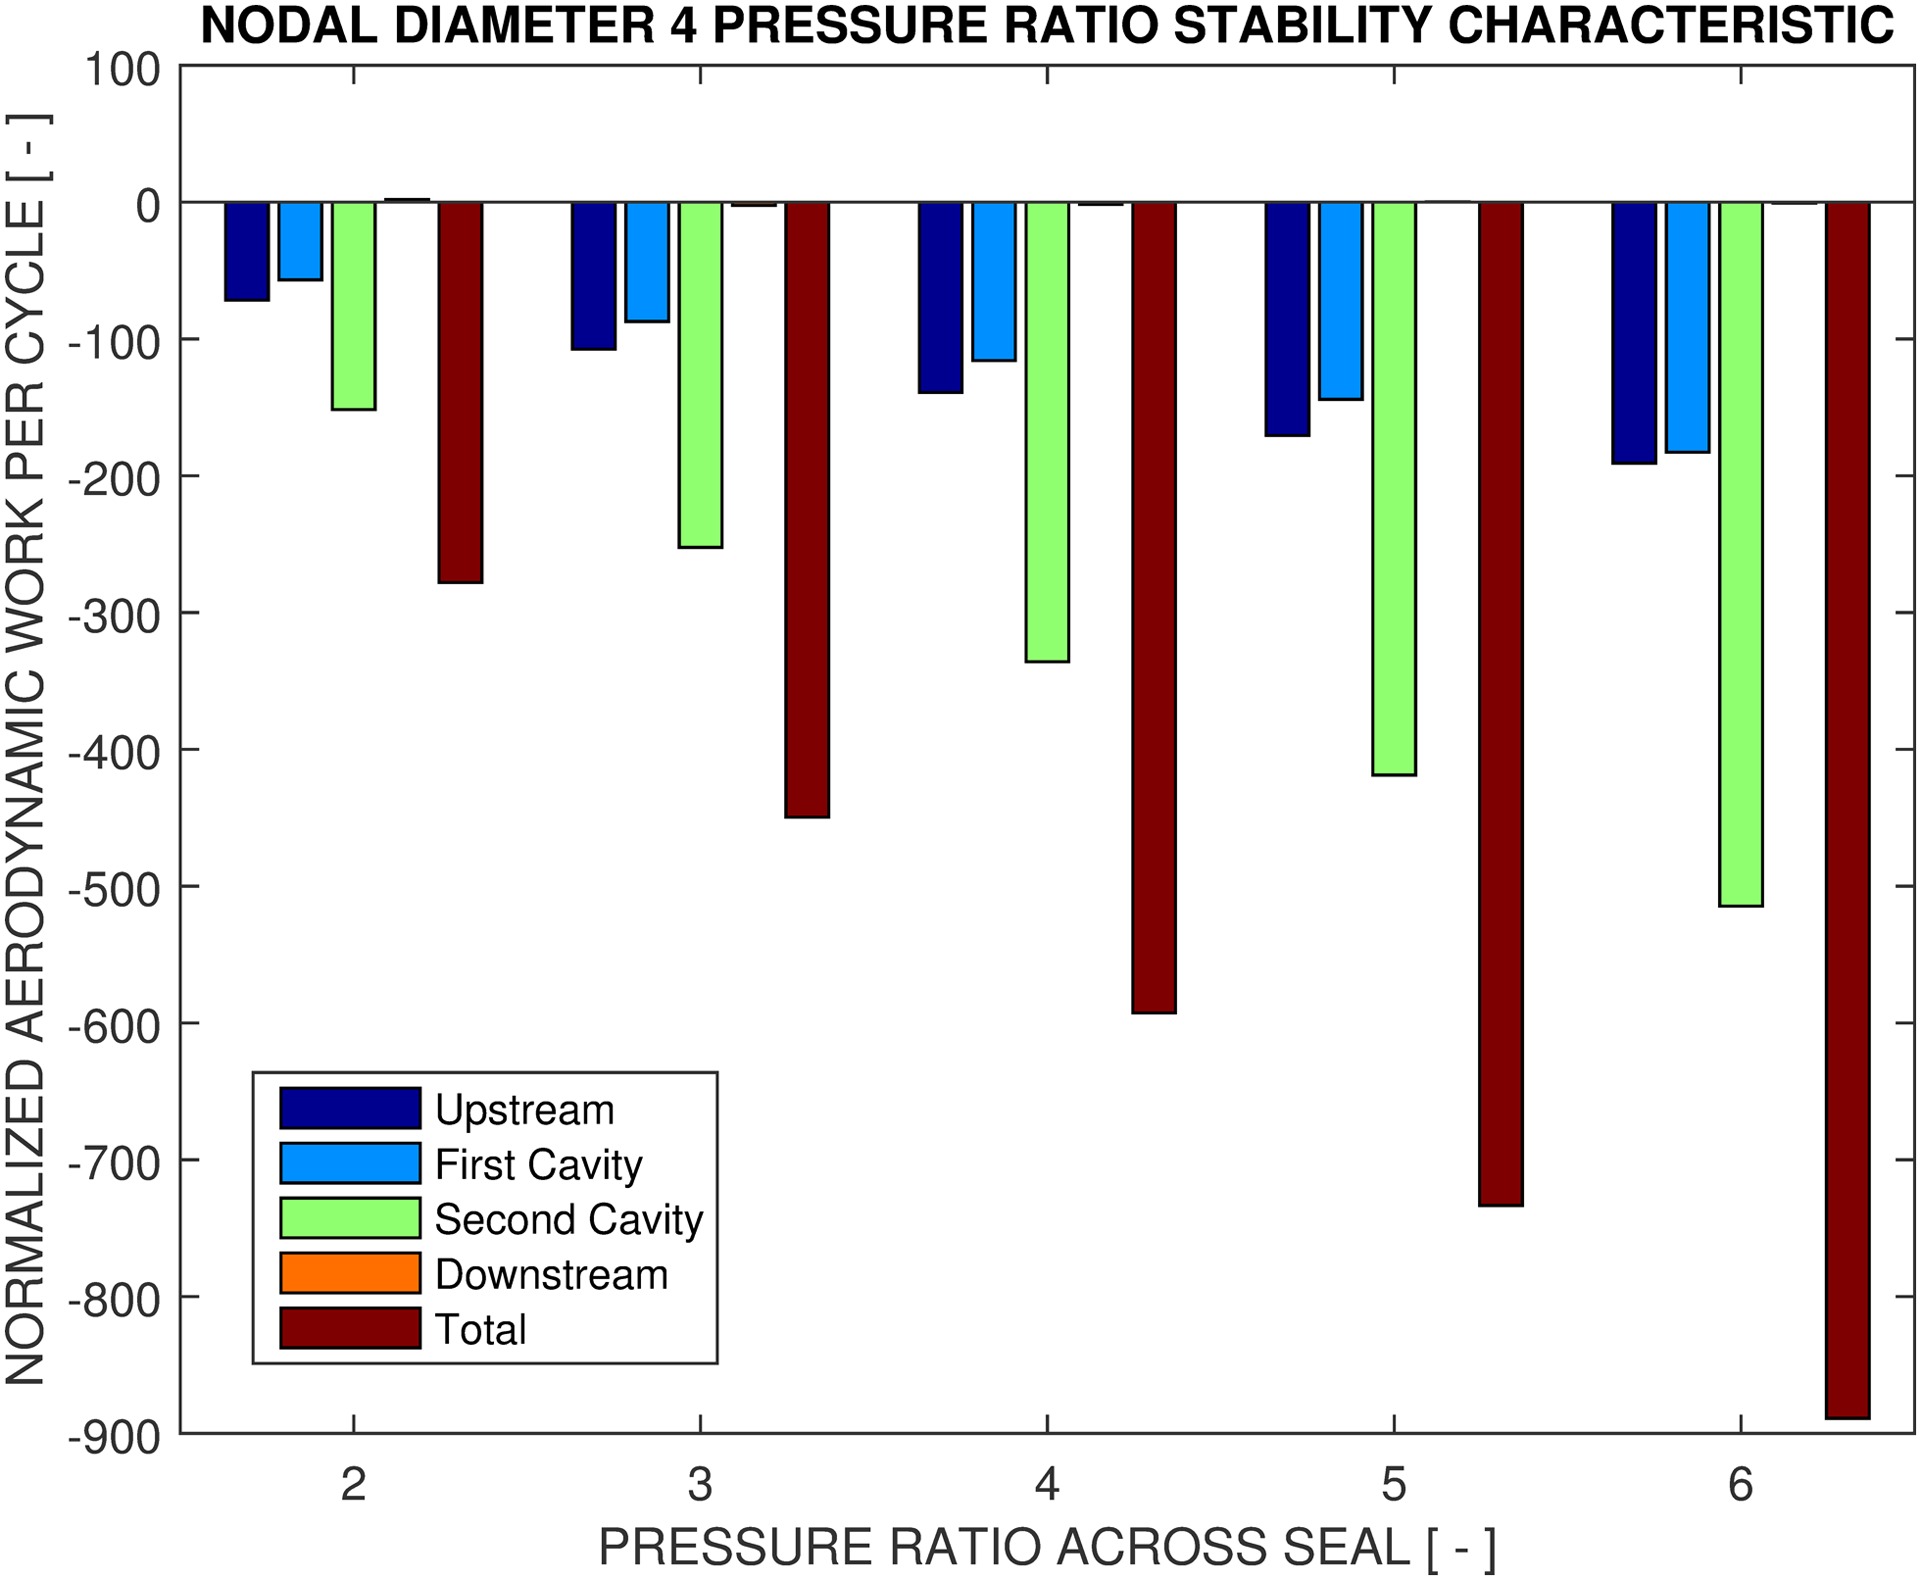
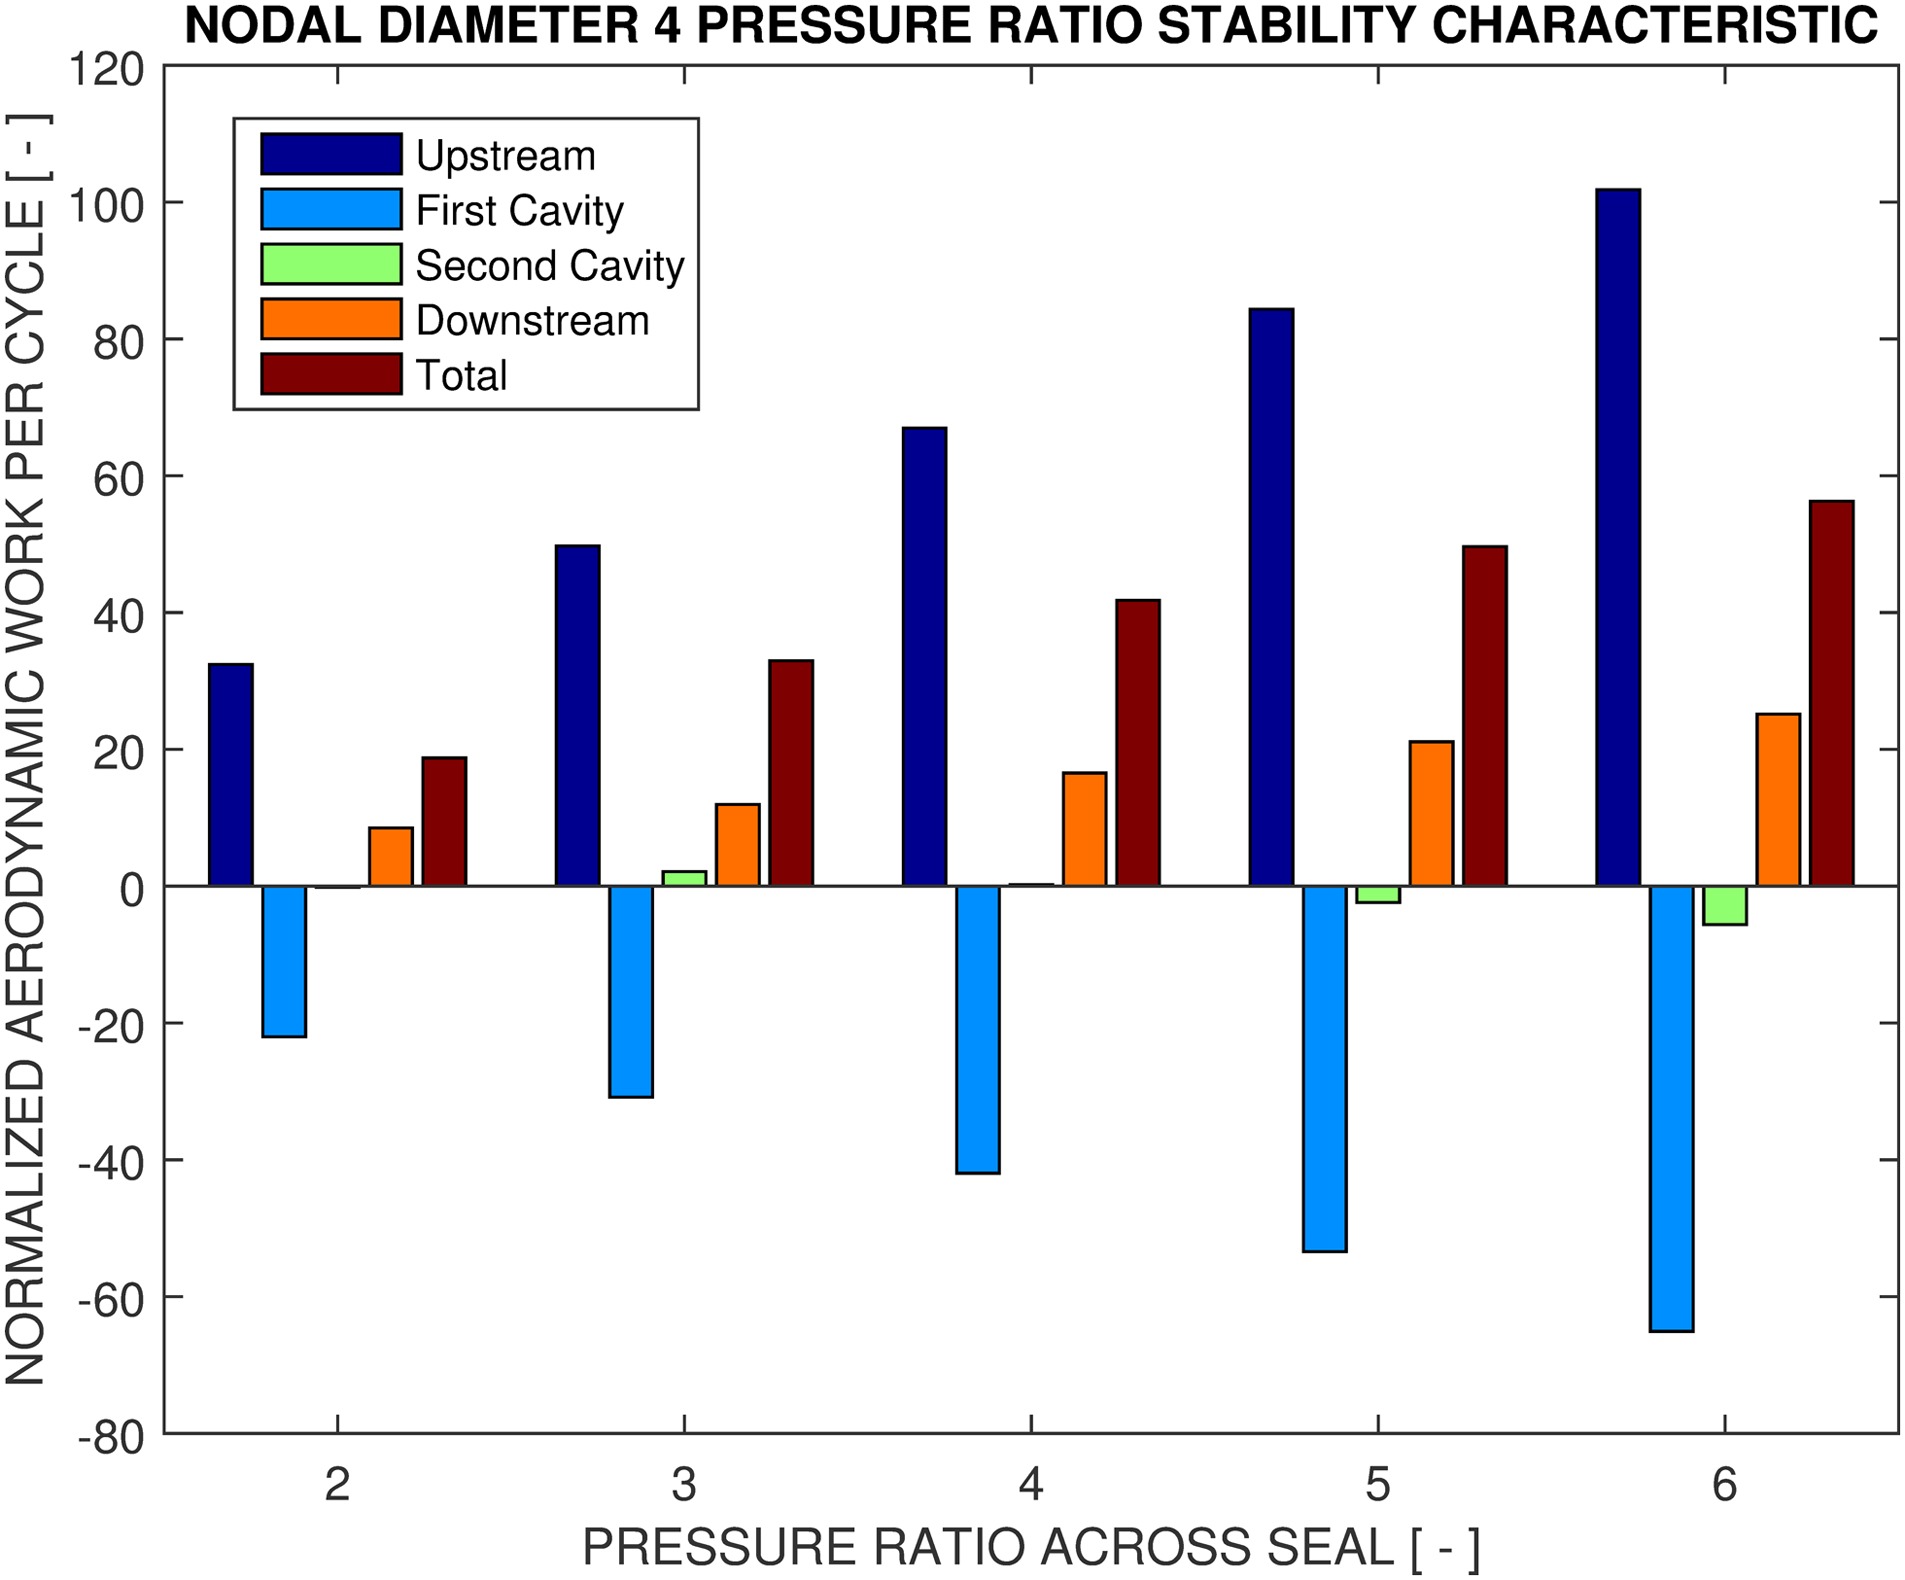
The normalized aerodynamic work per cycle is growing essentially linearly as a function of pressure ratio for the majority of the seal surfaces, including both the inter-fin cavities and the upstream and downstream larger surfaces. However, the linearity is not exact and small deviations do exist for higher pressure ratio cases, depending on the mechanical frequency and the specific surfaces. For small damping values especially near the stability boundary, it is noted that the behavior could not be well described. This is anyhow a general issue when predicting stability near the boundary.
With the above analysis it could be concluded that a change of pressure ratio in a considerably large range would not mean a significant change in the phase relationships of labyrinth seal aeroelastic behaviors, but rather a mere amplification of the unsteady pressure magnitude and consequently the aerodynamic work per cycle.
Effects of maximum deflection
To check the linearity of the system with respect to oscillation amplitude, the maximum deflection of the seal structure is varied starting from one quarter of the baseline maximum deflection.
The normalized aerodynamic work per cycle is plotted against several maximum displacements as fraction of the baseline case (Figure 15). The aerodynamic work per cycle is normalized by maximum deflection, thus analogous to the unsteady force magnitude. Apparently as the vibration magnitude increases, the unsteady force magnitude is increasing in a linear manner.

The linearity assumption is again checked by tabulating the percentage LogDec. In Table 4 the damping values are in principle the same although with a slight increase for larger displacements. It is also noted that the linearity assumption is valid in a relatively wide range. The maximum displacement for the baseline case corresponds to approximately 20% of the fin gap clearance. Further, the proof of the linearity for labyrinth seal systems suggests that linear harmonic solvers could potentially be used for this type of analysis.
Acoustic resonance in large cavities
One phenomenon discovered during the “frequency sweep” in the analysis is the acoustic resonance. It appears that simply by using a URANS solver with reasonable time step and a conventional turbulence model, acoustic resonance could already be captured. And it compares well with acoustic resonance predictions using FE methods. Normally when addressing acoustic issues using CFD techniques, an LES model should be more appropriate. Yet that comes with much more intensive computations.
A monitor point under the seal cantilevered beam in the upstream cavity is further examined. The nodal force amplitude as experienced on this node and the corresponding phase lag between the nodal force and nodal displacement are plotted for the complete frequency range in Figure 16. It is shown that the resonance frequency is around 600 Hz.
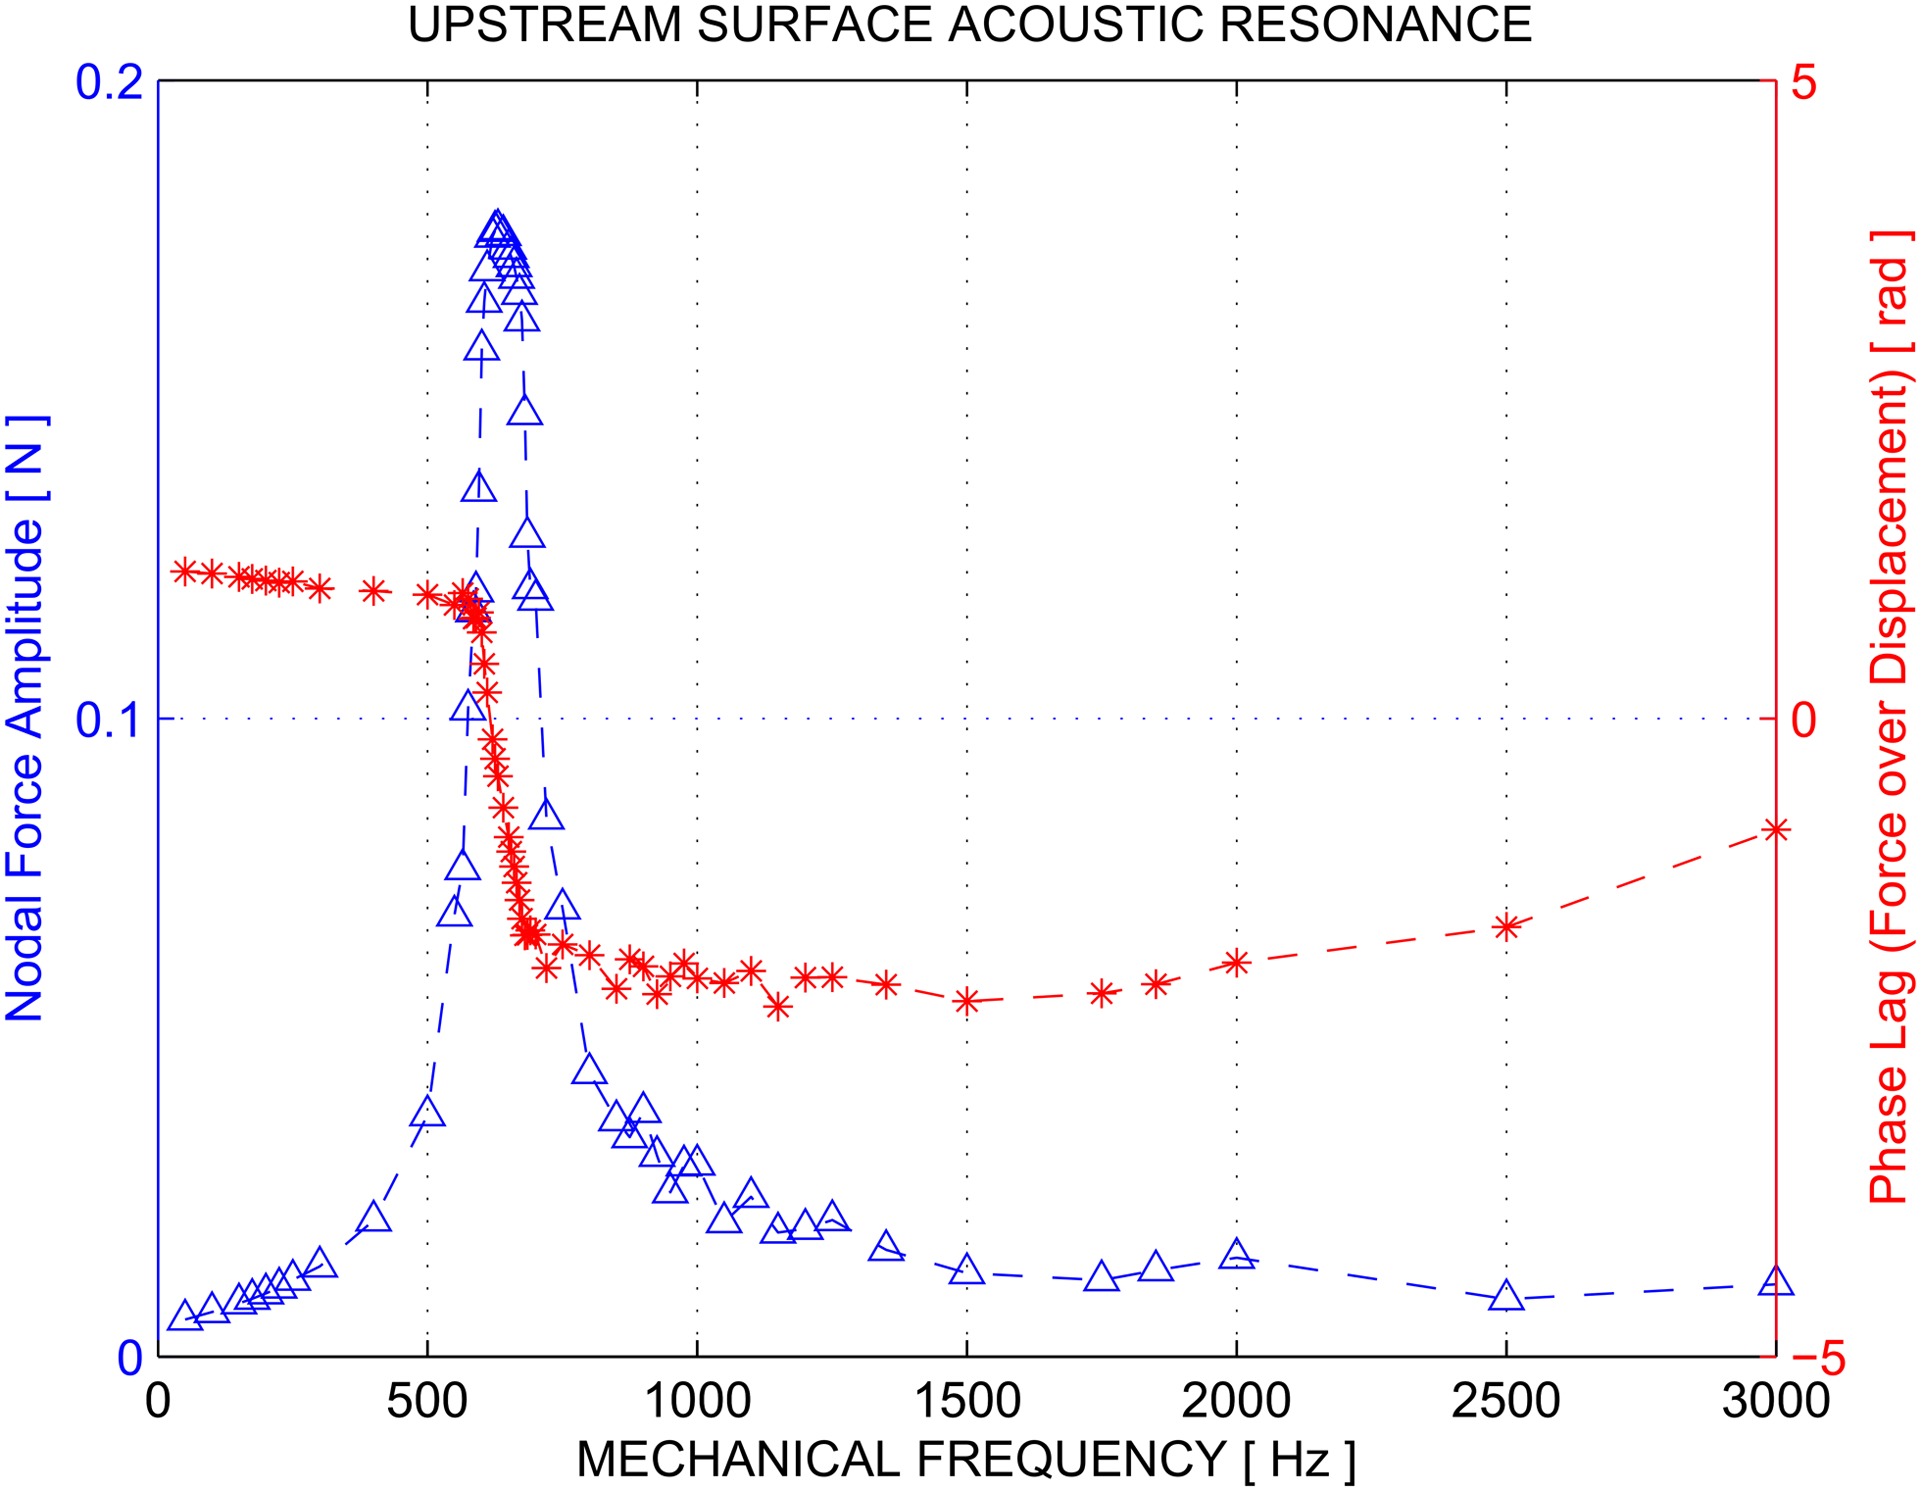
Such an acoustic resonance appears to be both beneficial and undermining to the stability of seals because of the sign switch of the phase near resonance. However, a coupled acoustic and mechanical resonance phenomenon should be avoided even if the work is stabilizing. In practice the engines are not merely running at design points but rather through a range of different operating conditions. Since the acoustic resonance phenomenon is dictated by the temperature, a stabilizing acoustic resonance work could easily shift towards the opposite side when the operating condition changes.
Validation of methodology
The discussed numerical method is validated against analytical approach as described by Abbott (1980) and is shown in Figure 17, using the nodal diameter 4 low pressure support case as an example. The sum of the inter-fin cavity work per cycle predicted by both approaches showed reasonable agreement in terms of the amplitude and the phase (i.e., when the sign of the work per cycle goes from positive to negative near the cavity acoustic frequencies). The analytical approach predicted similar work per cycle amplitude to CFD at higher frequencies while over-predicting the work amplitude at frequencies below the inter-fin cavity acoustics. A breakdown of the individual first and second cavity work contributions indicates that this behavior comes predominantly from the second cavity. For the first cavity in particular, CFD predicted quite non-typical inter-fin cavity stability characteristic with negative work at lower frequencies and a slight positive work at higher frequencies. This is potentially attributed to the fact that the first cavity is indeed coupled to the large upstream cavity which cannot be fully captured in the analytical model. Additionally, the CFD model can resolve the acoustic resonances at the large upstream cavity as discussed in the previous chapter, which clearly affected the inter-fin cavity characteristics as well. In summary the results from CFD compare well to the analytical approach while being able to capture the physics better.

Conclusions
Using time-marching CFD techniques with morphing meshes, extensive high-fidelity flutter analysis has been performed to assess the aeroelastic stability of rotor seals. Several parameters were varied to see their effects on the perceived instability, namely the support side of the seal, mechanical frequency, nodal diameter, traveling wave direction, pressure ratio, and seal deflection amplitude. The calculations were done on a simplified model while the core features of labyrinth seals were well maintained. Results from the parametric study agreed with the key historical findings and provided additional insights to aid during design space exploration.
Considering the successful application of the time-accurate CFD techniques to the labyrinth seal aeroelastic stability phenomenon, more parametric studies could be done regarding the geometrical configurations of the seal. Detailed sealing fin features can be studied, including but not limited to, the number of fins, their relative axial placement, fin height, thickness, and individual fin tip clearances. The clearances should be of great concern since they ultimately determine the leakage mass flow, which in turn affects the engine performance. An increase of the upstream fin tip clearance has been shown to affect the stability in a significant way and optimization of the tip clearance for each fin could lead to a balanced design in terms of stability and engine performance.
In conclusion, apart from the parametric studies, it has been demonstrated that high fidelity three dimensional URANS can be employed for predicting the aeroelastic behavior of labyrinth seals within industrial environment, especially during the detailed design stages. Though not presented in this paper, the numerically predicted aeroelastic behavior using the described approach has been confirmed experimentally for industrial seal designs. This will be the topic of a future publication.