
Introduction
Turbomachinery applications in aero engines and industrial gas turbines require a comprehensive physical understanding and innovative solutions. Although computational capabilities are rising quickly, the necessary confidence level of predictions is still restrained. Especially unsteady aerodynamics and aeromechanics in modern engines are complex and safety crucial, thus leading to over conservative designs, preventing vast innovations towards efficient, clean and quiet solutions. To foster the understanding and validation of theoretical and numerical methods, extensive experiments, applying realistic operating conditions are key. Hence, comprehensive data of high-speed test cases with an appropriate technology readiness level are necessary. To tackle the aforementioned topics, the Transonic Compressor (TCD) at Technical University of Darmstadt (TUDa) contributes to various research areas with respect to modern transonic compressors for more than 25 years. The introduced TUDa-GLR-OpenStage and corresponding data sets provide a comprehensive test case for the turbomachinery community. Klausmann et al. (2022) provide an overview of the test case, experimental setups, measurement, and analysis methodologies as well as exemplary data and results.
Unsteady aerodynamics and the behavior in the vicinity of the stability limit are gaining relevance to achieve robust compressor designs. Development trends towards reduced numbers of stages with minimum blade counts, able to provide enhanced overall pressure ratios, result in high aerodynamic loading and consequently pronounced secondary flow phenomena. The aerodynamic mechanisms during stall inception are diverse, as exemplarily presented by Mütschard et al. (2021, 2022). Even though, stall and surge have been research focus for many decades, as for example summarized by Day (2016), reliable predictions of the driving phenomena, especially during the design phase, still lack in accuracy.
In order to provide a state-of-the-art validation case for numerical applications and advanced methods, the TUDa-GLR-OpenStage includes measurement data for unsteady aerodynamic investigations and numerical comparison. This work summarizes the time-resolving aerodynamic measurement data within the test case, introduces corresponding measurement techniques and data processing methodologies, as well as exemplary results. Pre-stall aerodynamics and stall inception are investigated for nominal (transonic) and part speed (subsonic) operating conditions. It comprises analyses of the time-resolved static pressure field at the rotor tip as well as spectral analysis of the corresponding pressure signals during transient throttling maneuvers. The rotor casing is extensively instrumented with flush mounted wall pressure transducers, both in axial arrays and various circumferential positions. As no blade vibration is observed in the vicinity of the stall boundary, the investigation focuses on unsteady aerodynamics and corresponding mechanisms, including secondary flow and shocks, solely. Ultimately, this work aims to extend the TUDa-GLR-OpenStage data set, provide guidance with respect to the data and analysis, and be a reference for users of the test case.
Methodology
The TUDa-GLR-OpenStage measurements are performed at a state-of-the-art test facility with extensive measurement systems and instrumentation, in conjunction with sophisticated test and analysis procedures. A comprehensive overview is provided in Klausmann et al. (2022).
Test facility & compressor stage
The TCD test rig, as shown in Figure 1, enables investigations of single and 1.5-stage transonic compressor configurations with technology readiness levels of TRL 4–5. It is an open-loop test facility, using ambient air which is guided through an inlet throttle and settling chamber into the compressor core. Downstream the compressor, the air is released to ambient via an exhaust duct. The rig is electrically driven by an 800 kW DC drive, in conjunction with a gearbox, enabling shaft speeds of up to 21,000 rpm. To set different operating conditions along defined compressor characteristics, an outlet throttle, including a safety bleed, is used to vary the back-pressure of the compressor stage.
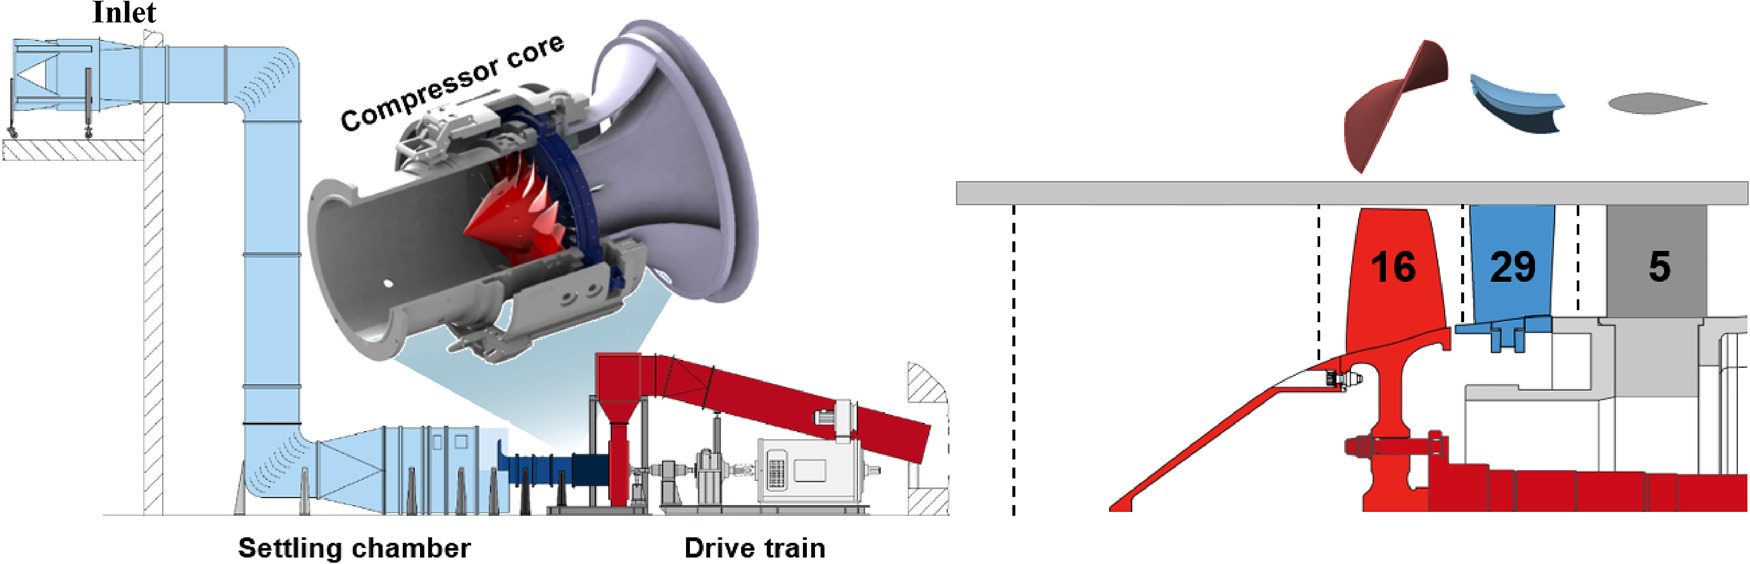
The compressor core is designed modularly, to enable quick and easy turnarounds between different configurations, for example varying the rotor, casing inserts or instrumentation. The TUDa-GLR-OpenStage, as shown in Figure 1, represents a high pressure compressor front stage, comprising a BLISK rotor (16 blades) with rotating nose cone, designed by MTU Aero Engines AG, and an 3D-optimized stator (29 Vanes), designed by the Institute of Gas Turbines and Aerospace Propulsion at TUDa (Bakhtiari et al., 2015) and the German Aerospace Center (DLR). Additionally, it includes outlet struts (5), and a casing module to provide the defined rotor tip clearance and instrumentation access. Table 1 summaries specific information with respect to the TUDa-GLR-OpenStage.
Instrumentation, test & analysis procedures
The experiments are subdivided into two categories, steady-state and transient, as illustrated in Figure 2c. The measurements are carried out at various rotor speeds, including design speed (N100) and part speed (N65), transonic and subsonic operating conditions respectively. For steady-state measurements, the compressor is stabilized at a constant corrected speed and a specific throttle setting, hence mass flow rate and corresponding pressure ratio. Various measurements are performed along the characteristic, including near choke (NC), peak efficiency (PE) and near stall (NS).The latter marks the last stable operating point close to the stability limit. Besides steady-state measurements, transient maneuvers are carried out to investigate the stall inception phenomena. For experiments at the stability limit, the compressor is continuously throttled along a speed line. The stall inception process is initiated at NS and an emergency bleed system is used to shift the operating conditions towards a stable regime as soon as rotating stall occurs or blade vibration exceed certain limits.
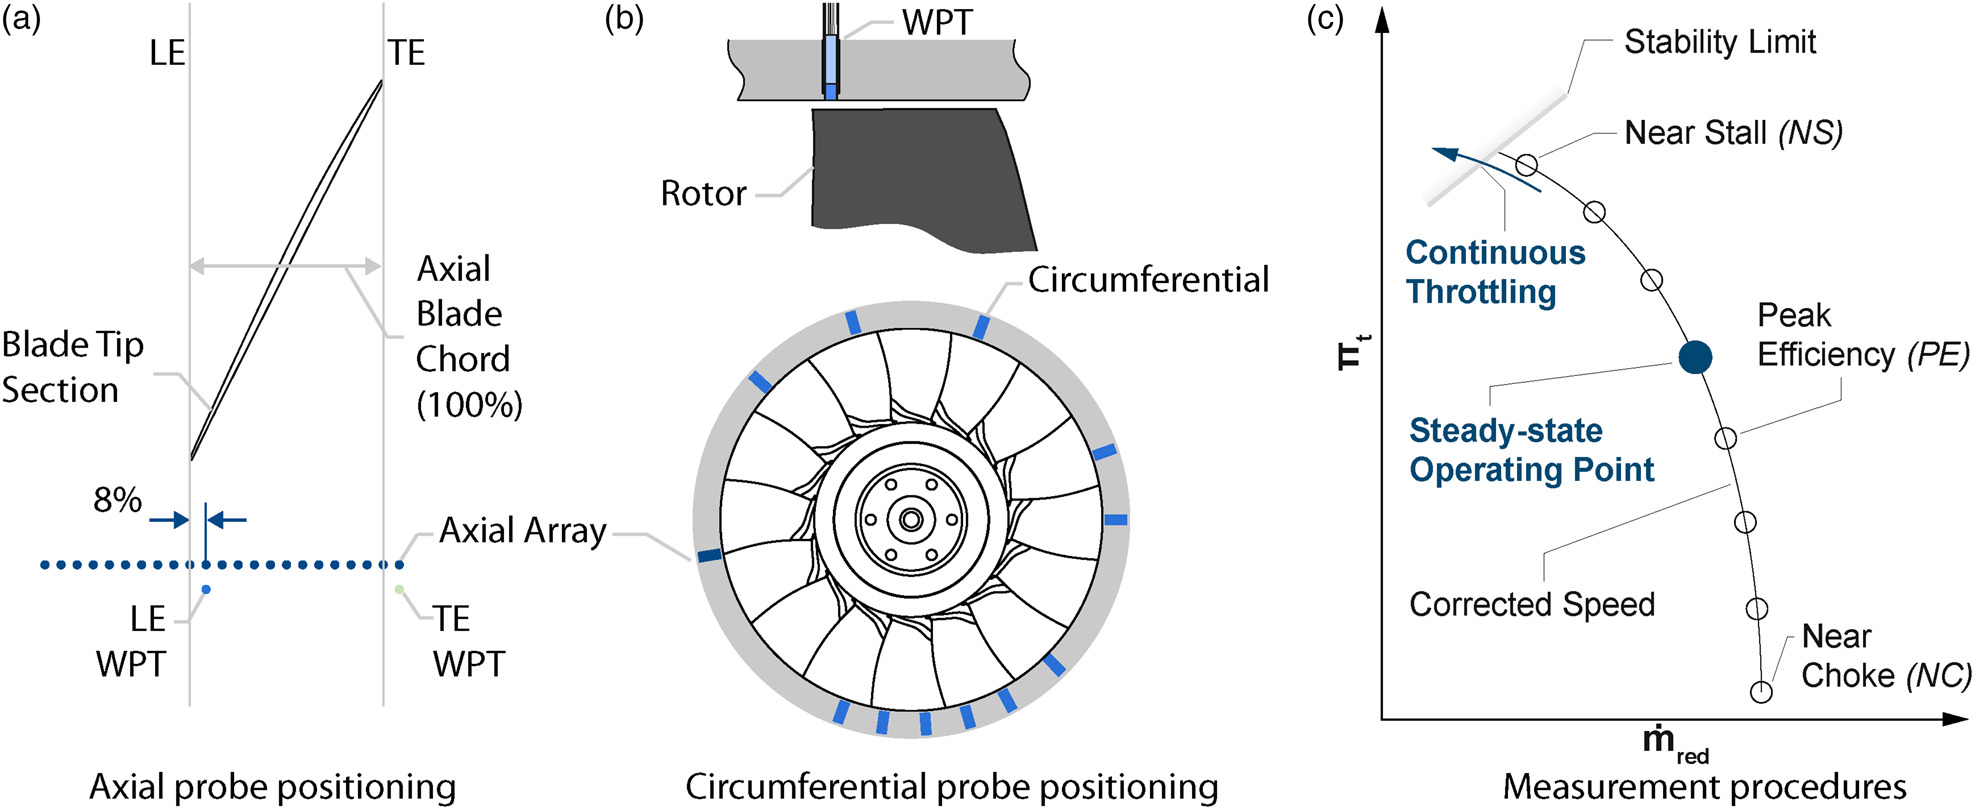
In order to enable the investigation of unsteady aerodynamics at the rotor blade tip, the rotor casing is equipped with up to 70 time-resolving wall pressure transducers (WPT). The open test case includes WPT data of 30 sensors. The kulite sensors in the stationary frame of reference are flush mounted in axial arrays as well as several circumferential positions, as illustrated in Figure 2, and simultaneously sampled with 500 kHz. The axial arrays cover the whole axial blade chord length and an extension upstream, to resolve flow features, such as the tip leakage vortex, and interactions with the shock. The circumferentially distributed sensors are mainly located at the blade leading edge (LE), enable spectral analysis of aerodynamics and aeroelastic effects. A WPT downstream of the rotor trailing edge (TE) is utilized to derive the total-to-static pressure rise of the rotor with respect to the stage inlet conditions.
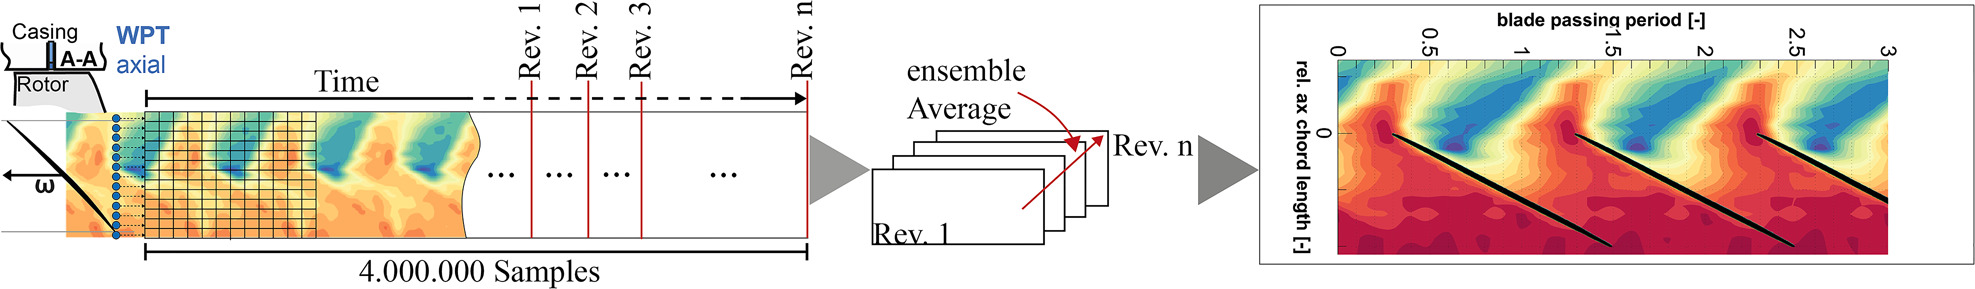
The WPT data for unsteady aerodynamics at the rotor tip are acquired for steady and transient measurements. To obtain the average rotor tip pressure field in the rotating frame of reference for a given operating point, the data is split into single revolutions, using the once per revolution trigger signal, and ensemble averaged. Thus, enabling the investigation of distinct rotor passages as shown in Figure 3. Additionally, single revolutions, deviation analysis and spectrograms can be used to investigate transient manoeuvers, such as stall inception. Based on the pressure data, the stall initiation can be detected. To determine deviations within the pressure field, indicating potential disturbances, the mean pressure field of previous revolutions is calculated and subtracted for each sample and revolution. A comprehensive overview of analysis methods for unsteady wall pressure data, especially with respect to pre-stall analyses, is for example presented in Brandstetter et al. (2018) and Brandstetter and Stapelfeldt (2021).
Results and discussion
Based on the test procedures, applied instrumentation and acquired time-resolved data, various analyses can be carried out in order to investigate unsteady aerodynamics at the rotor blade tip, both at steady-state and for transient operating conditions. For steady-state performance and detailed probe measurements, as well as additional information regarding the steady aerodynamics and instrumentation please refer to Klausmann et al. (2022). An overview of the operating points with available WPT data is listed in Table 2.
Table 2.
Reduced mass flows (kg/s) of investigated operating conditions
| NC | PE N100 | PE N65 | NS | ||||||
|---|---|---|---|---|---|---|---|---|---|
| N100 | 16.21 | 16.00 | 15.84 | 15.50 | 15.12 | 14.78 | 14.43 | 14.09 | 13.39 |
| N65 | 11.24 | 10.83 | 10.43 | 10.03 | 9.63 | 9.21 | 8.82 | 8.41 | 8.00 |
Ensemble-averaged rotor tip aerodynamics at steady-state operating conditions
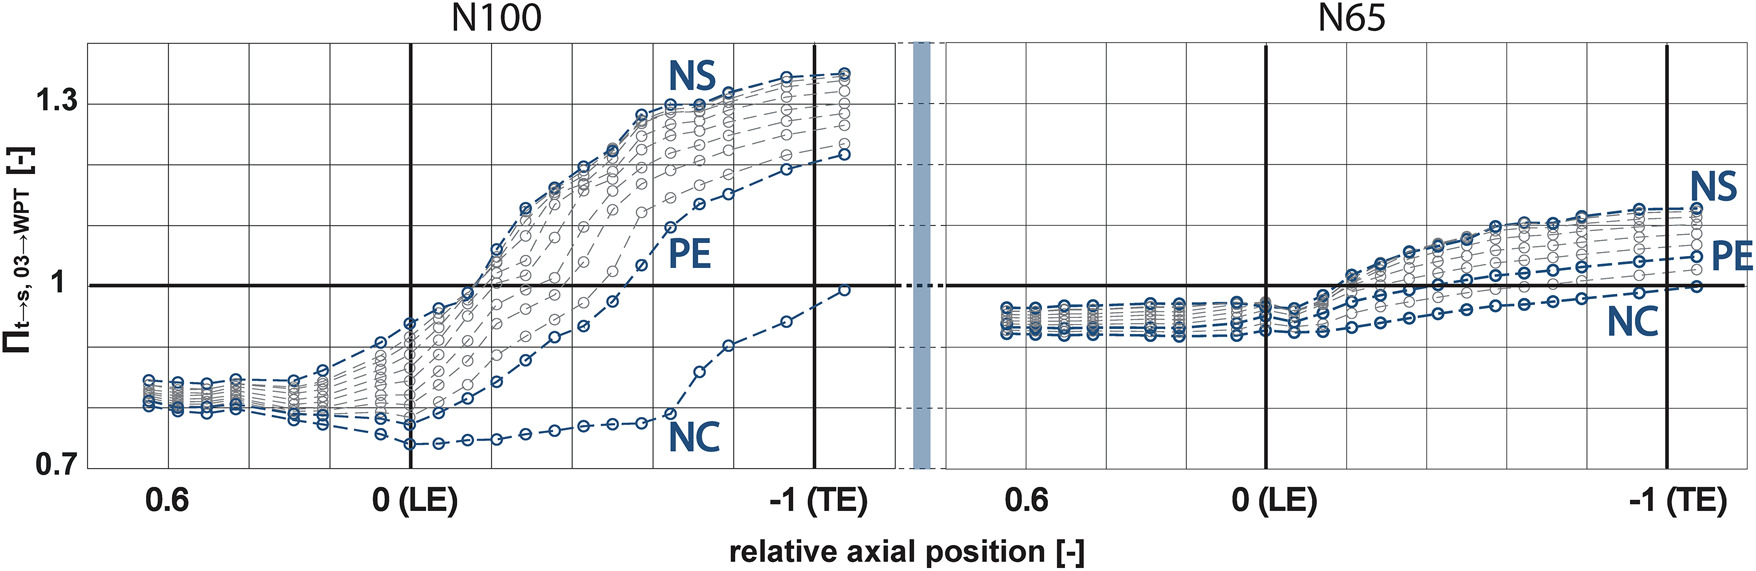
Figure 4 illustrates the total-to-static pressure rise along the N100 and N65 speed line, based on steady-state measurements at different throttling conditions. The static pressure is determined by the WPT axial arrays and referred to the total pressure upstream the compressor [within the settling chamber (section 03)]. On the one hand, the overall pressure rise along the characteristics is visible (e.g., compare NC, PE and NS), and on the other hand, the axial distribution across the rotor can be determined. Different levels of static pressure rise upstream the rotor influenced area indicate different mass flow rates for the corresponding conditions. For N100, i.e., transonic operating conditions, the shock position, visible by a sharper pressure rise, affects the pressure rise depending on the throttling of the compressor. For highly loaded conditions (compare NS), static pressure rise can be observed more than 20 percent upstream the rotor leading edge. For N65, as it is subsonic, a continuous static pressure rise can be observed for all given operating points along the blade. At NS, a pronounced low pressure area at approximately five percent axial chord length downstream the rotor leading edge leads to a decrease in the average static pressure rise.
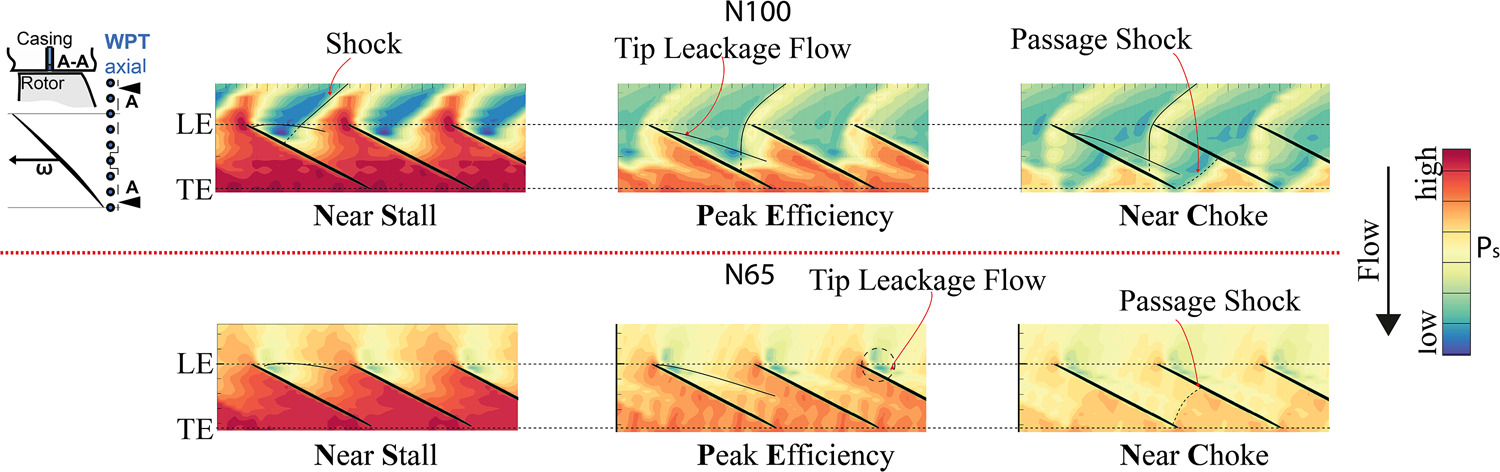
The data of the WPT axial arrays is used to analyze aerodynamic loading, secondary flow phenomena and shock position [see Biela et al. (2008)]. Figure 5 illustrates ensemble-averaged flow fields for NC, PE and NS operating conditions at design speed and part speed. For better identification of secondary flow phenomena, the illustration uses adjusted color bars for nominal and part speed. The blade loading, hence pressure ratio of the rotor (compare Figure 5), increases with rising back pressure. Due to the supersonic flow conditions at the blade tip at nominal speed, a shock occurs upstream of the rotor leading edge which is indicated by a sudden pressure rise. While the back pressure is increased, the shock detaches from the rotor leading edge. Simultaneously, the low pressure area of the tip leakage flow moves upstream towards the leading edge and the induced blockage zone within the passage rises. Additionally, the interaction between the tip leakage flow and shock is visible. At part speed, the absence of the described shock system indicates subsonic conditions. A noticeable low pressure area close to the leading edge indicates the position of the tip vortex spillage. A passage shock at nominal and part speed NC indicates that the stage chokes for both speeds within the rotor domain.
By detecting the highest pressure gradients in the WPT data, more detailed investigations at nominal speed are performed. As illustrated in Figure 6 (left), the average distance
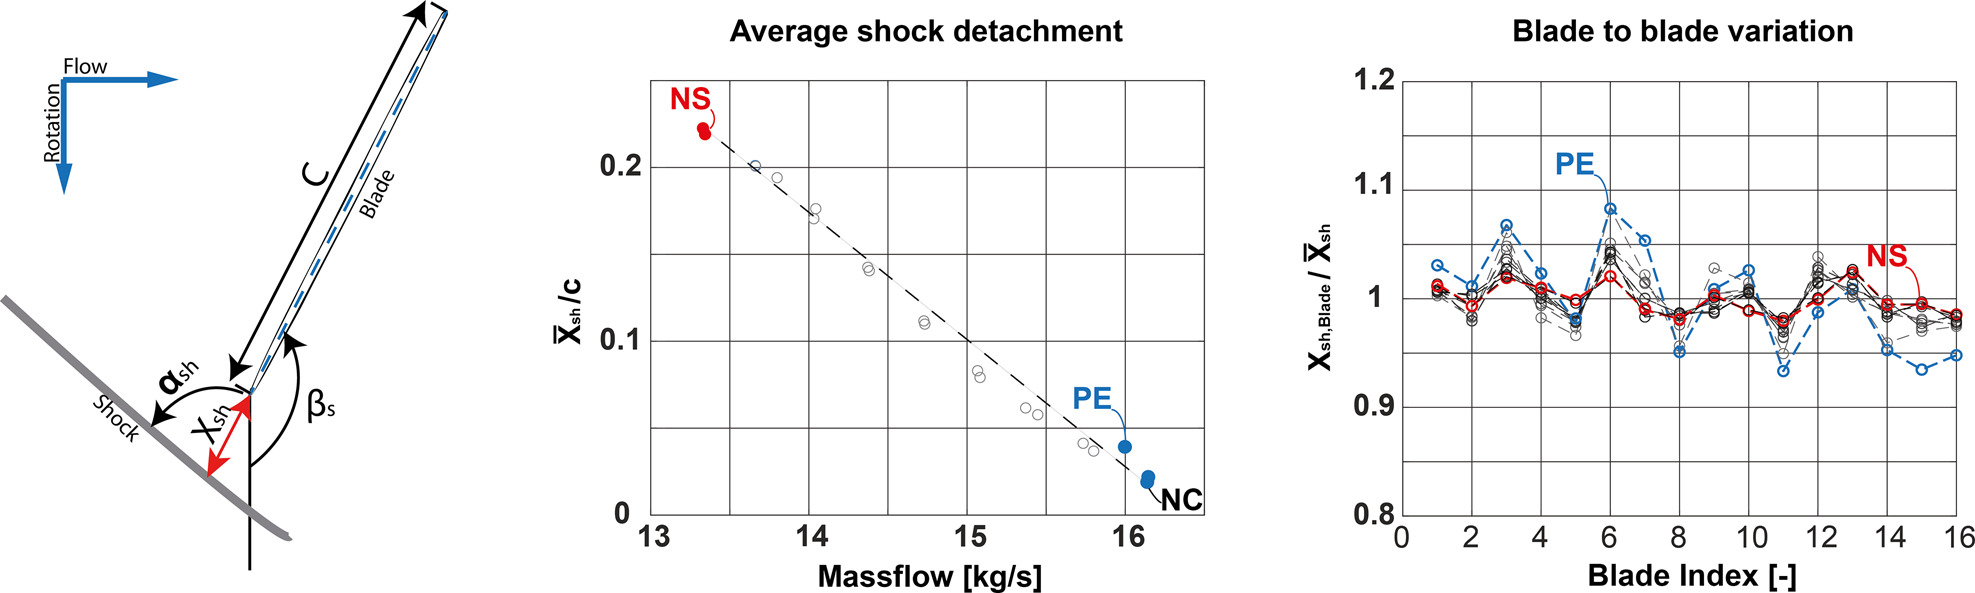
Nevertheless, the given dataset underlies real geometry influences, e.g., blade-to-blade manufacturing deviations, varying stagger angles and different blade tip gaps that are difficult to be included into computational models [for geometry variability effects see Lu et al. (2019)]. Analysis of the shock detachment of all 16 blades (compare Figure 6 right) shows a certain pattern over the rotor circumference. A variation of more than five percent in the single blade shock detachment
Time-resolved rotor tip aerodynamics during stall inception maneuvers
To investigate the aerodynamic effects during stall inception, continuous throttling maneuvers are analyzed, using the data of the WPT axial arrays. A revolution-wise assessment of the 2D pressure field visualizes overall loading and blade-to-blade variations, shock fluctuations as well as aerodynamic pre-stall disturbances and the rotating stall cell. Figure 7 illustrates WPT data at selected revolutions during the stall inception maneuvers, prior to stall (revolution −500, −50, −10), at stall initiation (revolution 0) and during rotating stall (revolution 10) as well as after emergency bleed activation (revolution 300). Prior to stall, the unsteadiness within the pressure field and blade-to-blade variation increases, potentially also resulting in occurrence of pre-stall disturbances (e.g., marker (B) – compare to flow field after emergency bleed), even though the overall aerodynamic operating conditions are stable. At stall initiation (rev. 0), the pressure field collapses across several blades, resulting in the typical circumferentially propagating rotating stall cell [compare marker (A)]. After the emergency bleed is activated, the stabilized operating conditions result in a clean and homogeneous pressure field. Figure 8 shows the pressure rise coefficient [definition see Cumpsty (2004), Mütschard et al. (2021)] during stall inception, both for design speed and part speed. For better comparison both are referred to the pressure rise coefficient at stall occurrence. At nominal speed, the pressure rise is continuously increasing until rotating stall is initiated, resulting in a sudden drop in pressure rise (revolution 0). For part speed, the peak pressure rise coefficient is reached approx. 300 revolutions prior to rotating stall, indicating that the losses in the rotor tip region already surpass the rotor work input at blade tip, thus leading to an highly unsteady flow field, as shown in Figure 7. During rotating stall, pressure fluctuations occur due the circumferential propagating stall cell. As soon as the emergency bleed is opened, the pressure level shifts corresponding to the change in operating point (stable low throttling conditions). Since propagating aerodynamic phenomena occur during stall inception, e.g., pre-stall disturbances and the rotating stall cell, spectral analysis is performed to analyze corresponding effects.
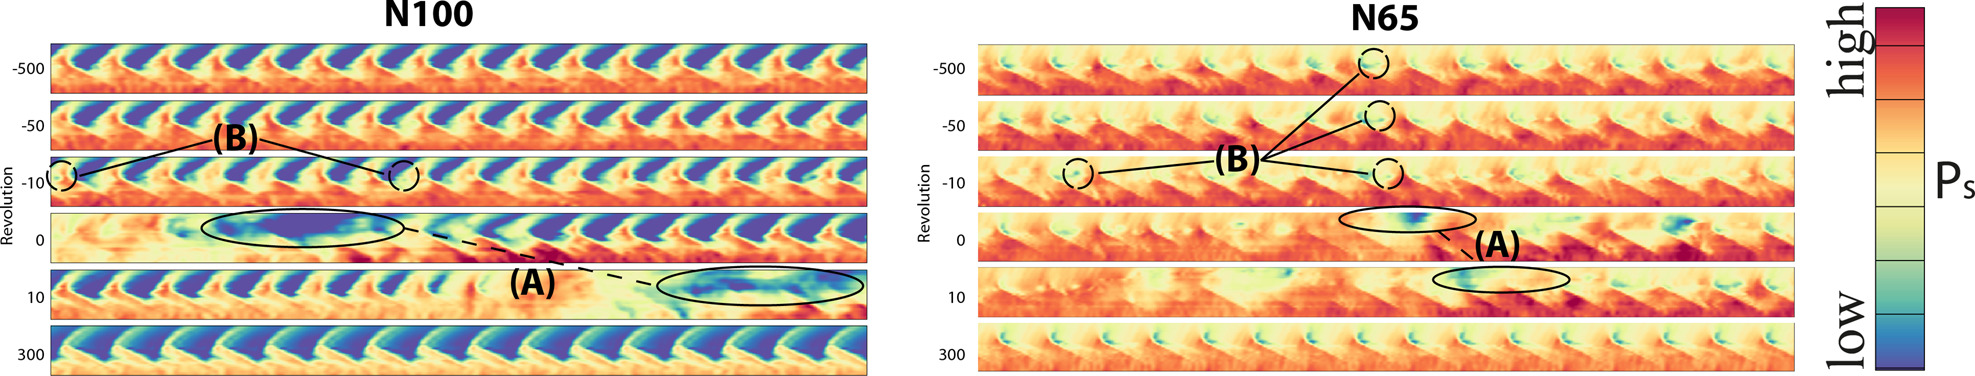
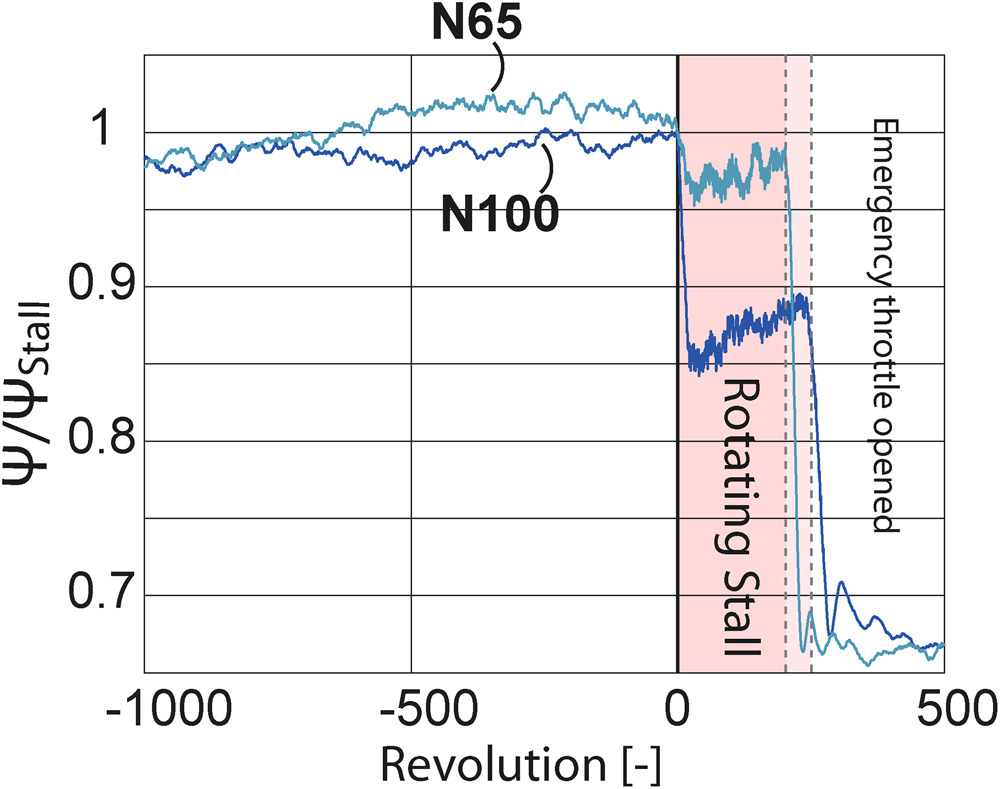
Figure 9 shows the spectrograms of a WPT sensor close to the rotor leading edge [compare Figure 2a] for N100 and N65, as well as a peak analysis prior (pre) and after (post) stall initiation. The frequency content of the WPT signals is referred to the rotational frequency, hence given in engine order (EO). Both spectra clearly indicate the blade passing frequency EO16, i.e. the rotor blade count [marker (a)]. For N100, no pronounced pre-stall disturbances, or even coherent aerodynamic waves, occur within the spectra, and rotating stall is visible for about 250 revolutions until the emergency bleed is activated. During stall, characteristic frequencies of the propagating stall cell at EO 0.55 and associated higher harmonics can be determined. The stall cell propagates opposite to the rotor rotation at approx. 45% rotor speed in the rotor relative frame of reference, tracing the EO 0.55, i.e., 55% rotor speed, in the stationary frame of reference. The stall cell traces are modulated at the blade passing frequency, resulting in clustered frequency peaks next to EO16. For N65, similar observations can be made regarding blade passing frequency and propagating stall cell, with a slightly slower stall cell propagation in the rotating frame of reference (43% rotor speed). Additionally, a broad band excitation can be observed in the region between EO7 and EO15, indicating the presence of randomly occurring pressure disturbances in the rotor leading edge region. While the findings of Franke et al. (2020) could clearly identify an interaction and coupling between aerodynamic disturbances and rotor BLISK vibrations, the open test case does not show a similar behavior at the investigated reduced speeds. It is assumed that the induced unsteady forcing is not high enough to excite the rather stiff rotor at a particular Eigen frequency.
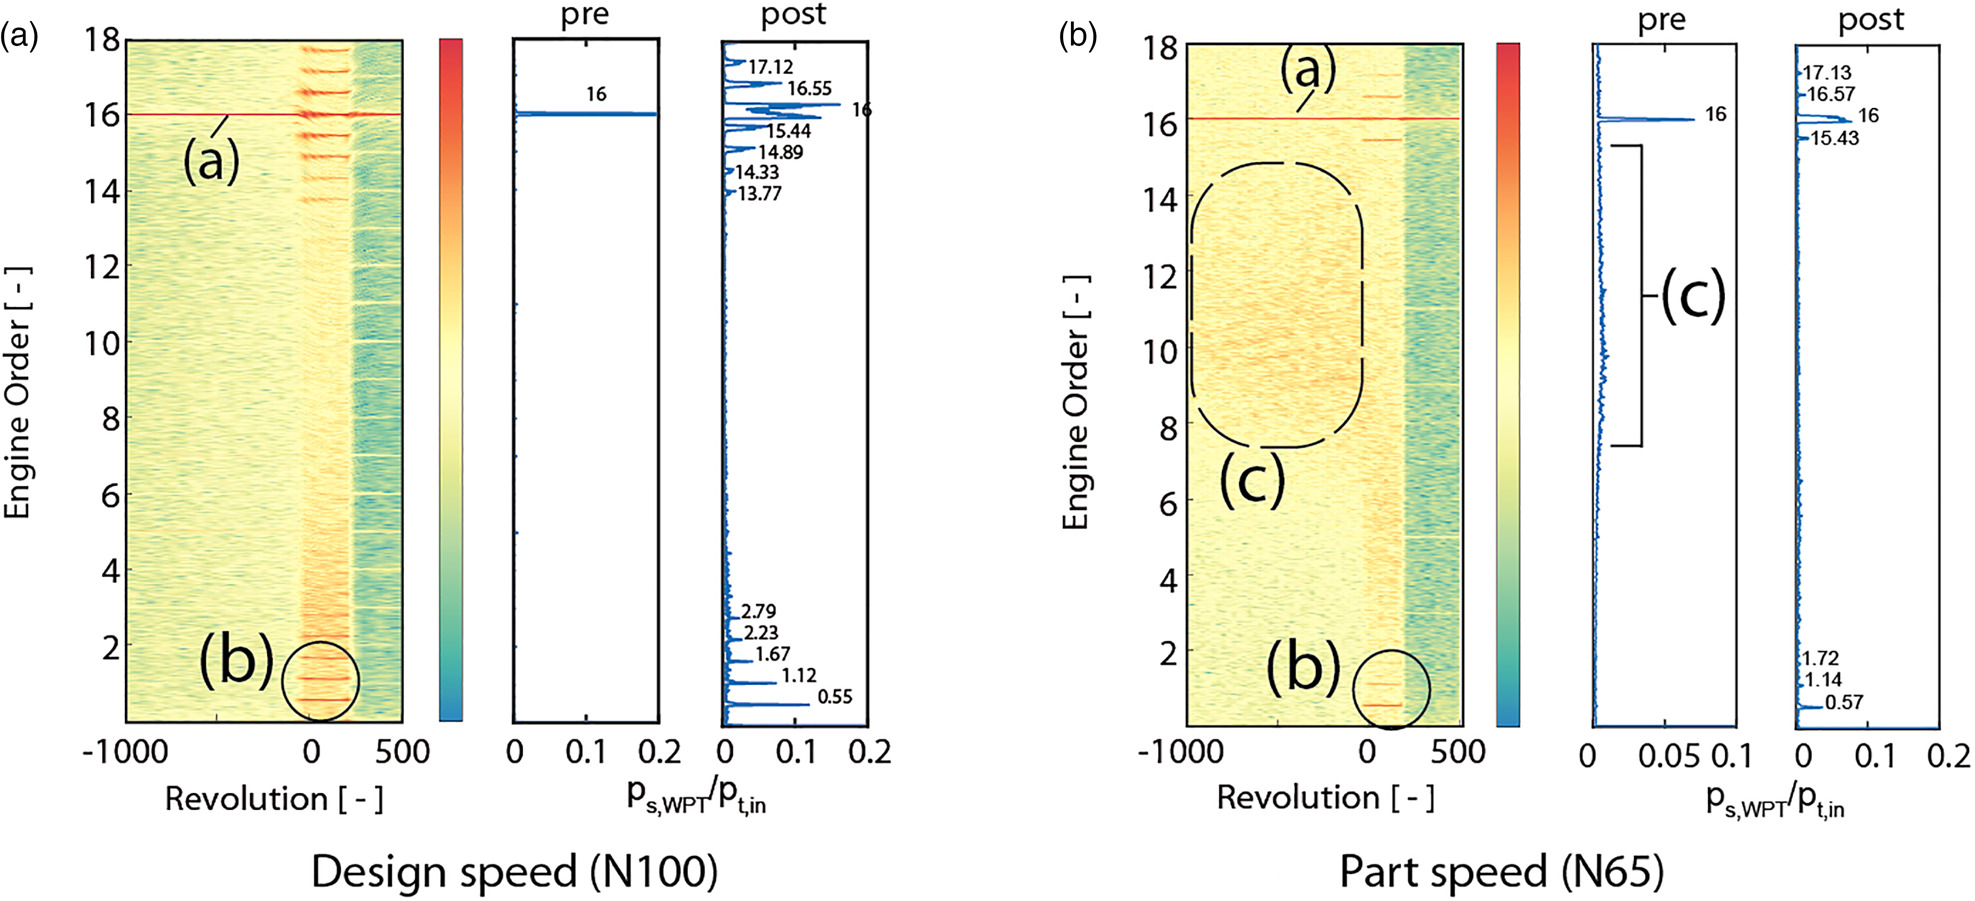
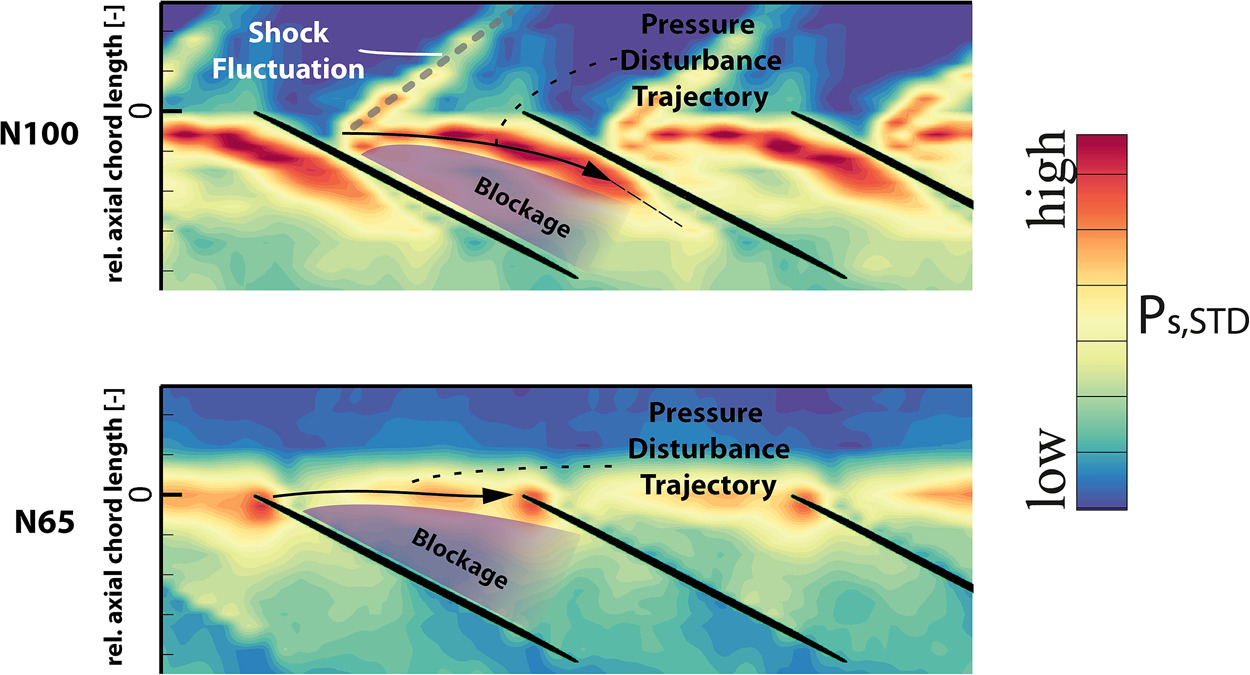
Figure 10 illustrates the standard deviation of the WPT data for the last 100 revolutions before stall occurrence. At nominal speed, a line of high deviation can be seen at the shock position, thus a strong fluctuation of the shock is present before stall occurs. A high deviation region leading from the suction side to the adjacent pressure side potentially marks the shear region between main flow and tip vortex induced blockage zone at the blade tip. The findings of Möller and Schiffer (2020) connects this shear layer with the occurrence of pre stall disturbances such as radial vortices. At N100, the trajectory of this shear layer leads into the rotor passage, thus enabling possibly occurring flow disturbances to propagate downstream the rotor and decay. For N65, the blockage zone comprises the whole passage at the rotor tip, forcing aerodynamic disturbances to convect circumferentially towards the adjacent leading edge [see Stapelfeldt and Brandstetter (2020) and Brandstetter and Stapelfeldt (2021)], which is assumed to be the reason for the broad band excitation evident in Figure 9 at marker c.
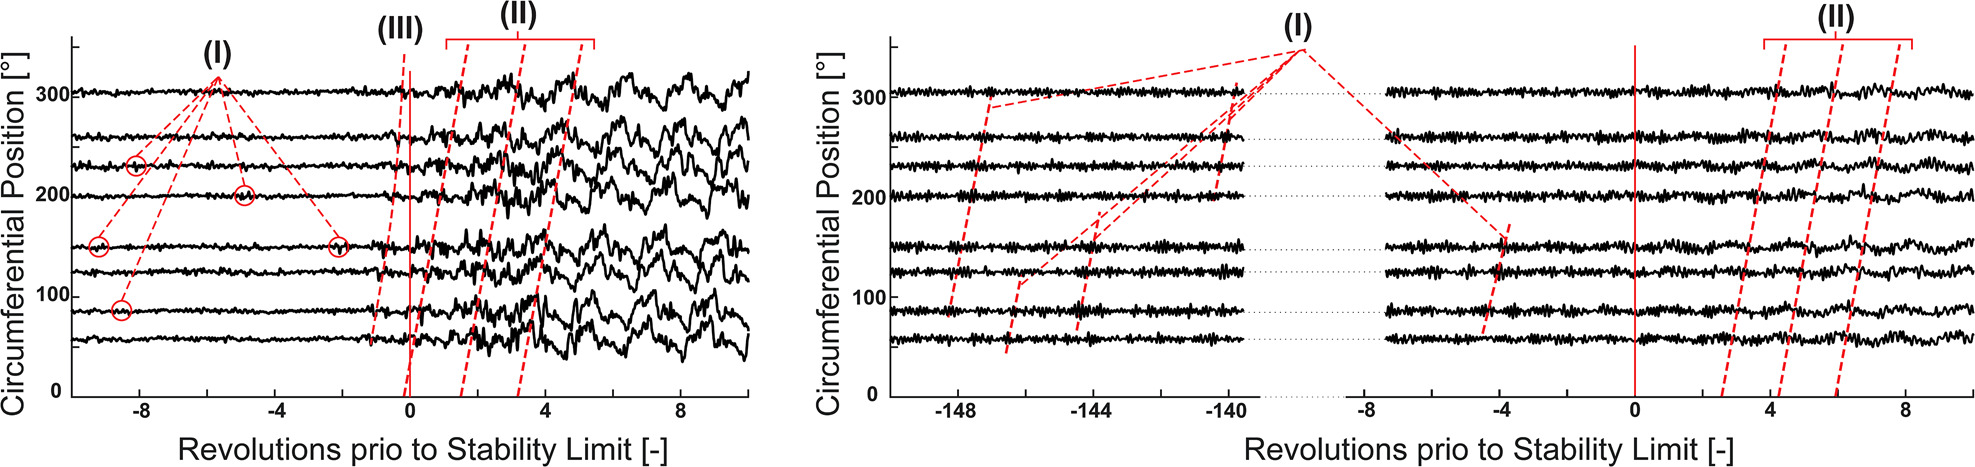
The above shown spectrogram is based on data of a single WPT sensor at one circumferential position. To investigate the “full-annulus” behavior, spectra of the circumferentially distributed sensors can be analyzed. Alternatively, the pressure signals of the circumferential WPTs can be used to investigate the aerodynamic phenomena, e.g., spikes prior to stall or the spatial propagation of rotating stall cells. Figure 11 illustrates the pressure traces during stall inception, determined by WPT sensors at the rotor leading edge, both for N100 and N65. Using the deviation of the signal with respect to prior revolutions [data evaluation method see Brandstetter et al. (2018)], pressure fluctuations can be depicted. Pressure peaks prior to rotating stall indicate aerodynamic fluctuations within the interrogation area at the leading edge [see marker (I)]. During stall, the pronounced pressure drop due the stall cell is visible [marker (II)], and the circumferential propagation can be determined based on the phase between the distinct pressure signals at different sensor positions. At N100, it can be depicted that only minor disturbances occur randomly before rotating stall. In this dataset, the onset of rotating stall is initiated with a first disturbance (III) before a constant phase shift indicates the circumferential propagation of a single stall cell. At N65, circumferentially propagating aerodynamic structures are evident prior to stall [(compare marker (I)]. During stall, the pressure drop due to the stall cell is less pronounced, as already visible in Figure 7.
Conclusions
The TUDa-GLR-OpenStage test case provides a comprehensive data set, both for steady and unsteady aerodynamics. This paper introduces the unsteady aerodynamic instrumentation and exemplary analysis for steady-state and transient operating conditions. It aims to highlight potential analyses and methods, to enhance the overall understanding of the underlying physics and compare the experimental results to simulations. Various other analyses are feasible, depending on the targets of investigation, also including the application of machine learning.
The results show aerodynamic effects associated to the transonic operation, including shocks and interaction with secondary flow. It also indicates the differences between design and off-design operation, e.g., part speed conditions. The analysis shows a blade-to-blade variation in shock position already for steady-state conditions. Besides others, this highlights the importance of considering the real blade geometries, for example including manufacturing deviations and untwist variations, during numerical investigations. From an experimental point of view, this also requires time-resolving measurement systems to investigate the aerodynamics. This can for example be achieved by high-speed particle image velocimetry measurements, resolving the individual rotor blade passages.
The highlighted occurrence of aerodynamic disturbances prior to rotating stall, corresponding circumferential propagation trajectory and apparent differences depending on the operating conditions, indicate similarities to recent research findings, both experimentally and numerically. Applying time-resolving measurement techniques, such as high-speed PIV in conjunction with WPT, might be useful to shed more light into the origin and mechanisms of convective pre-stall disturbances, relevant for stall inception and aeromechanic instabilities. Corresponding unsteady simulations can be helpful to foster the overall understanding of the underlying aerodynamic phenomena.
In general, the test case shall foster international research collaborations and a common validation case for numerical applications as well as advanced methods, for example joint approaches using simulations, experimental data and machine learning.
The data set of the TUDa-GLR-OpenStage is available at glr.tu-darmstadt.de.