
Introduction
The CO2- and NOx-emissions of internal combustion engines (ICEs) can be significantly reduced by increasing the engine’s air-to-fuel ratio
These issues were addressed in a previous paper by Sagan et al. (2022a), in which the operating range of the Worldwide harmonized light-vehicles test cycle (WLTC) was covered with air-to-fuel ratios of
State-of-the-art solutions for pivoting vanes in turbomachines typically have a gap at the hub side or at the shroud side of the vanes end, leading to secondary flow losses and a reduction of the machine performance (Benstein and Wood, 1964; Penny, 1964; Berenyi and Raffa, 1979). Understanding and reducing these losses in nozzles (and rotors) is the subject of former research, e.g. in Kammeyer et al. (2010b) or Natkaniec et al. (2011). The relative gap height,
was found to be a key factor (Storer and Cumpsty, 1991; Lei et al., 2022). Since the minimal absolut gap height is constrained by the bearings and the thermo-mechanical expansion of the components, small machines show higher relative gap height and, consequently, higher relative losses. Although much effort has been put into reducing and avoiding these gap losses, e.g. Kammeyer (2011) or Gottschall et al. (2012), the results have not yet been transferred to small axial turbines using a VTG, marking the second major objective of this paper.Requirements
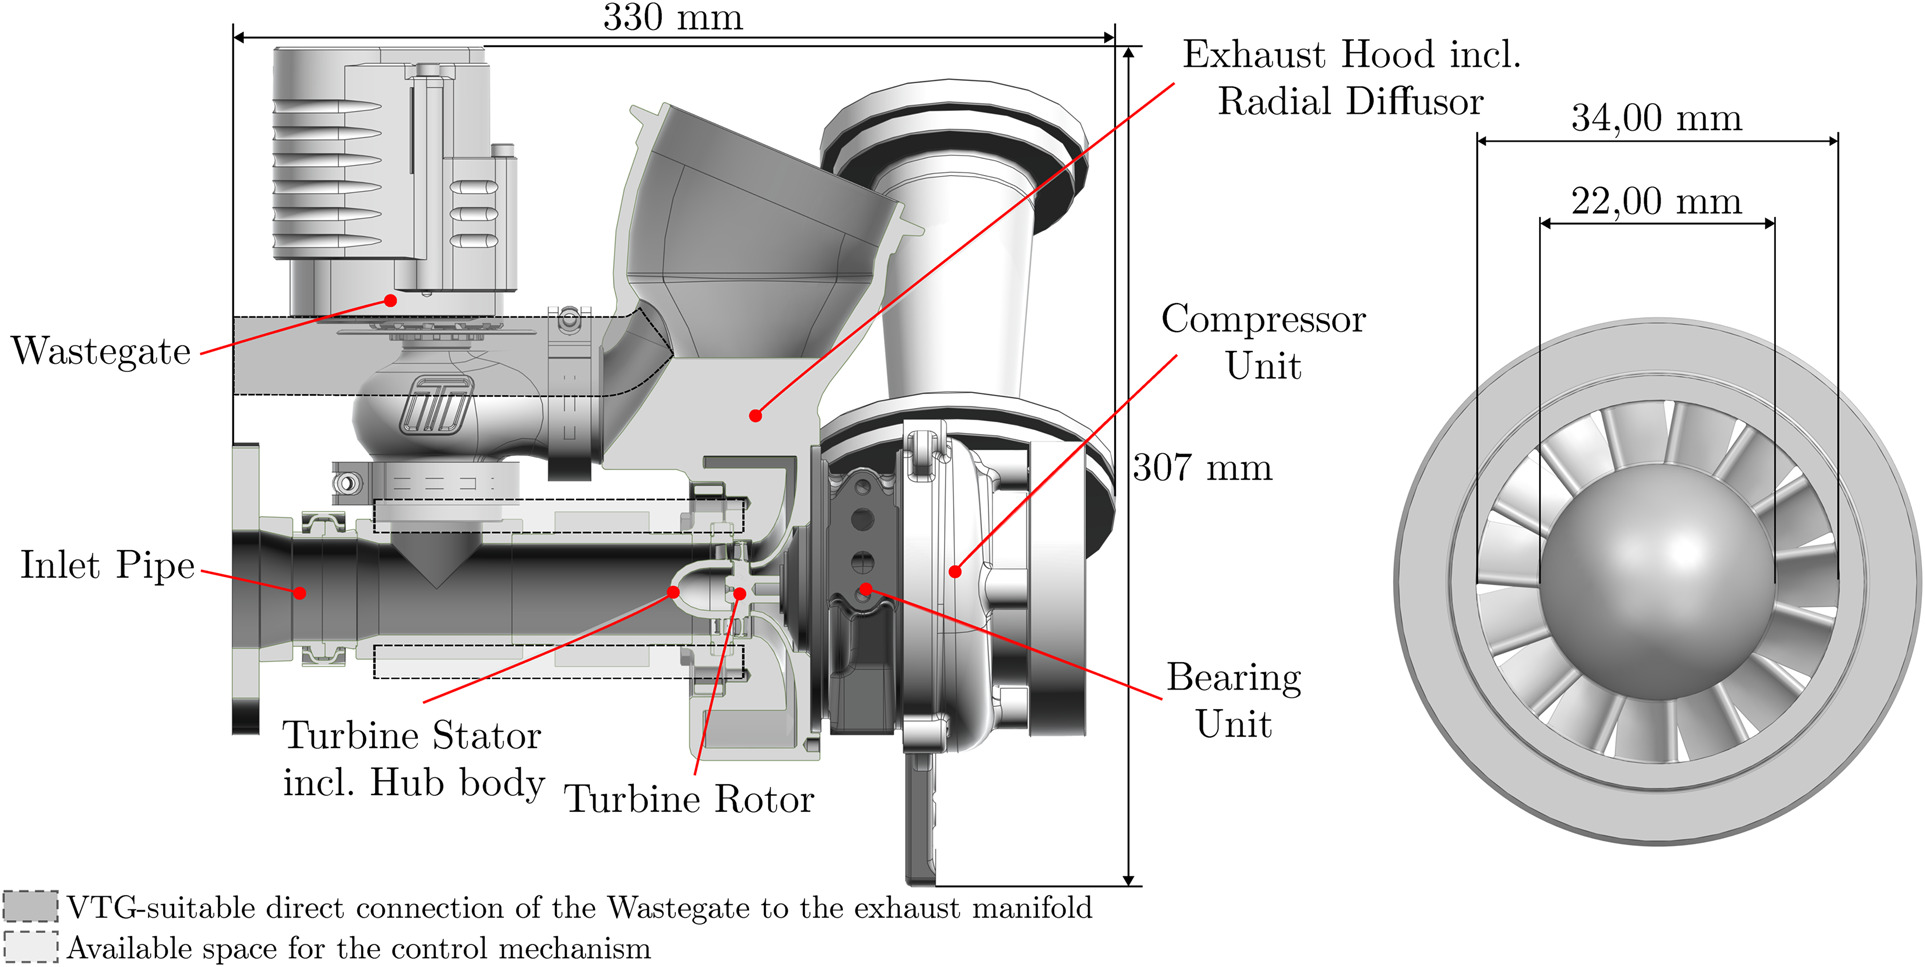
The inital step in the process of designing and implementing the VTG is to identify the available installation space. Therefore, a model of the turbine from Sagan et al. (2022a) is shown in Figure 1. It can be seen that the oversized wastegate leaves insufficient space for the implementation of the VTG, despite the selection of the smallest commercially available wastegate. The authors are aware that this is a suboptimal solution and that the layout leaves considerable room for improvements. For example, the flow bypass could be implemented with a specially designed wastegate that directly connects the exhaust manifold of the engine to the turbine casing, thereby creating space for the control mechanism of the VTG in the axial direction (see shaded areas in Figure 1). This area is, therefore, regarded as the available installation space for the VTG, although the redesign of the layout is not within the scope of this paper. The small size of the stator is a direct consequence of the requirement to provide high compressor boost pressures at high exhaust gas densities during lean-burn operation. However, due to the small dimensions of the stator, the implementation of the VTG is quite challenging and requires a compact design. Simultaneously, the VTG is exposed to harsh operating conditions with gas temperatures of up to 970 °C in stoichiometric engine operation and must, therefore, be highly robust.
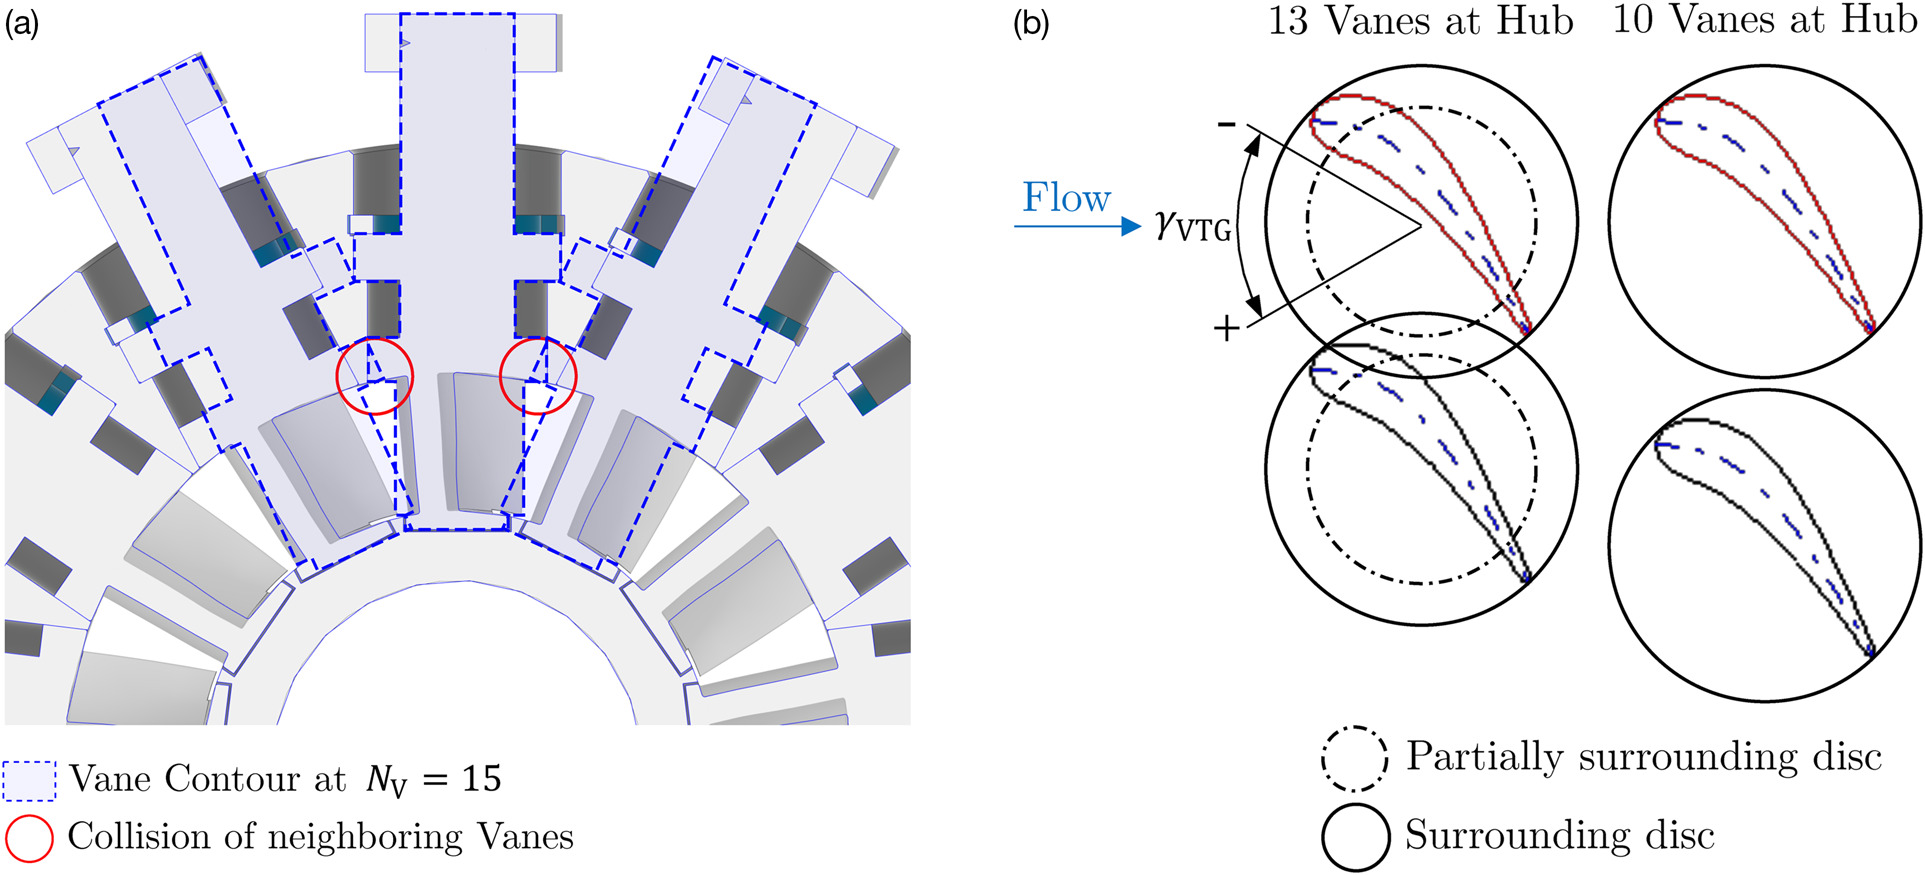
Concerning the required VTG pivot angle range, preliminary 1D engine simulations in combination with preliminary 3D CFD simulations of the initial turbine design without radial gaps resulted in a pivot angle range of −10° to 5° (Sagan et al., 2022b), whereby the negative sign indicates the closing and the positive sign the opening of the VTG (compare Figure 2b). Since the simulations are done without radial gaps, the secondary flow losses are underestimated, likely resulting in a higher actual required pivot angle range. Therefore, an estimated safety margin of 5° is added to the range determined above, resulting in a targeted pivot angle range of 20°.
VTG design
The subsequent objective in the VTG design is to find a suitable mechanism for adjusting the pivoting vanes. In this paper, a simple mechanism is selected with a linear actuator that rotates the vanes via levers. Although the control range is limited by the collision of adjacent levers, this concept can provide the targeted pivot angle range of 20
Due to the small vane heights of only 6 mm, even small radial gaps are expected to have a significant impact on the turbine’s performance and choke characteristic. To minimize these losses, coin-shaped disks are added to seal the vane ends. While the disk can cover the entire vane on the shroud side, space limitations prevent the full sealing on the hub side for vane numbers
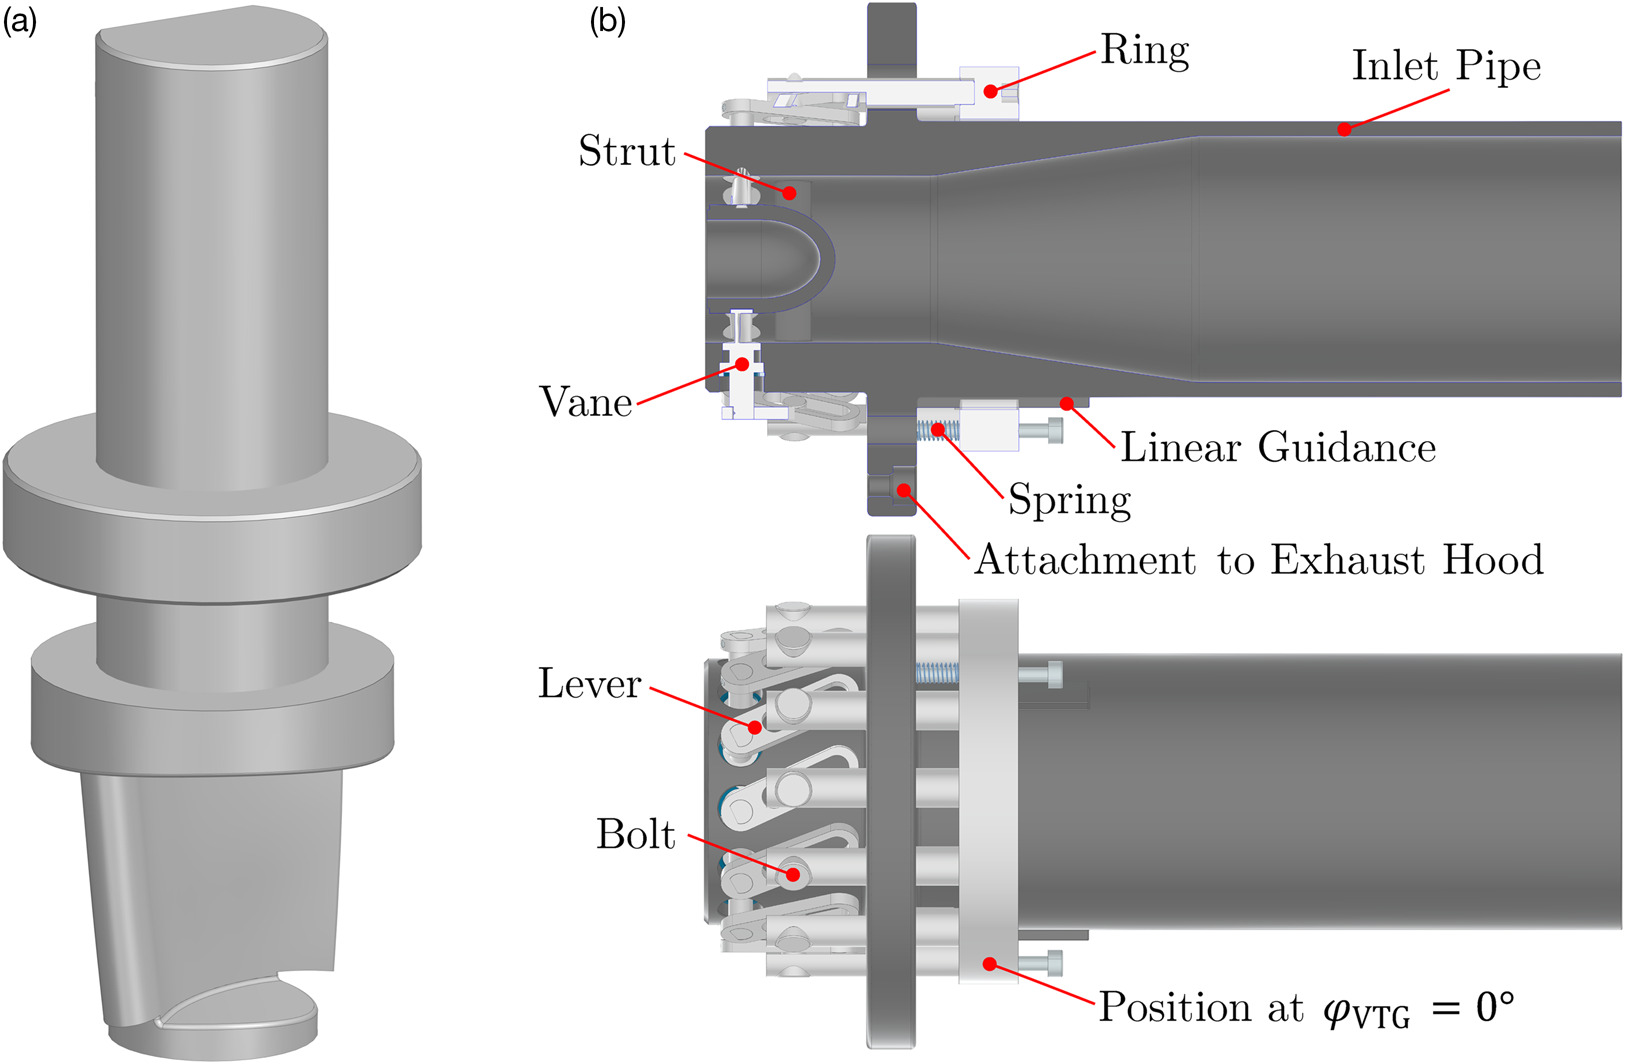
With the number of vanes set, the vanes can be inserted from the outside of the inlet and secured radially with retaining rings. By attaching the levers to the vanes, an interface is created for the connection to the control mechanism. Figure 3b shows a possible solution following the approach of using levers with a guide groove. In this configuration, the actuator-induced linear movement of the ring is converted into a rotation of the vane. However, it should be noted that this is only a preliminary design, and the mechanism could be further optimized, particularly with regard to the comparatively large axial installation space required. Also, potential leakage flow has not yet been taken into account in this design.
Vane redesign
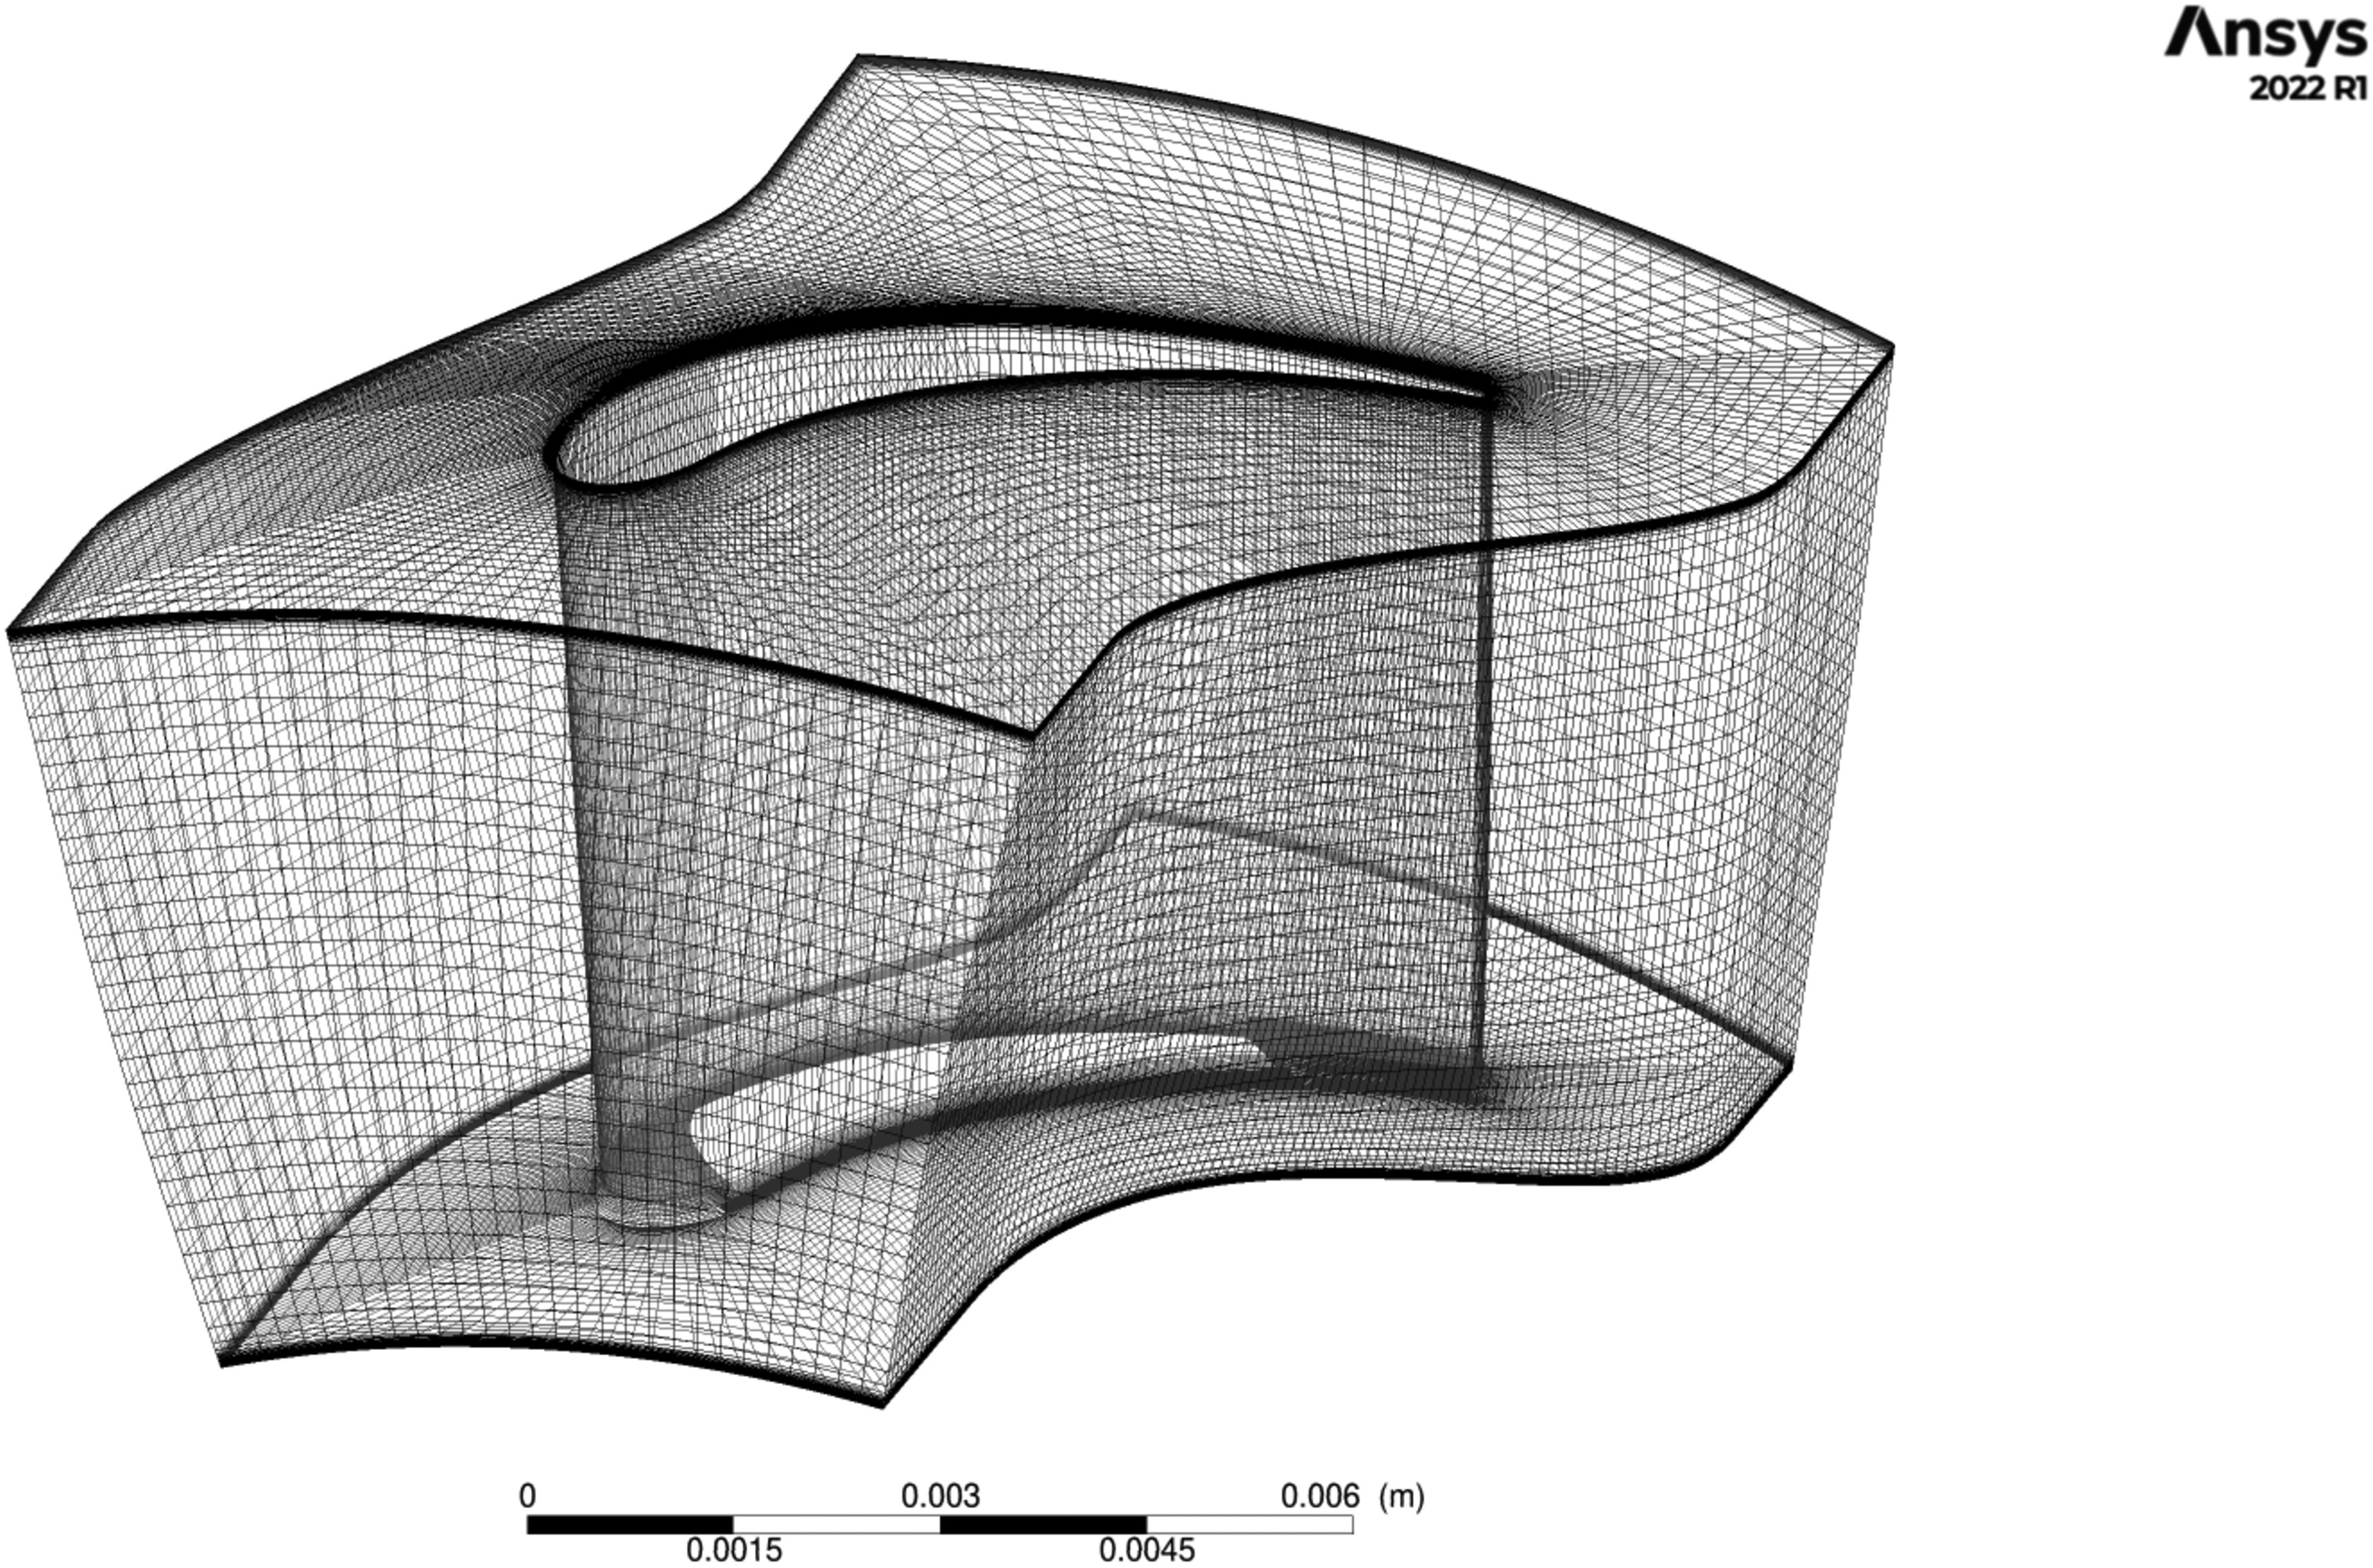
In order to meet the characteristics of the initial turbine without a gap, CFD simulations are performed in Ansys CFX based on the numerical setup from Sagan et al. (2022a). It consists of the turbine inlet, the stator, the rotor, and the turbine exhaust hood with its integrated diffuser unit. This setup is updated with the revised stator geometry and the reduced number of vanes, but without hub-gaps in order to save time with the meshing. The meshing of the stator is done using the ICEM CFD module of Ansys. In order to estimate the error of the new stator mesh due to the spatial discretization, a mesh sensitivity study is performed using two systematically refined stator meshs with a refinement rate of
The calculations converged to an order of 2.65 and indicated a GCI value of 1.7% for the medium mesh, leading to a 95%-confidence interval of
With the updated model, the vane redesign is tackled to match the choke characteristic of the old and new stator design. As demonstrated by Sagan et al. (2022a), the critical operating range for the lean operation is within the lower engine speed range. Consequently, this was the basis for the selection of the aerodynamic design point (ADP, see Table 1). The ADP is, thus, utilized and investigated for the redesign of the stator with a VTG rack angle of
Table 1.
Boundary conditions of the ADP.
| Parameter | Value | Unit |
|---|---|---|
| Total inlet pressure | 1.7 | bar |
| Total inlet temperature | 722 | K |
| Rotational speed | 148,700 | min−1 |
| Static outlet pressure | 1.1 | bar |
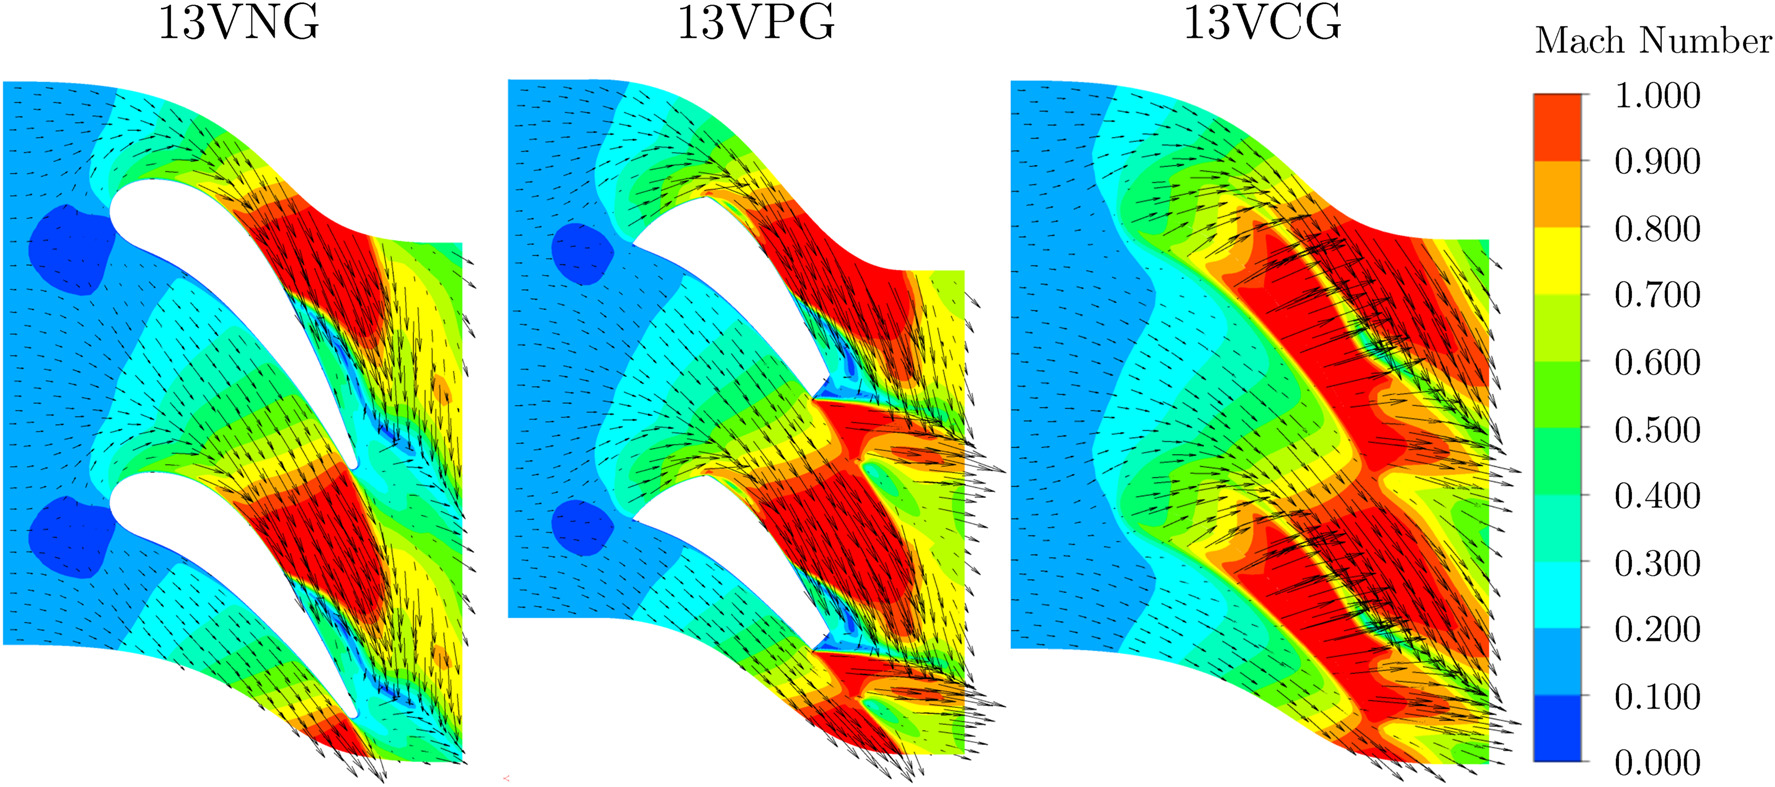
Figure 4.
Flow field at the mid span of the initial 15V design from Sagan et al. (2022a), the unchanged 13V design, and the adjusted 13V design colored by the Mach Number.
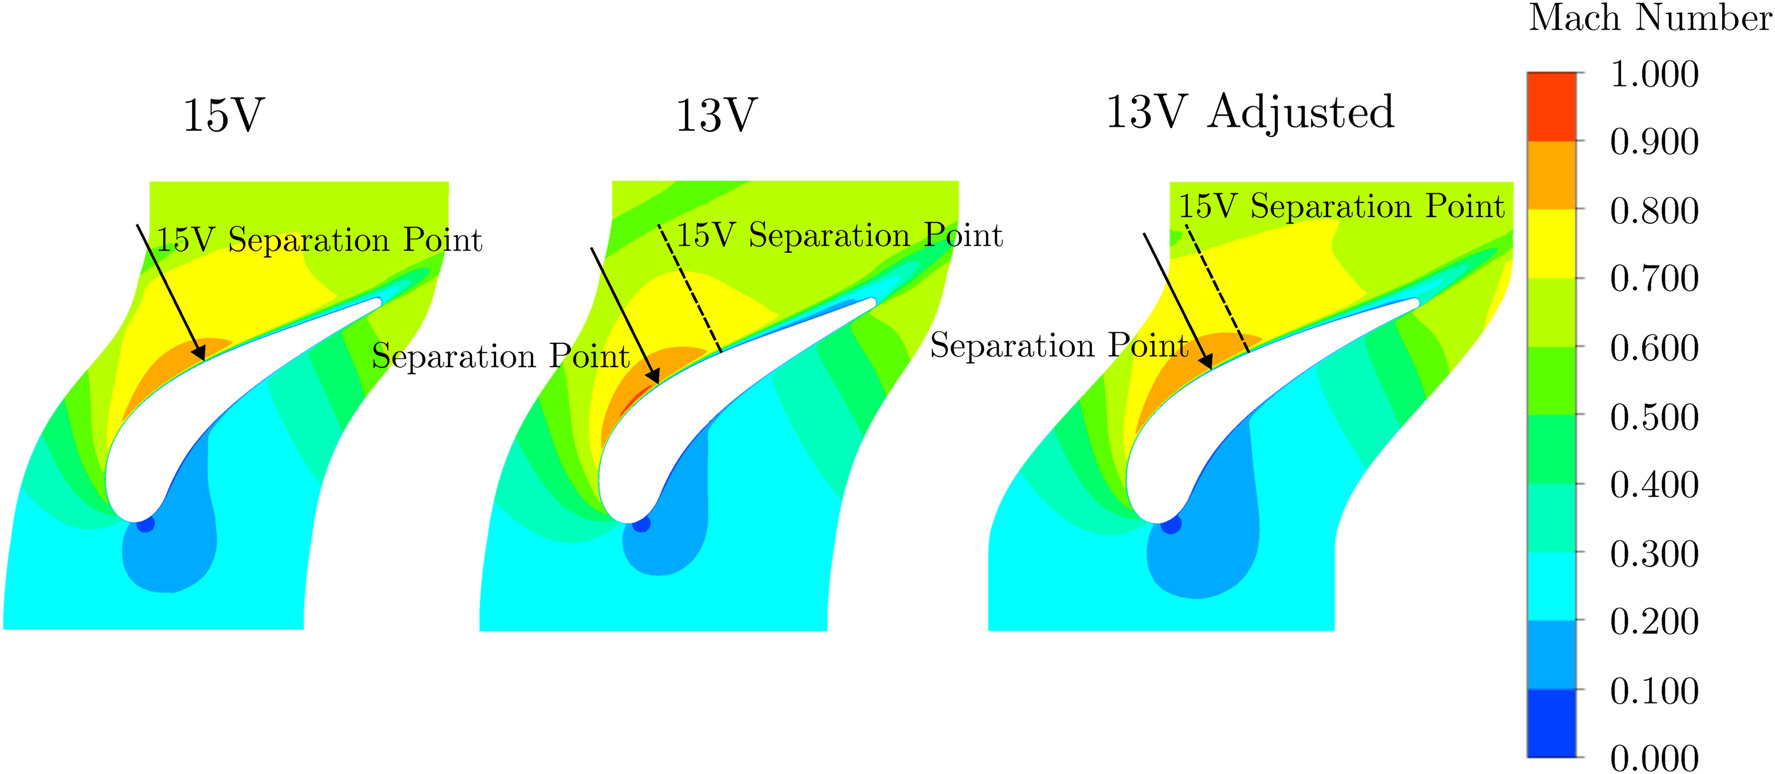
The direct comparison reveals a significant shift of the suction-sided flow separation for the 13V configuration in the area of the TE. As a result, larger wake areas can be observed. Moreover, the flow turning is reduced, thereby increasing the incidence at the rotor inlet. This can be seen by the rotor inlet flow angles
Table 2.
Rotor inlet flow angles βrot,in and Zweifel coefficients ζ c , 3
| Span | ||||||
|---|---|---|---|---|---|---|
| βrot,in | CZ | βrot,in | CZ | βrot,in | CZ | |
| Tip | 75.3° | 1.26 | 85.3° | 1.61 | 77.9° | 1.51 |
| Mid | 54.5° | 0.99 | 63.7° | 1.25 | 55.0° | 1.15 |
| Hub | 44.1° | 0.77 | 48.3° | 0.92 | 43.4° | 0.84 |
Concerning the mass flow rates, the increased cross-section of the 13V configuration yields a 7.2% higher mass flow rate of now 48.7 g s−1 compared to the initial 45.2 g s−1. To reduce this discrepancy, the trailing edge (TE) control points are gradually shifted in the circumferential direction until the mass flow rate of the initial design is achieved. This is regarded as a fairly simple but effective approach, since it changes the flow outlet angle and also slightly increases the stator solidity. After a TE shift of 1.25°, the absolute deviation of the mass flow rate is already only 0.1 g s−1 (
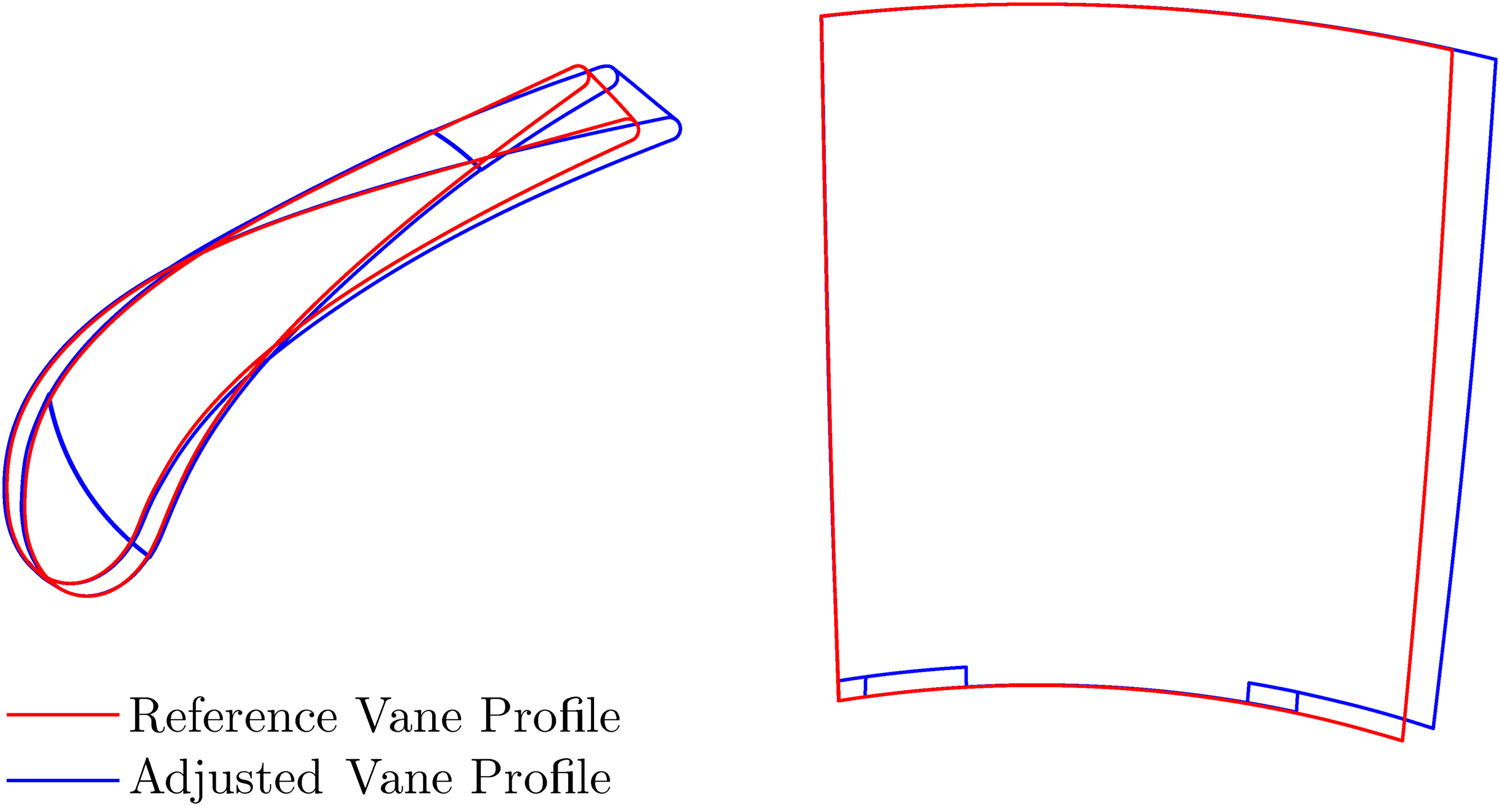
Given that the previous investigations are carried out without the radial gaps at the LE and TE in the hub area of the vane, it is imperative to examine the influence of these gaps on the choke characteristic to examine whether further adjustments to the blade design are necessary. The gap height is set to 0.175 mm as this is the gap required to allow the vanes to rotate. The evaluation shows that the gaps only lead to minor mass flow rate increases of 0.4 g s−1 and additional efficiency losses of 0.2%-pts. To counteract the mass flow rate deviation, the profile thickness is slightly enlarged by 0.1 mm at all vane spans, without changing the LE and TE thickness. As a result, the mass flow rates of the design without gaps are achieved. With regard to the efficiency, the thickness adjustments caused no further efficiency losses. Thus, the vane redesign is completed and the influence on the turbine performance map can be investigated. A visual comparison of the initial and the adjusted vane designs is provided in Figure 5.
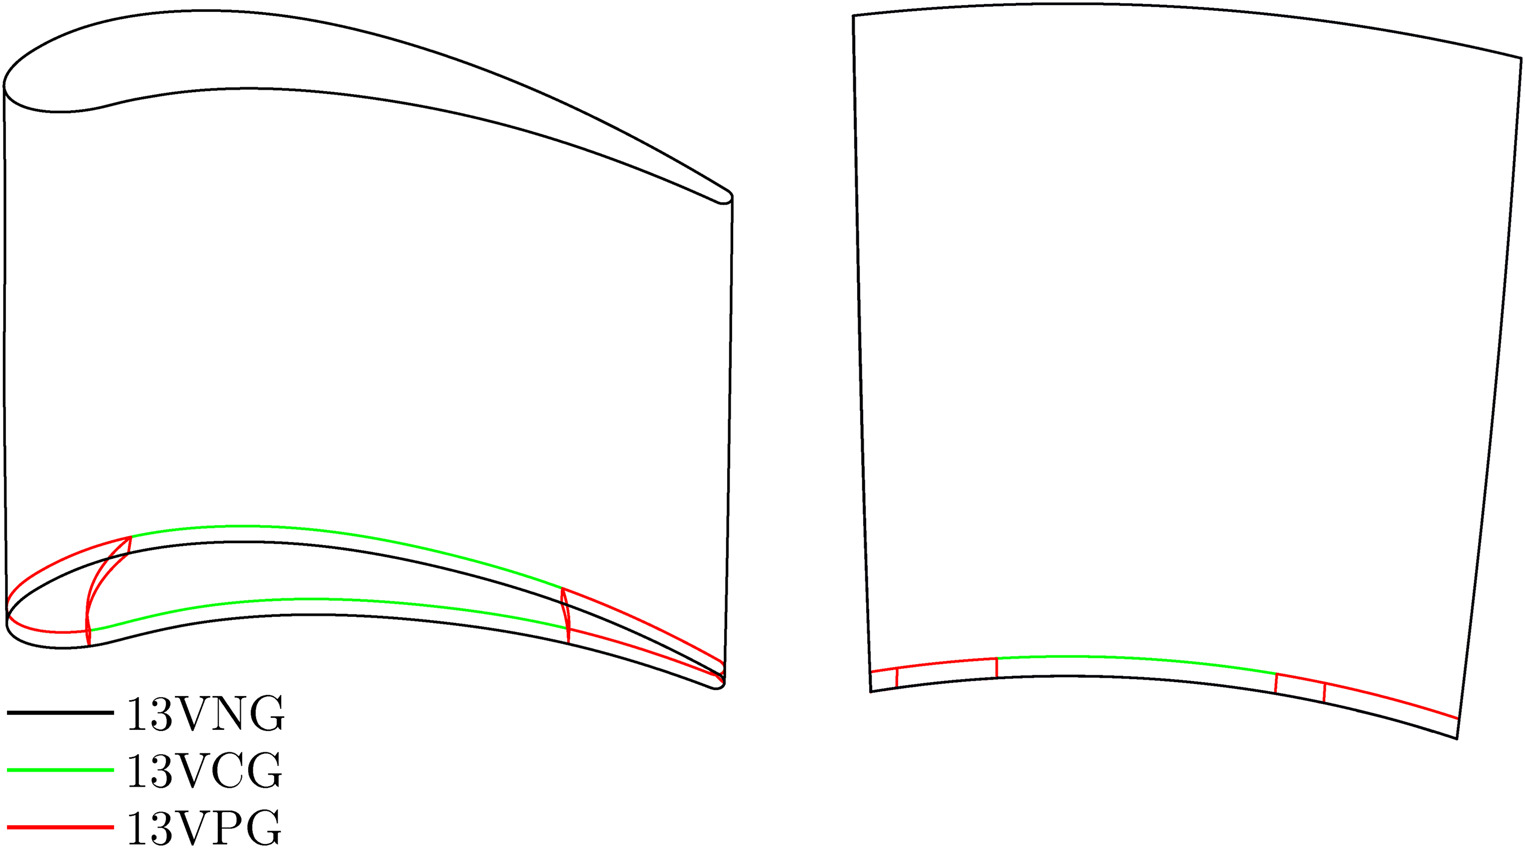
Seal effects
This section addresses the evaluation of the turbine’s performance in light of the implemented modifications and the effects of the seals. To distinguish the effects of the seals and the effects of the reduced number of vanes, in addition to the initial 15V design and the adjusted 13V design with partial gaps (13VPG), two further configurations are created based on the adjusted 13V design—one with a constant hub gap of 0.175 mm (13VCG) and one with no gap (13VNG). The three 13V configurations investigated are shown in Figure 6. The evaluation of the turbine performance is conducted on a single speed line at
While the differences are relatively small for low expansion ratios, they increase with an elevated expansion ratio. The reason for that are the larger passage throat areas
Figure 7.
Deviations from the 13VPG, the 13VNG, and the 13VCG to the 15V design. (a) Relative mass flow rate and (b) Efficiency.
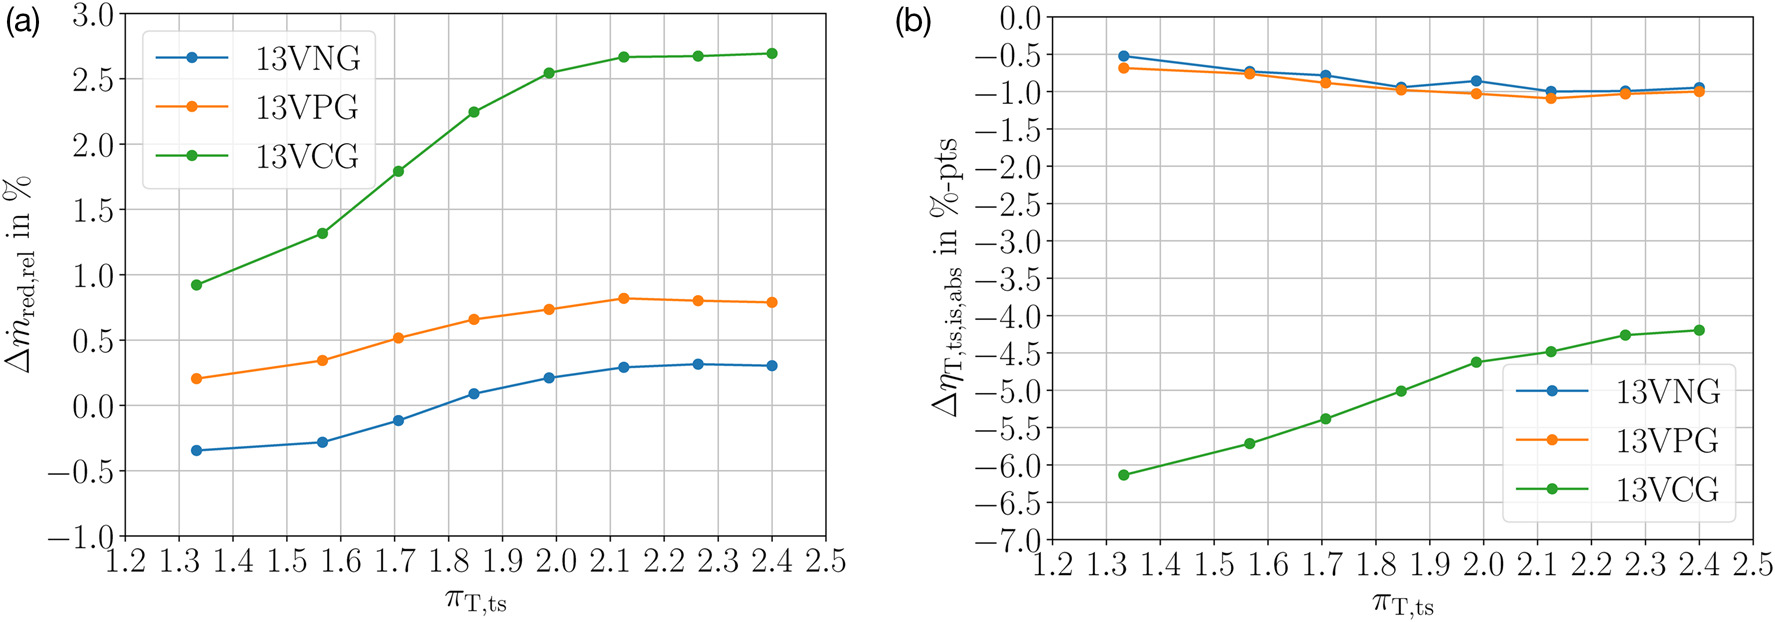
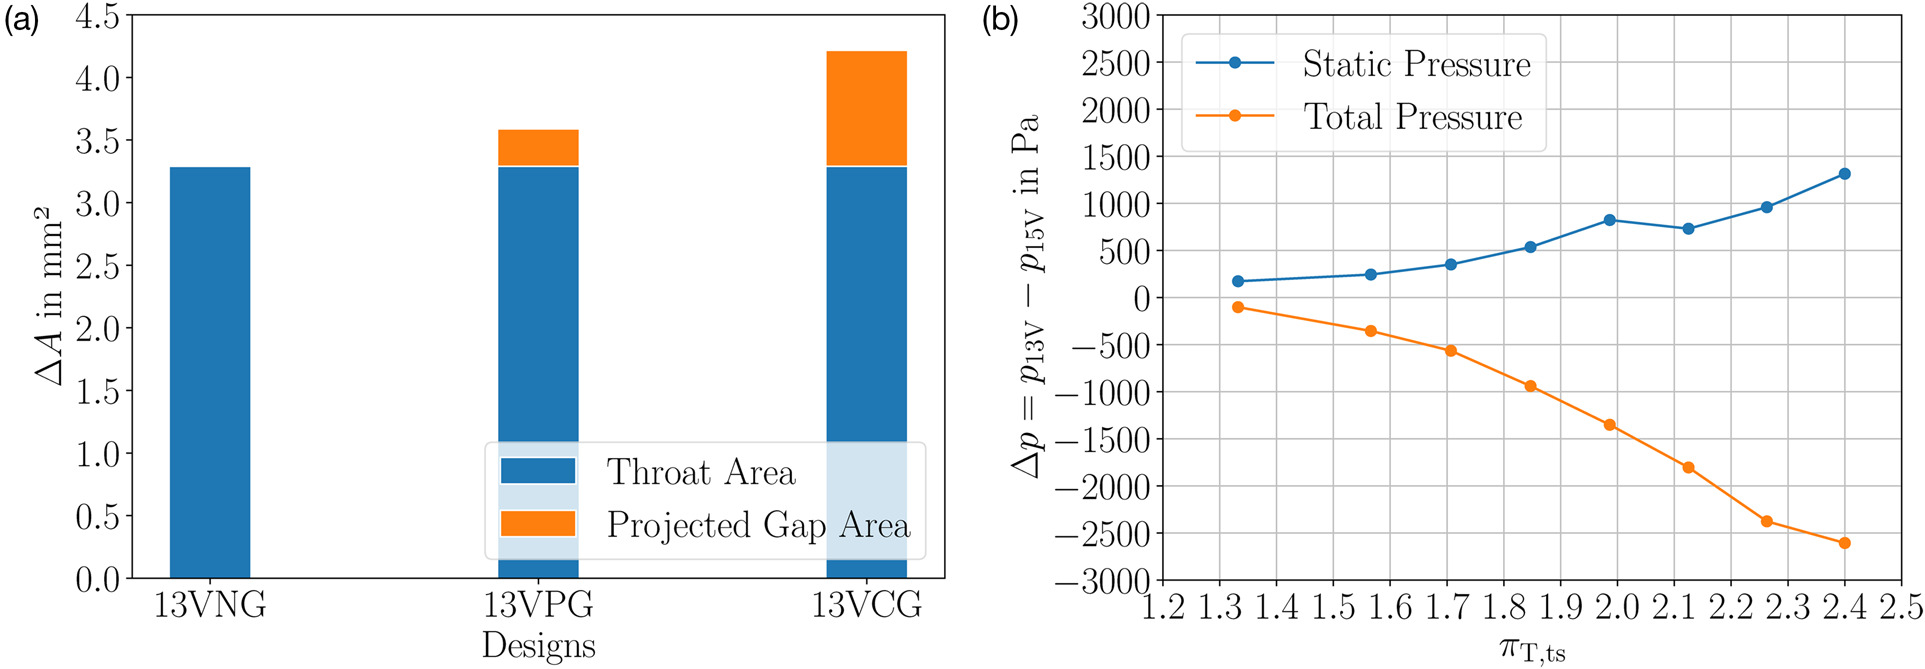
Figure 8.
Factors influencing the reduced mass flow rate of the vane designs. (a) Comparison of the throat area and the projected tip gap area and (b) Absolute stator outlet pressure differences from the 13VNG to the 15V design.
Also in the context of the efficiencies, the ability of the partial seals to maintain the turning of the flow and, thus, to maintain the blade loading in the hub region proves to be a very effective way to reduce losses. As the efficiency levels and their deviations to the 15V design,
in Figure 7b illustrate, the 13VPG design is able to achieve deviations lower than 1.0%-pts. Compared to the efficiency losses of up to 6%-pts with the 13VCG design, this represents a notable improvement. Similar to previous publications in the context of larger cascade profiles (Gottschall et al., 2012), it can, thus, be demonstrated that the partial sealing of the gap in small turbomachines is sufficient to avoid the corresponding negative effects of the tip gaps on the efficiency. The remaining efficiency disadvantages observed in Figure 7b are, therefore, attributed to the larger profile losses of the adjusted stator.Performance maps
In order to compare the performance maps of the 13VPG design with those of the initial 15V design, CFD simulations are performed for the four initially selected rack angles of
Figure 10.
Investigation of the mass flow rates of the 13VPG and the 15V design. (a) Relative mass flow rate deviations of the 13VPG design to the 15V design and (b) Overview of the achievable operating range with 13VPG design.
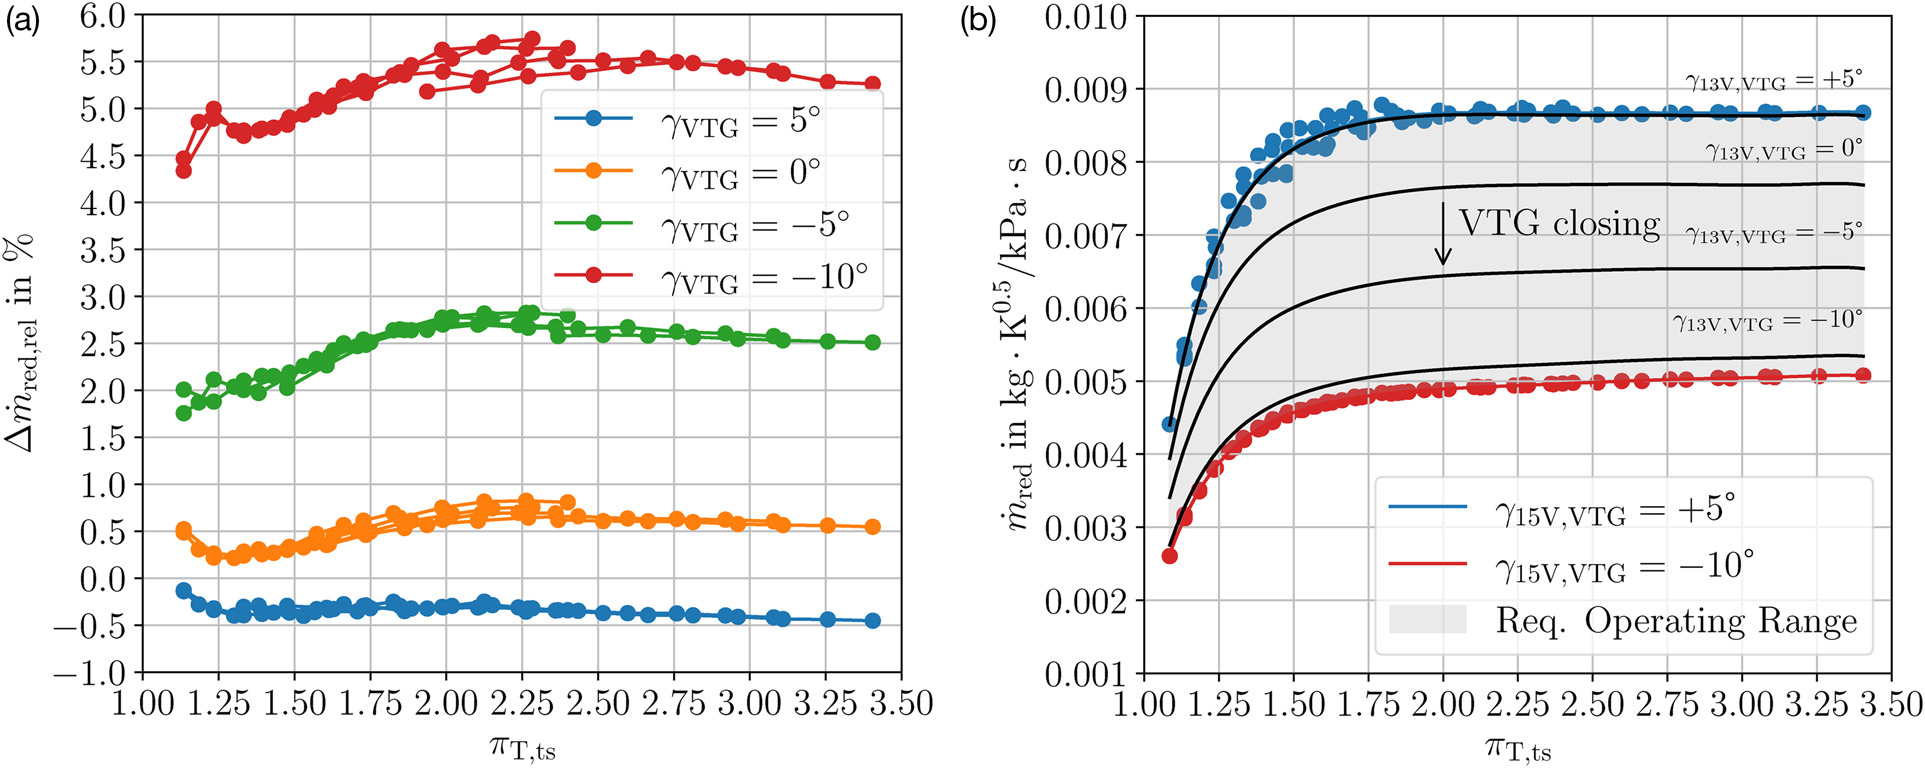
These results can be explained by two causes. Firstly, the differences in the throat area between the 13VPG and 15V design increase when the vanes are pivoted, due to the reduction in the number of vanes. Secondly, the projected hub-gap area increases when the VTG is closed. Starting from the −5°-position, the difference in the throat area increases from initially +0.5% to +8.3% at the −10°-position. Concurrently, the projected hub-gap area increases by
In addition to the choke characteristic, the turbine efficiencies and the associated deviations are shown in Figure 11. As with the choke characteristic, the results demonstrate a similar picture. The lowest losses are obtained for the
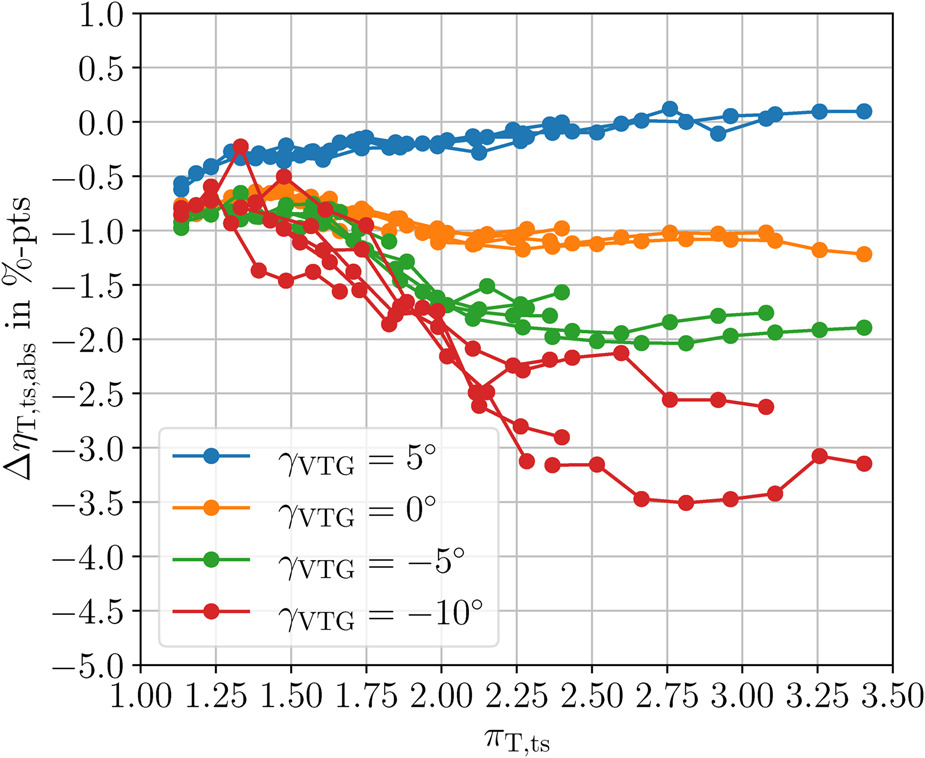
Summarized, inefficiencies are apparent throughout the majority of the operating range, of which the losses at the
Conclusion
The present paper introduced a methodology for the subsequent implementation of a variable turbine geometry in an automotive T/C using a small axial turbine. The conceived control mechanism allowed the vanes to turn in a range of 20°. This required a reduction in the number of vanes from 15 to 13 due to the available circumferential space. To match the choke characteristic of the two designs, the TE was gradually shifted in circumferential direction and the vane thickness was increased. Both methods were found to be straightforward and effective for adjusting the mass flow rates. Another desirable adjustment would have been to increase the chord length to equalize the Zweifel coefficients; however, this was not feasible due to the limitations of the available installation space. Consequently, the 13V design showed a higher blade loading.
Subsequently, the effects of the radial gaps were investigated. Due to the small vane height, it was assumed that the gaps would have a significant impact on the turbine’s performance. This assumption was confirmed by comparing distinct hub-gap designs along a specific speed line. It was found that constant relative hub-gaps of 3% lead to undesirable changes in both the mass flow rates (up to +2.8%) and the turbine efficiencies (up to
Finally, the VTG performance maps of the 13VPG and the 15V design were compared in terms of the coverable mass flow range and the turbine efficiencies. Thanks to the fully sealed tip-gap and the partially sealed hub-gap, the coverable mass flow ranges of both designs proved to be very similar. The 13VPG design requires only for the lower limit of the operating range a slightly larger pivoting angle range. With regard to the efficiency levels, the new 13VPG design showed a maximum disadvantage of only 1.2%-pts. for the most frequently used pivot angles of 5° and 0° and up to 3.5%-pts for the −10° position.
The results of this paper showed that the conceptual and aerodynamic design of the implemented VTG was successful. However, further aspects need to be examined in the future. For example, the sealing to the environment and the influence of thermal expansion have been ignored so far. Also, the utilization of the installation space still shows potential for optimization. These issues will be addressed in a subsequent study.
Other Variables
Mass flow rate in
Area in
Absolute flow velocity in
Zweifel coefficient
Diameter in mm
Grid convergence index
Height in mm
Chord length in mm
Rotational speed in
Number of vanes
Pressure in bar
Refinement rate
Thickness in mm
Temperature in K
Spacing between vanes in mm