
Introduction
Due to the ever-increasing demand for more fuel-efficient gas turbines, intensive research efforts have gone into the design of three-dimensional turbine end walls to reduce loss-inducing secondary flow structures inside the turbine passages. First proposed by Hausammann (1959), this idea received little attention until Rose (1994) published a numerically optimized end wall contour (EWC) which was capable of reducing pressure fluctuations downstream of the turbine guide vane by 70%. An optimization with similar geometric constraints was published by Yan et al. (1999). Even though experimental tests showed only a 19% decrease in secondary flow loss compared to a 40% reduction predicted by numerical simulations, the predicted mechanisms of the end wall contouring could be confirmed. Based on a linear design system, Harvey et al. (1999) conducted the first systematic end wall optimization which had the goal of improving the static pressure distribution on the end wall and the outlet flow angles. Hartland et al. (1999) subsequently verified these designs experimentally in the Durham Cascade. This optimized design reduced the cross-channel pressure gradient especially in the frontal region, leading to a reduction of the intensity and radial extent of the passage vortex. An example of one of the earlier high-pressure axial turbine end wall optimizations is the study published by Brennan et al. (2003), in which the authors predicted an efficiency increase of 0.4%. The subsequent experimental validation (Rose et al., 2001) showed that the actual improvement of 0.59% even exceeded the numerical predictions. This efficiency improvement was achieved by weakening the secondary flows. Their general structure, however, did not change significantly. Further optimizations of this configuration were carried out by Lott et al. (2009), who incorporated the reduction of gas ingress into the rotor-stator cavity in the optimization process. For this purpose, the cavity seal was included in the computational domain. Other optimized turbine configurations were published by, among others, Harvey et al. (2002), Snedden et al. (2010), and Germain et al. (2010). At the Institute of Jet Propulsion and Turbomachinery (IST) at RWTH Aachen University, Poehler et al. (2015) optimized the efficiency of the axial 1.5-stage turbine test rig by applying an end wall contouring for the first stator and rotor. This end wall optimization was combined with a bowed first stator. Experimental validations by Niewoehner et al. (2015) showed that these design choices helped improve the efficiency of the rig by 0.59%.
Another measure to increase the efficiency of gas turbines is to increase the turbine inlet temperature. However, this leads to higher stresses on the components, which is why measures must be taken to protect them from hot gases. One such measure is the injection of purge air through the cavity between the stator and rotor. This prevents hot gas from entering the cavity and so protects the rotor disk. However, the mixing process between purge air and main flow generates entropy and thus reduces the efficiency of the turbine (Denton, 1993). A relationship between purge air mass flow and loss of efficiency was established by McLean et al. (2001a,b). Hunter and Manwaring (2000) found that the dominant reason for the purge-air-induced losses is the lower circumferential velocity of the purge air compared to the main flow. Building on this, Ong et al. (2012) demonstrated that the losses could be reduced by increasing the purge flow’s circumferential velocity. This approach, however, resulted in a decreased sealing of the cavity. A study by Reid et al. (2006) came to similar conclusions. Experimental investigations of the trajectory of the purge flow inside the rotor passage by Schüpbach et al. (2010) and Jenny et al. (2013) demonstrated that the purge flow interacted strongly with the channel vortex and, among other things, increased its size and intensity.
Several research groups have experimentally investigated the influence of purge air on the performance of turbine configurations with non-axisymmetric end walls. A comparison of two different EWC configurations by Schüpbach et al. (2011) showed large differences in the effects of purge flow on the efficiency between the two configurations. The first EWC configuration suffered an efficiency drop of 1.2% per injected mass flow percent. The second EWC configuration exhibited an efficiency drop of 0.7% per injected mass flow percent, which was similar to the behavior of a reference configuration with cylindrical end walls. The authors attributed the different sensitivities to differing pressure fields at the exit of the cavity leading to locally different injection rates and thus changed the vorticity in the main flow. Nevertheless, both configurations overall had a higher efficiency under the influence of purge flow than the baseline configuration with cylindrical end walls. In contrast to this, the EWC configuration investigated by Regina et al. (2014) could not provide any efficiency gain relative to the baseline configuration when a purge air mass flow of 0.8% of the main mass flow was injected. At 1.2% injection rate, the EWC configuration performed worse than the baseline configuration. Given the fact that EWC configuration reactions to purge flow injection can differ significantly, Jenny et al. (2012) created an EWC configuration which explicitly took the purge flow into account during the optimization process. With this configuration, an efficiency gain of 0.8% at an injection rate of 0.8% and a decrease in sensitivity of 18% was achieved. All these investigations show that it is not possible to make general statements about the behavior of EWC configurations under purge flow influence. In order to investigate the behaviour of the design by Poehler et al. (2015) (hereinafter referred to as “F3D configuration”), a secondary air system was integrated into the axial turbine test rig at the IST and detailed measurements of the efficiency and local flow conditions in the rig were carried out. The results of this measurement campaign can be found in Schäflein et al. (2022). Together with numerical simulations, these experiments demonstrated that the F3D configuration loses parts of its efficiency gains when purge flow is injected. In the investigation presented in this paper, numerical simulations together with experimental data are used to explore in detail the flow physics behind the interaction of the purge flow and the secondary flow structures inside the turbine rig.
Methodology
Experimental setup and data acquisition
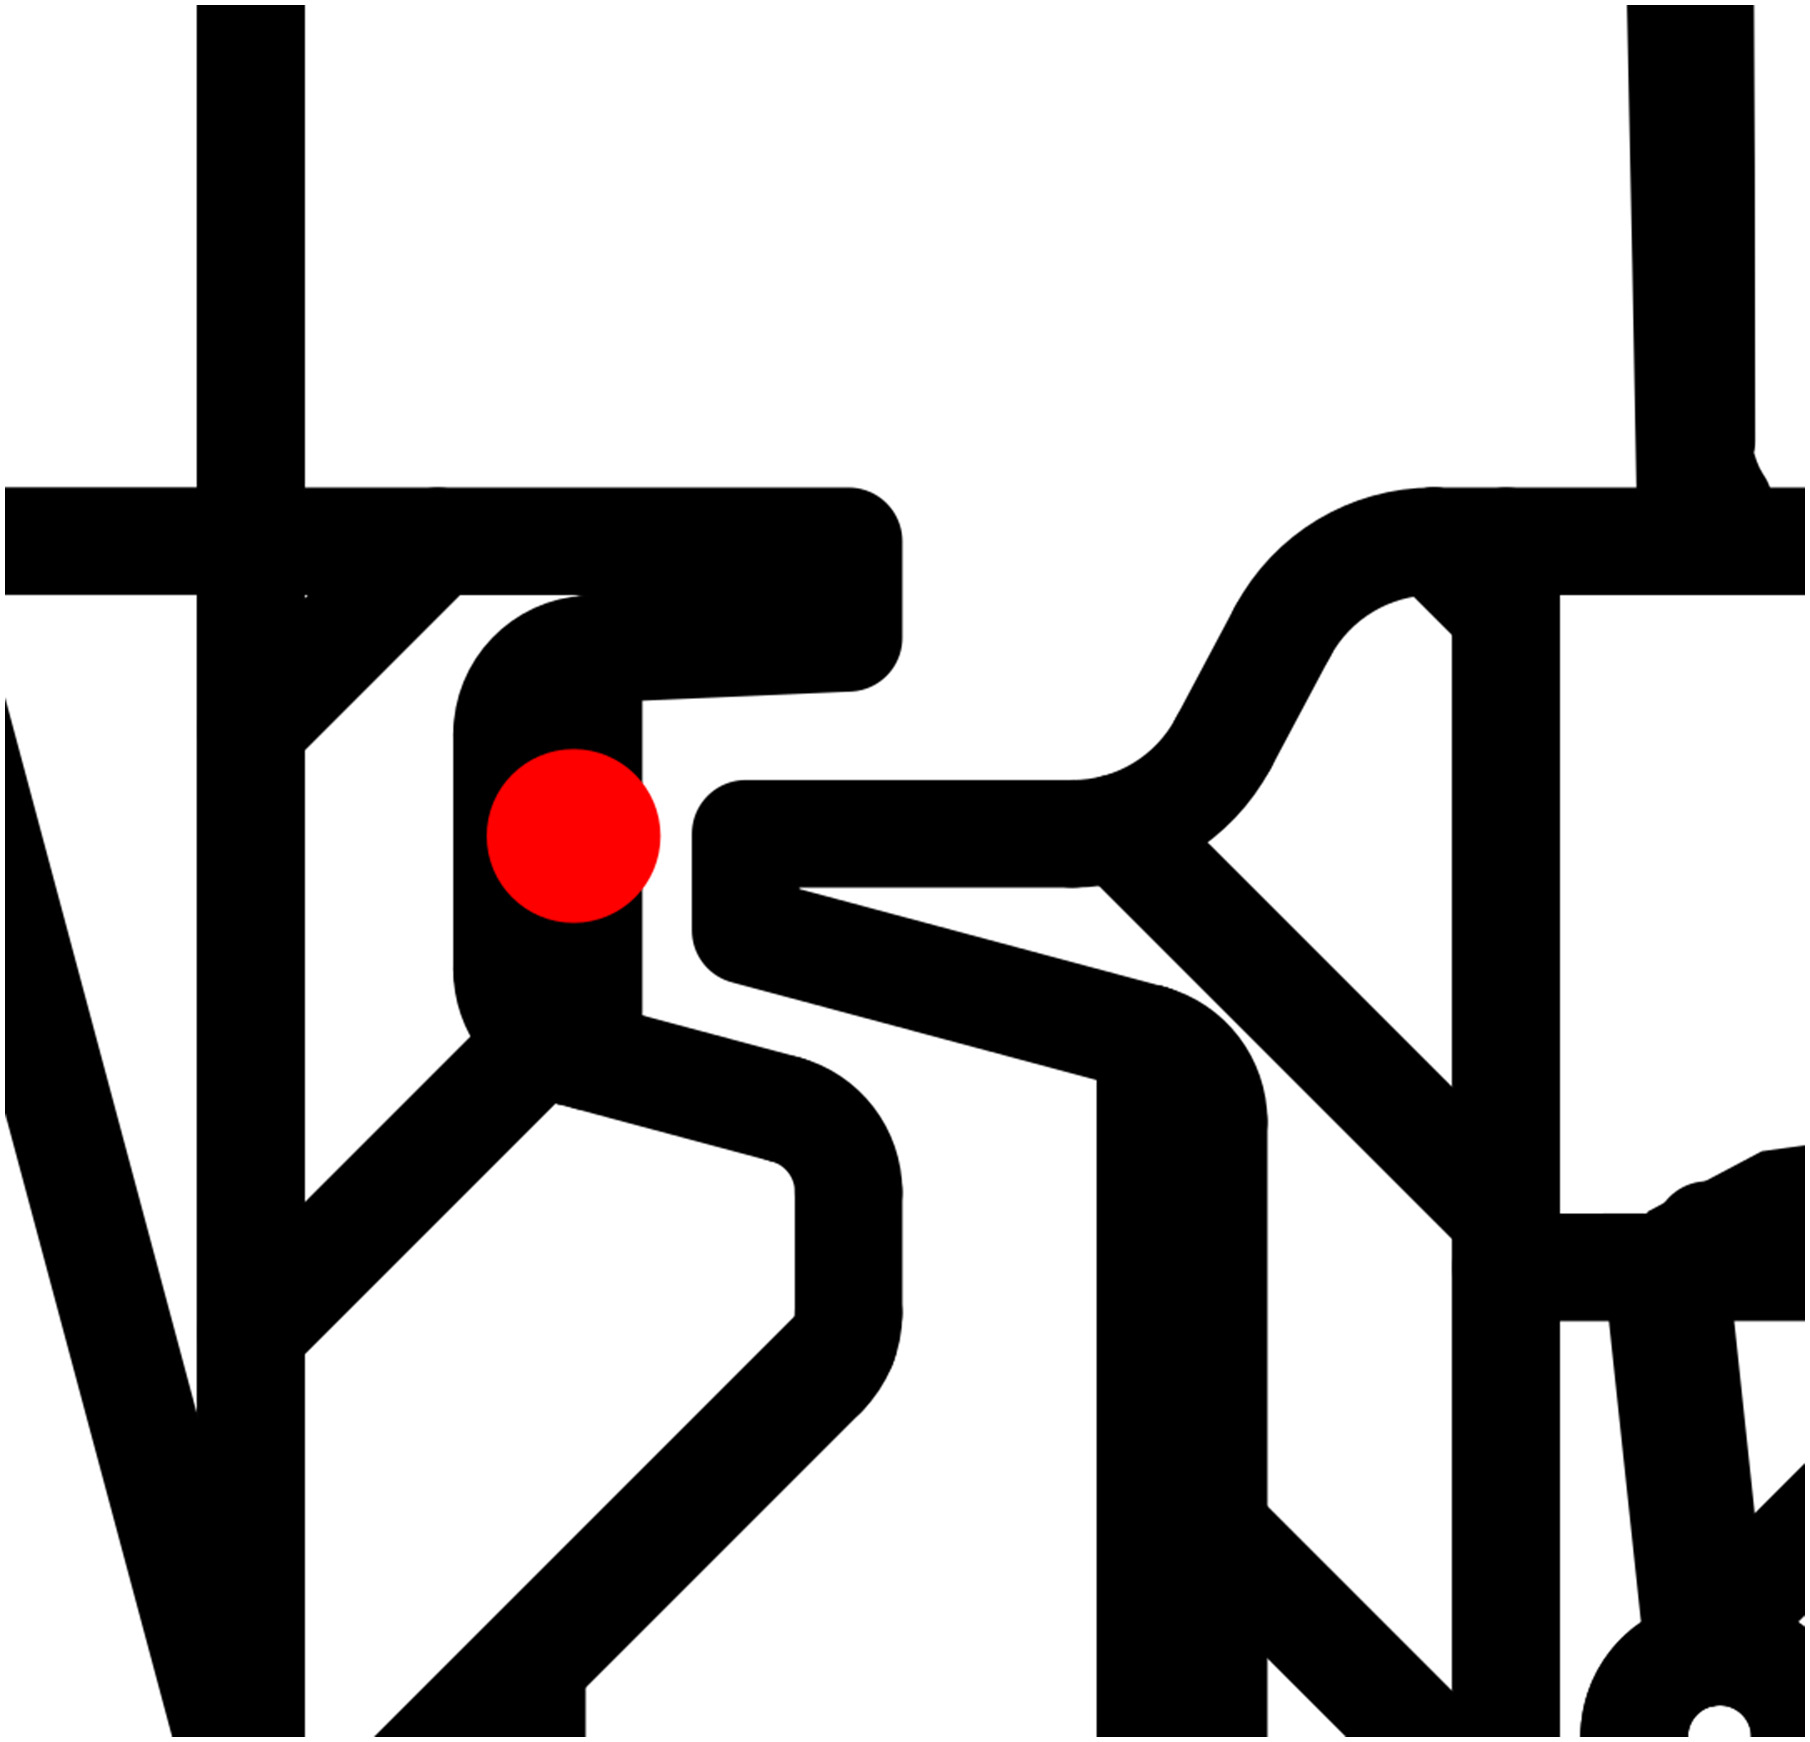
In order to assess the performance of the F3D configuration under the influence of purge flow, the 1.5-stage axial cold air turbine test rig at the IST was equipped with a secondary air system (SAS) capable of injecting a mass flow of 128 g/s (equal to 1.6% of the main mass flow) through the cavity directly upstream of the rotor. A detailed description of this SAS is given in Schäflein et al. (2022). Figure 1 shows the flow path (green arrow) of the purge flow. A state-of-the-art low-pressure turbine blading design with cylindrical end walls and twisted rotor blades was used as a baseline configuration. The rig is operated at a rotor speed of 3,500 rpm, an inlet total pressure of approx. 1.63 bar and a total pressure ratio of approx. 1.29. Under these conditions, which are representative of the aerodynamic design point (ADP), a torque of approx. 450 Nm is generated. Further characteristic data on the test rig is listed in Table 1. At the ADP, Reynolds numbers based on exit conditions of the individual rows reached values ranging from 330,000–810,000. This is, according to Halstead et al. (1997), representative of a low-pressure turbine during take-off. Further characteristic data on the blading can be found in Table 2. Data on the efficiency as well as local flow states were acquired in multiple measurement planes (MP), shown in Figure 1. Rakes with multiple Kielhead and three-hole probe at the turbine inlet (MP0) and outlet (MP4) were used to determine inflow and outflow data necessary for the calculation of the efficiency. Detailed, two-dimensional flow measurements were conducted downstream of the stator (MP1) and rotor (MP2) by traversing the flow radially and circumferentially with a five-hole probe and a 3D-hot-wire probe. For a more detailed description of the turbine instrumentation, the reader is referred to Schäflein et al. (2022). Additional measurement data of the unsteady pressure fluctuations inside the cavity were acquired by the use of an unsteady pressure transducer. With its sampling frequency of 500 kHz, it is suitable for measuring high-frequency pressure fluctuations inside the cavity. Its position in the rig is indicated by the red dot in Figure 2. For the efficiency measurements, three operating points (aerodynamic design point and two off-design points) were chosen while the detailed flow measurements were conducted only at the aerodynamic design point.
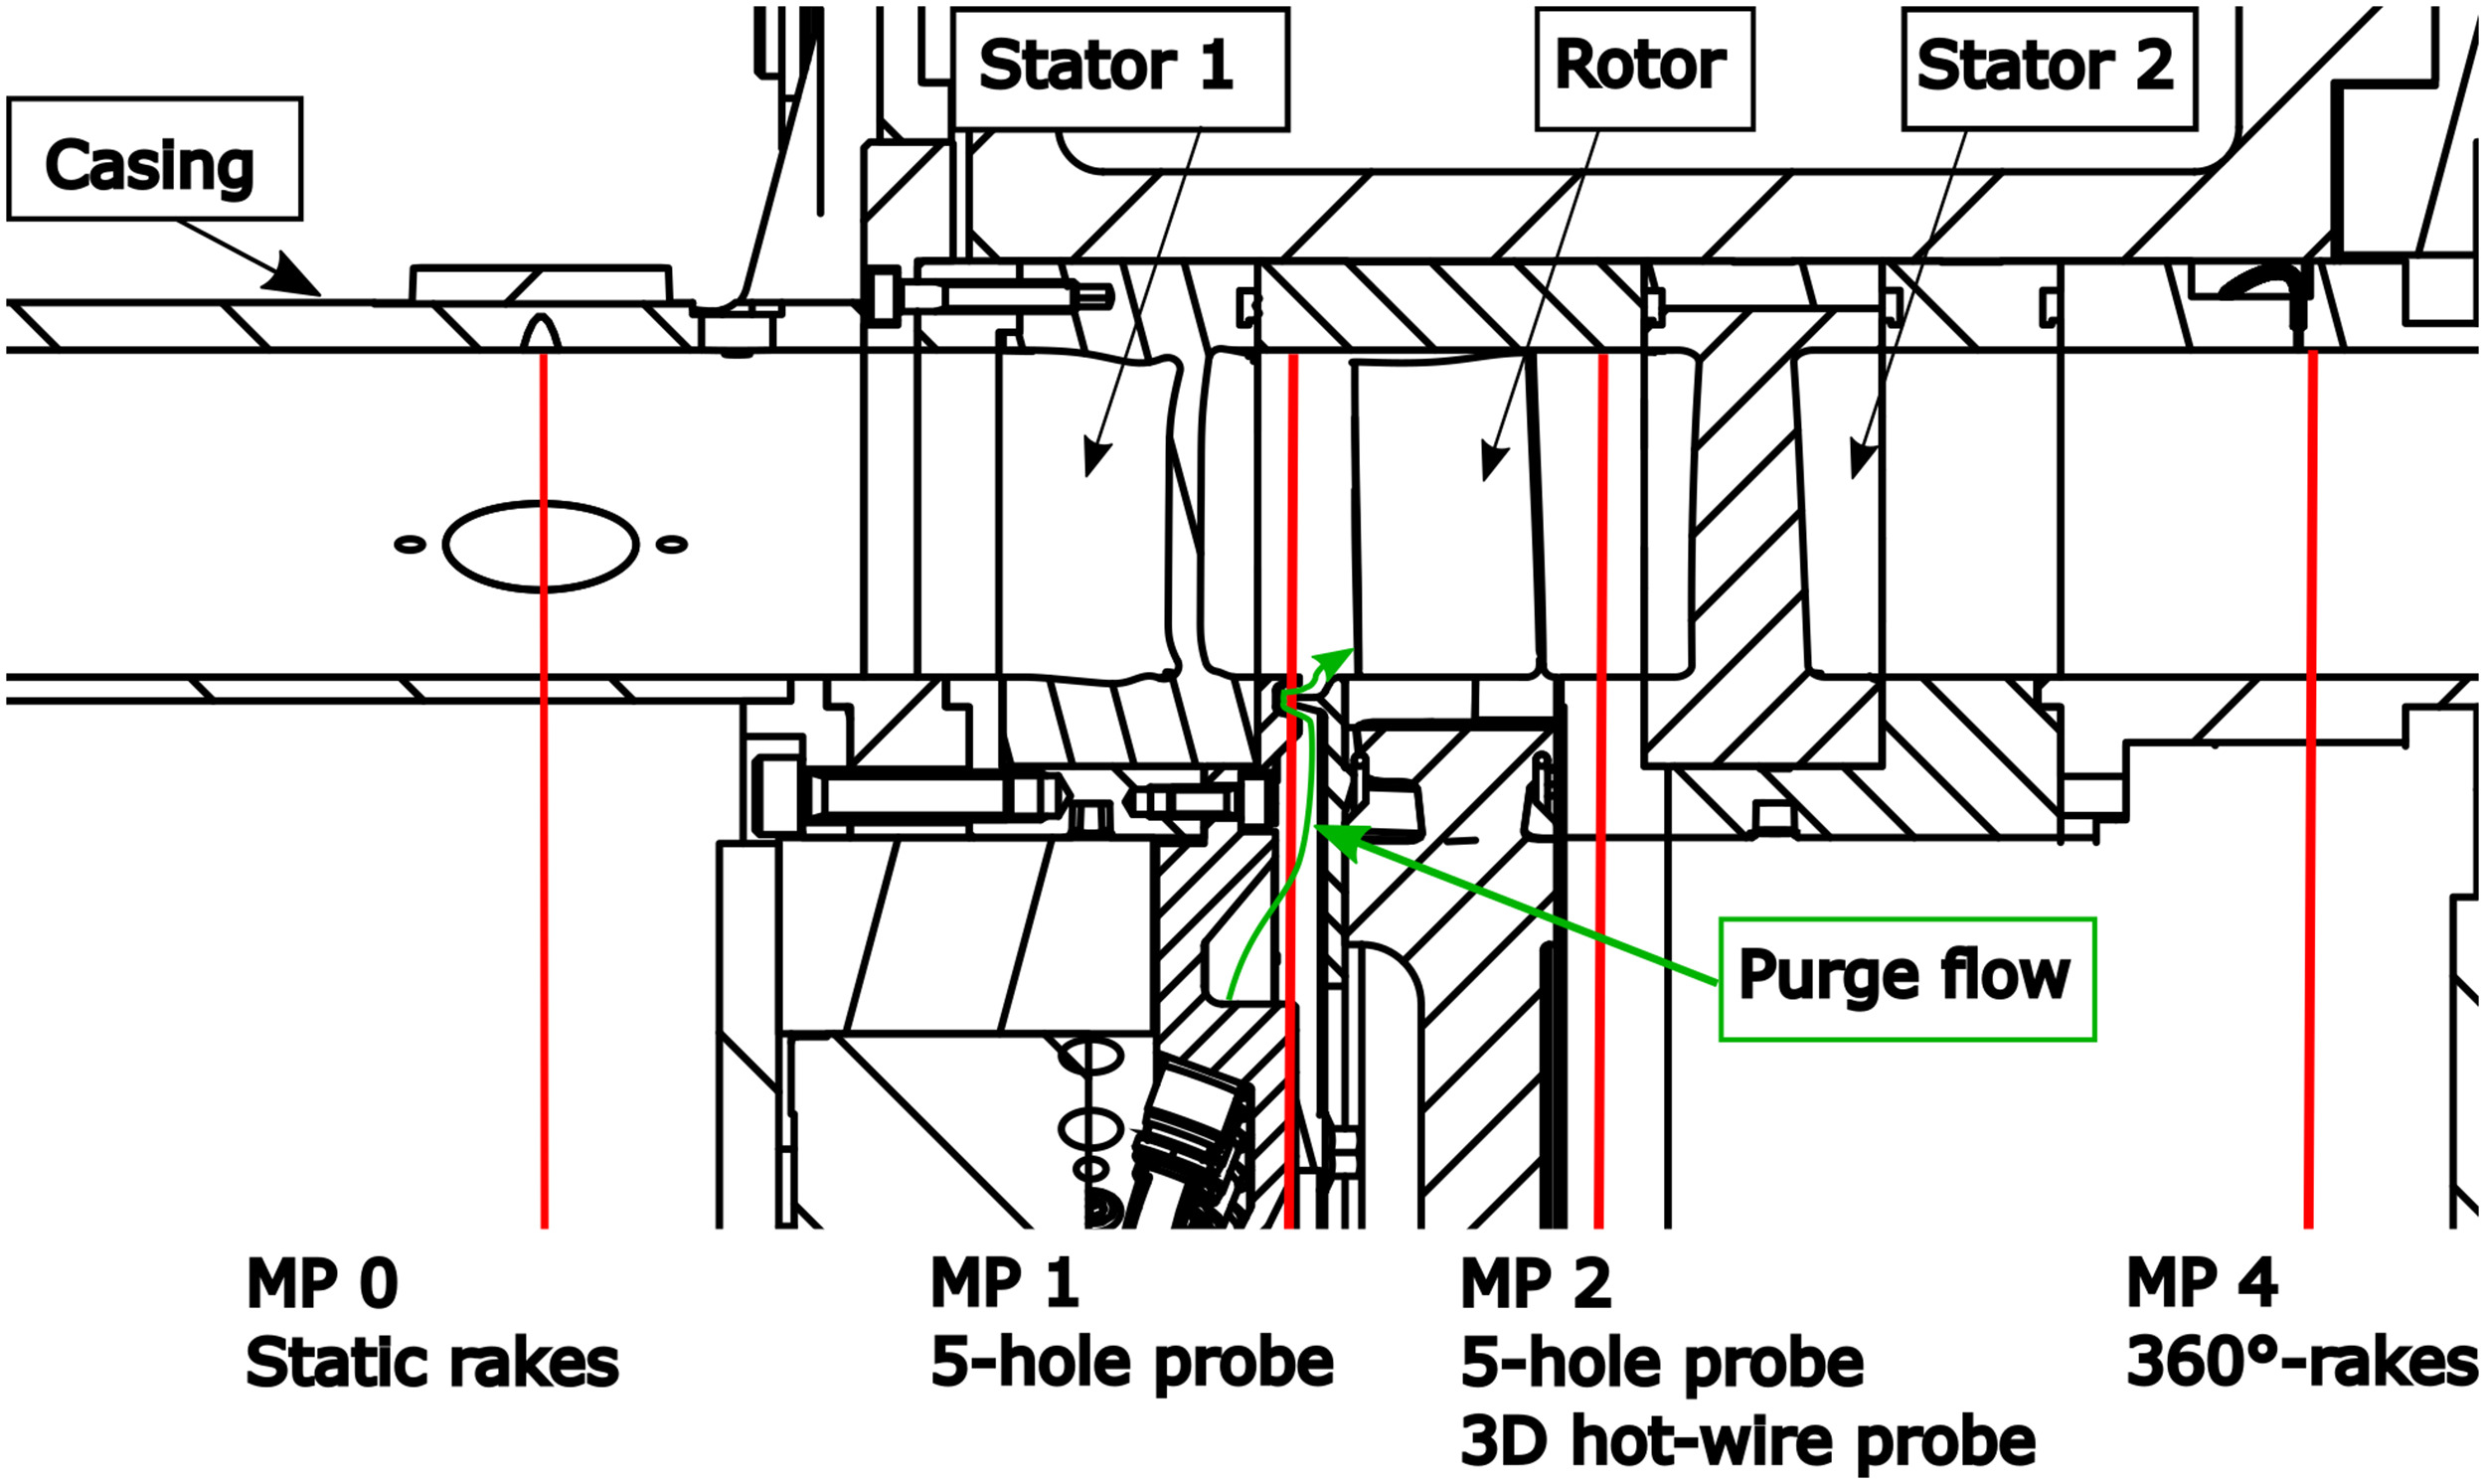
Table 1.
Characteristic turbine rig data at ADP.
Numerical setup
In order to support the experimental investigation and to gain information about the flow physics in places not accessible via probes, numerical simulations were conducted. To do this, the finite volume solver TRACE, which is developed by the German Aerospace Center (DLR) in cooperation with MTU Aero Engines, was used. As the interaction between the purge flow and the main flow is expected to be highly unsteady, transient simulations were carried out. The blade count of the axial test rig is especially suitable for transient simulations due to the favourable ratio of the blade numbers in the first (33 blades), second (44 blades) and third row (66 row). This ratio allows the simulation of 1/11 of each blade row with periodic boundary conditions. To enable the transfer of local unsteady flow phenomena between the stationary and rotating flow domains, these flow domains were connected via zonal interfaces (see Figure 3, all stationary parts in green, all rotating parts in red). To avoid influencing the purge flow with the zonal interface, the interface between the first and second row was placed directly upstream of the cavity. The mesh, also shown in Figure 3, consists of 26.3 mio. and 28.6 mio. cells for the baseline and F3D configuration, respectively. On all end walls and blades, the boundary layer was fully resolved with a

Results and discussion
Numerical validation
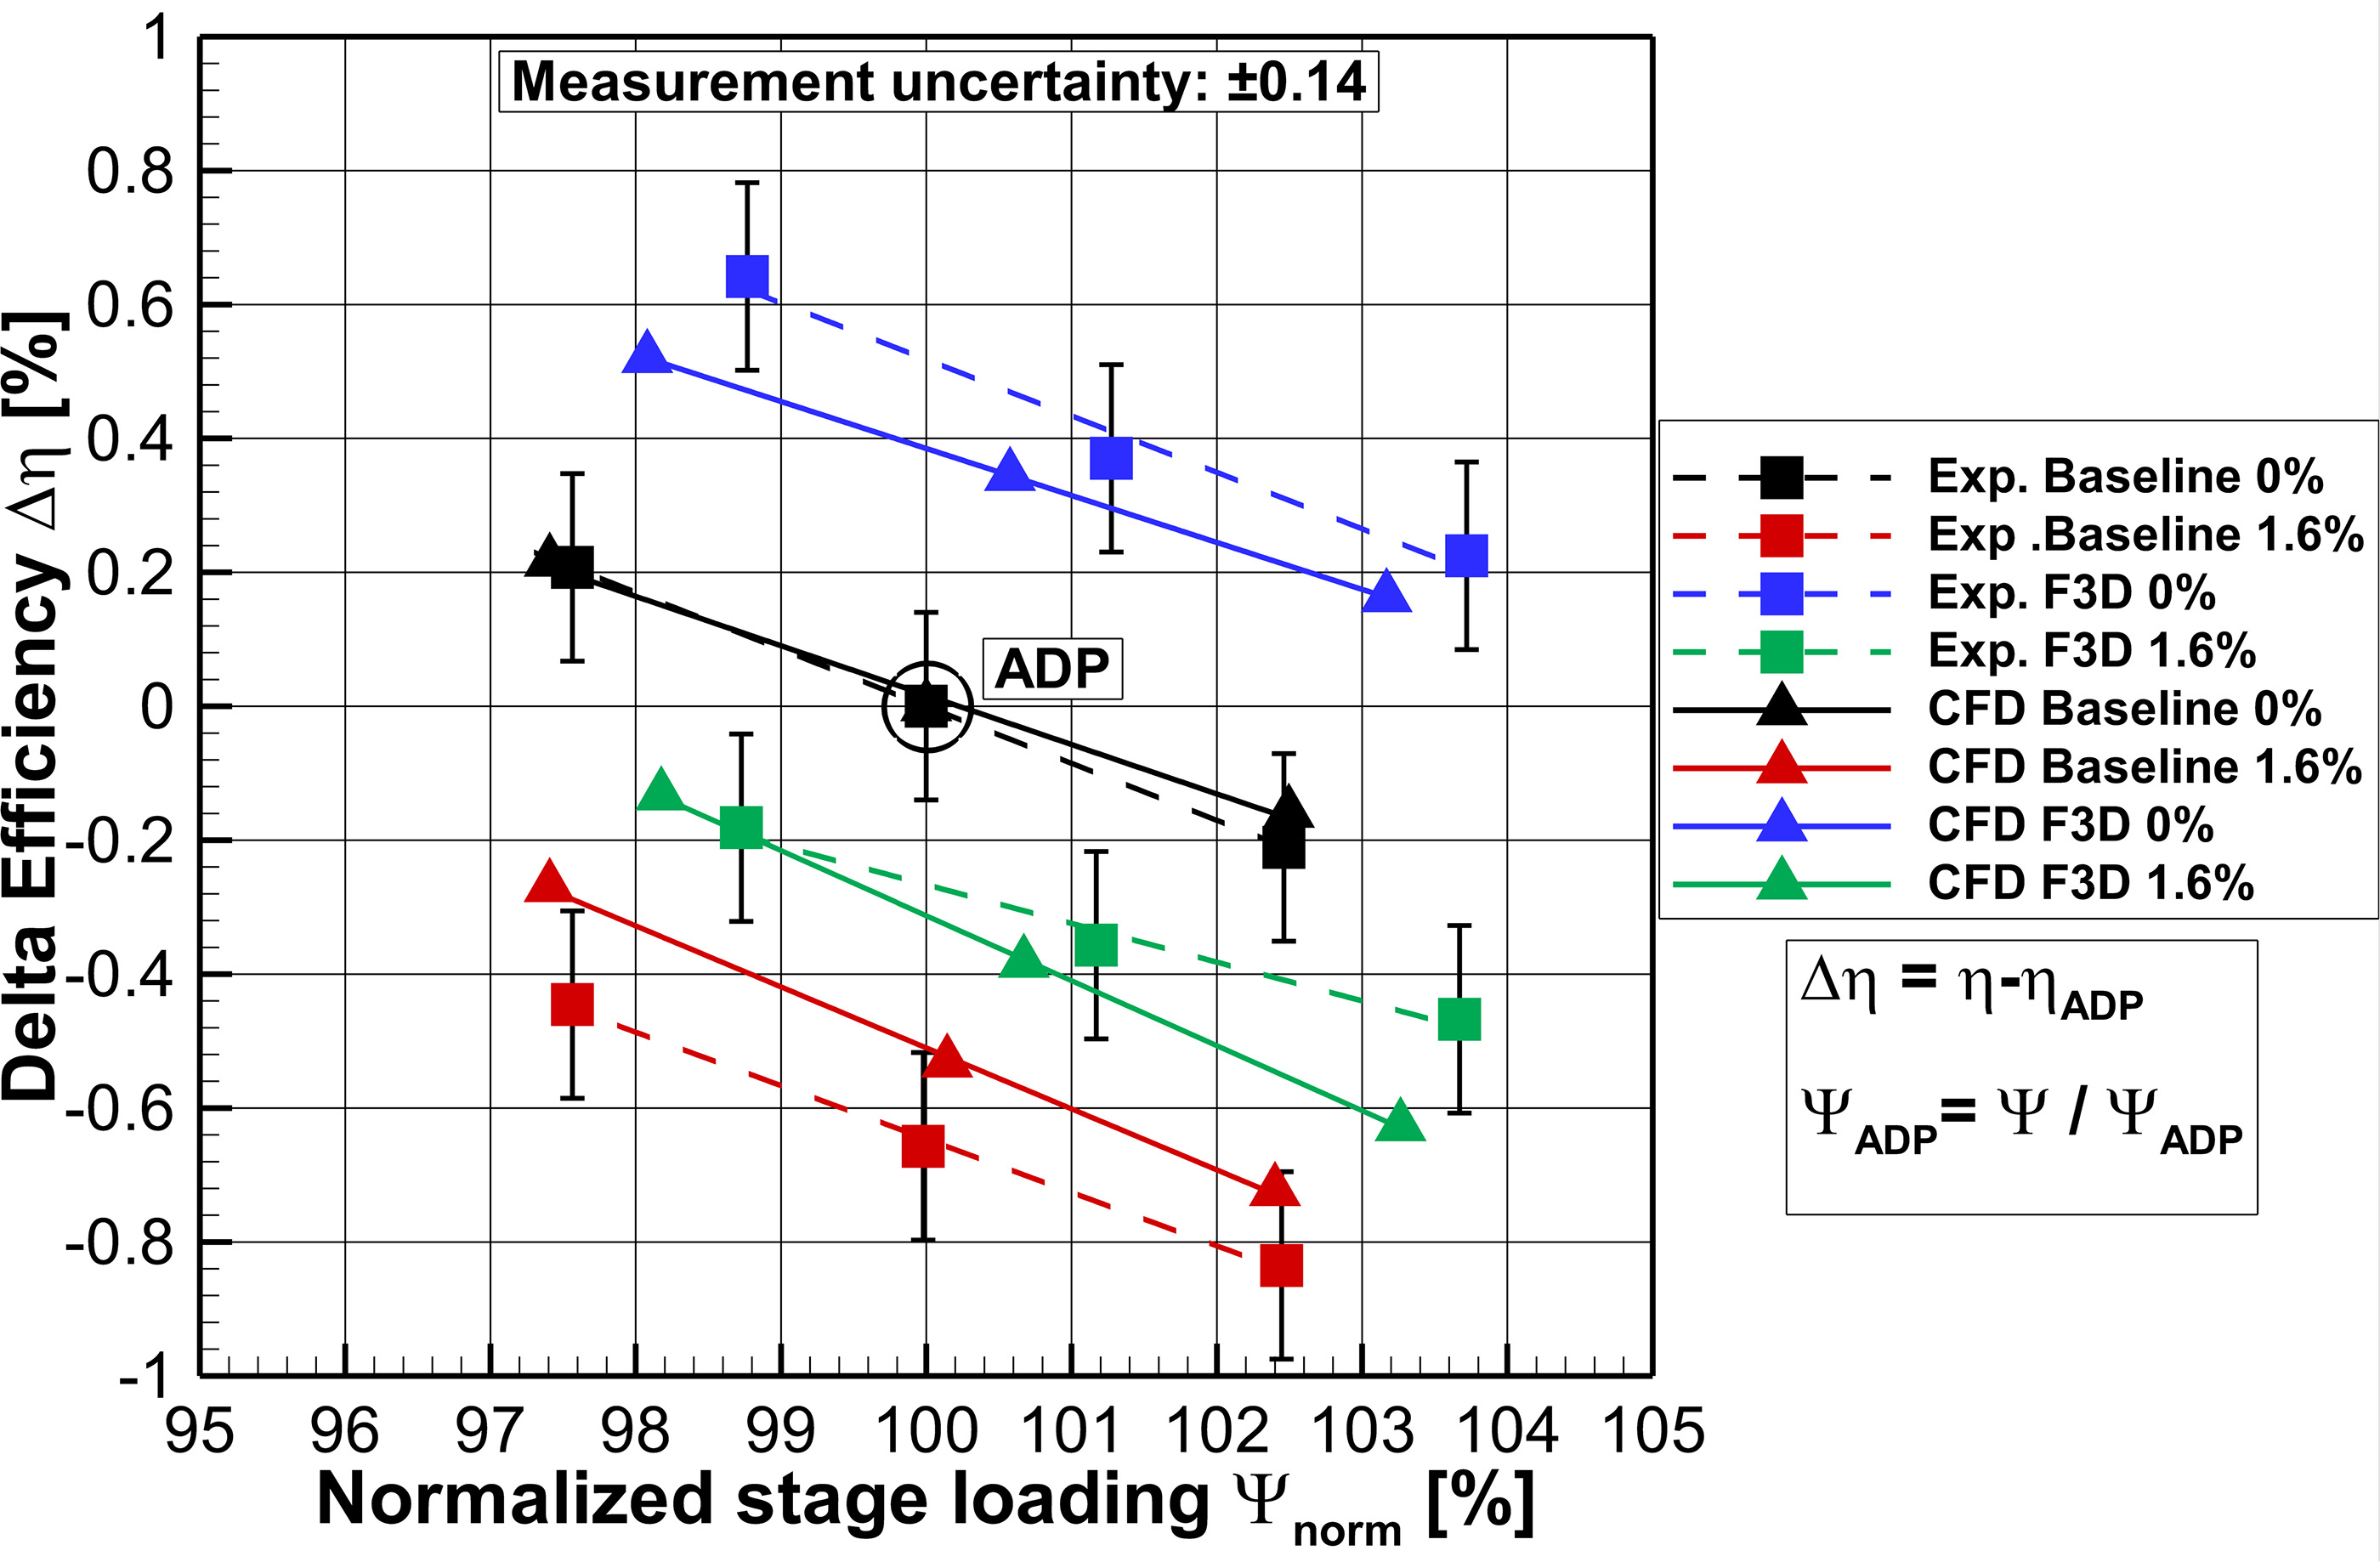
Figure 4 shows the experimentally and numerically determined turbine map for both configurations, with and without purge flow injection respectively. The results were normalized with respect to the ADP of the baseline configuration without purge flow injection. When purge flow is injected into the baseline configuration, efficiency decreases by −0.65% (CFD: −0.51%). The use of the F3D configuration results in an efficiency gain of +0.52% (CFD: +0.38%) compared to the baseline configuration. Purge flow injection into the F3D configuration, however, actually results in a larger decrease in efficiency, namely −0.78% (CFD: −0.69%). This larger sensitivity of EWC configurations to purge flow injection had already been described by Schüpbach et al. (2011). Compared to the baseline configuration with purge flow injection, however, not all efficiency gain is lost (Exp.: +0.38% / CFD: +0.2%). Overall, the numerical simulations are able to replicate the trends of the experimental data well, although they misestimate the absolute values, especially when purge air is injected.
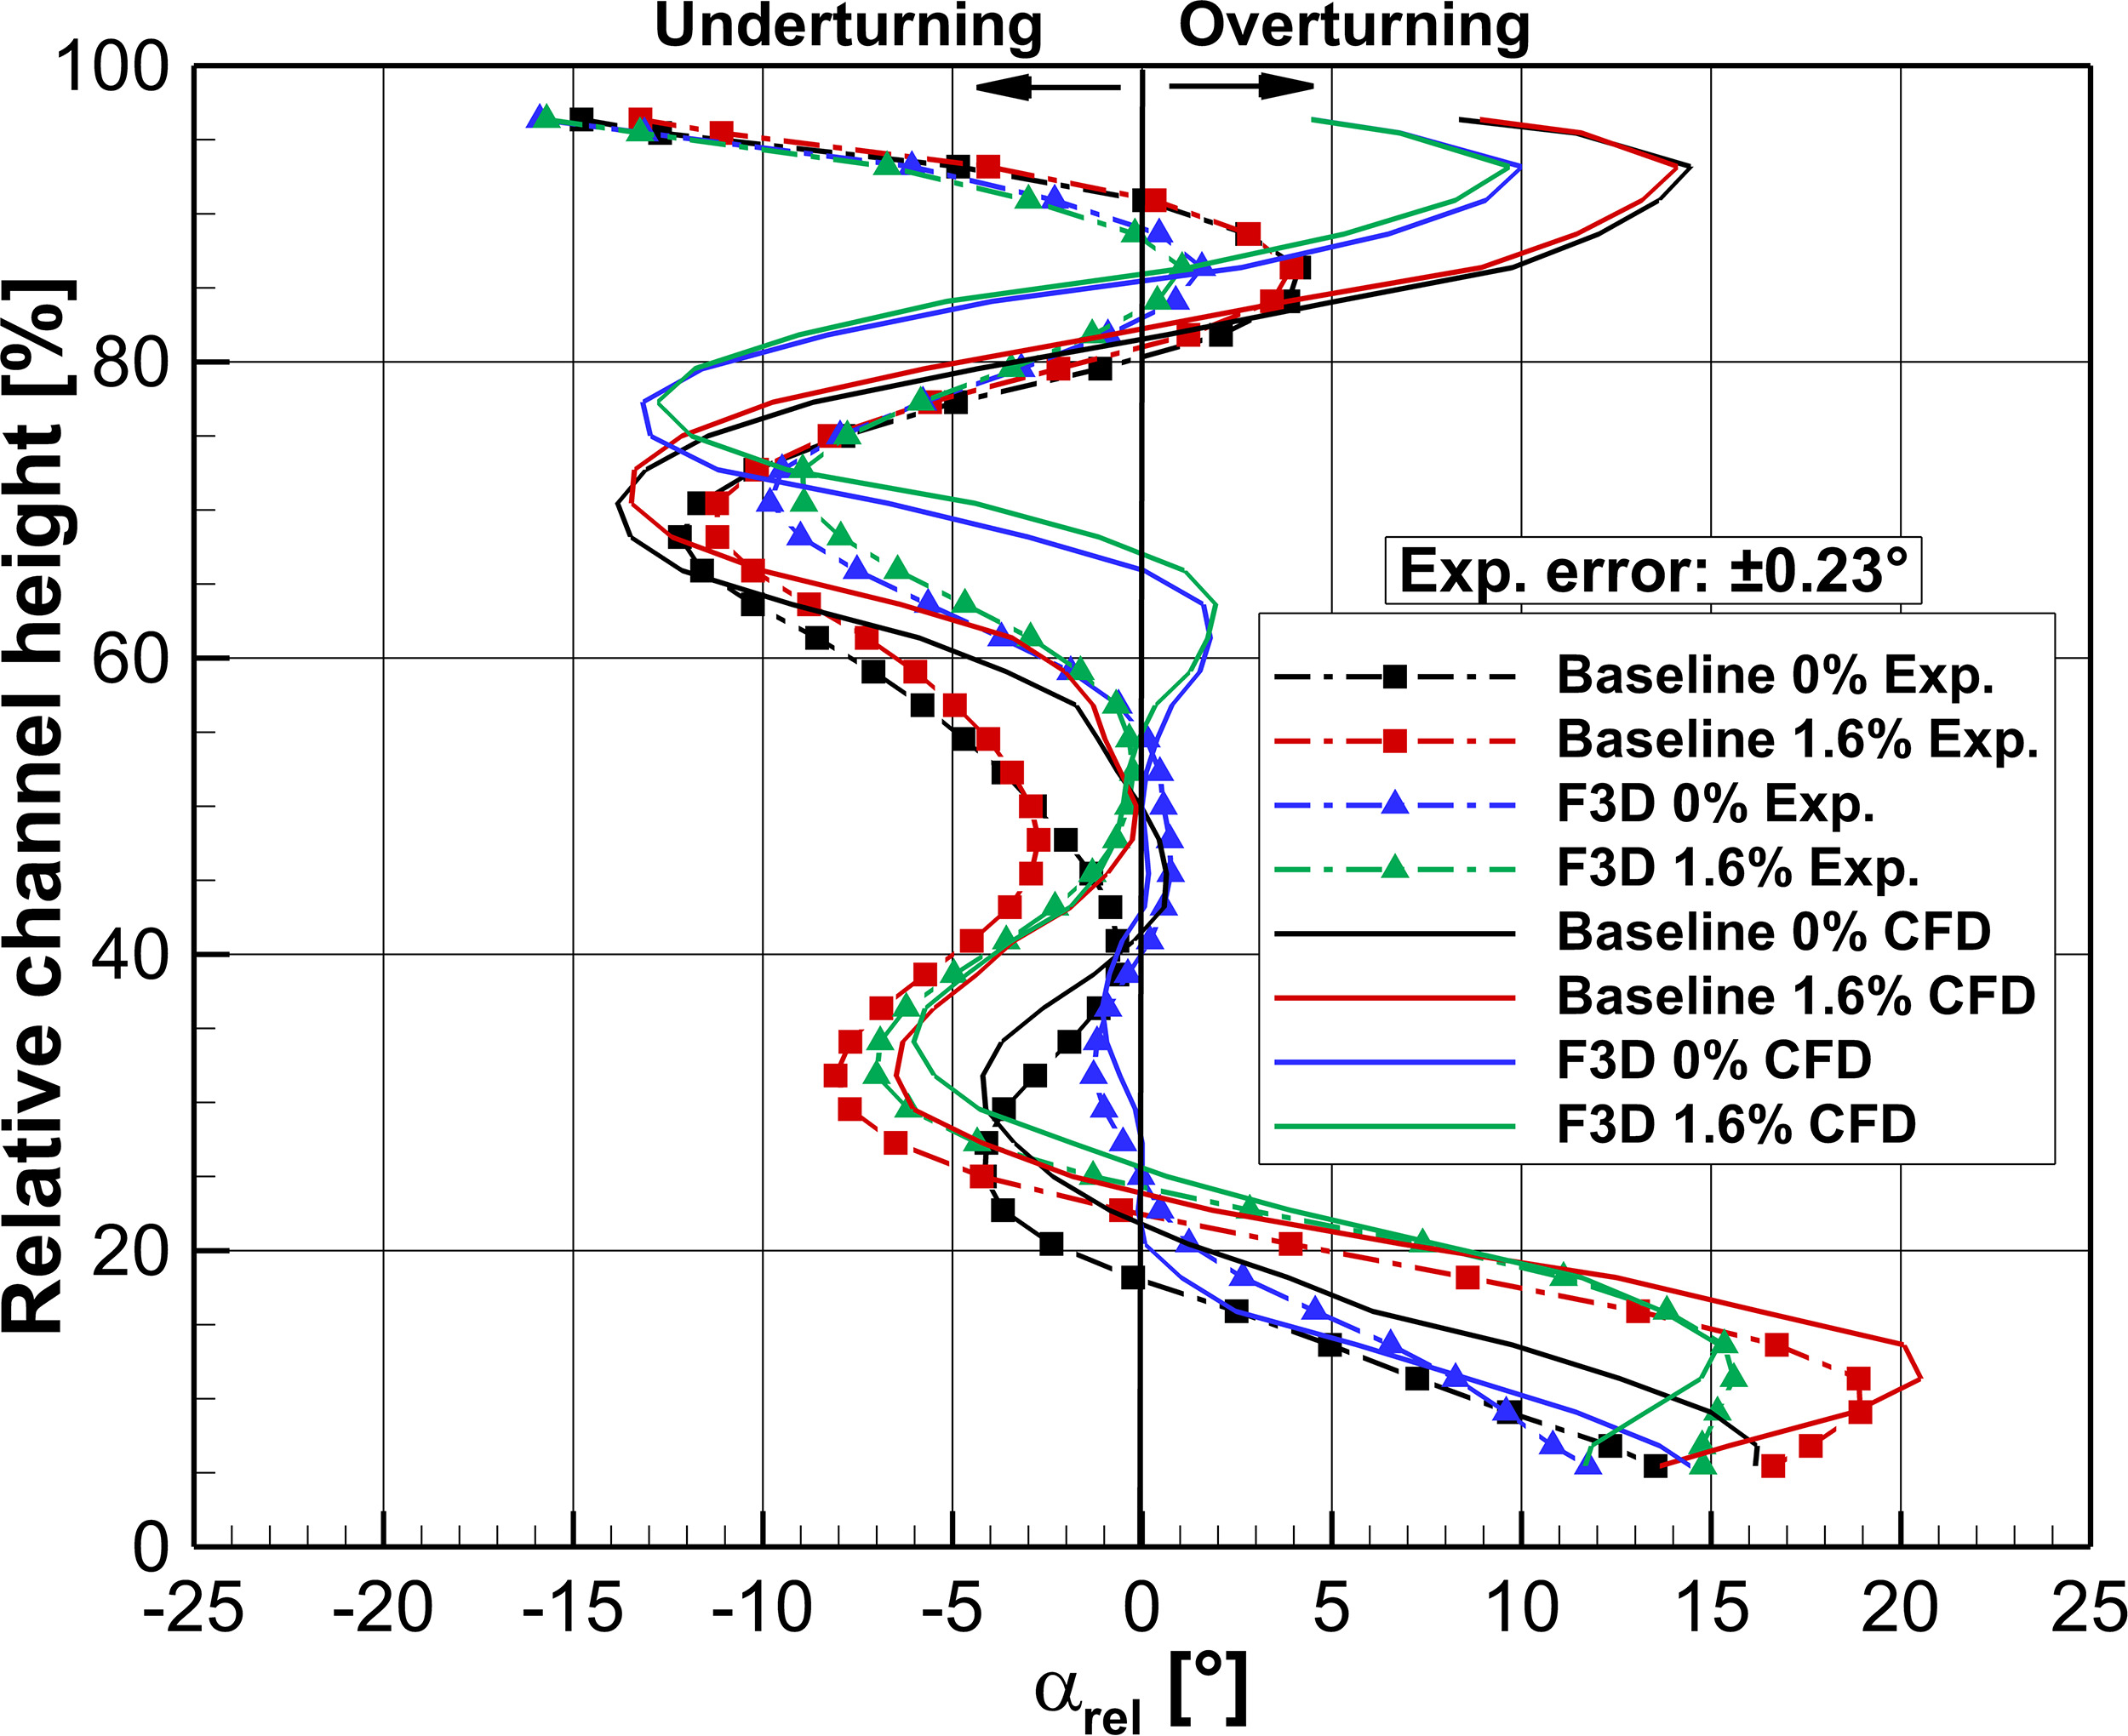
In a previous paper on this project (Schäflein et al., 2022), it had already been demonstrated that the purge flow has virtually no effect on the flow inside the stator passages. It was also shown that the numerical simulations are able to reproduce the local flow measurements downstream of the rotor (MP2) with good accuracy. An example of this reproducibility is given in Figure 5 with the radial distribution of the absolute yaw angle (normalized with regard to the design angle) in MP2. The numerical simulation is able to reproduce all relevant trends of the experiment. Only above 80% channel height, larger deviations are visible due to the complex flow caused by the tip gap vortex. The plot already gives a first indication of the interaction between the purge flow and the F3D configuration. Above 50% channel height, the under- and overturning of the rotor outflow is significantly reduced. Since the rotor has no shroud and the casing is cylindrical, this improvement must result from a homogenization of the stator outflow, resulting in an improved radial incidence distribution at the rotor inlet. Such a homogenization was in fact reported in previous measurements of this F3D configuration by Niewoehner et al. (2015). Above 50% channel height, the purge flow has no effect on the flow, leading to basically congruent curves in both configurations. With the injection of purge flow, however, large changes in the outflow angle are visible below 50% channel height. It is there that the previously congruent curves separate. The separation point is different for the two configurations: in the baseline configuration, the separation occurs at 50% channel height, while in the F3D configuration it occurs at 58% channel height. The numerical simulations are able to replicate this separation point almost exactly. Below the separation point, the yaw angle distribution of the F3D configuration (orange line) closely resembles that of the baseline configuration (red line). Considering the highly complex flow interactions in this area, the CFD replicates the absolute values, as well as the intersection point of both curves, extremely well at 17%. With this in mind, the numerical simulations can be regarded as validated and can be used to assess flow quantities which are not accessible with the turbine instrumentation.
Figure 5.
Circumferentially massflow-averaged absolute yaw angle downstream of the rotor (MP2), data from Schäflein et al. (2022).
Since Poehler et al. (2015) and Niewoehner et al. (2015) demonstrated that the F3D configuration achieves its efficiency gain through the reduction of secondary flows near the hub and the casing by homogenizing the stator outflow, it is reasonable to verify whether this reduction continues to occur under the influence of purge flow injection. For this, the turbulent kinetic energy (see Equation 1) in MP2 is acquired via a three-dimensional hot-wire probe and analysed. Regions of high turbulent kinetic energy are associated with highly unsteady flow, which generates entropy and therefore additional losses through viscous dissipation. The signal measured by the hot-wire probe is processed using a phase-lock ensemble average. Through this procedure, the constant velocity
In Figure 6, the turbulent kinetic energy distribution for all four cases is displayed. Since the data is shown in an absolute frame of reference, vortices moving sideways with the rotor appear as bands in the data. To make quantitative comparisons easier, the radial distribution which was generated by averaging the turbulent kinetic energy in the circumferential direction is also shown. Comparing both baseline cases, the increase of turbulent kinetic energy in the lower half of the channel is immediately noticeable. The purge flow injection shifts the band of high turbulent kinetic energy, which - according to Poehler et al. (2015) - is associated with the horseshoe vortex and the passage vortex, towards midspan and increases its turbulent intensity. This, together with the reduced free-stream area, leads to higher flow losses and the reduction in efficiency seen in the performance map. The area dominated by the passage-vortex and tip gap vortex (60%–95%) is virtually identical and therefore not affected by the purge flow. This is consistent with the flow angle data previously discussed. Comparing the F3D configuration without purge flow injection to the corresponding baseline case, three changes are noticeable. First, the turbulent kinetic energy near the casing (55% span – 90% span) is reduced. Second, another reduction of turbulent kinetic energy can be seen near the hub from 5% - 20% span. From these two changes, the third difference, namely an increase in the undisturbed free-stream area in the middle of the channel, arises. When purge flow is now injected into the rig equipped with the F3D configuration, the previously reduced turbulent kinetic energy near the hub increases above the level of the baseline configuration with purge flow, hinting at secondary flow structures which are amplified by the purge flow. This gives an indication for the reason for the greater sensitivity of the F3D configuration to purge flow.

CFD simulations were used to check whether these differences in turbulent kinetic energy actually lead to increases in entropy. For this, equidistant cut planes were placed inside the passage. Since no effect of the purge flow was seen on the flow above midspan, the following figures focus on the flow near the hub. The entropy generation was calculated according to a method published by Herwig and Kock (2005). This method considers entropy production due to viscous effects and temperature gradients, as well as production due to turbulent velocity and temperature fluctuations. The latter two parts are calculated from the dissipation rate provided by the turbulence model. Since the resulting entropy production term is typically a large number, it is normalized in Equation 3 according to a suggestion by Denton and Pullan (2012). In this equation, the density
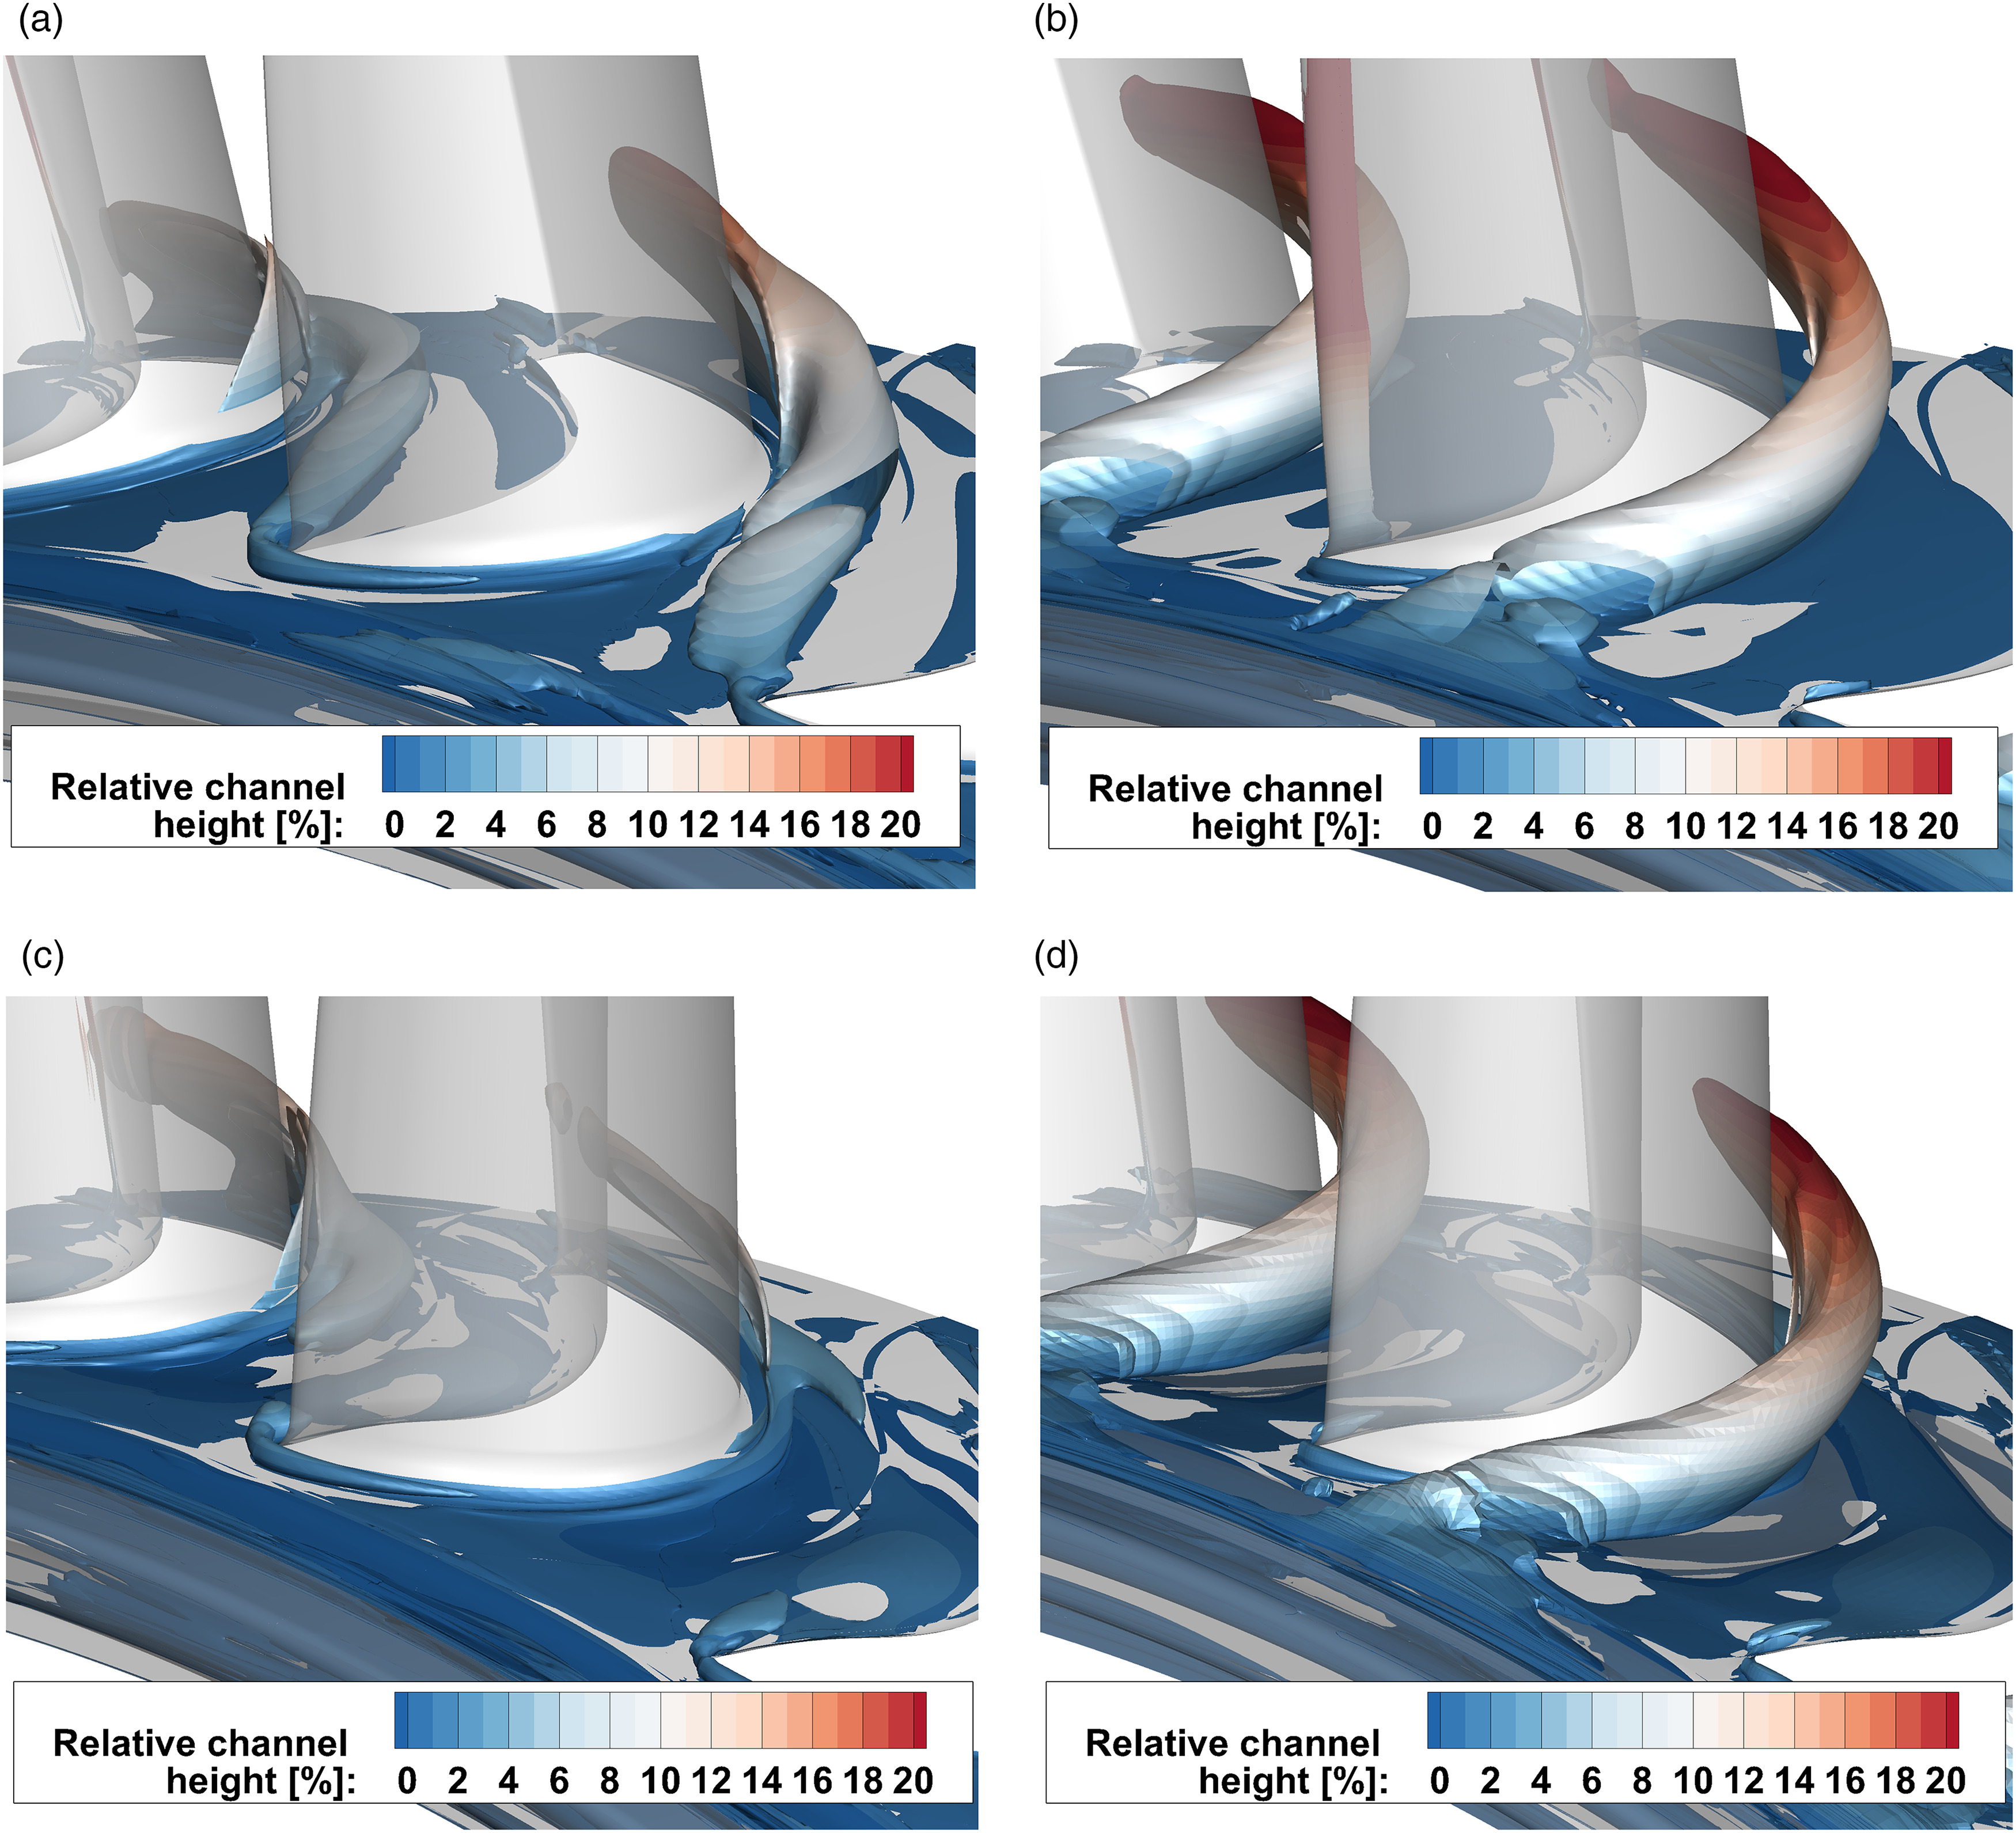
Figure 7 shows the normalized entropy production inside the rotor passage for the baseline and F3D configurations. When the two baseline cases are compared with each other, a different trajectory of the entropy maximum in the cut planes can be seen. Before, the entropy core follows the trajectory from the leading edge to the suction side of the adjacent blade. After, with purge flow injection, the entropy core begins at the exit of the cavity and then follows the suction side closely while also migrating radially outwards. An intensification of the entropy production is also visible. In contrast, the F3D configuration strongly reduces the entropy production when no purge flow is injected. Only a small entropy core can be seen along the suction side of the blade. When purge flow is injected into the F3D configuration, the distribution of the entropy production term looks strikingly similar to that of the baseline configuration, although overall higher values can be observed. All these entropy production cut planes are consistent with the turbulent kinetic energy presented in Figure 4 and demonstrate that the intended effect of the F3D configuration, namely the reduction of secondary flows, is no longer effective near the hub when purge air is injected. By visualizing these secondary flow structures with isosurfaces of the
Figure 7.
Normalized entropy production term inside the rotor passage. Cut-off value: 0.001. (a) Baseline, 0% purge flow. (b) Baseline, 1.6% purge flow. (c) F3D, 0% purge flow. (d) F3D, 1.6% purge flow.
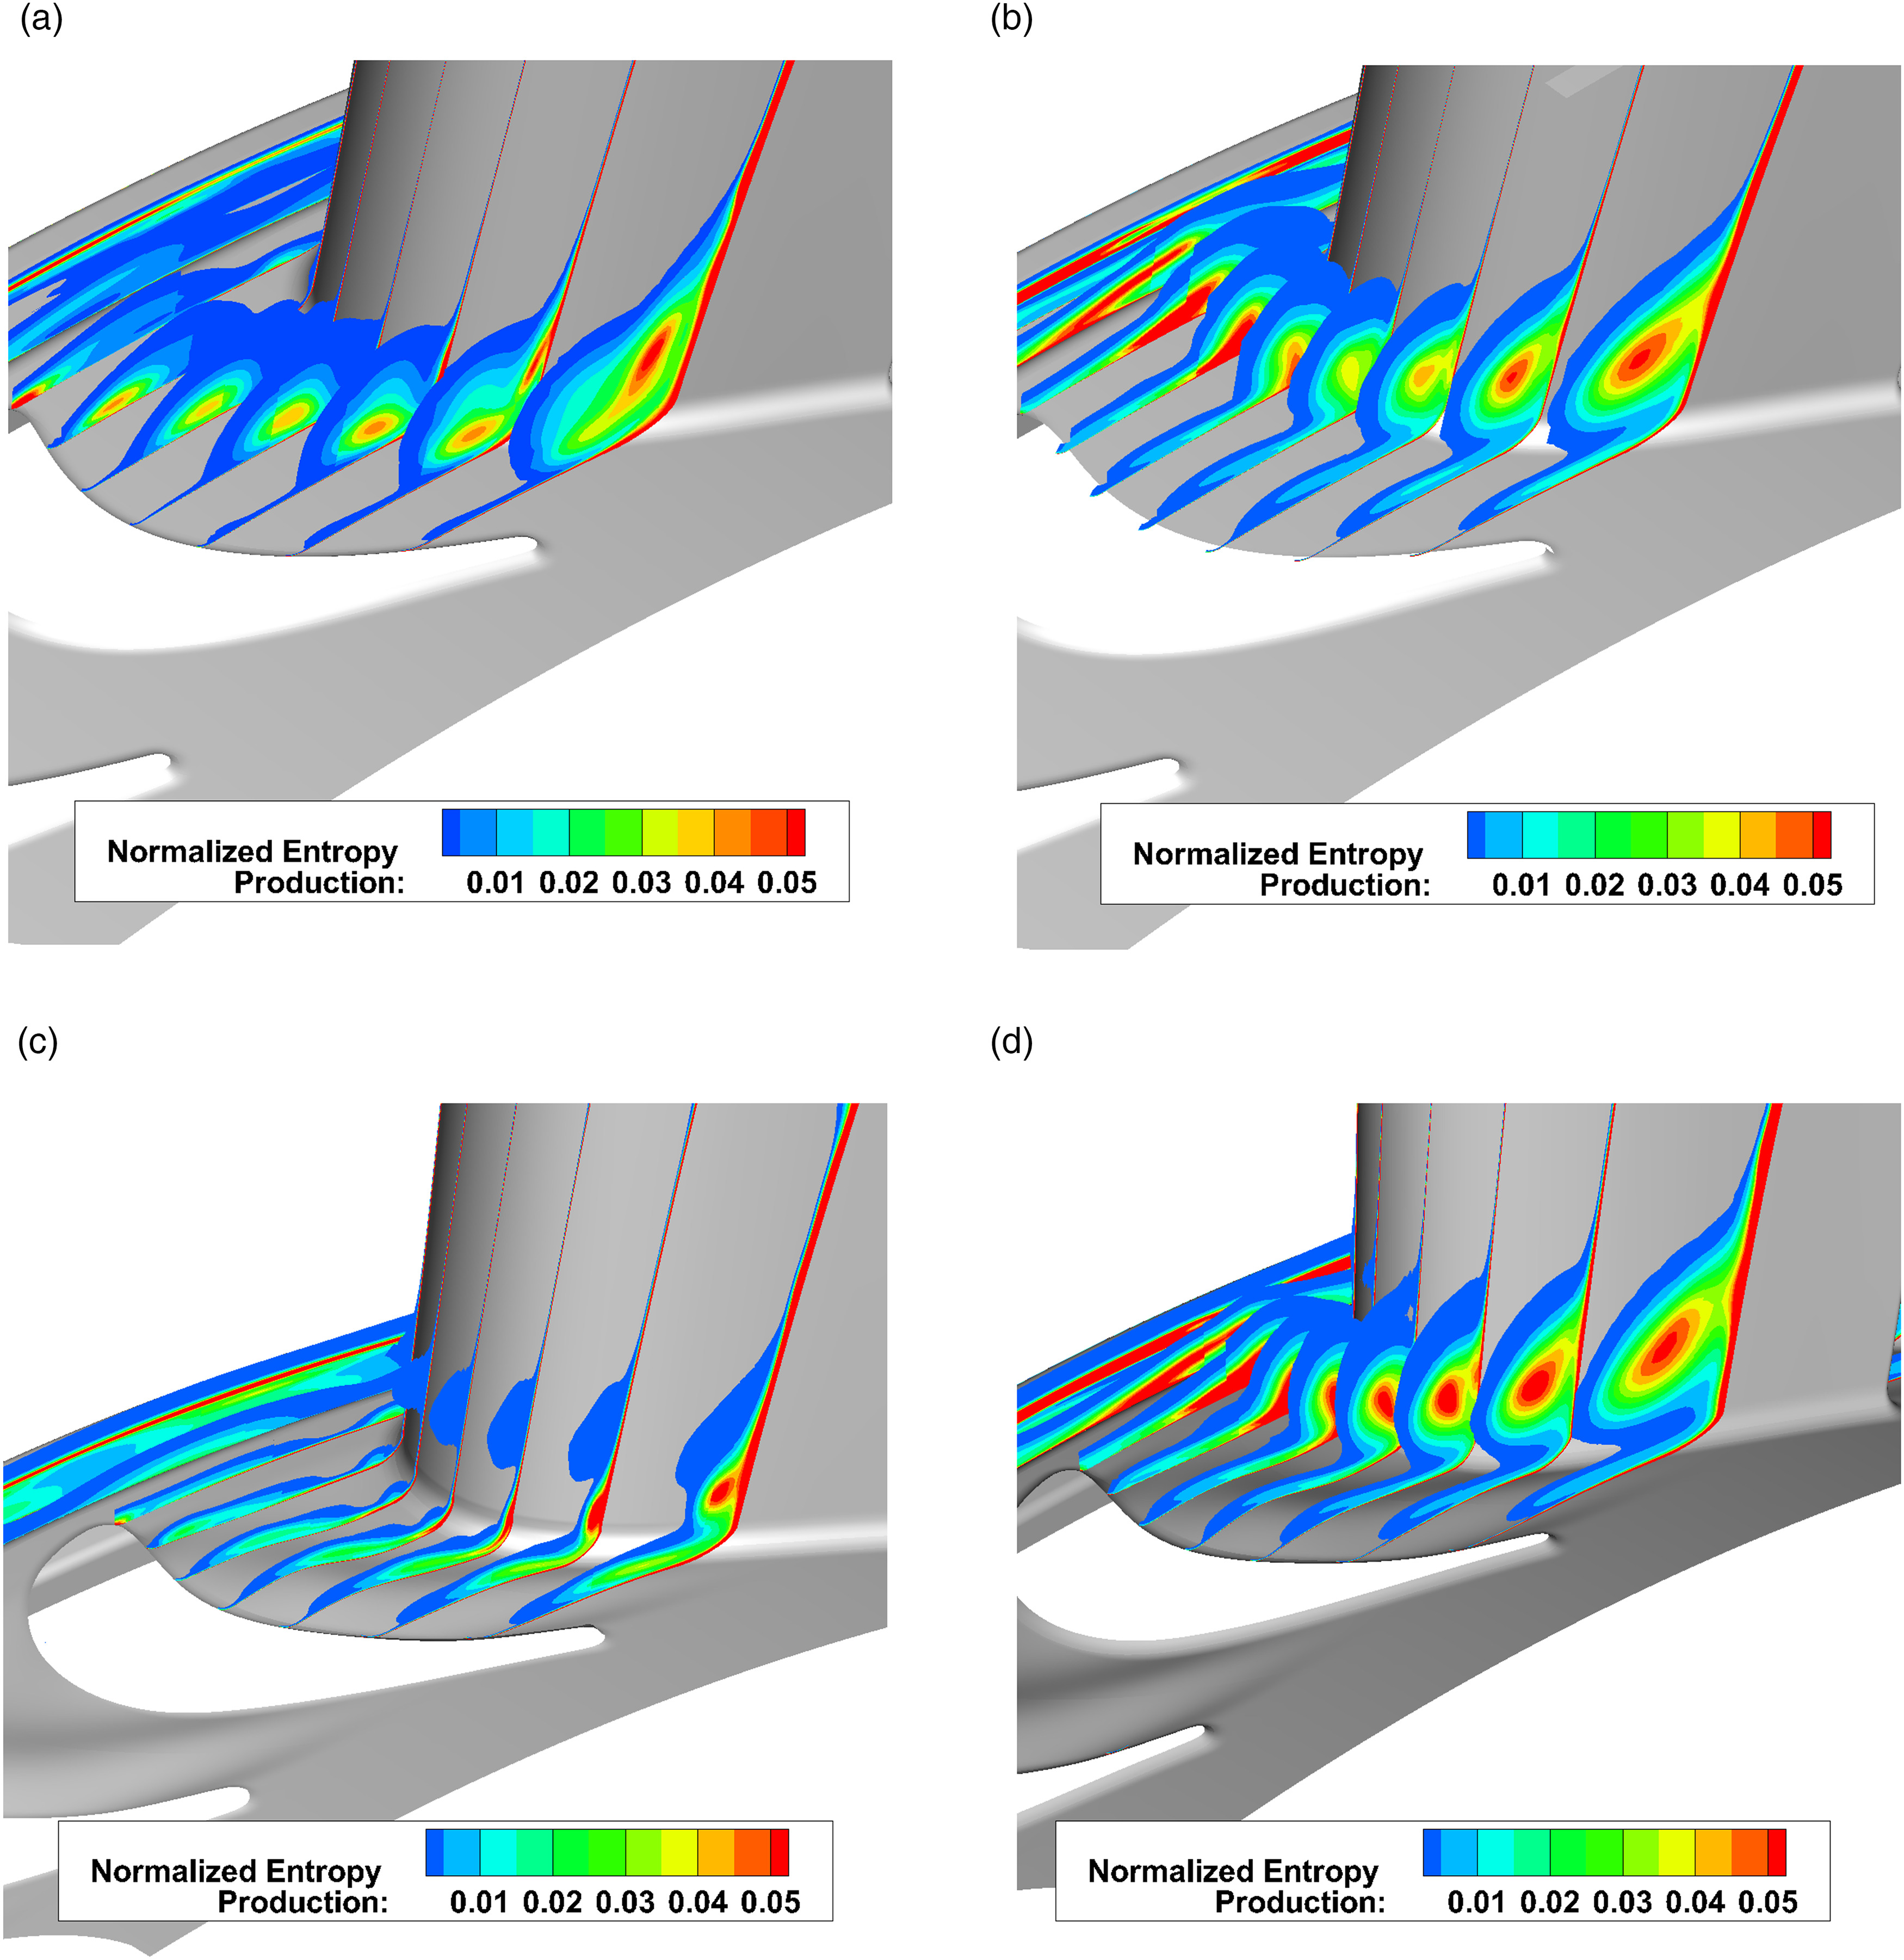
Figure 8.
Vortex structures inside the rotor passages (isosurfaces of λ2-criterion). (a) Baseline, 0% purge flow. (b) Baseline, 1.6% purge flow. (c) F3D, 0% purge flow. (d) F3D, 1.6% purge flow.
An analysis of the pressure distribution at the outlet of the cavity reveals the cause for the jet-like injection of the purge flow into the main flow. In Figure 9, this analysis is shown only for the baseline configuration, as the result for the F3D configuration was virtually identical. Without purge flow injection, periodic pressure minima and maxima can be observed at the cavity outlet with an amplitude of approximately 3,500 Pa. From the position of the pressure maxima it can be deduced that they are caused by the potential fields of the rotor blades. The cut plane through such a pressure maximum shows that an inflow of the main flow into the cavity takes place there due to the upstream effect of the rotor blade. Due to the conservation of mass, this inflowing gas must flow out of the cavity again at another point. The isolines of the radial velocity show that this occurs in the pressure minima. Overall, however, the mass flow entering and leaving the cavity without purge air injection is low enough that no jet-shaped vortices are formed. With purge air injection, the amplitude of the pressure minima and maxima increases to about 9,000 Pa. The potential field effect of the rotor blades is so strong that it prevents purge air from escaping the cavity directly upstream of the leading edge, as the cut plane clearly shows. However, in contrast to the case without purge flow injection, no fluid of the main flow penetrates deep into the cavity anymore. This can be seen in the radial velocity cut plane through the pressure maximum in Figure 9b, where only positive values inside the cavity are present. Due to the small dimensions of the cavity and the difficult accessibility, it was not possible to measure the gas ingress into the cavity directly with a probe. Instead, a method was chosen that can indirectly detect whether gas ingress occurs.
Figure 9.
Pressure distribution at the cavity outlet. (a) Baseline, 0% purge flow. (b) Baseline, 1.6% purge flow.

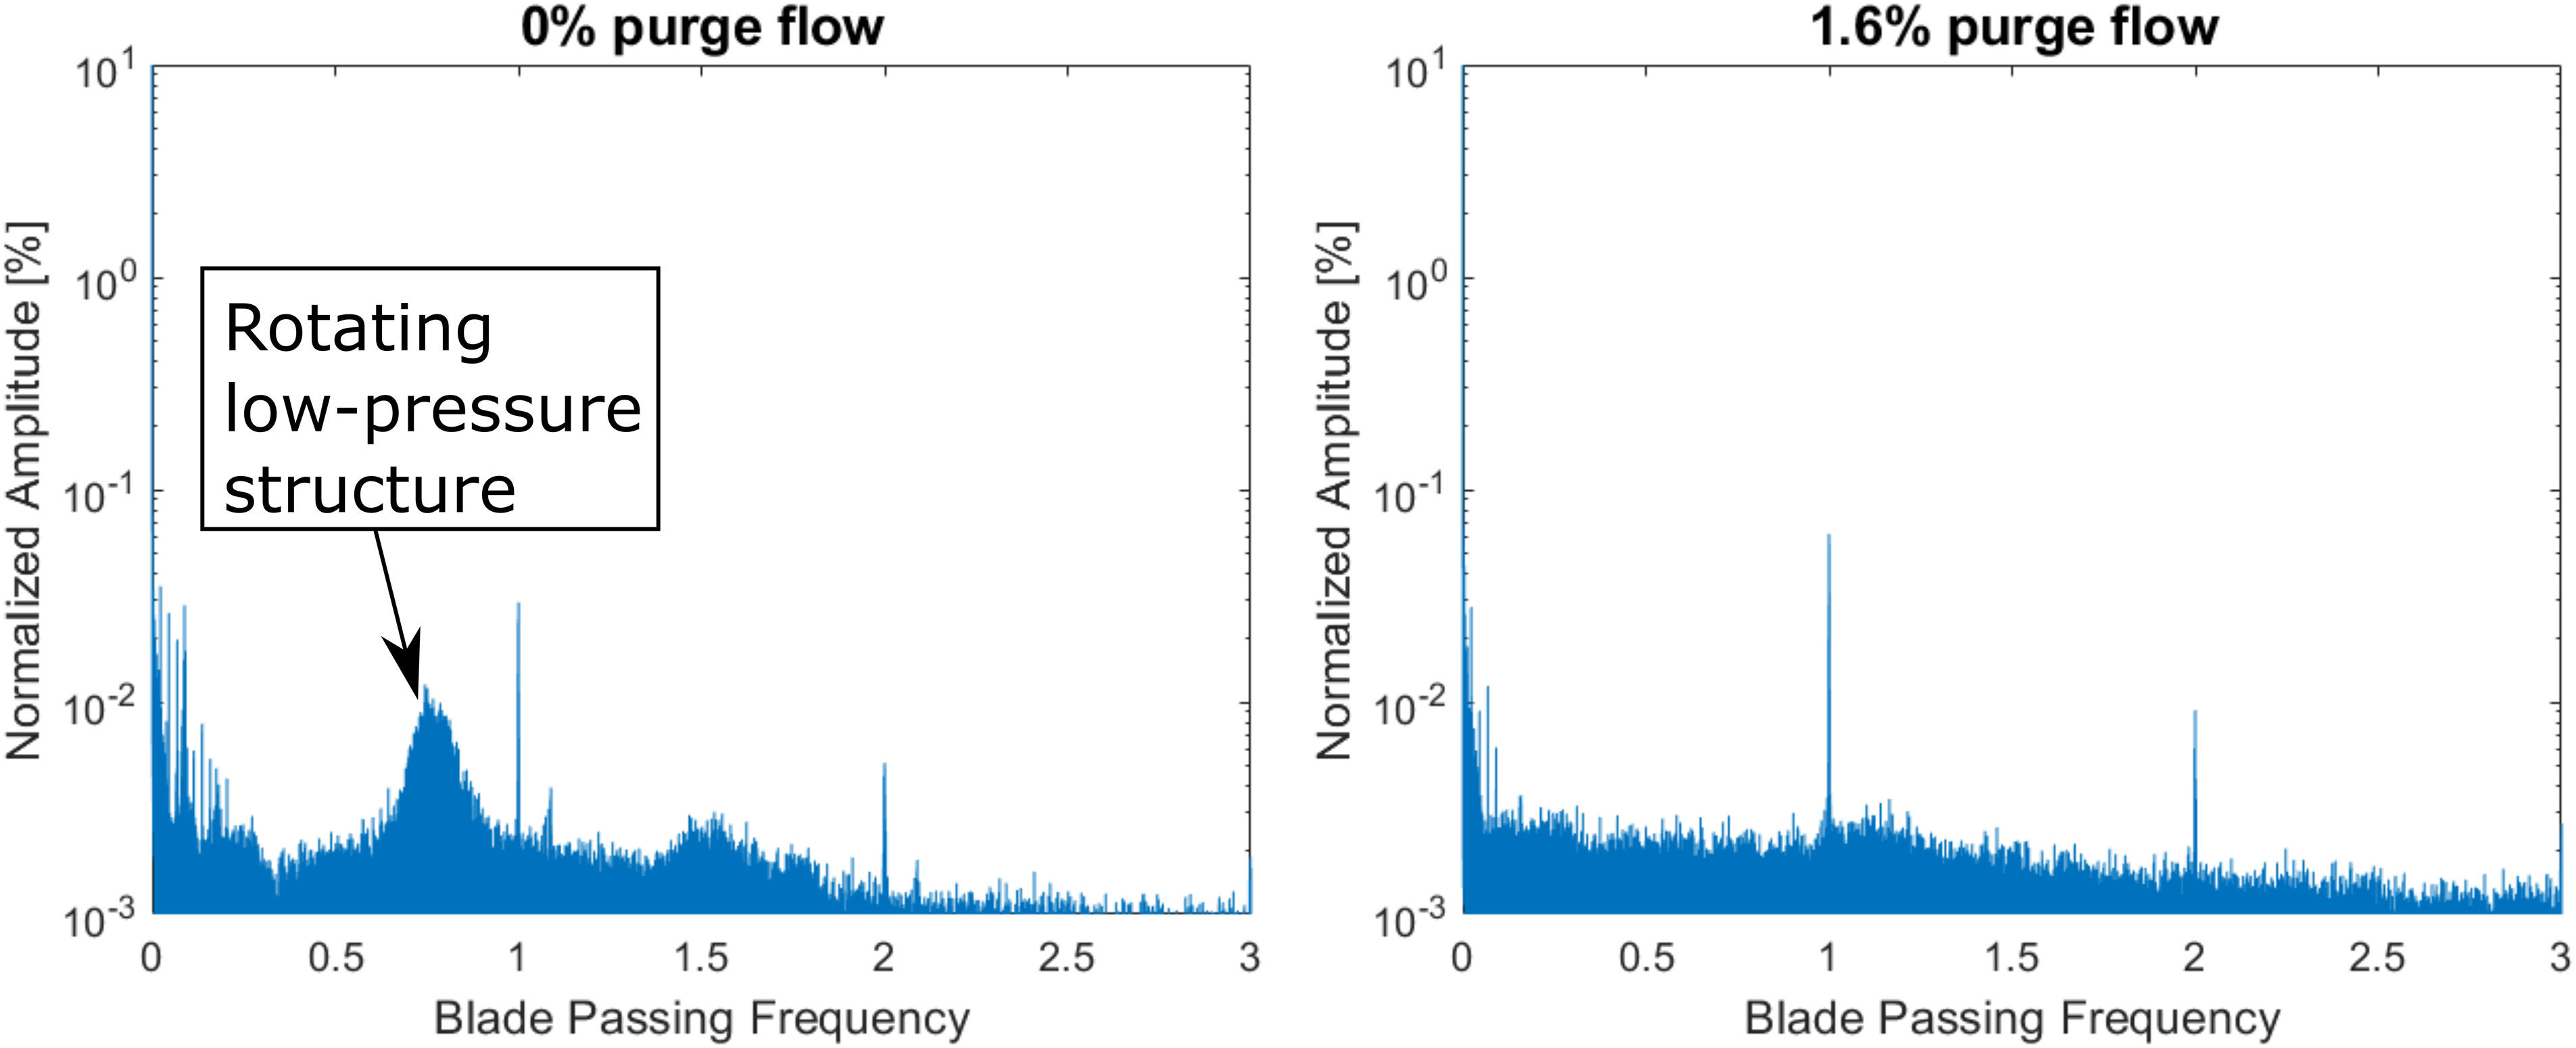
Multiple authors, such as Cao et al. (2004), Town et al. (2016) and Beard et al. (2016), have demonstrated experimentally that low-pressure flow structures rotating at approximately 80% of the rotation speed of the disk can be present inside the cavity when no purge flow is injected. Cao et al. (2004) and Horwood et al. (2018) showed that these rotating low-pressure structures are suppressed once the purge mass flow reaches a critical value. This leads to the conclusion that these rotating low-pressure structures inside the cavity can be associated with gas ingress into the cavity which is suppressed at a sufficiently large purge flow. The pressure fluctuations of these rotating low-pressure structures were measured with a transient pressure transducer, which was mounted inside the cavity (see Figure 2). The measurements of the transient pressure fluctuations inside the cavity were only performed for the baseline configuration, since no significant change to the F3D configuration was expected. Figure 10 shows the Fast Fourier Transform results of the recorded sensor voltages. Both plots show clearly defined sharp peaks at the blade passing frequency (BPF). The peaks of the second and third harmonics of the BPF are also visible. Without purge air injection, an additional peak is visible at 75% of the BPF in Figure 10a. This peak at 75% BPF agrees very well with the values reported in the literature. Figure 10b shows that this peak, which is associated with the rotating low-pressure structure inside the cavity, disappears when the purge flow is activated. Since the presence of such a rotating flow structure is always associated with gas ingress into the cavity, this indicates that no ingress into the cavity occurs in the case of purge flow injection, which agrees with the predictions made by the CFD in Figure 9.
Conclusions
This paper has presented the aerodynamic impact of purge flow injection on a turbine with end wall contouring and a bowed stator. Performance map measurements of the turbine rig showed that the F3D configuration loses parts of its efficiency gains when purge flow is injected. Transient numerical simulations were able to replicate all operating points within the measurement uncertainty. Flow measurements revealed the mechanism behind this partial reduction in efficiency. Near the hub and the casing, a reduction in the turbulent kinetic energy was achieved by the F3D configuration without purge flow injection. With purge flow injection, however, the turbulent kinetic energy near the hub reached levels comparable to those of the baseline configuration with purge flow injection. In the upper half of the channel, the F3D configuration reduced the turbulent fluctuations regardless of purge flow injection. Numerical simulations then demonstrated that this behaviour was reflected in the generation of entropy inside the rotor passage: under the influence of purge flow injection, the F3D configuration and the baseline configuration produced comparable amounts of entropy near the hub. This entropy generation was caused by the purge flow leaving the cavity in the form of jet-like vortices which formed due to the pressure field of the rotor blades. The numerical simulations also showed that this pressure field can lead to gas ingress into the cavity. This was experimentally verified by the measurements of an unsteady pressure transducer.
Since this project demonstrated that purge flow injection has to be accounted for during the optimization process, we are currently working on such an optimization in our follow-up project. In this project, a new rotor end wall contouring will be designed. To take unsteady effects into account, a frequency-domain based flow solver will be used.